

Abstract
Spatiotemporal relationships among contour segments can influence synchronization of neural responses in the primary visual cortex. We performed a systematic study to dissociate the impact of spatial and temporal factors in the signaling of contour integration via synchrony. In addition, we characterized the temporal evolution of this process to clarify potential underlying mechanisms. With a 10 × 10 microelectrode array, we recorded the simultaneous activity of multiple cells in the cat primary visual cortex while stimulating with drifting sine-wave gratings. We preserved temporal integrity and systematically degraded spatial integrity of the sine-wave gratings by adding spatial noise. Neural synchronization was analyzed in the time and frequency domains by conducting cross-correlation and coherence analyses. The general association between neural spike trains depends strongly on spatial integrity, with coherence in the gamma band (35–70 Hz) showing greater sensitivity to the change of spatial structure than other frequency bands. Analysis of the temporal dynamics of synchronization in both time and frequency domains suggests that spike timing synchronization is triggered nearly instantaneously by coherent structure in the stimuli, whereas frequency-specific oscillatory components develop more slowly, presumably through network interactions. Our results suggest that, whereas temporal integrity is required for the generation of synchrony, spatial integrity is critical in triggering subsequent gamma band synchronization.
Keywords: visual cortex, synchrony, coherence, spatial integrity, noise, gamma oscillation
Introduction
Although visual perception is generally thought to depend on changes in neuronal response rates (Barlow, 1972), cooperative neural firing may also serve as a coding mechanism that extends the information capacity of the visual system (Milner, 1974; von der Malsburg, 1981; Singer and Gray, 1995). Previous studies have focused either on tight (<10 ms) synchronization of spike timing or phase-locked oscillation at particular frequencies, primarily gamma (Eckhorn et al., 1988; Gray et al., 1989; Engel et al., 1991; Alonso et al., 1996; Dan et al., 1998; Usrey et al., 1998; Frien and Eckhorn, 2000; Fries et al., 2001; Samonds et al., 2004; Kohn and Smith, 2005; Samonds et al., 2006). Neural synchronization is stimulus-dependent (Eckhorn et al., 1988; Gray et al., 1989; Engel et al., 1991), and synchronization modulation by spatial or temporal stimulus changes suggests that neural cooperation might support visual binding (Gray et al., 1989; Engel et al., 1991; Castelo-Branco et al., 2000; Gail et al., 2000), although the generality of this proposal has been challenged by several negative results (Lamme and Spekreijse, 1998; Thiele and Stoner, 2003; Palanca and DeAngelis, 2005).
The functional significance and behavior of gamma-band oscillation also remains unclear, although it can be enhanced by coherent stimuli and destroyed by incoherent stimuli (Gray et al., 1989; Engel et al., 1991; Konig et al., 1995; Castelo-Branco et al., 2000; Gail et al., 2000). Oscillation is not necessary for generating synchrony, but synchrony is strengthened if oscillation exists (Samonds and Bonds, 2005).
Although spike timing synchronization and frequency coherence reflect neural cooperation from different perspectives, analyses in time and frequency domains are correlated (Zhou et al., 2007). We consider that synchrony is triggered by coherent spatiotemporal structure, such as contour continuity and common fate, which simultaneously activates populations of retinal cells (Samonds and Bonds, 2005). Synchronization between spike trains is then propagated through the visual pathway (Usrey and Reid, 1999). Neural synchronization may provide emergent information that is not carried by independent firing rates (Dan et al., 1998; Samonds et al., 2003, 2004, 2006; Kohn and Smith, 2005; Montani et al., 2007). Here, we try to disambiguate contributions of space and time to coherence by investigating how synchrony and oscillation depend on spatial integrity, i.e., contour continuity. We systematically deconstruct images of drifting sine-wave gratings by adding spatial noise while maintaining coherent motion of both noise and gratings. A 10 × 10 microelectrode array recorded from large numbers of isolated cells in areas 17 and 18 of three anesthetized and paralyzed cats. Cross-correlation and coherence analyses show that synchronization between neural responses in time and frequency domains modulated systematically with changes in spatial integrity. Coherence in the gamma frequency band is more sensitive to noise than either lower frequency bands or general spike synchrony. We also analyzed the temporal dynamics of synchronization in both the time and frequency domains. Our result suggests that spike timing synchronization is triggered nearly instantaneously by coherent stimulus structure, whereas the frequency-specific oscillatory components evolve more slowly, presumably through network interactions.
Materials and Methods
Physiological preparation.
Electrophysiological recordings were made in three adult (2.5–3.5 kg) cats. All experimental procedures were performed under the guidelines of the American Physiological Society and Vanderbilt University's Animal Care and Use Committee. Each cat initially received intramuscular injections of 2 mg of dexamethasone ∼20 h before surgery and 0.5 ml of acepromazine maleate and 0.5 ml of atropine sulfate ∼2 h before surgery. General anesthesia was induced by inhalation of 5% halothane in O2. One of the forelimb veins was cannulated for intravenous injection of 0.3 mg · kg−1 · h−1 propofol to maintain anesthesia. After a tracheal cannula was inserted, cats were mounted in a stereotaxic device. Paralysis was induced with 6 mg and maintained with 0.3 mg · kg−1 · h−1 pancuronium bromide through another cannulated forelimb vein. Cats were ventilated at the rate of 30 breaths per minute with a mixture of N2O:O2:CO2 (75:23.5:1.5), and the expired pCO2 was maintained at 3.9%. An 8 × 8 mm craniotomy was performed over the area centralis representation in area 17 (Horsley-Clark coordinates P4-L2). After the electrode array was inserted, the hole was covered with agar mixed in mammalian Ringer's solution.
During recording, we maintained cats' body temperature at 37.5°C with a servo-controlled heat pad. The brain activity and heart rate were monitored with electroencephalograms and electrocardiograms to ensure anesthetic stability. Phenylephrine hydrochloride (10%) was dropped into both eyes to retract the nictitating membranes, and the pupils were dilated with 1% atropine sulfate. The corneas were protected by adding contact lenses with 4 mm artificial pupils, and auxiliary lenses were applied to ensure the eyes were focused on the stimulus plane.
Stimulation.
The location of the receptive fields of individual cells was first mapped with rear-projected light bars, then the center and size of the aggregate area were determined so that multiple receptive fields could be simultaneously covered by the visual stimulus. A 21 inch gamma-corrected Sony (Tokyo, Japan) Trinitron monitor (mean luminance, 73 cd/m2) was positioned at a viewing distance of 57 cm to display visual stimuli. The monitor was set to a refresh rate of 120 Hz and each frame was presented twice.
Visual stimuli were generated with the Winvis for Matlab toolbox (Neurometrics Institute, Oakland, CA). We used drifting sine-wave gratings with or without perturbation of the spatial structure to test how visual neurons modulate their responses and synchronization in correspondence with these changes. The unperturbed gratings had fixed contrast (50%), spatial frequency (0.5 c/°), and temporal frequency (2 Hz), which drove nearly all of the cells in our sample. Several values of orientation and direction of drift were selected, with each providing simultaneous activation of large numbers of cells. We then added spatial noise to the original sine-wave gratings to perturb the contour continuity of the stimulus. The spatial noise was created by swapping randomly selected pairs of areas (3 × 3 pixels, 0.13 × 0.13 degrees2) in the original gratings (Fig. 1). The brightness of each substituted area was uniform and calculated as the average of the initial pixel values. Swapping areas in the original image, as opposed to insertion of random levels, avoids changes in the overall luminance distribution. Each swapped pair was tagged so that no further swapping would happen in these areas. We chose a fixed set of spatial noise levels (all three cats were tested with 10, 25, 40, and 55% spatial noise, and two cats were also tested with 100% spatial noise), defined by the total percentage of swapped areas within the original stimulus, to explore how cells modulated their responses to graded deconstruction of spatial integrity. The addition of noise modifies stimulus contrast. To examine the impact of altering stimulus contrast, we derived the stimulus power spectra by implementing two-dimensional Fourier transforms on stimuli with 0–55% spatial noise. Compared with the total energy summed in the stimulus power spectrum without spatial noise, the total energy in the power spectra with noise is only slightly reduced to 99.81, 99.65, 99.26, and 98.89% at 10, 25, 40, and 55% spatial noise levels, respectively. To obtain the equivalent amount of spectral energy loss from the baseline 50% contrast, the contrast of a comparison sine-wave image with no spatial noise should be set at 49.91, 49.82, 49.63, and 49.45%. Such a small contrast difference (<1%) cannot be reliably distinguished by independent neural responses because the contrast response gain function in cat visual neurons usually reaches a plateau at ∼50% contrast (Albrecht and Hamilton, 1982).
Figure 1.
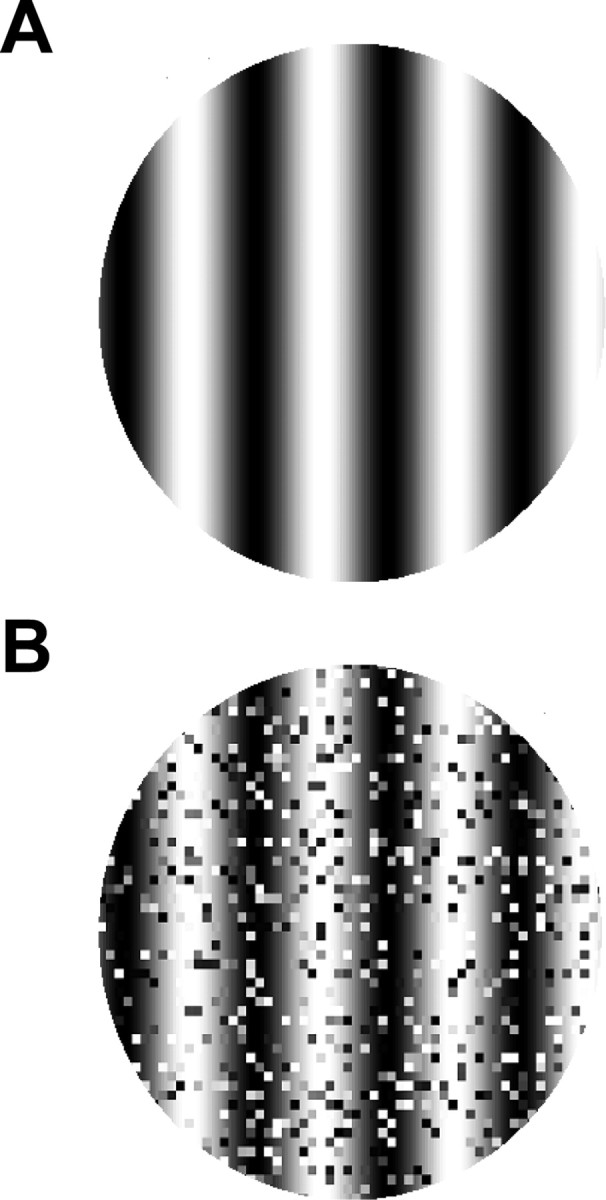
A, The unperturbed stimulus is a standard sine-wave grating with fixed contrast (50%), spatial frequency (0.5 c/°), and temporal frequency (2 Hz) drifting at varied orientations. B, The contour continuity of the stimulus is degraded by adding spatial noise at different levels (25% spatial noise here).
Because spatial reorganization of the stimulus might influence firing rate as well as synchrony attributable to changes in the nominal stimulus orientation, we carefully chose the size of the spatial noise elements (dimensions of the swapped areas) so that contour continuity could be perturbed without altering the orientation structure of the stimulus. To test whether our perturbation procedure has any impact on the effective orientation of the stimuli, we tested 34 cells with the original sine-wave gratings and the perturbed stimuli with 10–55% spatial noise displayed across a full range of orientations (15–360°) with a 15° increment. The orientation yielding the highest firing rate for the original gratings was defined as a cell's intrinsic orientation preference. When the gratings were perturbed by adding 10 or 55% of spatial noise in the image, six cells had peak orientations that deviated from their intrinsic orientation in either condition. When 25 or 40% of noise was added in the image, eight cells showed peak deviations of their tuning curves. However, all of the deviations were within a ±15° range. The scatter plots of preferred orientation vs half-height orientation tuning width at different spatial noise levels show that adding spatial noise does not change the population behavior of orientation tuning (Fig. 2).
Figure 2.

A–E, The scatter plots of preferred orientation versus half-height orientation tuning width for the original (A) and perturbed gratings (B–E) show that adding spatial noise does not change the population behavior of orientation tuning.
We tested the orientation preference of all cells with drifting sine-wave gratings displayed for 2 s and repeated 25 times. A one-second blank window was interleaved between stimulus presentations to avoid adaptation. After we obtained the orientation preferences for cells that showed vigorous responses (≥10 spikes/s), we combined the unperturbed and the perturbed gratings to create the basic stimulus set. Visual stimuli were displayed in random order in a circular aperture (diameter, 10–14°) and each presentation lasted 2 s. All stimuli were repeated for 100–360 trials to ensure reliability of the data. Because of experimental time limits, we only tested the stimuli at certain orientations (normally 8–12) that were able to drive a substantial portion of the cell population.
Recording.
Recordings were made with a Cyberkinetics (Foxborough, MA) 10 × 10 microelectrode array (4 × 4 mm), which was pneumatically inserted to a fixed depth (600 μm) in cat areas 17 and 18 based on Horsley-Clark coordinates. We processed the raw neural signals off-line with a spike sorting procedure to remove noise and artifact (Shoham et al., 2003). In this study, we only included channels that recorded single unit activity showing reliable orientation selectivity (i.e., firing rate at the preferred orientation was at least twice that at the worst orientation). Reliable measurement of synchrony and coherence requires a strong response rate, so we selected cells that have their preferred orientation equal or close to the orientation of the visual stimuli (difference between the preferred orientation of the cells and the orientation of the visual stimulus is equal to or <15°). Twenty, 24, and 23 cells from three cats were included in our final analysis. All cells we studied were classified as complex (Skottun et al., 1991).
Synchrony.
Spike timing synchronization between cells was determined from the cross-correlation histogram (CCH), which was derived from the joint peristimulus time histogram (JPSTH) (Aertsen et al., 1989). The two-dimensional JPSTH represents the joint spike count per unit time (here using a 1 ms bin width) between a pair of cells. To correct for changes in synchrony caused by the contribution from the joint elevation of the firing rates, the raw JPSTH is normalized by subtracting the cross-product of the peristimulus time histograms (PSTHs) and then dividing by the SD of the PSTH predictors. This normalization procedure is statistically equivalent to the method of the shift predictor (Perkel et al., 1967; Gerstein and Perkel, 1972; Aertsen et al., 1989), except that the method of JPSTH produces smoother results because the PSTHs are trial averaged results (Aertsen et al., 1989). The normalized CCH is produced by integrating along the principal diagonal of the normalized JPSTH. A pair of cells is considered to be firing synchronously if a discernible peak appears at ∼0 ms time lag in the CCH, and synchrony is considered significant if the peak value is at least twice the random fluctuations or noise in the CCH. The width (approximately 500 ms) of the temporal structure in the PSTH reflects the periodic luminance change in the stimuli (see Fig. 3I,J), which is much broader than the width (10 ms or less) of the central peak on CCH in our sampled pairs, indicating that synchrony does not result from covariations in response latency and/or excitability (Brody, 1999a,b).
Figure 3.
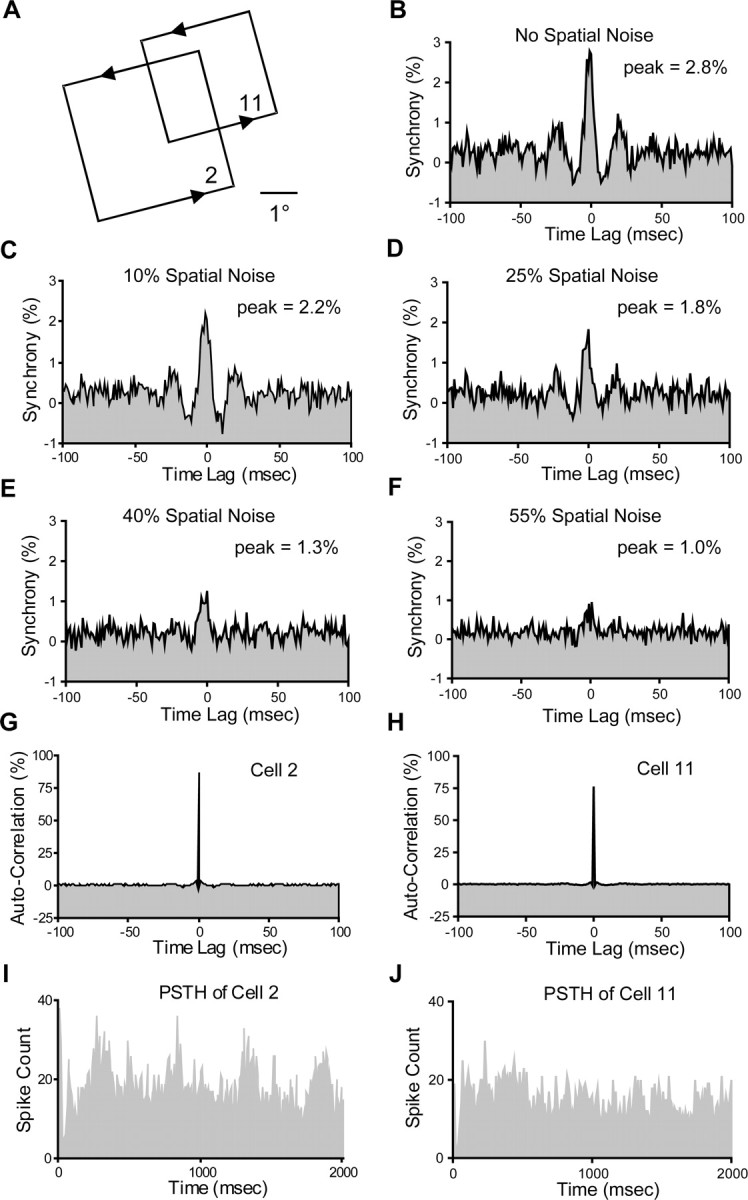
Example of synchrony modulation by the perturbation of spatial integrity in the stimuli. A, Cells 2 and 11 have the same orientation preference and partly overlapping receptive fields. B, The cross-correlation histogram shows strong synchrony from unperturbed sine-wave gratings. C–F, With spatial noise in the stimulus increased from 10 to 55%, the strength of the synchrony between these two cells is systematically reduced. G, H, Autocorrelograms of cells 2 and 11 responding to unperturbed gratings. I, J, PSTHs of cells 2 and 11 responding to unperturbed gratings.
Coherency/coherence analysis.
Similar to the cross-correlation analysis, coherency analysis also quantifies the synchronization between neural firing but in the frequency domain. Coherency measures the similarity of frequency and phase between neural spike trains instead of the timing dependence addressed by the cross-correlation analysis. We used the multitaper method to compute the coherency in our study. This calculates the averaged spectral estimates by applying several orthogonal windowing functions, in which windowing is referred as tapering to differentiate it from segmentation, while optimal tapering functions are normally derived from the Slepian sequence (Percival and Walden, 1993). The coherence estimate from the multitaper method has reduced bias and variance compared with that from the conventional spectral estimate (Percival and Walden, 1993; Mitra and Pesaran, 1999; Jarvis and Mitra, 2001). The mathematical procedure of multitaper coherency analysis is summarized as follows. The average power spectra (SXX and SYY) and cross spectrum (SXY) of two simultaneously recorded neural spike trains x and y are first computed by conducting Fourier transforms of the spike trains.
 |
 |
 |
 |
wn(k) in Equation 1 represents the kth Slepian tapering function, and Yk* in Equation 4 represents the complex conjugate of Yk. Coherency (γ) is then derived by the following equation:
 |
Because coherency is a complex quantity, the modulus of the coherency, known as coherence (C), is introduced to quantify the association between neural responses in the frequency domain.
We used the Chronux package 1.0 to calculate the coherence spectra of the synchronized cell pairs identified by the JPSTH. Neural spike trains were sampled at a rate of 250 Hz, and the coherence spectra were estimated for the frequency range from 2 to 100 Hz. We applied 5 orthogonal Slepian tapers in calculating the coherence. The Chronux package provides 95% confidence intervals for the coherence with the jackknife method and a theoretical 95% confidence limit for the coherence with multivariate statistics to determine whether the coherence reaches a significant level (Hannan, 1970; Jarvis and Mitra, 2001).
Temporal dynamics of synchrony and coherence.
Two-dimensional plots of CCHs and coherence in a 250 ms moving window were produced with 25 ms step resolution. The beginning of the first time window started 0 ms after stimulus onset. To ensure reliability of the estimation, we only analyzed the temporal dynamics of synchrony and coherence in the 74 pairs of cells that were tested with 360 stimulus trials. Prestimulus CCH and coherence were not included in the study because we could not obtain reliable estimates with low spontaneous spike rate (mean, 4.25 spikes/s). We consider synchrony and coherence to be stabilized when the values of synchrony and coherence first reached 90% of their maximum values along the time axis.
Results
We drifted sine-wave gratings with different levels of spatial noise at constant velocities to examine how the perturbation of spatial integrity influences the synchronized responses in visual neurons. The synchronization between neural firing was estimated with the cross-correlation and coherence analyses in the time and frequency domains, respectively. We identified a total of 152 pairs of cells exhibiting synchronized firing from recordings in areas 17 and 18 of three paralyzed and anesthetized adult cats. We only presented stimuli at selected orientations and analyzed cell pairs with both preferred orientations equal or close to the orientation of the stimulus (see Materials and Methods). Therefore, synchronized pairs are identified from 267 possible pairs instead of from all possible pairs (n = 719) of 67 cells. However, the percentage of synchrony (58.8% of pairs analyzed) in our result is consistent with that in our previous report (Samonds et al., 2006). We found that synchrony and coherence systematically dropped when the spatial integrity of the stimuli was deconstructed in stages. When coherence was examined, the gamma frequency band appears to be more sensitive to the perturbation of the spatial integrity than alpha and beta bands or general spike synchrony. By computing the synchrony and coherence with sliding time windows, we discovered that synchrony develops earlier than coherence, suggesting that spectrally organized cooperation is a network property.
Neural synchrony modulation
We first measured the correlation between neural responses in the time domain by inspecting the shape of the normalized CCHs derived through the JPSTH method (Aertsen et al., 1989). A narrow (<10 ms) and discernible peak at ∼0 ms time lag in the normalized CCH indicates that two neurons are firing synchronously, and the magnitude of the peak can be considered the maximum “effective connectivity,” measured as a percentage of all spikes, between the cells. Figure 3 shows how synchrony is dependent on the integrity of the spatial coherence of the visual stimulus. Cells 2 and 11 have the same orientation preference. When stimulated by intact sine-wave gratings, these two cells showed strong synchrony. Synchrony consistently decreased as the spatial integrity of the visual stimulation was systematically perturbed. The autocorrelograms for cells 2 and 11 do not show obvious temporal structure, indicating that the synchrony peak on the CCH reflects the “true” temporal interactions between neurons instead of a chance result from similar firing patterns in the neurons' response. We examined the population behavior by averaging the CCHs (Fig. 4) and the synchrony values (see Fig. 8A) for all cell pairs (n = 152) that we identified as having significant synchrony for unperturbed stimuli. The graded reduction of synchrony across the population suggests that the dependence of synchrony on the integrity of spatial structure is a general phenomenon in the primary visual cortex. We also found that most of synchronized pairs (57.9%) have CCH peaks located at 0 ms time lag and the average displacement of CCH peak is 1.9 ± 1.1 ms, suggesting common input as a potential source of synchrony. In the 74 cell pairs that we tested over 360 stimulus trials, we also computed the synchrony for the first 500 ms (early synchrony) and the synchrony for 500–2000 ms after stimulus onset (late synchrony) to examine whether the early and late synchrony might be controlled by different mechanisms (Fig. 5). One-way ANOVA testing (α = 0.025) shows that different spatial noise levels can only be discriminated by late synchrony (p = 0.0023), but not early synchrony (p = 0.2985), suggesting that early synchrony is mainly induced by the temporal properties of the stimulus (e.g., onset), whereas later synchrony can be influenced by the spatial structure of the stimulus.
Figure 4.

CCHs were averaged across all synchronized cell pairs for stimulus conditions with different noise levels. A, Averaged CCH for regular gratings. B–E, Averaged CCHs for perturbed gratings with noise level increased from 10 to 55%. The gray areas around the averaged CCHs (black curves) indicate SEM.
Figure 8.

A, Mean synchrony values for stimulus conditions with different noise levels. B, Mean normalized integrated coherence in the alpha (white bar), beta (striped bar), and gamma (gray bar) bands for stimulus conditions with different noise levels. C, Mean firing rate for stimulus conditions with different noise levels. D, The mean firing rate, synchrony, and normalized integrated gamma coherence were transformed to percentage values for direct comparison.
Figure 5.

Synchrony calculated with the first 500 and 500–2000 ms time windows after stimulus onset shows that spatial noise levels can be discriminated by the late synchrony, but not the early synchrony (one-way ANOVA test, α = 0.025). Error bars indicate SEM.
Coherence modulation
We also evaluated the synchronization between neural spike trains in the frequency domain by measuring the coherence modulation of synchronized cell pairs as spatial integrity was deconstructed. Coherence spectra were calculated with multitaper spectral estimation, which not only computes the coherence estimation with reduced bias, but also provides variance estimation (Percival and Walden, 1993; Jarvis and Mitra, 2001). Consistent with our findings in the time domain, the synchronized neural spike trains also displayed correlation in the frequency domain. This finding is not surprising because synchrony and coherence analyses are correlated, although they analyze the association between neural responses from different perspectives (Zhou et al., 2007). Figure 6 shows an example in which the coherence between two cells dropped with the deconstruction of spatial integrity in the stimulus. We observed that with unperturbed sine-wave gratings, the coherence spectrum showed two major peaks, one at ∼50 Hz and another at ∼10 Hz (Fig. 6A). As the spatial noise level in the stimulus increases (Fig. 6B–F), the spatial integrity systematically decreases although the overall motion of the stimulus remains constant. We found that the magnitude of the coherence, especially in the gamma frequency band, showed organized reduction. After the spatial integrity of the stimulus was totally destroyed by adding 100% spatial noise in the stimulus, only a small amount of coherence was preserved in the low-frequency band (<10 Hz) and the coherence in the gamma band totally disappeared. The mean coherence curves for each stimulus condition were generated by averaging the data from all synchronized pairs, in which a trial-shifted predictor was subtracted to remove the background coherence. The same modulation pattern that exhibited in the above example is also seen in the population-averaged coherence results. Coherence showed graded reduction as the spatial noise level in the stimulus systematically increased (Fig. 7).
Figure 6.

Example of coherence modulation by the perturbation of spatial structure in the stimuli. The black traces in the plots represent the coherence between cells, whereas the gray dotted curves above and below represent the 95% confidence intervals of the coherence derived from the jack-knifing method. The straight gray dotted line draws the theoretical 95% confidence limit for the coherence estimated via multivariate statistics. A, With regular drifting sine-wave gratings, the coherence spectrum exhibited prominent elevation at ∼10 and 50 Hz, respectively. B–E, The coherence between cells, especially in the gamma band, decreases with the percentage increase of the spatial noise level in the image. F, With 100% drifting spatial noise, the spatial structure of stimulus is destroyed, whereas the temporal coherence was maintained. Only a small amount of coherence was preserved in the low-frequency band (<10 Hz), whereas gamma coherence disappeared completely.
Figure 7.

Coherence averaged across the population. A, Mean coherence for regular gratings. B–E, Mean coherence for perturbed drifting gratings with noise levels increased from 10 to 55%. Gray areas around the mean coherence curves (black traces) indicate SEM.
Frien and Eckhorn (2000) reported that, in area V1 of macaque monkeys, the spectral coherence of multi-unit activity in the range of 35–50 Hz depended more strongly on stimulus orientation than that in the range of 0–12 Hz. Also in Macaque V1, Henrie and Shapley (2005) found that, whereas overall local field potential (LFP) power gradually increases with increased stimulus contrast, the gamma band increases differentially more than in other frequency bands. These results indicate that coherence modulation of different spectral components is influenced by different mechanisms, which suggests in turn that low- and high-frequency coherence performs distinct functions in the processing of visual information. To explore whether specific frequency bands are differentially sensitive to the deconstruction of spatial integrity, we separated trends in the alpha (5–15 Hz), beta (15–35 Hz), and gamma bands (35–70 Hz), respectively. We individually quantified the total coherence for different frequency bands (CCband) by integrating the area between the coherence curve [C(f)] and the estimated 95% confidence level (CI95) only at the frequencies where the phase value of coherence fell within a range defined by time offset of ±10 ms (Eq. 6). The integration limits are defined by the upper and lower frequency bounds for individual frequency bands:
 |
The relationship between phase (φ) and time (t) (Jarvis and Mitra, 2001) is defined as follows:
The reason that we specifically limit integration within this phase range is because information provided by cooperative neural firing appears to be contained mainly in a time window of <10 ms (Softky and Koch, 1993; Samonds et al., 2004). The integrated values for individual bands (alpha, beta, and gamma) are further normalized by dividing by the bandwidth of the frequency range so that the relative coherence modulation can be directly compared. Figure 8A–C shows the modulation of synchrony, normalized coherence in different frequency bands, and mean firing rate corresponding to different spatial noise levels. One-way ANOVA testing shows that synchrony, gamma coherence, and firing rate, but not alpha and beta coherence, can discriminate between different levels of spatial noise (Table 1). We transformed the means of firing rate, synchrony, and gamma-band coherence into percentage values so that the response modulation between different domains can be compared. For example, the mean firing rate under the stimulation of perturbed gratings with 10% spatial noise was transformed by dividing the mean firing rate under stimulation by regular gratings, and then multiplied by 100%. With this transformation, we found that firing rate, synchrony and gamma-band coherence reduced to 68.9, 63.1, and 32.4%, respectively, at 55% spatial noise level (Fig. 8D). The transformed mean firing rate, synchrony, and gamma coherence were individually fitted with linear regression lines. Comparing the slopes between different regression lines (Zar, 1999), we found that gamma coherence and synchrony dropped significantly faster than firing rate, and gamma coherence also reduced significantly faster than synchrony, indicating that gamma coherence is the most sensitive in detecting the change of spatial integrity among these three variables (Table 2). We found that coherence in the alpha and beta bands was well maintained at 81.4 and 86.4%, even when the spatial integrity was dramatically degraded with 55% spatial noise. We suspect that the coherence in these low-frequency bands is mainly supported by the temporal features, such as common fate, in the stimulus. However, we cannot verify this conjecture because we did not vary the temporal features of the stimuli used here.
Table 1.
Testing response difference between different spatial noise levels with one-way ANOVA (α = 0.025)
| p value | |
|---|---|
| Synchrony | 1.53E-009* |
| Alpha coherence | 0.33 |
| Beta coherence | 0.34 |
| Gamma coherence | 0* |
| Firing Rate | 3.86E-008* |
*Indicates a significant p value
Table 2.
Comparing slopes of linear regression lines with two-tailed t test (α = 0.025)
| p value | |
|---|---|
| Gamma coherence, firing rate | 0.0002* |
| Synchrony, firing rate | 0.0179* |
| Gamma coherence, synchrony | 0.0003* |
*Indicates a significant p value
In addition to modulation of synchrony and coherence by the increase of spatial noise in the stimulus, we also noticed a corresponding reduction of firing rate (Fig. 8C). Removing the contribution of firing rate covariation is necessary before evaluating cooperation between neurons. The JPSTH method removes the “chance correlation” by subtracting the cross-product of the peristimulus time histograms, which is statistically equivalent to shift predictor (Aertsen et al., 1989). Frequency domain estimators such as coherence analysis provide intrinsic normalized measurement of correlation between neural responses (Jarvis and Mitra, 2001). Therefore, although the mean firing rate decreased with the progressive reduction of the spatial coherence in the stimuli, the changes in synchronization between spike trains, either in the time or frequency domain, are not induced by the firing rate change.
Evolution of neural cooperation
Although there is correlation between JPSTH-derived synchrony and coherence, it is not clear whether these two quantities reflect the same underlying activity. This question can be addressed by observing how synchrony and coherence between neural responses develop over time. We calculated both synchrony and coherence within a 250 ms moving window with 25 ms step resolution throughout the two second duration of stimulation. Figure 9 shows an example from a cell pair of the two-dimensional plots for temporal evolution of coherence. Strong coherence in both the gamma band and lower frequency (<25 Hz) bands results from stimulation with pure sine-wave gratings and gratings with low distortion (10 or 25% spatial noise added). However, gamma coherence is either weak or absent with noisier gratings (40 or 55% spatial noise), although the low-frequency coherence is less affected. In the population-averaged two-dimensional coherence plot (Fig. 10B) for pure sine-wave grating stimuli, strong coherence also appears in the gamma band and the frequency bands lower than 25 Hz. We observed the evolution of coherence and synchrony by finding the maximum coherence in the high- (gamma) and low-frequency (5–35 Hz) bands and the maximum synchrony along the time axis in the two-dimensional coherence and synchrony plots. The averaged result shows that synchrony develops much earlier than high-frequency coherence. Synchrony reaches its highest magnitude within the second moving time window, which starts 25 ms after stimulus onset, and then gradually declines, stabilizing at ∼80% of its maximum level after 700 ms (Fig. 10A,C). Although all tested cell pairs that demonstrated gamma-band coherence surpassed the 95% confidence interval for gamma coherence within 300 ms, gamma coherence gradually grows to its highest value at ∼900 ms and then slightly decays (Fig. 10B,D). Across all synchronized pairs, the median time when synchrony reaches 90% of the highest magnitude is within a 250 ms window starting at 25 ms after stimulus onset while the median for that of high-frequency coherence is within a window starting at 575 ms. Synchrony therefore develops much more quickly than high-frequency coherence, and gamma coherence, though obvious early on, continues to develop over most of a second. This implies that if synchrony and/or gamma oscillation are involved in perception, they reflect processes with different time courses. Coherence in the low-frequency band (5–35 Hz) behaves in a complementary manner to that in gamma band. The highest level is reached at the onset of stimulation and decays thereafter (Fig. 10E). We consider that coherence in the low-frequency band (<25 Hz) is mainly induced by the stimulus onset, whereas gamma coherence develops through internal interaction within the neural network.
Figure 9.

Example of coherence evolution over time. A, Coherogram for stimulation with regular sine-wave gratings. B–E, Coherograms for stimulation with noise levels from 10 to 55%. F, Coherogram for the 100% noise level.
Figure 10.
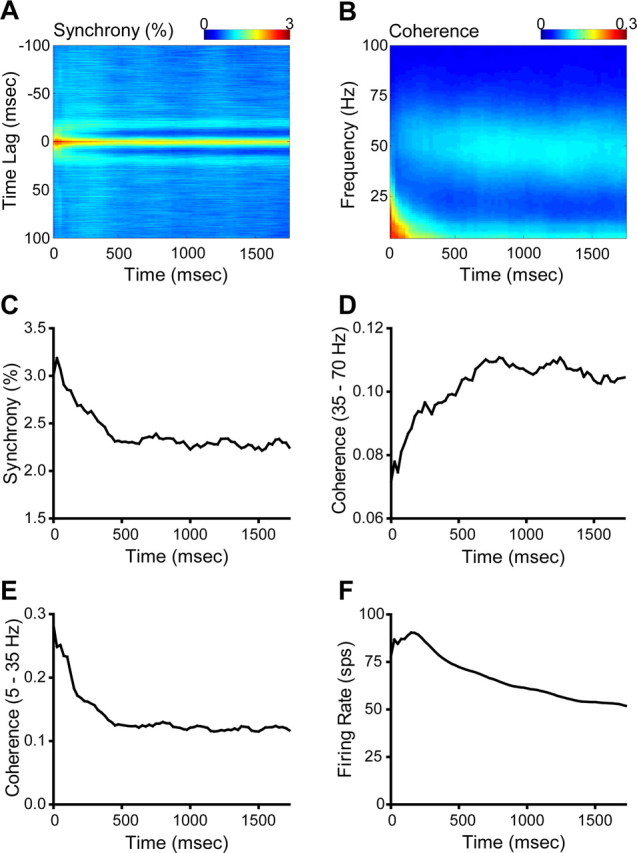
A, Population-averaged temporal dynamics of the CCH. B, Population-averaged temporal dynamics of coherence. C, Evolution of maximum synchrony versus time. D, Evolution of maximum gamma coherence versus time. E, Evolution of maximum coherence in the low-frequency band (5–35 Hz) versus time. F, Temporal dynamics of mean firing rate.
Discussion
Here, we demonstrate that the correlation between neural responses is influenced by the integrity of the spatial structure of the visual stimulus. Synchrony and coherence derived from JPSTH analysis and spectral estimation significantly and systematically declined when the contour continuity of gratings was deconstructed by increasing spatial noise in the image, indicating that synchronization in neural firing can detect modification of spatial features. We also found that coherence modulation in the gamma band showed a greater loss than in alpha and beta bands as the spatial coherence was reduced, suggesting that gamma oscillation is more sensitive than other frequency bands as an indicator of the change of spatial integrity in visual stimuli. Compared with the coherence change in the gamma band, which decreased by 67.6% with 55% spatial noise in the stimulus, the alpha and beta bands only reduced by 18.6% and 13.6% coherence with the same stimulus. We also found that alpha and beta coherence were well maintained even after the spatial structure in the image was largely destroyed. We thus consider that the lower frequency coherence is mainly induced by the basic temporal structure of the stimulus as opposed to its spatial representation.
Development of neural cooperation
The initiation and development of neural cooperation in the visual system remain largely unstudied. Samonds and Bonds (2005) discovered a strong inverse logarithmic relationship between synchrony and response-latency differences of cells, implying that two cells are more likely to synchronize their responses if their response latencies are nearly the same. Fries et al. (2001) found that with similar orientation preferences and overlapping receptive fields, the spontaneous response of cells in cat primary visual cortex tends to exhibited correlated fluctuations in response latency and that this correlation only occurred when LFPs oscillated in the gamma frequency range. This suggests that, during the perception of contours with spatially contiguous structure or similar orientations, the coherence of spontaneous excitability fluctuation in certain cells, which may originate from either the anatomical connections or short-term synaptic plasticity in the prestimulus stage, could result in faster binding after stimulus onset. In our analysis, we found that synchrony reached its maximum value within the first tens of milliseconds, also suggesting that cell pairs that are synchronized are synchronized by the time of their first spikes (Samonds and Bonds, 2005). Unlike spike synchronization in the time domain, the frequency domain association between cells develops much more slowly, achieving its highest strength after 0.5 s, although the frequency dependency between neurons is evident early after stimulus onset. In 96% of the cell pairs having coherence in the gamma band, detectability of the coherence reached 95% confidence limits within 250 ms after stimulus onset, but the average gamma coherence does not reach its maximum until ∼900 ms (Fig. 10D). This suggests that, although the overall magnitude of neural cooperation in the time and frequency domains are strongly correlated, they are governed by two different mechanisms. We believe that spike timing synchronization is initially triggered by coherent structure embedded in the visual stimulus, whereas the frequency-dependent component of cooperation is supported by network interactions. These mechanisms should not, however, be thought of as wholly independent. Synchrony is maintained with little attenuation throughout the stimulation period if oscillation is apparent, whereas synchrony decays significantly in the absence of oscillation (Samonds and Bonds, 2005). The demonstrated sensitivity of late synchrony to spatial structure may reflect its dependence on gamma oscillation, which is also dependent on spatial structure.
Although only a moderate correlation was found between synchrony and gamma oscillation, oscillatory coupling within the network may provide a framework that supports the organization of synchrony. An in vitro study of pyramidal neurons, which have both axons and dendrites extending through multiple layers, shows that back-propagation of the action potential produced in the axon facilitates the generation of calcium action potentials in the dendrite if it coincides with a distal dendritic input within a range of several milliseconds (Larkum et al., 1999). This suggests that pyramidal cells may act to associate the activities of multiple neurons from which the pyramidal cells receive synchronized inputs. The intrinsic oscillatory behavior in pyramidal cells may facilitate maintenance of this association. (Silva et al., 1991). It thus seems reasonable to conjecture that the pyramidal neurons play an important role in the development of neural cooperation. The pyramidal cell detects the coincident firing between neurons, which is initiated by the coherent structures in the visual stimulation, and fires action potentials to coordinate the firing timing of two correlated neurons. The intrinsic rhythmic firing frequency of pyramidal cells, however, promotes and maintains the synchronized oscillation within the correlated neural population.
Neural synchronization and perceptual grouping
Gestalt theory defines the basic framework for how our brain combines discrete elements to create a “whole” object, which is interpreted from the coherent spatial and temporal cues (Koffka, 1935). However, the biological mechanisms that support the representation and integration of those individually incomplete features through the visual pathway remain unclear. Although a number of studies provide evidence that supports the proposal of binding by correlated activities in the form of neural synchronization (Gray et al., 1989; Castelo-Branco et al., 2000; Gail et al., 2000), the role of neural synchronization remains controversial because of some negative findings (Lamme and Spekreijse, 1998; Thiele and Stoner, 2003; Palanca and DeAngelis, 2005). Here, we observe that gamma-band coherence in cat primary cortex has higher sensitivity than independent firing rate and spike synchrony to the systematic degradation of contour continuity of the stimulus. We also found that coherence modulation in the gamma frequency band, but not in the alpha or beta band, is capable of signaling the difference between stimulus patterns with different noise levels. This suggests that fast frequency association between neurons may be involved in pattern recognition and contour integration. Oscillation appears to arise from synchrony that is triggered by coherent spatiotemporal structures in the visual stimulus and the match of these structures with the receptive field properties of particular neurons (Ts'o et al., 1986; Gray and Singer, 1989; Castelo-Branco et al., 2000; Fries et al., 2001; Samonds et al., 2006). Gamma coherence may thus not play a role in perceptual tasks that do not involve these particular factors (e.g., binocular rivalry) (Gail et al., 2004).
Footnotes
This work was supported by National Eye Institute Grant RO1EY-014680-03. We thank Jason Samonds for assistance and helpful comments on this manuscript. We also thank Keith Purpura and Richard Shiavi for help on data analysis and the anonymous reviewers for their suggestions.
References
- Aertsen AM, Gerstein GL, Habib MK, Palm G. Dynamics of neuronal firing correlation: modulation of “effective connectivity.”. J Neurophysiol. 1989;61:900–917. doi: 10.1152/jn.1989.61.5.900. [DOI] [PubMed] [Google Scholar]
- Albrecht DG, Hamilton DB. Striate cortex of monkey and cat: contrast response function. J Neurophysiol. 1982;48:217–237. doi: 10.1152/jn.1982.48.1.217. [DOI] [PubMed] [Google Scholar]
- Alonso J-M, Usrey WM, Reid RC. Precisely correlated firing in cells of the lateral geniculate nucleus. Nature. 1996;383:815–819. doi: 10.1038/383815a0. [DOI] [PubMed] [Google Scholar]
- Barlow HB. Single units and sensation: a neuron doctrine for perceptual psychology? Perception. 1972;1:371–394. doi: 10.1068/p010371. [DOI] [PubMed] [Google Scholar]
- Brody CD. Disambiguating different covariation types. Neural Comput. 1999a;11:1527–1535. doi: 10.1162/089976699300016124. [DOI] [PubMed] [Google Scholar]
- Brody CD. Correlations without synchrony. Neural Comput. 1999b;11:1537–1551. doi: 10.1162/089976699300016133. [DOI] [PubMed] [Google Scholar]
- Castelo-Branco M, Goebel R, Neuenschwander S, Singer W. Neural synchrony correlates with surface segregation rules. Nature. 2000;405:685–689. doi: 10.1038/35015079. [DOI] [PubMed] [Google Scholar]
- Dan Y, Alonso JM, Usrey WM, Reid RC. Coding of visual information by precisely correlated spikes in the lateral geniculate nucleus. Nat Neurosci. 1998;1:501–507. doi: 10.1038/2217. [DOI] [PubMed] [Google Scholar]
- Eckhorn R, Bauer R, Jordan W, Brosch M, Kruse W, Munk M, Reitboeck HJ. Coherent oscillations: a mechanism of feature linking in the visual cortex? Biol Cybern V. 1988;60:121–130. doi: 10.1007/BF00202899. [DOI] [PubMed] [Google Scholar]
- Engel AK, Kreiter AK, Konig P, Singer W. Synchronization of oscillatory neuronal responses between striate and extrastriate visual cortical areas of the cat. Proc Natl Acad Sci USA. 1991;88:6048–6052. doi: 10.1073/pnas.88.14.6048. [DOI] [PMC free article] [PubMed] [Google Scholar]
- Frien A, Eckhorn R. Functional coupling shows stronger stimulus dependency for fast oscillations than for low-frequency components in striate cortex of awake monkey. Eur J Neurosci. 2000;12:1466–1478. doi: 10.1046/j.1460-9568.2000.00026.x. [DOI] [PubMed] [Google Scholar]
- Fries P, Neuenschwander S, Engel AK, Goebel R, Singer W. Rapid feature selective neuronal synchronization through correlated latency shifting. Nat Neurosci. 2001;4:194–200. doi: 10.1038/84032. [DOI] [PubMed] [Google Scholar]
- Gail A, Brinksmeyer HJ, Eckhorn R. Contour decouples gamma activity across texture representation in monkey striate cortex. Cereb Cortex. 2000;10:840–850. doi: 10.1093/cercor/10.9.840. [DOI] [PubMed] [Google Scholar]
- Gail A, Brinksmeyer HJ, Eckhorn R. Perception-related modulations of local field potential power and coherence in primary visual cortex of awake monkey during binocular rivalry. Cereb Cortex. 2004;14:300–313. doi: 10.1093/cercor/bhg129. [DOI] [PubMed] [Google Scholar]
- Gerstein GL, Perkel DH. Mutual temporal relationships among neuronal spike trains. Biophys J. 1972;12:453–473. doi: 10.1016/S0006-3495(72)86097-1. [DOI] [PMC free article] [PubMed] [Google Scholar]
- Gray CM, Singer W. Stimulus-specific neuronal oscillations in orientation columns of cat visual cortex. Proc Natl Acad Sci USA. 1989;86:1698–1702. doi: 10.1073/pnas.86.5.1698. [DOI] [PMC free article] [PubMed] [Google Scholar]
- Gray CM, Konig P, Engel AK, Singer W. Oscillatory responses in cat visual cortex exhibit inter-columnar synchronization which reflects global stimulus properties. Nature. 1989;338:334–337. doi: 10.1038/338334a0. [DOI] [PubMed] [Google Scholar]
- Hannan EJ. New York: Wiley; 1970. Multiple time series. [Google Scholar]
- Henrie JA, Shapley R. LFP power spectra in V1 cortex: the graded effect of stimulus contrast. J Neurophysiol. 2005;94:479–490. doi: 10.1152/jn.00919.2004. [DOI] [PubMed] [Google Scholar]
- Jarvis MR, Mitra PP. Sampling properties of the spectrum and coherency of sequences of action potentials. Neural Comput. 2001;13:717–749. doi: 10.1162/089976601300014312. [DOI] [PubMed] [Google Scholar]
- Koffka K. New York: Harcourt; 1935. Principles of Gestalt psychology. [Google Scholar]
- Kohn A, Smith MA. Stimulus dependence of neuronal correlation in primary visual cortex of the macaque. J Neurosci. 2005;25:3661–3673. doi: 10.1523/JNEUROSCI.5106-04.2005. [DOI] [PMC free article] [PubMed] [Google Scholar]
- Konig P, Engel AK, Singer W. Relation between oscillatory activity and long-range synchronization in cat visual cortex. Proc Natl Acad Sci USA. 1995;92:290–294. doi: 10.1073/pnas.92.1.290. [DOI] [PMC free article] [PubMed] [Google Scholar]
- Lamme VA, Spekreijse H. Neuronal synchrony does not represent texture segregation. Nature. 1998;396:362–366. doi: 10.1038/24608. [DOI] [PubMed] [Google Scholar]
- Larkum ME, Zhu JJ, Sakmann B. A new cellular mechanism for coupling inputs arriving at different cortical layers. Nature. 1999;398:338–341. doi: 10.1038/18686. [DOI] [PubMed] [Google Scholar]
- Milner PM. A model for visual shape recognition. Psychol Rev. 1974;81:521–535. doi: 10.1037/h0037149. [DOI] [PubMed] [Google Scholar]
- Mitra PP, Pesaran B. Analysis of dynamic brain imaging data. Biophys J. 1999;76:691–708. doi: 10.1016/S0006-3495(99)77236-X. [DOI] [PMC free article] [PubMed] [Google Scholar]
- Palanca BJ, DeAngelis GC. Does neuronal synchrony underlie visual feature grouping? Neuron. 2005;46:333–346. doi: 10.1016/j.neuron.2005.03.002. [DOI] [PubMed] [Google Scholar]
- Percival DB, Walden AT. Cambridge, UK: Cambridge UP; 1993. Spectral analysis for physical applications, multitaper and conventional univariate techniques. [Google Scholar]
- Perkel DH, Gerstein GL, Moore GP. Neuronal spike trains and stochastic point processes. II. Simultaneous spike trains. Biophys J. 1967;7:419–440. doi: 10.1016/S0006-3495(67)86597-4. [DOI] [PMC free article] [PubMed] [Google Scholar]
- Samonds JM, Bonds AB. Gamma oscillation maintains stimulus structure-dependent synchronization in cat visual cortex. J Neurophysiol. 2005;93:223–236. doi: 10.1152/jn.00548.2004. [DOI] [PubMed] [Google Scholar]
- Samonds JM, Allison JD, Brown HA, Bonds AB. Cooperative synchronized assemblies enhance orientation discrimination. Proc Natl Acad Sci USA. 2004;101:6722–6727. doi: 10.1073/pnas.0401661101. [DOI] [PMC free article] [PubMed] [Google Scholar]
- Samonds JM, Zhou Z, Bernard MR, Bonds AB. Synchronous activity in cat visual cortex encodes collinear and cocircular contours. J Neurophysiol. 2006;95:2602–2616. doi: 10.1152/jn.01070.2005. [DOI] [PubMed] [Google Scholar]
- Shoham S, Fellows MR, Normann RA. Robust, automatic spike sorting using mixtures of multivariate t-distributions. J Neurosci Methods. 2003;127:111–122. doi: 10.1016/s0165-0270(03)00120-1. [DOI] [PubMed] [Google Scholar]
- Silva LR, Amitai Y, Connors BW. Intrinsic oscillations of neocortex generated by layer 5 pyramidal neurons. Science. 1991;251:432–435. doi: 10.1126/science.1824881. [DOI] [PubMed] [Google Scholar]
- Singer W, Gray CM. Visual feature integration and the temporal correlation hypothesis. Annu Rev Neurosci. 1995;18:555–586. doi: 10.1146/annurev.ne.18.030195.003011. [DOI] [PubMed] [Google Scholar]
- Skottun BC, De Valois RL, Grosof DH, Movshon JA, Albrecht DG, Bonds AB. Classifying simple and complex cells on the basis of response modulation. Vision Res. 1991;31:1079–1086. doi: 10.1016/0042-6989(91)90033-2. [DOI] [PubMed] [Google Scholar]
- Softky WR, Koch C. The highly irregular firing of cortical cells is inconsistent with temporal integration of random EPSPs. J Neurosci. 1993;13:334–350. doi: 10.1523/JNEUROSCI.13-01-00334.1993. [DOI] [PMC free article] [PubMed] [Google Scholar]
- Thiele A, Stoner G. Neuronal synchrony does not correlate with motion coherence in cortical area MT. Nature. 2003;421:366–370. doi: 10.1038/nature01285. [DOI] [PubMed] [Google Scholar]
- Ts'o DY, Gilbert CD, Wiesel TN. Relationships between horizontal interactions and functional architecture in cat striate cortex as revealed by cross-correlation analysis. J Neurosci. 1986;6:1160–1170. doi: 10.1523/JNEUROSCI.06-04-01160.1986. [DOI] [PMC free article] [PubMed] [Google Scholar]
- Usrey WM, Reid RC. Synchronous activity in the visual system. Annu Rev Physiol. 1999;61:435–456. doi: 10.1146/annurev.physiol.61.1.435. [DOI] [PubMed] [Google Scholar]
- Usrey WM, Reppas JB, Reid RC. Paired-spike interactions and synaptic efficacy of retinal inputs to the thalamus. Nature. 1998;395:384–387. doi: 10.1038/26487. [DOI] [PubMed] [Google Scholar]
- von der Malsburg C. Technical Report 81-2. Goettingen, Germany: Max-Planck-Institute for Biophysical Chemistry; 1981. The correlation theory of brain function. [Google Scholar]
- Zar JH. Ed 4. Upper Saddle River, NJ: Prentice Hall; 1999. Biostatistical analysis. [Google Scholar]
- Zhou Z, Bernard MR, Bonds AB. Temporal and frequency analysis of synchronized neural responses in cat visual cortex. Paper presented at the Vision Science Society Annual Conference; Sarasota, FL. 2007. [Google Scholar]