Abstract
Glutathione is an essential reductant which protects cells and is reduced in neurodegenerative disorders such as Parkinson's and Alzheimer's diseases. Neurons rely mainly on extracellular cysteine for glutathione synthesis and a cysteine transporter termed excitatory amino acid carrier 1 (EAAC1). However, the mechanisms underlying neuronal cysteine uptake have remained elusive. Herein, we show glutamate transport-associated protein for EAAC1 (GTRAP3-18) to interact with EAAC1 at the plasma membrane and thereby regulate neuronal glutathione levels. Glutathione increased in the mouse brain as well as in primary cultured neurons, when the GTRAP3-18 protein level was decreased by genetic manipulations, whereas glutathione decreased when GTRAP3-18 was increased. Furthermore, glutathione contents that had been increased, by a translocator and activator of EAAC1, were suppressed by increased cell surface GTRAP3-18 protein. Our results demonstrate GTRAP3-18 to dominantly and negatively determine the intracellular glutathione contents in neurons.
Keywords: glutathione, oxidative stress, neuroprotection, neuron, transporter, neurodegeneration
Introduction
Glutathione (GSH) plays a critical role in protecting cells from various oxidative stresses. GSH in the brain declines with aging (Maher, 2005) and GSH depletion enhances oxidative stress in the brain (Schulz et al., 2000; Bharath et al., 2002). Oxidative stress plays an important role in neurodegenerative processes (Halliwell, 1992). Indeed, GSH contents in discrete brain areas are reduced in patients with neurodegenerative disorders such as Parkinson's and Alzheimer's diseases (Dringen and Hirrlinger, 2003).
GSH is synthesized from glutamate, cysteine, and glycine. As for intracellular cysteine availability for GSH synthesis, two different mechanisms exist; one is uptake of cystine, which is then converted to cysteine (Cho and Bannai, 1990; Murphy et al., 1990), and the other involves direct uptake of cysteine (Sagara et al., 1993; Dringen, 2000). For GSH synthesis, mature neurons use only cysteine, i.e., not cystine (Sagara et al., 1993; Kranich et al., 1996), and cysteine is the rate-limiting factor (Dringen et al., 1999). Extracellular supplies of other amino acids, glutamate and glycine, do not increase GSH synthesis (Almeida et al., 1998; Dringen et al., 1999), because steady state intracellular concentrations are sufficient (Dringen, 2000). Therefore, the availability of cysteine is critically important for neuronal GSH synthesis.
Cell culture studies suggest excitatory amino acid carrier 1 (EAAC1) to be a neuronal cysteine transporter (Shanker et al., 2001; Chen and Swanson, 2003; Himi et al., 2003). Moreover, EAAC1 is an essential transporter of cysteine needed for GSH synthesis (Aoyama et al., 2006), as evidenced by EAAC1 gene-deficient mice displaying both a low level of neuronal GSH and vulnerability to oxidative stresses. EAAC1 is a member of the family of sodium-dependent excitatory amino acid transporters (EAATs). EAAC1 is widely expressed in neurons in the mature brain (Rothstein et al., 1994), but its contribution to glutamate reuptake from the synaptic cleft is so minuscule (Danbolt, 2001) that its major function is probably cysteine rather than glutamate transport. The structural requirements of EAAC1 for glutamate and cysteine transport appear to be different, because point mutations in the EAAC1 primary structure result in clear dissociation of the transport capability for each amino acid (Bendahan et al., 2000). Glutamate transport associated protein for EAAC1 (GTRAP3-18) is a membrane-associated protein that interacts with EAAC1 (Lin et al., 2001) and negatively modulates EAAC1-mediated glutamate reuptake in vitro as well as in vivo (Lin et al., 2001; Butchbach et al., 2003). However, because differential structural conformation of EAAC1 is required for cysteine and glutamate transport, it remains to be established whether GTRAP3-18 is capable of regulating cysteine uptake and the intracellular GSH contents of neurons. In our recent studies using human embryonic kidney 293 (HEK293) cells, which express only EAAC1 among the EAATs (Lin et al., 2001) and have little ability to take up cystine (Shih and Murphy, 2001), we found GTRAP3-18 to dominantly and negatively determine intracellular GSH contents (Watabe et al., 2007). Herein, we report GTRAP3-18 to dominantly and negatively determine the intracellular GSH contents of neurons in vivo as well as in vitro.
Materials and Methods
Materials.
l-Aspartate-β-hydroxamate (LAβH), methyl-β-cyclodextrin (MeβCD), phorbol-12-myristate-13-acetate (PMA), 4α-PMA, quisqualate, and anti-actin antibody were purchased from Sigma-Aldrich. dl-Threo-β-benzyloxyaspartate (TBOA) and dihydrokainate (DHK) were obtained from Tocris Bioscience, Fluoro-Jade B from Millipore, anti-pan cadherin antibody from Abcam, anti-EAAC1 antibody from Alpha Diagnostic International, and anti-GTRAP3-18 antibody from Trans Genic.
Cultures of cerebellar granule neurons.
Cultures of cerebellar granule neurons (CGNs) were prepared (Giordano et al., 2006) from 7-d-old rats killed by decapitation. Cerebella were rapidly dissected from the brain, meninges were removed, and tissue was cut into 2 mm cubes. The tissue pieces were incubated with DNase and trypsin, before being mechanically dissociated by titration using a long-stem Pasteur pipette. After dissociation, the cell suspension was centrifuged in a refrigerated centrifuge at 300 × g for 5 min. The cell pellet was resuspended in complete growth medium consisting of Neurobasal A medium containing 0.5 mm l-glutamine, 100 U/ml penicillin, 100 mg/ml streptomycin, and B27 supplement. A portion of the resuspended cells was added to the same volume of 0.04% trypan blue solution in PBS and the percentage of viable cells was determined. The cells were seeded at a density of 3 × 10⁵ cells/cm2 at 37°C under 5% CO2 in air. After 24 h, the medium was removed and substituted with fresh prewarmed complete growth medium.
Transfection of GTRAP3-18 antisense oligonucleotides.
CGNs had been cotransfected with oligonucleotides and pGFP or pDsRed using NeuroFect (Genlantis) as described previously (Watabe et al., 2004). We used GTRAP3-18 sense or antisense oligonucleotides (Invitrogen) of the same areas in the rat, as described previously (Lin et al., 2001). We considered green fluorescent protein (GFP)- or DsRed-positive cells to be oligonucleotide-transfected cells.
Detection of GSH using ThioGlo-1.
The GSH concentration in CGNs was determined using ThioGlo-1 (Calbiochem), a maleimide reagent that produces a highly fluorescent adduct after reaction with thiol groups. The GSH content was estimated from the fluorescence response via the interaction of ThioGlo-1 mainly with intracellular GSH in intact cells as previously reported (Kagan et al., 2001). Cells were incubated at 37°C for 30 min with 10 μm ThioGlo-1. After washing with PBS to remove excess nonreacted ThioGlo-1, the level of fluorescence was measured using a Multimode Detector DTX800 (Beckman Coulter).
GSH quantitation and visualization.
GSH activity was measured by the NADPH-dependent GSH reductase method as reported previously (Baker et al., 1990). Brain samples were homogenized with ice-cold 5% sulfosalicylic acid to precipitate cellular macromolecules and extract GSH from both cells and tissues. After centrifugation at 1200 × g for 15 min, the supernatant solution was used for the measurement. The brain solution was diluted with PBS containing 1 mm EDTA and the pH was adjusted to 7.0. Reaction mixture containing 1 mm EDTA, 0.3 mm DTNB [5,5′-dithio-bis-(2-nitrobenzoic acid)], 0.4 mm NADPH, and 2 IU/ml GSH reductase was added to the same volumes of diluted brain and GSH standard solutions. Total absorbance at 405 nm was measured and calibrated to GSH standards. For visualization of GSH, the fluorescent dye 5-chloromethylfluorescein diacetate (CMFDA) was used.
Immunoblot analysis.
Immunoblotting was performed as described previously (Watabe et al., 1996). Cells were lysed in radioimmunoprecipitation assay buffer (50 mm Tris-HCl pH 7.4, 150 mm NaCl, 1% NP-40, 0.25% sodium deoxycholate, 1 mm EDTA) containing a protease inhibitor mixture (Sigma-Aldrich). SDS, dithiothreitol, and mercaptoethanol were added to the cell lysate, followed by boiling. Denatured proteins were separated on polyacrylamide gel and transferred to a polyvinylidene difluoride membrane (GE Healthcare). The membrane was incubated with a blocking solution (2% bovine serum albumin dissolved in PBS containing 0.2% Tween 20) for 1 h at room temperature and incubated with a first antibody dissolved in blocking solution overnight at 4°C. After washing, the membrane was incubated for 1 h with horseradish-linked secondary antibody. Immunoreactive proteins were detected with an enhanced chemiluminescence system (GE Healthcare). Band intensities were measured using Scion Image release Beta 4.0.3.
Immunocytochemistry.
As described previously (Watabe et al., 2000), cells were washed with PBS and fixed with 3.7% formaldehyde for 20 min. Cells were permeabilized with PBS containing 0.2% Triton X-100 for 5 min and then washed three times with PBS. Incubation with primary antibody was performed for 1 h at room temperature. Excess antibody was washed out three times with PBS. This was followed by incubation with an appropriate fluorophore-labeled secondary antibody for 1 h at room temperature in an area shielded from light. After washing out the excess antibody three times with PBS, coverslips were mounted using a ProLong Antifade Kit (Invitrogen). Fluorescent images were obtained using a Zeiss fluorescence microscope and Axio Vision software and a Bio-Rad inverted laser-scanning fluorescent microscope and Laser Sharp 2000 software.
Immunohistochemistry.
Coronal 50 μm sections were cut and placed in PBS containing 2% goat serum/0.2% Triton X-100/0.1% bovine serum albumin for 30 min at room temperature. After washing with PBS, the slices were incubated overnight at 4°C with primary antibody. After washing with PBS, the slices were incubated for 2 h with an appropriate fluorophore-labeled secondary antibody. Propidium iodide was used for counterstaining and Fluoro-Jade B was used for toxicity assessment (Schmued et al., 1997; Schmued and Hopkins, 2000). The section was mounted using a ProLong Antifade Kit (Invitrogen) and photographed with a Bio-Rad inverted laser-scanning fluorescent microscope using Laser Sharp 2000 software. Emission signals were acquired with filters for green (FITC, 488 nm).
Synthesis of small interfering RNAs.
Chemically synthesized small interfering RNAs (siRNAs) were obtained from Sigma-Aldrich. The siRNA sequences were as follows: GTRAP3-18, 5′-GCCAUCUUAUCGUAGGGAAGA-3′; and EAAC1, 5′-CCUGCUAAUUCCCGAAGAUGG-3′. A nonsilencing RNA duplex was used as a control (Kim et al., 2005).
Intracerebroventricular drug infusion.
The coordinates used in these experiments were 0.3 mm caudal to the bregma, 1.2 mm from the midline, and 2.5 mm below the dura in adult male (8 weeks) C57BL/6J mice. The mice were implanted with microosmotic pumps (Durect; 0.5 μl/h) filled with MeβCD (40 or 250 mg/ml), artificial CSF (aCSF) containing (in mm) 130 NaCl, 3.5 KCl, 1.25 NaH2PO4, 2 MgSO4, 2 CaCl2, 20 NaHCO3, and 10 glucose at pH 7.4, or siRNAs (20 mg/ml). All mice were kept in a temperature-controlled room at 23°C under a 12 h light/dark cycle with food and water available ad libitum. The protocols were approved by the Animal Experimentation Committee of Teikyo University School of Medicine.
Cell surface biotinylation.
Labeling of proteins on the plasma membrane was performed by cell surface biotinylation using a Pinpoint Cell Surface Protein Isolation Kit (Pierce) in accordance with the manufacturer's instructions (Watabe et al., 2007).
Statistical analysis.
Statistical significance was determined using either Student's t test for two group comparisons or ANOVA with the Mann–Whitney U test for multiple group comparisons. A p value of <0.05 was considered significant.
Results
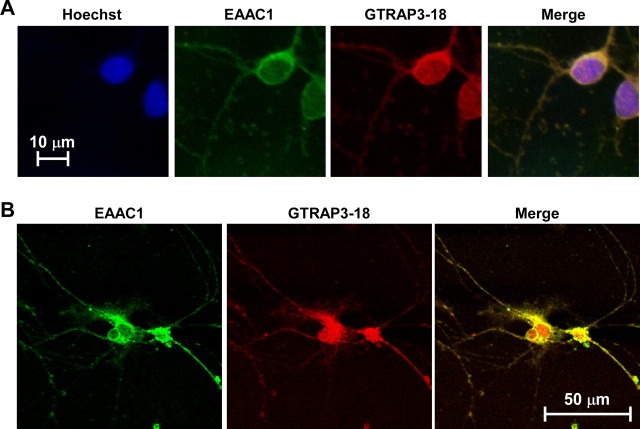
To explore the regulatory mechanisms underlying EAAC1 effects on GSH contents, we used a primary neuronal culture system as an in vitro model system. We first ascertained whether both EAAC1 and GTRAP3-18 are expressed in rat primary cultured CGNs using specific antibodies. Immunocytochemical analysis of CGNs revealed GTRAP3-18 to be present both at the plasma membrane and in the intracellular compartment (Fig. 1A), and to be colocalized with EAAC1 (Fig. 1B). We examined whether the GSH content is regulated by EAAC1 activity in CGNs using EAAT inhibitors and ThioGlo-1 as a fluorescent reagent for GSH detection. The nonspecific EAAT inhibitor TBOA dose-dependently decreased intracellular GSH contents (Fig. 2A). The GLT-1 specific inhibitor DHK failed to decrease intracellular GSH contents at a concentration sufficient to inhibit GLT-1-mediated glutamate uptake (Fig. 2B). LAβH, which inhibits both GLT-1 and EAAC1, decreased intracellular GSH contents (Fig. 2C). GSH synthesis is known to occur via the oxidized form of cysteine, cystine, in glial cells. However, the cystine transporter inhibitor quisqualate failed to decrease intracellular GSH contents (Fig. 2D). Therefore, these results indicate EAAC1 to mediate GSH synthesis in CGNs.
Figure 1.
Colocalization of EAAC1 and GTRAP3-18 in CGNs. A, Intracellular localizations of EAAC1 (green), GTRAP3-18 (red), and nuclei (blue) of CGNs were examined using a fluorescence microscope. B, Colocalization of EAAC1 (green) and GTRAP3-18 (red) in CGNs was examined using a laser-scanning fluorescence microscope.
Figure 2.
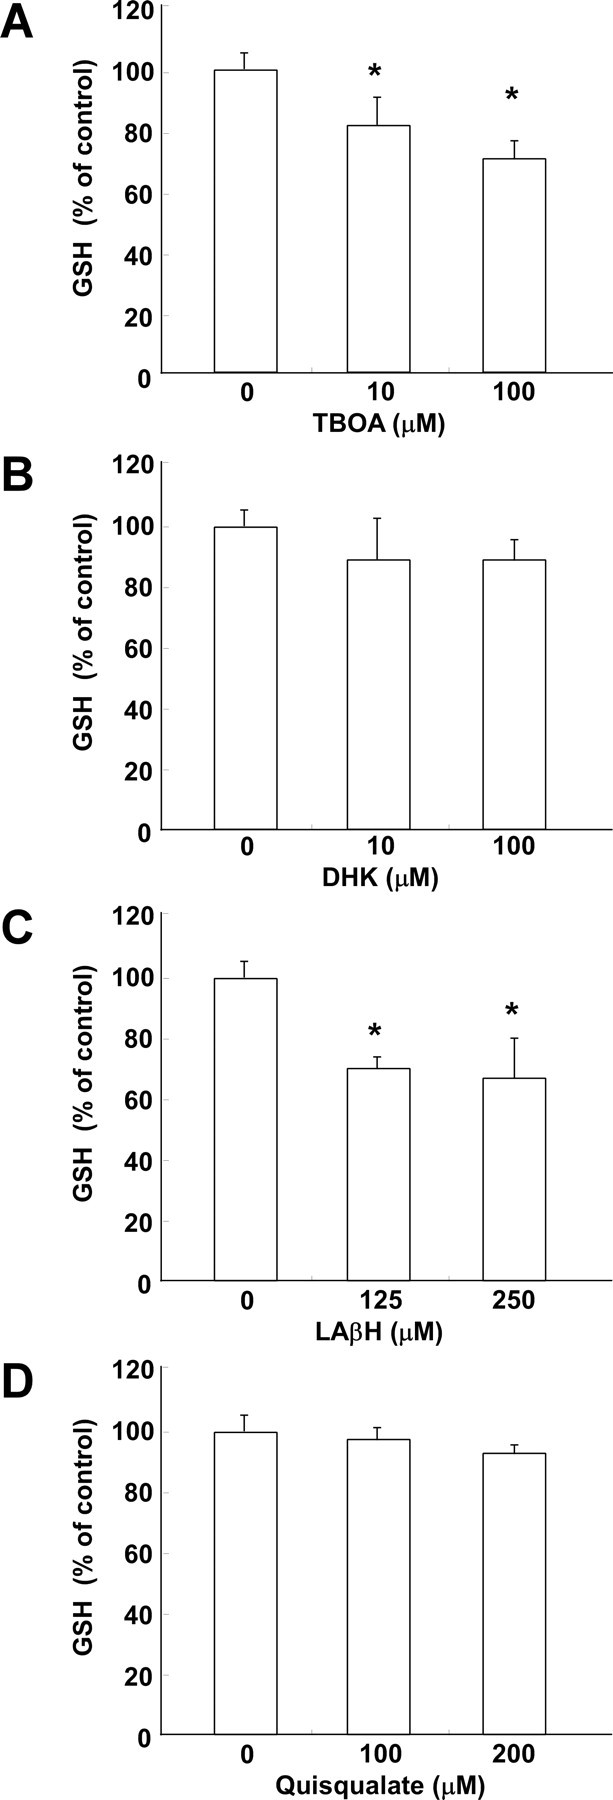
A–D, Effects of inhibitors of EAAT and cystine transporter on GSH contents of CGNs. After CGNs had been treated with TBOA (A), DHK (B), LAβH (C), or quisqualate (D) at the indicated concentrations for 3 h, GSH was assayed. Results are presented as means of three independent experiments. *p < 0.05 compared with control. Error bars indicate SEM.
GTRAP3-18 negatively regulates GSH levels in cultured neuronal cells
We next examined the effects of the intracellular GTRAP3-18 level on cellular GSH contents of CGNs. To increase GTRAP3-18 expression, the cells were treated with MeβCD, which increases GTRAP3-18 expression (Butchbach et al., 2003). MeβCD increased the level of endogenous GTRAP3-18 protein in CGNs, as expected (Fig. 3A,B). The EAAC1 protein level was not affected by MeβCD (Fig. 3A,B). We demonstrated this phenomenon using an immunocytochemical technique. MeβCD increased the fluorescence level of endogenous GTRAP3-18 protein in CGNs, but not EAAC1 (Fig. 3C). To confirm the MeβCD-increased physical interaction between GTRAP3-18 and EAAC1, we performed an immunoprecipitation experiment using anti-EAAC1 antibody. MeβCD increased GTRAP3-18 interacting with EAAC1 in CGNs (Fig. 3D,E). Under these experimental conditions, we examined the intracellular GSH content in CGNs using ThioGlo-1. MeβCD dose-dependently decreased intracellular GSH (Fig. 3F). We confirmed this phenomenon using the fluorescent dye CMFDA for intracellular GSH visualization. The GSH content decreased concomitantly with the increase in GTRAP3-18 protein in response to MeβCD (Fig. 3G). To decrease GTRAP3-18 expression, we used GTRAP3-18 antisense oligonucleotides cotransfected with pGFP and observed a specific reduction in the level of endogenous GTRAP3-18 protein in GFP-positive cells (Fig. 4A). GTRAP3-18 sense oligonucleotides did not affect the GTRAP3-18 protein level in GFP-positive cells (Fig. 4A). Under these experimental conditions, we used CMFDA and observed a specific increase in the intracellular GSH contents of DsRed-positive, i.e., oligonucleotide-transfected, cells (Fig. 4B). GTRAP3-18 sense oligonucleotides did not affect the CMFDA fluorescence level in DsRed-positive cells (Fig. 4B). In quantitative analysis, intracellular GSH increased when the GTRAP3-18 protein was decreased by antisense oligonucleotides (Fig. 4C). Moreover, to confirm whether or not MeβCD-decreased GSH was caused by increased endogenous GTRAP3-18 protein, we transfected MeβCD-treated CGNs with GTRAP3-18 antisense oligonucleotides. We observed a specific decrease in endogenous GTRAP3-18 protein in GFP-positive cells despite MeβCD treatment (Fig. 5A). GTRAP3-18 sense oligonucleotides did not affect the MeβCD-increased GTRAP3-18 protein level in GFP-positive cells (Fig. 5A). Under these experimental conditions, we used CMFDA and observed an increase in intracellular GSH contents of DsRed-positive cells despite MeβCD treatment (Fig. 5B). GTRAP3-18 sense oligonucleotides did not affect the MeβCD-decreased CMFDA fluorescence level in DsRed-positive cells (Fig. 5B). Quantitative analysis showed intracellular GSH to be increased despite MeβCD treatment when GTRAP3-18 protein was decreased by antisense oligonucleotides (Fig. 5C). These results show that GTRAP3-18 negatively regulates the intracellular GSH contents of CGNs.
Figure 3.
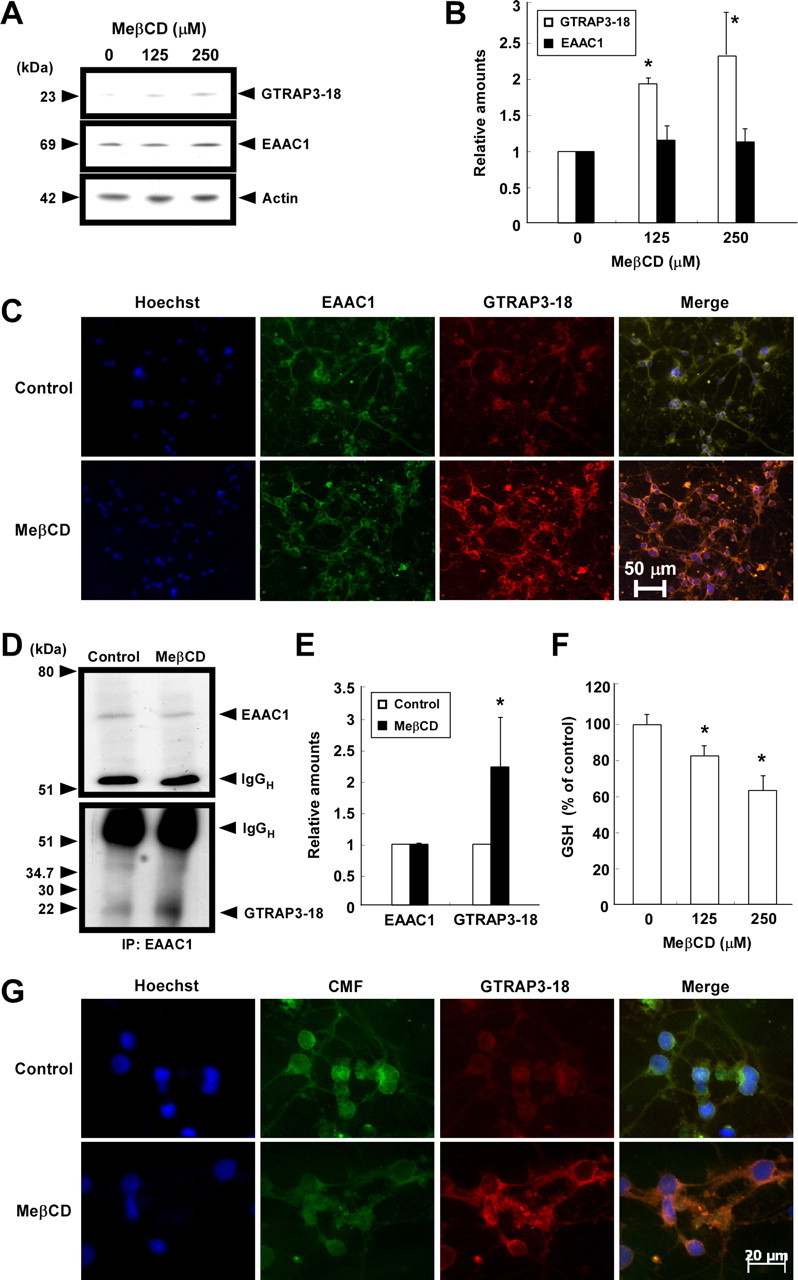
Effects of MeβCD on GTRAP3-18 expression and GSH contents of CGNs. A, CGNs were treated with MeβCD at the indicated concentrations for 2 d. Immunoblot analysis was performed using each specific antibody. B, Protein bands were quantified against actin amounts in the same lysates. Results are presented as means of three independent experiments. C, CGNs were treated with 250 μm MeβCD for 2 d. Intracellular localizations of EAAC1 (green), GTRAP3-18 (red), and nuclei (blue) of CGNs were examined. D, CGNs were treated with 250 μm MeβCD for 2 d. After immunoprecipitation using anti-EAAC1 antibody, immunoblot analysis was performed. E, GTRAP3-18 levels were quantified against EAAC1 amounts in the precipitates. F, CGNs were treated with MeβCD at the indicated concentrations for 2 d. GSH was assayed using ThioGlo-1. Results are presented as means of three independent experiments. *p < 0.05 compared with control. G, After CGNs had been treated with 250 μm MeβCD for 2 d, they were triple stained using Hoechst33342 (blue), CMFDA (CMF; green), and anti-GTRAP3-18 antibody (Red).
Figure 4.
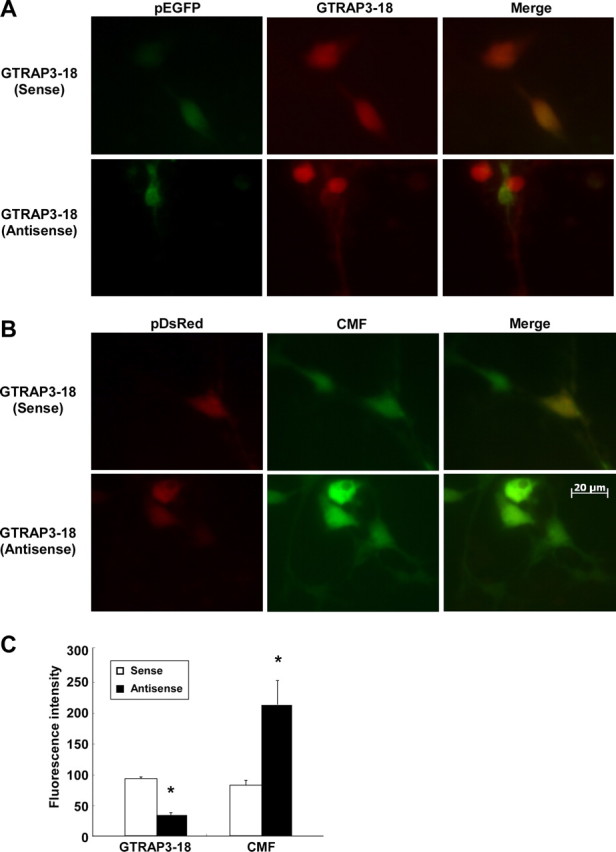
Effects of GTRAP3-18 antisense oligonucleotides on GSH contents of CGNs. A, CGNs were transiently cotransfected with pGFP and GTRAP3-18 sense or antisense oligonucleotides. Two days later, immunocytochemistry using anti-GTRAP3-18 antibody (DsRed) was performed. We considered GFP-positive cells to be oligonucleotide-transfected cells. B, CGNs were transiently cotransfected with pDsRed and GTRAP3-18 sense or antisense oligonucleotides. Two days later, the cells were stained with CMFDA (CMF; green). We considered DsRed-positive cells to be oligonucleotide-transfected cells. C, The fluorescence intensity on the oligonucleotide-transfected cells (GFP-positive or DsRed-positive cells) was quantified in two independent experiments with triplicate culture wells. The average number of GFP- or DsRed-positive cells was 5–10. *p < 0.05 compared with GTRAP3-18 sense oligonucleotide-transfected cells.
Figure 5.
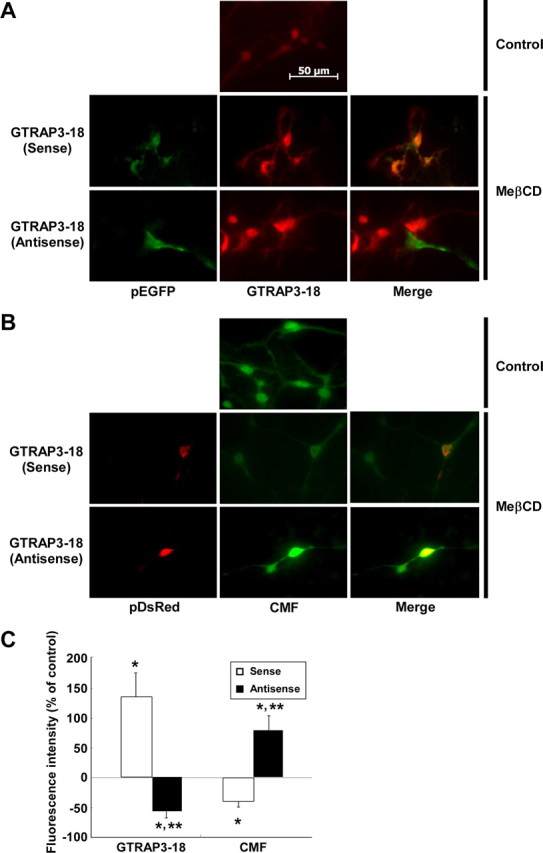
Effects of GTRAP3-18 antisense oligonucleotides in MeβCD-treated CGNs. A, After CGNs had been treated with 250 μm MeβCD, CGNs were transiently cotransfected with pGFP and GTRAP3-18 sense or antisense oligonucleotides. Two days later, immunocytochemistry using anti-GTRAP3-18 antibody (DsRed) was performed. GFP-positive cells were considered to be oligonucleotide-transfected cells. B, After CGNs had been treated with 250 μm MeβCD, CGNs were transiently cotransfected with pDsRed and GTRAP3-18 sense or antisense oligonucleotides. Two days later, the cells were stained with CMFDA (CMF; green). DsRed-positive cells were considered to be oligonucleotide-transfected cells. C, Fluorescence intensity changes on both MeβCD-treated and oligonucleotide-transfected cells (GFP-positive or DsRed-positive cells) were quantified in comparison with the intensity of nontreated, nontransfected cells, the value for which was taken as 0%. The fluorescence intensities of GFP- and DsRed-positive cells were quantified in two independent experiments with triplicate culture wells. The average number of GTP- or DsRed-positive cells was 5–10. *p < 0.05 compared with control; **p < 0.05 compared with both MeβCD-treated and GTRAP3-18 sense oligonucleotide-transfected cells.
Increased GTRAP3-18 decreases GSH levels in mouse brain
We next examined the effects of the intracellular GTRAP3-18 level on brain GSH contents in vivo. To determine whether MeβCD increases GTRAP3-18 protein levels in the brain in vivo, adult male mice were intracerebroventricularly and continuously infused with MeβCD (250 mg/ml) for 48 h (Butchbach et al., 2003), and then analyzed for GTRAP3-18 amounts in the brain. This intracerebroventricular administration resulted in a pronounced increase in GTRAP3-18 immunoreactivity in the MeβCD-treated brain compared with the aCSF-treated brain (data not shown). However, this MeβCD concentration was high enough to cause some toxic effects. Therefore, we analyzed GTRAP3-18 amounts under milder conditions (40 mg/ml MeβCD, mean flow rate 0.5 μl/h, 5 d) to reduce the possible adverse effects of MeβCD. This intracerebroventricular administration resulted in a pronounced increase in GTRAP3-18 immunoreactivity in the CA1 field of the hippocampus, which is the brain region closest to the MeβCD administration site, as compared with the vehicle (aCSF)-treated brain (Fig. 6A). Based on the results showing MeβCD to not affect propidium iodide and Fluoro-Jade B staining of the hippocampal CA1 cell layer, the milder condition produced no toxicity (Fig. 6A). Intracerebroventricular administration of MeβCD under these relatively mild conditions also resulted in an increase in the amount of GTRAP3-18 in the hippocampus, compared with aCSF-treatment (Fig. 6B,C). To confirm the MeβCD-increased physical interaction of GTRAP3-18 with EAAC1 in the hippocampus, we performed an immunoprecipitation experiment using anti-EAAC1 antibody. MeβCD increased the GTRAP3-18 interaction with EAAC1 in the hippocampus (Fig. 6D,E). Under these experimental conditions, we examined the intracellular hippocampal GSH contents using the NADPH-dependent GSH reductase method and found it to be decreased by 31.8 ± 5.1% in the hippocampus treated with MeβCD as compared with that treated with aCSF (Fig. 6F).
Figure 6.
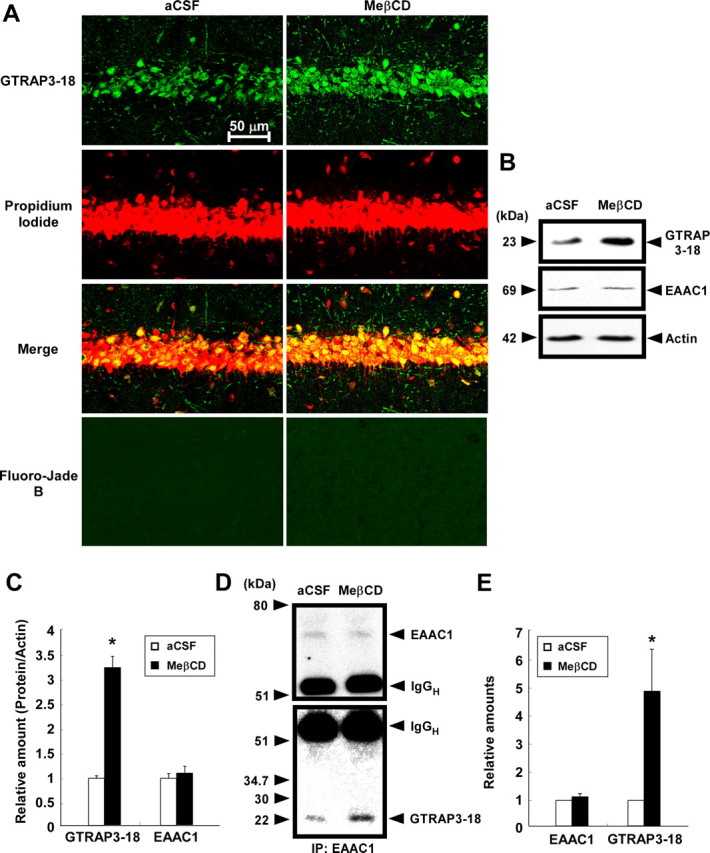
Effects of MeβCD on GTRAP3-18 expression and GSH contents in vivo. Adult male C57BL/6J mice (n ≥ 3) were treated intracerebroventricularly for 5 d with either MeβCD (40 mg/ml; flow rate, 0.5 μl/h) or aCSF. A, GTRAP3-18 immunolabeling (green), propidium iodide counterstaining (red), and Fluoro-Jade B staining (green) were performed in the CA1 field of the mouse hippocampus and examined by confocal laser-scanning fluorescence microscopy. B, Immunoblot analysis of the mouse hippocampus was performed using each specific antibody. C, Protein bands were quantified against the amounts of actin in the same lysates. D, After immunoprecipitation using lysates of mouse hippocampus and anti-EAAC1 antibody, immunoblot analysis was performed. E, GTRAP3-18 levels were quantified against EAAC1 amounts in the precipitates. F, GSH contents of the mouse hippocampus were measured by the NADPH-dependent GSH reductase method. *p < 0.05 compared with aCSF.
GTRAP3-18 siRNA increases GSH levels in mouse brain
We next examined the effects of GTRAP3-18 depletion on in vivo brain GSH contents. We used RNA interference to decrease the GTRAP3-18 amount. To determine whether siRNA of GTRAP3-18 decreases GTRAP3-18 protein levels in the brain in vivo, mice were infused intracerebroventricularly and continuously with GTRAP3-18 siRNA (20 mg/ml) for 1 week and GTRAP3-18 protein amounts in the brain were then analyzed. We immunohistochemically analyzed the GTRAP3-18 immunoreactivity in the brain and confirmed a decrease in the CA1 field of the GTRAP3-18 siRNA-treated brain compared with vehicle-, nonsilencing siRNA-, and EAAC1 siRNA-treated brains (Fig. 7A). Based on the results showing siRNA treatment to not affect propidium iodide and Fluoro-Jade B staining of the hippocampal CA1 cell layer, this condition produced no toxicity (Fig. 7A,C). GTRAP3-18 siRNA quantitatively decreased the GTRAP3-18 amount in the hippocampus as compared with vehicle-, nonsilencing siRNA-, or EAAC1 siRNA-treated brains (Fig. 8A,B). However, this siRNA effect was seen only in the hippocampus, i.e., not in the cortex or the cerebellum, when compared with MeβCD administration in the same areas (supplemental Fig. 1, available at www.jneurosci.org as supplemental material). These results indicate that siRNA infusion might cause more localized effects because of limited diffusion compared with MeβCD. Under these experimental conditions, we quantified GSH contents of the hippocampus using the NADPH-dependent GSH reductase method. GTRAP3-18 siRNA increased GSH contents as compared with the vehicle- or nonsilencing siRNA-treated brain (Fig. 8C).
Figure 7.
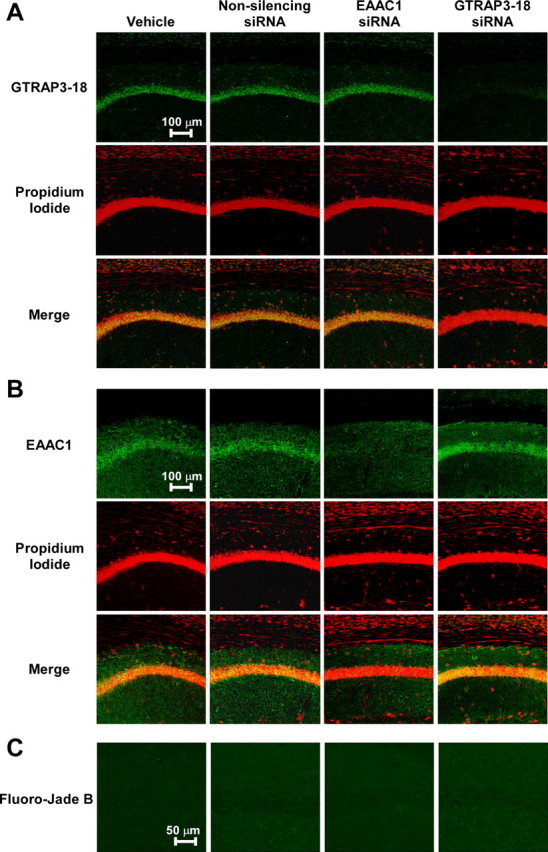
Immunohistochemical analysis of GTRAP3-18 and EAAC1 expressions using siRNA in vivo. Adult male C57BL/6J mice (n = 3) were treated intracerebroventricularly for 1 week with GTRAP3-18 siRNA, EAAC1 siRNA, or nonsilencing siRNA (20 mg/ml; flow rate, 0.5 μl/h). A–C, GTRAP3-18 (A) or EAAC1 (B) immunolabeling (green), propidium iodide counterstaining (red), and Fluoro-Jade B staining (C) were performed in the CA1 field of the hippocampus and examined by confocal laser-scanning fluorescence microscopy.
Figure 8.
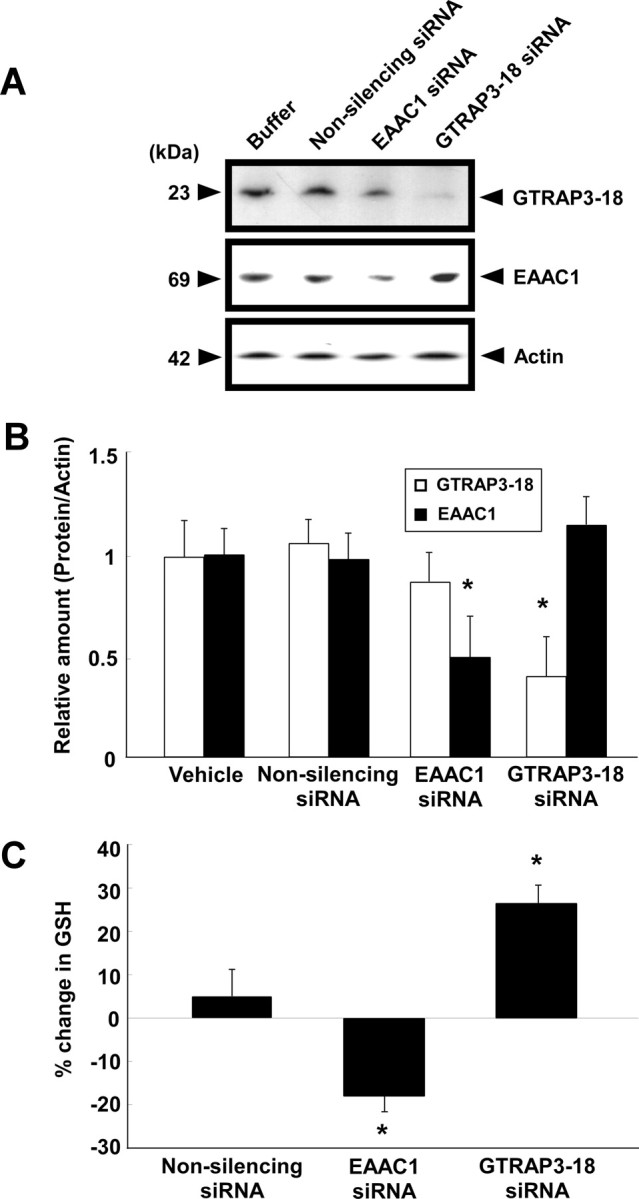
Effects of siRNA on GTRAP3-18 or EAAC1 expression and GSH contents in vivo. Adult male C57BL/6J mice (n = 3) were treated intracerebroventricularly for 1 week with GTRAP3-18 siRNA, EAAC1 siRNA, or nonsilencing siRNA (20 mg/ml; flow rate, 0.5 μl/h). A, Immunoblot analysis of the mouse hippocampus was performed using each specific antibody. B, Levels of protein bands were quantified against the amounts of actin in the same lysates. C, GSH contents of the mouse hippocampus were measured by the NADPH-dependent GSH reductase method. *p < 0.05 compared with vehicle. Error bars indicate SEM.
EAAC1 siRNA decreases GSH levels in mouse brain
We also examined the in vivo effect of EAAC1 depletion on brain GSH contents. Using EAAC1 siRNA to decrease EAAC1 amounts, mice were infused intracerebroventricularly and continuously with EAAC1 siRNA. This intracerebroventricular EAAC1 siRNA administration decreased EAAC1 amounts in the hippocampus as compared with vehicle-, nonsilencing siRNA-, and GTRAP3-18 siRNA-treated brains (Fig. 8A,B). Furthermore, we analyzed EAAC1 immunoreactivity in the brain and found a pronounced decrease in this immunoreactivity in the CA1 field of the EAAC1 siRNA-treated brain compared with vehicle-, nonsilencing siRNA-, and GTRAP3-18 siRNA-treated brains (Fig. 7B). Under these experimental conditions, we examined brain GSH contents using the NADPH-dependent GSH reductase method. EAAC1 siRNA decreased hippocampal GSH contents compared with the vehicle- and nonsilencing siRNA-treated brains (Fig. 8C). These results show that EAAC1 is an essential cysteine transporter for brain GSH synthesis and that GTRAP3-18 negatively regulates brain GSH contents in vivo.
GTRAP3-18 plays a dominant role in GSH levels
Protein kinase C activation is known to positively regulate cell surface expression of EAAC1 (Danbolt, 2001). Immunocytochemical (Fig. 9A) and biochemical analysis using a cell surface biotinylation technique (Fig. 9B) revealed PMA, a protein kinase C activator, to induce an increase in the cell surface EAAC1 level in CGNs. The GSH content using ThioGlo-1 was elevated concomitantly with an increase in the surface EAAC1 level by PMA (Fig. 9), whereas 4α-PMA, an inactive compound on protein kinase C, did not increase GSH contents (Fig. 9C,D). Treatment of MeβCD-treated cells with PMA induced large increases in cell-surface colocalized EAAC1 and GTRAP3-18 (Fig. 9A,B). Importantly, however, the PMA-induced increase in GSH content was inhibited by the MeβCD-induced increase in cell surface GTRAP3-18 protein in CGNs (Fig. 9C,D).
Figure 9.
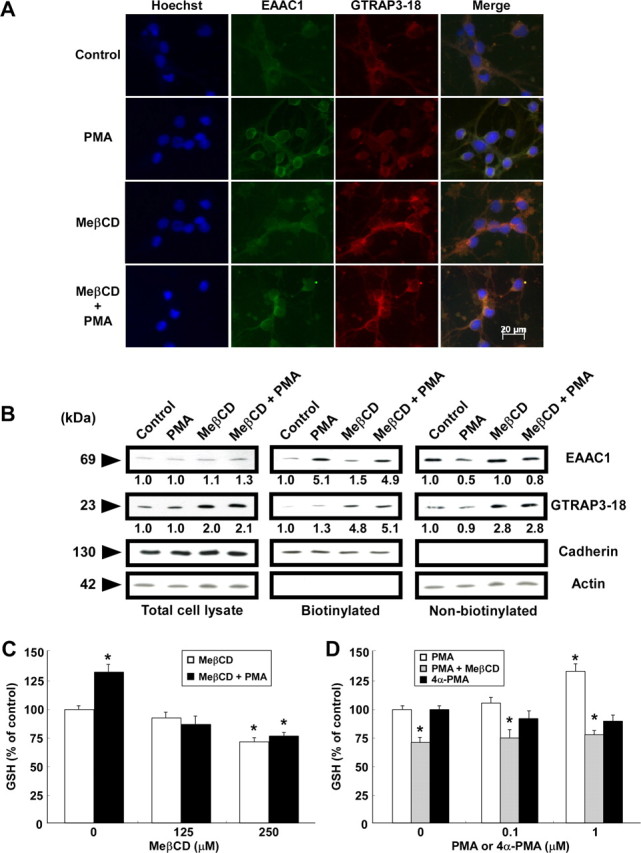
Changes in EAAC1 and GTRAP3-18 localization and GSH levels with MeβCD and PMA treatment of CGNs. CGNs were treated with 250 μm MeβCD for 2 d and then with 1 μm PMA for 3 h. A, Intracellular localizations of EAAC1 (green) and GTRAP3-18 (red) were examined. B, After biotinylation of intact CGNs, immunoblottings of biotinylated (cell surface) and nonbiotinylated (intracellular) fractions were performed using each specific antibody. Cadherin and actin were measured to determine the degree of intracellular protein labeling by the biotin reagent. Levels of EAAC1 and GTRAP3-18 were quantified against the amounts of each control. C, After CGNs had been treated with MeβCD at the indicated concentrations for 2 d and with 1 μm PMA for 3 h, GSH was assayed. D, After CGNs had been treated with 250 μm MeβCD for 2 d and with PMA or 4α-PMA at the indicated concentrations for 3 h, a GSH assay was performed. *p < 0.05 compared with control. Error bars indicate SEM.
Discussion
Our results demonstrate GTRAP3-18 to dominantly and negatively regulate EAAC1 activity and determine the intracellular GSH contents of neurons in vivo as well as in vitro. In primary neuronal culture, ∼90% of total cysteine uptake is mediated mainly by EAATs (Shanker et al., 2001). There are five EAATs termed glutamate–aspartate transporter (GLAST), glutamate transporter-1 (GLT-1), EAAC1, EAAT4, and EAAT5 (Danbolt, 2001). GLAST and GLT-1 are localized primarily to astrocytes, and EAAC1, EAAT4, and EAAT5 to neurons. EAAT4 and EAAT5 are restricted to cerebellar Purkinje cells and the retina, respectively, whereas EAAC1 is widely expressed in the CNS (Maragakis and Rothstein, 2004). In rats, knockdown expression of GRAST or GLT-1 by antisense oligonucleotides raised the extracellular glutamate concentration, whereas EAAC1 knockdown had no effect on extracellular glutamate contents (Rothstein et al., 1996). Astrocyte glutamate transporters are limited to glutaminergic synapses, whereas EAAC1 is detected diffusely over cell bodies and processes (Rothstein et al., 1994). EAAC1 can also transport cysteine at a rate comparable with that of glutamate, with 10- to 20-fold higher affinity than that of GRAST or GLT-1 (Zerangue and Kavanaugh, 1996). Moreover, a recent study demonstrated that EAAC1 is an essential transporter of the cysteine needed for GSH synthesis (Aoyama et al., 2006). Therefore, EAAC1 is the primary neuronal transporter among members of the EAAT family (Rothstein et al., 1994) and the main role of EAAC1 is not extracellular glutamate clearance, but rather cysteine transport for GSH synthesis in brain neurons.
We used a primary neuronal culture as an in vitro neuronal EAAC1 model system. Because not only EAAC1 but also other EAATs, which are not expressed in neurons in vivo, are induced during primary culture of some neurons (Himi et al., 2003), we used inhibitors of EAATs or the cystine transporter and thereby confirmed our system to be suitable as an in vitro neuronal EAAC1 model system.
MeβCD increases endogenous GTRAP3-18 in HEK293 cells (Butchbach et al., 2003). MeβCD has a high affinity for cholesterol and promotes the efflux of cholesterol from cells (Kilsdonk et al., 1995). However, there is no evidence for an association of EAAC1 with cholesterol efflux (Butchbach et al., 2004) and our previous study indicated no association between the MeβCD-induced efflux of cholesterol and GSH contents (Watabe et al., 2007). Our current study showed MeβCD to decrease neuronal GSH contents via an increase in GTRAP3-18 in vivo as well as in vitro. To downregulate GTRAP3-18 expression, we used an antisense oligonucleotide and short interfering RNA (siRNA) techniques. Both antisense oligonucleotides and siRNA of GTRAP3-18 specifically reduced the endogenous GTRAP3-18 protein level and concomitantly increased neuronal GSH in vivo as well as in vitro. These results clearly show GTRAP3-18 to negatively regulate neuronal GSH contents, which may in turn affect susceptibility to oxidative stress.
Each EAAT family member is chemically modified by various stimuli. Oxygen radicals and hydrogen peroxide induce persistent inhibition of EAATs, probably via direct interaction with the transport process (Volterra et al., 1994). Nitric oxide generators, such as sodium nitroprusside and S-nitroso-N-acetylpenicillamine, decrease glutamate uptake into the synaptosomes (Pogun et al., 1994). Peroxynitrite, formed from superoxide anion and nitric oxide, inhibits glutamate uptake by the neuronal transporter EAAC1 (Trotti et al., 1996). However, the functional significance of these chemical modifications of EAAC1 remains unknown. Another modification of EAAC1 involves phosphorylation. In a tumor cell line, the cell surface expression and activity of EAAC1 appear to be regulated by several phosphorylation pathways. In particular, a protein kinase C-mediated pathway is known to positively regulate cell surface expression and activation of glutamate uptake by EAAC1 (Danbolt, 2001; Huang et al., 2006). EAAC1 is mainly localized in the intracellular compartment, with ∼20% in the plasma membrane (Nieoullon et al., 2006). Phosphorylation by protein kinase C induces translocation of EAAC1 from the intracellular compartment to the plasma membrane, where it functions as an amino acid transporter. However, GTRAP3-18 is also present mainly in the intracellular compartment, as well as to a lesser extent at the plasma membrane, via binding to EAAC1 (Lin et al., 2001). Therefore, we examined the effects of protein kinase C activation on both GTRAP3-18 expression and the GSH level in MeβCD-treated CGNs. Confirming the findings of Lin et al. (2001), GTRAP3-18 in control cells was present both at the plasma membrane and in the intracellular compartment, and colocalized with EAAC1. We further demonstrated PMA, a protein kinase C activator, to induce an increase in the cell surface EAAC1 level and a concomitant increase in GSH contents. This result suggests protein kinase C to upregulate not only glutamate but also cysteine uptake by EAAC1 in neurons. Moreover, the treatment of MeβCD-treated cells with PMA induced large increases in cell-surface-colocalized EAAC1 and GTRAP3-18 while decreasing GSH contents. Importantly, the PMA-induced increase in GSH contents was inhibited by the MeβCD-induced increase in plasma membrane GTRAP3-18. This observation shows that GTRAP3-18 associated with EAAC1 in the plasma membrane dominantly and negatively regulates the uptake of cysteine for GSH synthesis, and determines intracellular GSH contents even when protein kinase C has activated EAAC1.
It is possible that an inhibitory compound blocking GTRAP3-18 would be an efficient GSH-increasing agent. Because GSH contents in discrete brain areas are reduced in patients with Parkinson or Alzheimer disease (Dringen and Hirrlinger, 2003), GTRAP3-18 is a potential therapeutic target for increasing the neuronal GSH level. The discovery of a GTRAP3-18 inhibitory compound that increases neuronal GSH would contribute to developing novel therapeutic strategies to protect neurons in patients with neurodegenerative disorders such as Parkinson and Alzheimer diseases.
Footnotes
This work was supported in part by a Grant-in-Aid for Young Scientists (B) from the Japan Society for the Promotion of Science.
References
- Almeida A, Heales SJ, Bolaños JP, Medina JM. Glutamate neurotoxicity is associated with nitric oxide-mediated mitochondrial dysfunction and glutathione depletion. Brain Res. 1998;790:209–216. doi: 10.1016/s0006-8993(98)00064-x. [DOI] [PubMed] [Google Scholar]
- Aoyama K, Suh SW, Hamby AM, Liu J, Chan WY, Chen Y, Swanson RA. Neuronal glutathione deficiency and age-dependent neurodegeneration in the EAAC1 deficient mouse. Nat Neurosci. 2006;9:119–126. doi: 10.1038/nn1609. [DOI] [PubMed] [Google Scholar]
- Baker MA, Cerniglia GJ, Zaman A. Microtiter plate assay for the measurement of glutathione and glutathione disulfide in large numbers of biological samples. Anal Biochem. 1990;190:360–365. doi: 10.1016/0003-2697(90)90208-q. [DOI] [PubMed] [Google Scholar]
- Bendahan A, Armon A, Madani N, Kavanaugh MP, Kanner BI. Arginine 447 plays a pivotal role in substrate interactions in a neuronal glutamate transporter. J Biol Chem. 2000;275:37436–37442. doi: 10.1074/jbc.M006536200. [DOI] [PubMed] [Google Scholar]
- Bharath S, Hsu M, Kaur D, Rajagopalan S, Andersen JK. Glutathione, iron and Parkinson's disease. Biochem Pharmacol. 2002;64:1037–1048. doi: 10.1016/s0006-2952(02)01174-7. [DOI] [PubMed] [Google Scholar]
- Butchbach ME, Guo H, Lin CL. Methyl-beta-cyclodextrin but not retinoic acid reduces EAAT3-mediated glutamate uptake and increases GTRAP3-18 expression. J Neurochem. 2003;84:891–894. doi: 10.1046/j.1471-4159.2003.01588.x. [DOI] [PubMed] [Google Scholar]
- Butchbach ME, Tian G, Guo H, Lin CL. Association of excitatory amino acid transporters, especially EAAT2, with cholesterol-rich lipid raft microdomains: importance for excitatory amino acid transporter localization and function. J Biol Chem. 2004;279:34388–34396. doi: 10.1074/jbc.M403938200. [DOI] [PubMed] [Google Scholar]
- Chen Y, Swanson RA. The glutamate transporters EAAT2 and EAAT3 mediate cysteine uptake in cortical neuron cultures. J Neurochem. 2003;84:1332–1339. doi: 10.1046/j.1471-4159.2003.01630.x. [DOI] [PubMed] [Google Scholar]
- Cho Y, Bannai S. Uptake of glutamate and cysteine in C-6 glioma cells and in cultured astrocytes. J Neurochem. 1990;55:2091–2097. doi: 10.1111/j.1471-4159.1990.tb05800.x. [DOI] [PubMed] [Google Scholar]
- Danbolt NC. Glutamate uptake. Prog Neurobiol. 2001;65:1–105. doi: 10.1016/s0301-0082(00)00067-8. [DOI] [PubMed] [Google Scholar]
- Dringen R. Metabolism and functions of glutathione in brain. Prog Neurobiol. 2000;62:649–671. doi: 10.1016/s0301-0082(99)00060-x. [DOI] [PubMed] [Google Scholar]
- Dringen R, Hirrlinger J. Glutathione pathways in the brain. Biol Chem. 2003;384:505–516. doi: 10.1515/BC.2003.059. [DOI] [PubMed] [Google Scholar]
- Dringen R, Pfeiffer B, Hamprecht B. Synthesis of the antioxidant glutathione in neurons: supply by astrocytes of CysGly as precursor for neuronal glutathione. J Neurosci. 1999;19:562–569. doi: 10.1523/JNEUROSCI.19-02-00562.1999. [DOI] [PMC free article] [PubMed] [Google Scholar]
- Giordano G, White CC, McConnachie LA, Fernandez C, Kavanagh TJ, Costa LG. Neurotoxicity of domoic acid in cerebellar granule neurons in a genetic model of glutathione deficiency. Mol Pharmacol. 2006;70:2116–2126. doi: 10.1124/mol.106.027748. [DOI] [PubMed] [Google Scholar]
- Halliwell B. Reactive oxygen species and the central nervous system. J Neurochem. 1992;59:1609–1623. doi: 10.1111/j.1471-4159.1992.tb10990.x. [DOI] [PubMed] [Google Scholar]
- Himi T, Ikeda M, Yasuhara T, Nishida M, Morita I. Role of neuronal glutamate transporter in the cysteine uptake and intracellular glutathione levels in cultured cortical neurons. J Neural Transm. 2003;110:1337–1348. doi: 10.1007/s00702-003-0049-z. [DOI] [PubMed] [Google Scholar]
- Huang Y, Feng X, Sando JJ, Zuo Z. Critical role of serine 465 in isoflurane-induced increase of cell-surface redistribution and activity of glutamate transporter type 3. J Biol Chem. 2006;281:38133–38138. doi: 10.1074/jbc.M603885200. [DOI] [PubMed] [Google Scholar]
- Kagan VE, Kuzmenko AI, Tyurina YY, Shvedova AA, Matsura T, Yalowich JC. Pro-oxidant and antioxidant mechanisms of etoposide in HL-60 cells: role of myeloperoxidase. Cancer Res. 2001;61:7777–7784. [PubMed] [Google Scholar]
- Kilsdonk EP, Yancey PG, Stoudt GW, Bangerter FW, Johnson WJ, Phillips MC, Rothblat GH. Cellular cholesterol efflux mediated by cyclodextrins. J Biol Chem. 1995;270:17250–17256. doi: 10.1074/jbc.270.29.17250. [DOI] [PubMed] [Google Scholar]
- Kim J, Ahn S, Ren XR, Whalen EJ, Reiter E, Wei H, Lefkowitz RJ. Functional antagonism of different G protein-coupled receptor kinases for beta-arrestin-mediated angiotensin II receptor signaling. Proc Natl Acad Sci U S A. 2005;102:1442–1447. doi: 10.1073/pnas.0409532102. [DOI] [PMC free article] [PubMed] [Google Scholar]
- Kranich O, Hamprecht B, Dringen R. Different preferences in the utilization of amino acids for glutathione synthesis in cultured neurons and astroglial cells derived from rat brain. Neurosci Lett. 1996;219:211–214. doi: 10.1016/s0304-3940(96)13217-1. [DOI] [PubMed] [Google Scholar]
- Lin CI, Orlov I, Ruggiero AM, Dykes-Hoberg M, Lee A, Jackson M, Rothstein JD. Modulation of the neuronal glutamate transporter EAAC1 by the interacting protein GTRAP3-18. Nature. 2001;410:84–88. doi: 10.1038/35065084. [DOI] [PubMed] [Google Scholar]
- Maher P. The effects of stress and aging on glutathione metabolism. Ageing Res Rev. 2005;4:288–314. doi: 10.1016/j.arr.2005.02.005. [DOI] [PubMed] [Google Scholar]
- Maragakis NJ, Rothstein JD. Glutamate transporters: animal models to neurologic disease. Neurobiol Dis. 2004;15:461–473. doi: 10.1016/j.nbd.2003.12.007. [DOI] [PubMed] [Google Scholar]
- Murphy TH, Schnaar RL, Coyle JT. Immature cortical neurons are uniquely sensitive to glutamate toxicity by inhibition of cystine uptake. Faseb J. 1990;4:1624–1633. [PubMed] [Google Scholar]
- Nieoullon A, Canolle B, Masmejean F, Guillet B, Pisano P, Lortet S. The neuronal excitatory amino acid transporter EAAC1/EAAT3: does it represent a major actor at the brain excitatory synapse? J Neurochem. 2006;98:1007–1018. doi: 10.1111/j.1471-4159.2006.03978.x. [DOI] [PubMed] [Google Scholar]
- Pogun S, Dawson V, Kuhar MJ. Nitric oxide inhibits 3H-glutamate transport in synaptosomes. Synapse. 1994;18:21–26. doi: 10.1002/syn.890180104. [DOI] [PubMed] [Google Scholar]
- Rothstein JD, Martin L, Levey AI, Dykes-Hoberg M, Jin L, Wu D, Nash N, Kuncl RW. Localization of neuronal and glial glutamate transporters. Neuron. 1994;13:713–725. doi: 10.1016/0896-6273(94)90038-8. [DOI] [PubMed] [Google Scholar]
- Rothstein JD, Dykes-Hoberg M, Pardo CA, Bristol LA, Jin L, Kuncl RW, Kanai Y, Hediger MA, Wang Y, Schielke JP, Welty DF. Knockout of glutamate transporters reveals a major role for astroglial transport in excitotoxicity and clearance of glutamate. Neuron. 1996;16:675–686. doi: 10.1016/s0896-6273(00)80086-0. [DOI] [PubMed] [Google Scholar]
- Sagara JI, Miura K, Bannai S. Maintenance of neuronal glutathione by glial cells. J Neurochem. 1993;61:1672–1676. doi: 10.1111/j.1471-4159.1993.tb09802.x. [DOI] [PubMed] [Google Scholar]
- Schmued LC, Hopkins KJ. Fluoro-Jade B: a high affinity fluorescent marker for the localization of neuronal degeneration. Brain Res. 2000;874:123–130. doi: 10.1016/s0006-8993(00)02513-0. [DOI] [PubMed] [Google Scholar]
- Schmued LC, Albertson C, Slikker W., Jr Fluoro-Jade: a novel fluorochrome for the sensitive and reliable histochemical localization of neuronal degeneration. Brain Res. 1997;751:37–46. doi: 10.1016/s0006-8993(96)01387-x. [DOI] [PubMed] [Google Scholar]
- Schulz JB, Lindenau J, Seyfried J, Dichgans J. Glutathione, oxidative stress and neurodegeneration. Eur J Biochem. 2000;267:4904–4911. doi: 10.1046/j.1432-1327.2000.01595.x. [DOI] [PubMed] [Google Scholar]
- Shanker G, Allen JW, Mutkus LA, Aschner M. The uptake of cysteine in cultured primary astrocytes and neurons. Brain Res. 2001;902:156–163. doi: 10.1016/s0006-8993(01)02342-3. [DOI] [PubMed] [Google Scholar]
- Shih AY, Murphy TH. xCt cystine transporter expression in HEK293 cells: pharmacology and localization. Biochem Biophys Res Commun. 2001;282:1132–1137. doi: 10.1006/bbrc.2001.4703. [DOI] [PubMed] [Google Scholar]
- Trotti D, Rossi D, Gjesdal O, Levy LM, Racagni G, Danbolt NC, Volterra A. Peroxynitrite inhibits glutamate transporter subtypes. J Biol Chem. 1996;271:5976–5979. doi: 10.1074/jbc.271.11.5976. [DOI] [PubMed] [Google Scholar]
- Volterra A, Trotti D, Tromba C, Floridi S, Racagni G. Glutamate uptake inhibition by oxygen free radicals in rat cortical astrocytes. J Neurosci. 1994;14:2924–2932. doi: 10.1523/JNEUROSCI.14-05-02924.1994. [DOI] [PMC free article] [PubMed] [Google Scholar]
- Watabe M, Masuda Y, Nakajo S, Yoshida T, Kuroiwa Y, Nakaya K. The cooperative interaction of two different signaling pathways in response to bufalin induces apoptosis in human leukemia U937 cells. J Biol Chem. 1996;271:14067–14072. doi: 10.1074/jbc.271.24.14067. [DOI] [PubMed] [Google Scholar]
- Watabe M, Machida K, Osada H. MT-21 is a synthetic apoptosis inducer that directly induces cytochrome c release from mitochondria. Cancer Res. 2000;60:5214–5222. [PubMed] [Google Scholar]
- Watabe M, Hishikawa K, Takayanagi A, Shimizu N, Nakaki T. Caffeic acid phenethyl ester induces apoptosis by inhibition of NFkappaB and activation of Fas in human breast cancer MCF-7 cells. J Biol Chem. 2004;279:6017–6026. doi: 10.1074/jbc.M306040200. [DOI] [PubMed] [Google Scholar]
- Watabe M, Aoyama K, Nakaki T. Regulation of glutathione synthesis via interaction between glutamate transport-associated protein 3-18 (GTRAP3-18) and excitatory amino acid carrier-1 (EAAC1) at plasma membrane. Mol Pharmacol. 2007;72:1103–1110. doi: 10.1124/mol.107.039461. [DOI] [PubMed] [Google Scholar]
- Zerangue N, Kavanaugh MP. Interaction of L-cysteine with a human excitatory amino acid transporter. J Physiol. 1996;493:419–423. doi: 10.1113/jphysiol.1996.sp021393. [DOI] [PMC free article] [PubMed] [Google Scholar]


