Abstract
Cerebral ischemia stimulates Ca2+ influx and thus increases neuronal intracellular free [Ca2+]. Using a rat model of cerebral ischemia without recirculation, we tested whether ischemia enhances the activation by Ca2+ of ryanodine receptor (RyR) channels, a requisite feature of RyR-mediated Ca2+-induced Ca2+ release (CICR). To this aim, we evaluated how single RyR channels from endoplasmic reticulum vesicles, fused into planar lipid bilayers, responded to cytoplasmic [Ca2+] changes. Endoplasmic reticulum vesicles were isolated from the cortex of rat brains incubated without blood flow for 5 min at 37°C (ischemic) or at 4°C (control). Ischemic brains displayed increased oxidative intracellular conditions, as evidenced by a lower ratio (∼130:1) of reduced/oxidized glutathione than controls (∼200:1). Single RyR channels from ischemic or control brains displayed the same three responses to Ca2+ reported previously, characterized by low, moderate, or high maximal activity. Relative to controls, RyR channels from ischemic brains displayed with increased frequency the high activity response and with lower frequency the low activity response. Both control and ischemic cortical vesicles contained the RyR2 and RyR3 isoforms in a 3:1 proportion, with undetectable amounts of RyR1. Ischemia reduced [3H]ryanodine binding and total RyR protein content by 35%, and increased at least twofold endogenous RyR2 S-nitrosylation and S-glutathionylation without affecting the corresponding RyR3 endogenous levels. In vitro RyR S-glutathionylation but not S-nitrosylation favored the emergence of high activity channels. We propose that ischemia, by enhancing RyR2 S-glutathionylation, allows RyR2 to sustain CICR; the resulting amplification of Ca2+ entry signals may contribute to cortical neuronal death.
Keywords: endoplasmic reticulum, Ca2+ release channels, Ca2+-induced Ca2+ release, sulfhydryl oxidation, oxygen deprivation, oxidative stress
Introduction
During cerebral ischemia, cytoplasmic [Ca2+] rises and activates several Ca2+-dependent pathways that participate in cell survival and/or cell death (Tauskela and Morley, 2004; Lo et al., 2005). Increased cytoplasmic [Ca2+] enhances nitric oxide (NO) synthesis, which inhibits the mitochondrial electron transport chain and favors superoxide anion release and peroxynitrite production (Moncada and Erusalimsky, 2002). In turn, peroxynitrite contributes to long-lasting modifications of mitochondrial proteins and to the release of proapoptotic proteins from mitochondria (Blomgren and Hagberg, 2006). Few minutes after uncompensated ischemia, cell death pathways overcome survival-promoting pathways, leading to neuronal death through three interacting mechanisms: excitotoxicity attributable to excess glutamate, oxidative stress, and/or stimulation of apoptotic-like pathways (Lo et al., 2005).
Increased Ca2+ entry through plasma membrane channels during cerebral ischemia is well documented (Lo et al., 2005; Bano and Nicotera, 2007; Xiong et al., 2007). In contrast, the effects of ischemia on endoplasmic reticulum (ER) Ca2+ release have received less attention (Hernández-Fonseca and Massieu, 2005). The ER has an important role as a regulator of intracellular [Ca2+] in neurons (Berridge et al., 1998; Pape et al., 2004; Verkhratsky, 2005), and depletion of Ca2+ from the ER can induce neuronal death (Verkhratsky and Toescu, 2003; Xing et al., 2004). It is unclear, however, whether Ca2+-induced Ca2+ release (CICR) from the ER amplifies the initial cytoplasmic [Ca2+] increase produced by Ca2+ influx during ischemia (Clodfelter et al., 2002). In neurons, ER ryanodine receptor (RyR) channels release Ca2+ either through depolarization-induced Ca2+ release (Ouardouz et al., 2003) or via CICR (Berridge et al., 1998; Emptage et al., 1999; Pape et al., 2004; Verkhratsky, 2005). Therefore, RyR channels could amplify by CICR the cytoplasmic [Ca2+] increase caused by Ca2+ entry during cerebral ischemia.
The redox state of highly reactive cysteine residues regulates RyR channel activation, enabling these channels to act as cellular redox sensors (Eu et al., 2000; Xia et al., 2000; Pessah et al., 2002). In particular, RyR redox state determines the three types of response (low, moderate, or high) to cytoplasmic [Ca2+] increases of single RyR channels from rat brain cortex ER (Marengo et al., 1996, 1998; Bull et al., 2003, 2007). Thus, sulfhydryl (SH) modifying agents added while recording channel activity cause a single low activity channel to adopt sequentially and stepwise, first the moderate and then the high activity response (Marengo et al., 1998). Furthermore, S-nitrosylation and/or S-glutathionylation of SH residues of skeletal or cardiac RyR channels enhance CICR kinetics at micromolar [Ca2+] (Hidalgo et al., 2002; Aracena et al., 2003; Sánchez et al., 2005).
Ischemia-induced generation of NO and reactive oxygen species (ROS) in neurons may promote RyR SH modifications, resulting in ROS/NO-enhanced Ca2+-activation of RyR channels, favoring CICR. To test this hypothesis, we investigated the responses to Ca2+ of single RyR channels from cortical ER vesicles isolated from ischemic rat brains. In vesicles from ischemic or control ER, we also compared [3H]ryanodine binding, relative RyR isoform content, and their S-nitrosylation and S-glutathionylation levels.
Parts of this work was published previously in abstract form (Behrens et al., 2006).
Materials and Methods
Global ischemia.
Twelve-week-old Sprague Dawley male rats were decapitated with a guillotine. Their brains were quickly removed, placed in a solution containing 135 mm NaCl and 25 mm 3-(N-morpholino)-propanesulfonic acid (MOPS)–Tris, pH 7.3, and incubated during 2–15 min at 37°C or 4°C. Brains incubated for 5 min at 37°C were considered ischemic, whereas those incubated at 4°C were defined as controls (see Results). After incubation, the brain cortex was rapidly dissected (excluding the hippocampus) and homogenized in a solution containing 300 mm sucrose, 20 mm MOPS–Tris, pH 7.0, 1 μg/ml leupeptin, 1 μg/ml pepstatin, 0.4 mm benzamidine, 1 mm phenylmethylsulfonyl fluoride, and 10 μg/ml trypsin inhibitor, and glutathione content was determined as described previously (Griffith, 1980). To quantify cellular redox state, the ratio of reduced (GSH) over oxidized (GSSG) glutathione was calculated. All experimental protocols used in this work were approved by the Bioethics Committee for Investigation in Animals of the Facultad de Medicina, Universidad de Chile.
Isolation of membrane fractions.
RyR-enriched ER vesicles were isolated from rat brain cortex as reported previously (Marengo et al., 1996), using 5 mm total glutathione instead of dithiothreitol (DTT) throughout the isolation procedure. To maintain cellular redox conditions, GSH/GSSG ratios of 100:1 or 200:1 were used to isolate ER from ischemic or control brains, respectively, except when explicitly stated otherwise. To isolate the standard brain cortex ER vesicles (brains were not incubated without blood flow before ER isolation), 5 mm DTT was used during isolation as described previously (Marengo et al., 1996). Sarcoplasmic reticulum (SR) vesicles were isolated from either fast skeletal muscle of New Zealand rabbits or cardiac muscle of mongrel dogs, as described previously (Hidalgo et al., 1993; Sánchez et al., 2003). Small aliquots of the vesicle-containing suspensions were quickly frozen in liquid N2 and stored at −80°C.
Detection of RyR isoforms and their SH modifications.
ER vesicles (30 μg of protein) were incubated in nonreducing loading buffer plus 5 mm N-ethylmaleimide for 20 min at 60°C and separated by SDS-PAGE in 3.5–8% gradient gels under nonreducing conditions. After electrophoresis and transfer to polyvinylidene difluoride (PVDF) membranes, proteins were probed with isoform-specific anti-RyR antibodies. After enhanced chemiluminescence detection of the antigen–antibody reaction, PVDF membranes were stained with Coomassie blue. The different bands were quantified by densitometry. RyR protein bands were normalized with respect to the density of a 170 kDa protein band, which was constant in all gels under control or ischemic conditions. To analyze RyR SH modifications, we used specific antibodies raised against either GSH or nitrosocysteine, which have been validated for the detection of RyR S-glutathionylation and S-nitrosylation levels (Aracena-Parks et al., 2006). ER vesicles were separated by SDS-PAGE under nonreducing conditions, transferred to PVDF membranes as above, and probed with anti-GSH antibody (1:10000; Virogen) or anti-nitrosocysteine antibody (1:10,000; AG Scientific). After immunodetection, membranes were stripped and probed with anti-RyR antibodies. S-Glutathionylation and S-nitrosylation levels were expressed as the ratio between anti-GSH or anti-nitrosocysteine, respectively, and anti-RyR band densities (Sánchez et al., 2005).
Equilibrium [3H]ryanodine binding.
ER vesicles (0.1 mg/ml) were incubated at 37°C for 120 min using a solution containing the following (in mm): 500 KCl, 0.5 5′-adenylylimido diphosphate (AMP-PNP), 20 MOPS–Tris, pH 7.0, 1 N-(2-hydroxyethyl)-ethylenediamine-triacetic acid (HEDTA), 1 CaCl2, and 0.01 [3H]ryanodine. We used HEDTA to buffer free [Ca2+] at 18 μm, calculated with WinMAXC (www.stanford.edu/∼cpatton/wmaxc.zip). After incubation, [3H]ryanodine binding was determined by filtration as described previously (Bull et al., 1989).
Superoxide anion measurement.
Superoxide production was measured by lucigenin chemiluminescence (Sánchez et al., 2005). ER vesicles (0.1 mg/ml) were incubated at 25°C in a solution containing 100 mm MOPS–Tris, pH 7.0, 100 μm NADPH, 100 μm total glutathione at a GSH/GSSG ratio of 200:1, and 5 μm lucigenin. Chemiluminescence was measured in a Berthold FB 12 luminometer and expressed as nanomoles of superoxide anion per milligram of protein per minute.
RyR channel experiments.
Channel recordings were obtained as reported previously (Marengo et al., 1996; Bull et al., 2003). The cis-(cytoplasmic) solution contained 4 mm total glutathione, 0.5 mm Ca2+–HEPES, and 225 mm HEPES–Tris, pH 7.4. Sufficient HEDTA and/or EGTA, calculated as above, were added to set the desired free [Ca2+]. The trans (intrareticular) solution contained 40 mm Ca2+–HEPES and 15 mm Tris–HEPES, pH 7.4; therefore, the charge carrier was Ca2+. The lipid bilayer was held at 0 mV; channel recordings were obtained at 22 ± 2°C. Current data were filtered at 400 Hz (−3 dB) using an eight-pole low-pass Bessel type filter (902 LPF; Frequency Devices) and digitized at 2 kHz with a 12-bit analog-to-digital converter (Labmaster DMA interface; Scientific Solutions) using the commercial software Axotape (Molecular Devices).
Fractional open time (Po) values were computed using the commercial software pClamp (Molecular Devices). According to their extent of activation by [Ca2+], channels were classified as low (Po < 0.1 at all [Ca2+] tested), moderate (Po > 0.1 in the [Ca2+] range of 10–100 μm, with reduction in Po at 500 μm [Ca2+]), or high (Po near 1.0 between 3 and 500 μm [Ca2+]) activity channels (Marengo et al., 1996; Bull et al., 2003, 2007). Because low and moderate activity channels gated with fast kinetics between closed and open states, Po values (denoted as Po*) were calculated as the ratio between the mean current of the entire channel recording and the single-channel current amplitude measured in long-lasting (>30 ms) fully open events (Bull et al., 2003).
Data expression and analysis.
Data were expressed as mean ± SE values, except when explicitly stated otherwise. Differences between mean values were statistically analyzed using the Student's t test. Frequencies of emergence of channels with different Ca2+ responses in different ER preparations were compared using the χ2 test.
The function used to fit the Ca2+ dependence of single-channel Po* values is given by the following general equation, which gives Po* values as a function of cis-[Ca2+]: Po* = {(Pomax × [Ca2+])/([Ca2+] + Ka)} × {Ki/([Ca2+] + Ki)}. In this equation, Po max corresponds to the theoretical Po value of maximal activation by Ca2+. Ka and Ki correspond to the Ca2+ concentrations for half-maximal activation and inhibition of channel activity, respectively. Nonlinear fitting was performed with the commercial software SigmaPlot (Systat Software). To include the variability of experimental data in the parameter values, curve fitting was performed using the individual Po* values instead of the mean values obtained for each experimental condition.
Materials.
All reagents used were of analytical grade. Lipids were obtained from Avanti Polar Lipids. Ryanodine, bovine serum albumin, GSH, GSSG, and protease inhibitors (leupeptin, pepstatin A, benzamidine, trypsin inhibitor, and phenylmethylsulfonyl fluoride) were from Sigma. NADPH and (±)-(E)-ethyl-2-[(E)-hydroxyimino]-5-nitro-3-hexeneamide (NOR-3) were from Calbiochem, and lucigenin was from Invitrogen. [3H]Ryanodine was from NEN Life Science Products.
Results
Temporal course of redox changes in brain cortex during ischemia
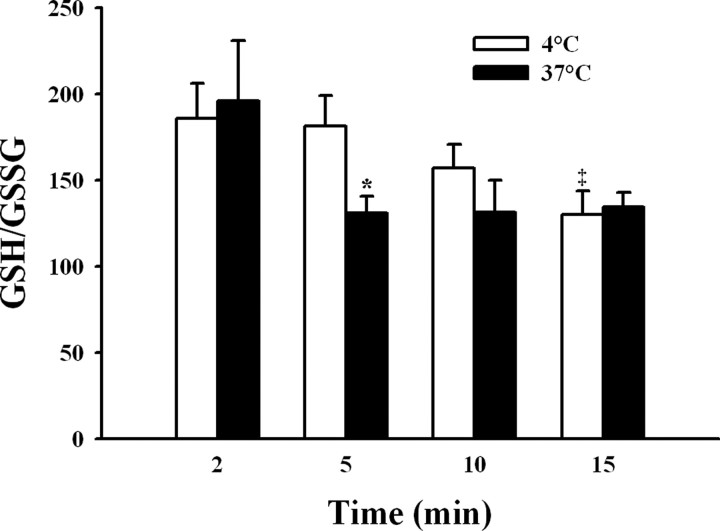
During ischemia, the brain tissue is subject to important oxidative stress (Lei et al., 1997; McManus et al., 2004). Accordingly, as an index of the redox state present in rat brain cortex during the absence of blood flow, we measured the ratio between the oxidized and reduced forms of glutathione, the major brain redox buffer couple (Dringen, 2000), and compared these values in cerebral cortex homogenates obtained from brains incubated at 37°C or at 4°C (Fig. 1). The initial GSH/GSSG ratio, measured in brain cortex homogenates obtained 2 min after suspension of blood flow, fluctuated around 200 for both conditions. In homogenates from the cortex of brains kept at 4°C (Fig. 1, open bars), the GSH/GSSG ratio remained close to this value during the first 5 min of incubation, to decline afterward reaching a value of 130 ± 14 at 15 min. In contrast, only 5 min of incubation at 37°C sufficed to decrease the GSH/GSSG ratio to 131 ± 10; this ratio remained constant at values ∼130 for incubations of up to 15 min at 37°C (Fig. 1, filled bars). These results indicate that lowering the temperature to 4°C delayed for >5 min the global oxidative increase caused by ischemia. Accordingly, we used brains incubated for 5 min at 37°C in the absence of blood flow as a model of global ischemia, whereas brains incubated without blood flow but maintained at 4°C for the same 5 min period were used as controls. To maintain the redox state that prevailed in the brain at the end of the 5 min incubation period, unless otherwise stated, the isolation procedure of ER vesicles from ischemic or control brains was performed using in all solutions GSH/GSSG ratios of 100:1 or 200:1, respectively.
Figure 1.
Time-dependent changes in the GSH/GSSG ratio in brain cortex homogenates after blood flow interruption. Isolated rat brains were incubated in the absence of blood flow for 2–15 min at 37°C (ischemic, filled bars) or 4°C (control, open bars). After incubation, the brain cortex was quickly dissected and homogenized at 4°C. Total and reduced glutathione were measured, and the GSH/GSSG ratio was calculated (see Materials and Methods). *p < 0.05, differed from the corresponding control value. ‡p < 0.05, differed from values of control brains at 2 or 5 min.
Calcium dependence of single RyR channels
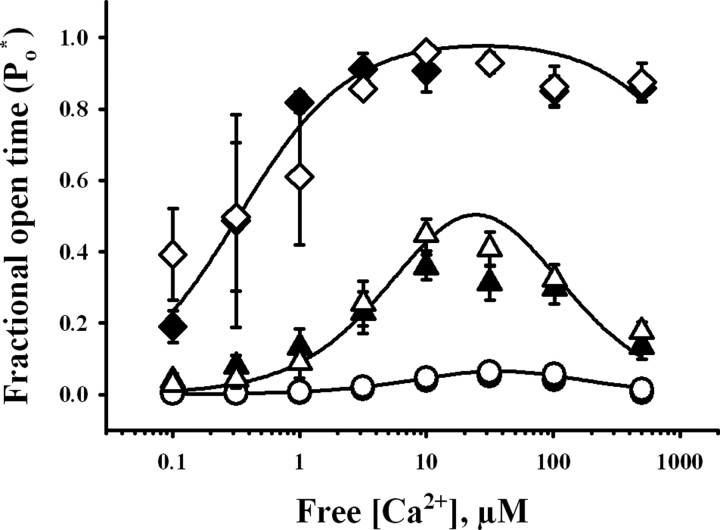
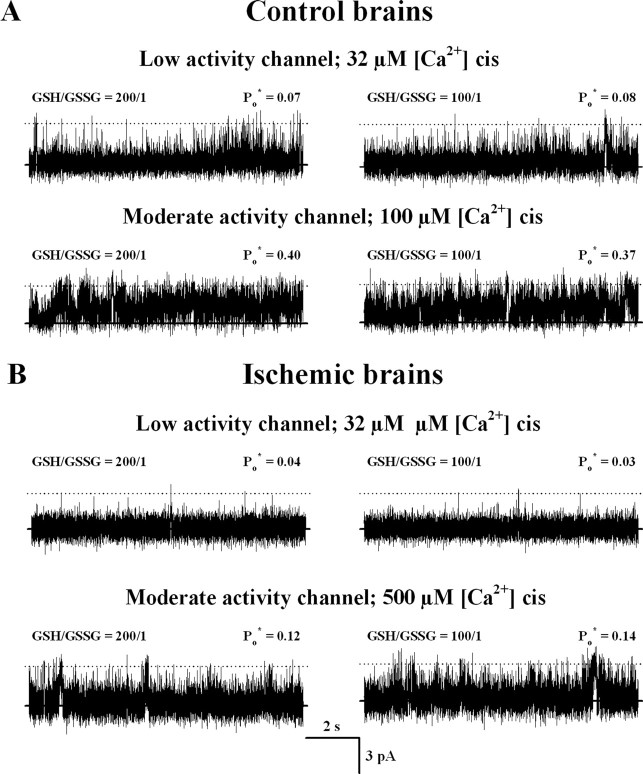
The activity of RyR channels from ischemic or control brains was recorded using GSH/GSSG ratios of 100:1 or 200:1 in the cytoplasmic compartment, respectively, to maintain the redox conditions present at the end of the incubation period of the brains. According to their response to cytoplasmic [Ca2+], RyR channels obtained from both control and ischemic ER preparations were readily classifiable into low, moderate, or high activity channels. Representative current recordings taken from individual experiments showing the different responses to [Ca2+] of channels from control and ischemic brains are illustrated in Figure 2, whereas the Ca2+ dependence of the average Po* values are depicted in Figure 3. As illustrated in Figures 2 and 3, the three responses to Ca2+ displayed by RyR channels from both control and ischemic brains were analogous. Moreover, curve fitting of the data obtained with single RyR channels with the same Ca2+ response from either ischemic or control brains yielded similar parameter values (Table 1) (p > 0.09), showing that each one of the three types of response to Ca2+ was undistinguishable between channels from ischemic or control ER vesicles. The apparent affinities for activation and inhibition by Ca2+ were different, however, for each channel type (Table 1). Low activity channels displayed significantly higher Ka values than moderate activity channels, whereas moderate activity channels exhibited higher Ka values than high activity channels. Conversely, the Ki values for low activity channels were lower than those exhibited by moderate activity channels. The Ki values for high activity channels were >1 mm and could not be accurately determined because the highest [Ca2+] used in our experiments was 0.5 mm (Table 1, Fig. 3).
Figure 2.
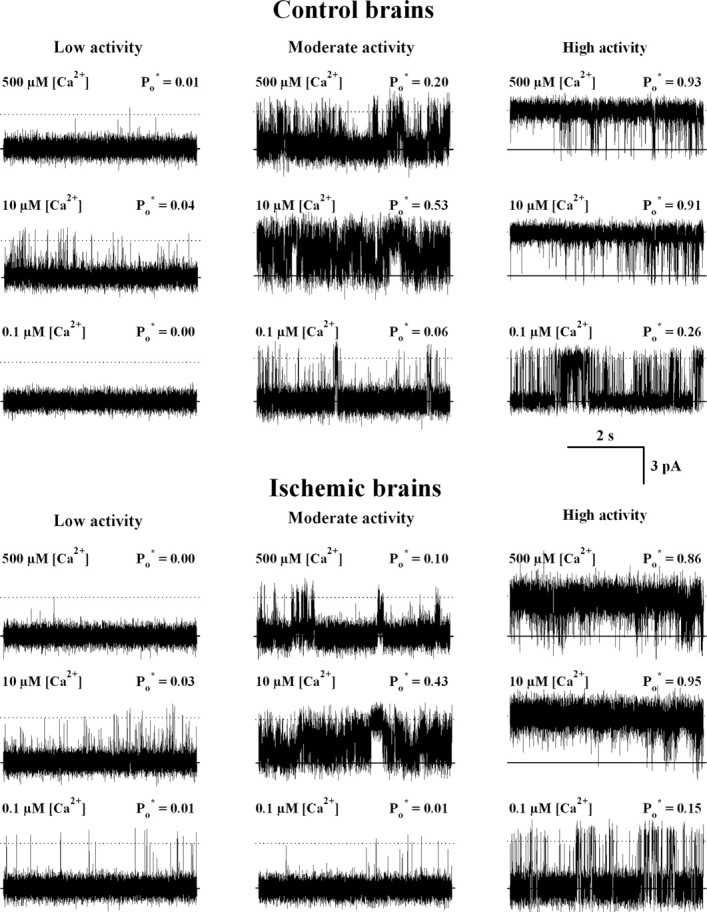
Representative current recordings of single RyR channels that displayed low, moderate, or high activity responses to cytoplasmic [Ca2+]. ER vesicles were obtained from isolated brains incubated in the absence of blood flow for 5 min at 37°C (ischemic) or at 4°C (controls). Five millimolar total glutathione with a GSH/GSSG ratio of 200:1 or 100:1 was added to all the solutions used in the ER isolation procedure for control and ischemic brains, respectively. Single-channel recordings were obtained with 4 mm total cis-glutathione in a GSH/GSSG ratio of 200:1 for control (top) or 100:1 for ischemic (bottom) brains. Average Po* values, calculated from at least 80 s of continuous recordings, are given at the top right of each trace. The lipid bilayer was held at 0 mV. Channels open upward.
Figure 3.
Responses to cytoplasmic [Ca2+] of RyR channels from control (open symbols) and ischemic (filled symbols) brains. Fractional open times (Po*) of low (circles), moderate (triangles), and high (diamonds) activity channels are depicted as a function of free [Ca2+]. Symbols and error bars depict mean and SE values, respectively. Continuous lines represent the best nonlinear fits to the equation in Materials and Methods of all individual experimental data values obtained for control channels with low, moderate, or high activity. All parameter values obtained are displayed in Table 1.
Table 1.
Fitting parameters for the three RyR channel responses
| Calcium response | Parameter | Ka (μm) | Ki (μm) | Pomax |
|---|---|---|---|---|
| Low | Control | 80 ± 8 | 17 ± 2 | 0.65b |
| Ischemic | 80 ± 19 | 12 ± 3 | 0.65b | |
| Moderate | Control | 10 ± 1a | 60 ± 8a | 1.0b |
| Ischemic | 14 ± 3a | 41 ± 8a | 1.0b | |
| High | Control | 0.33 ± 0.08a | 2350b | 1.0b |
| Ischemic | 0.32 ± 0.05a | 2350b | 1.0b |
Parameter values ± SE were obtained by fitting to the equation in Materials and Methods all individual data obtained with single channels from ischemic or control brains that displayed low, moderate, or high activity (see legend for Fig. 3).
aSignificant differences (p = 0.001) between corresponding parameter values were found. Parameter values of moderate activity channels from ischemic or control brains were compared with the respective values of low activity channels. Values of high Po channels from ischemic or control brains were compared with the respective values of moderate Po channels.
bParameter was fixed to the indicated value for data fitting (Bull et al., 2007).
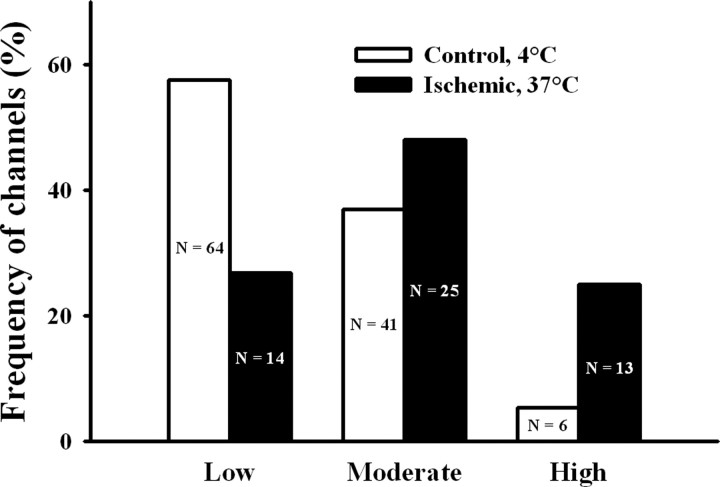
Albeit the three types of response to cytoplasmic Ca2+ were undistinguishable for single RyR channels from ischemic or control ER vesicles, their frequencies of emergence were quite different (Fig. 4). RyR channels from control ER displayed most frequently the low activity response (58%), followed by the moderate (37%) and high (5%) activity responses, whereas channels from ischemic ER displayed most frequently the moderate activity (48%), followed by the low (27%) and high (25%) activity responses.
Figure 4.
Frequency of incorporation of channels with low, moderate, or high activity from ischemic or control brains. Depicted on each bar appear the number (n) of channels displaying either response to cytoplasmic [Ca2+] recorded from ER vesicle preparations obtained of ischemic or control brains. The frequencies of emergence of the three types of responses differed between channels from ischemic and control brains (p < 0.001).
To test whether these changes were attributable to the use of different GSH/GSSG ratios during isolation of control or ischemic brains, we isolated ER vesicles from control brains (4°C) using a GSH/GSSG ratio of 100:1. Of the 27 channels recorded from three preparations, 63% displayed the low, 33% the moderate, and 4% the high activity behavior when using a cytoplasmic GSH/GSSG ratio of 100:1. This distribution was the same as that encountered with the usual control preparation (p = 0.856) and differed from the distribution obtained with ER vesicles from ischemic brains (p = 0.003). Moreover, single RyR channels from ER preparations from control or ischemic brains that displayed low or moderate activity when recorded with a GSH/GSSG ratio of 200:1 preserved in each case their Po* values after changing the GSH/GSSG ratio during recording to 100:1 (Fig. 5). Therefore, ischemia induced a marked change in the emergence of the different channel responses: it reduced the fraction of low activity channels from 58 to 27% and increased the fraction of high activity channels from 5 to 25%.
Figure 5.
Response to cytoplasmic [Ca2+] of single RyR channels measured sequentially at GSH/GSSH ratios of 200:1 and 100:1. Recordings showing single-channel activity from control (A) and ischemic (B) brains were obtained at the indicated cytoplasmic free [Ca2+]. Each channel was first recorded using a GSH/GSSG ratio of 200:1 in the cis-compartment (left traces) and after changing cis-GSH/GSSG ratio to 100:1 (right traces). Average Po* values, calculated from at least 120 s of continuous recordings, are given at the top right of each trace. The lipid bilayer was held at 0 mV. Channels open upward.
RyR isoforms present in the ER of rat brain cortex
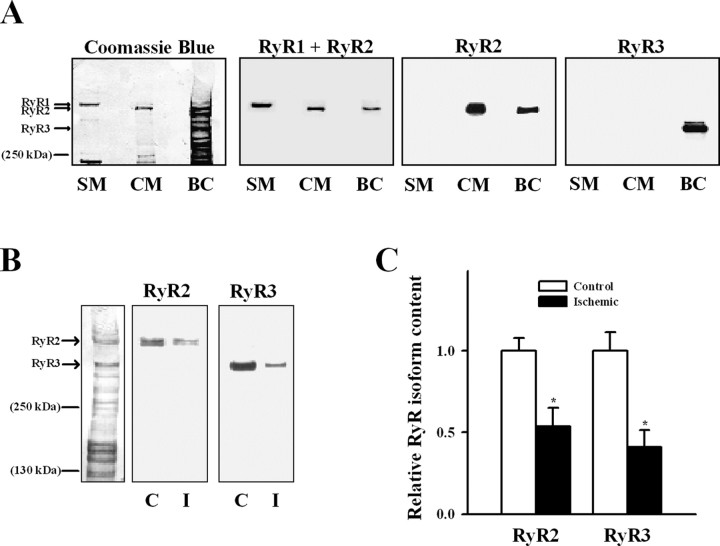
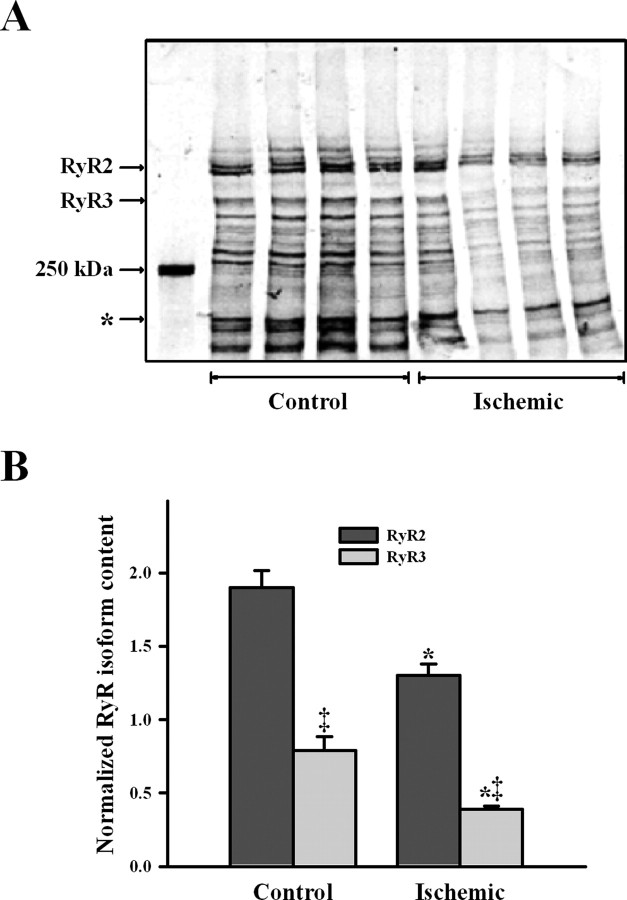
Figure 6A shows that specific antibodies to the different RyR isoforms recognized only two high molecular bands in ER vesicles from rat brain cortex. The RyR2-specific antibody recognized a band that migrated as cardiac RyR2, whereas the RyR3-specific antibody recognized a different band that migrated to a lower molecular mass position (Jeyakumar et al., 1998). The RyR1 isoform was not detected in our ER preparation, because the general antibody that recognizes both RyR1 and RyR2 only interacted with the band that corresponded to RyR2, which migrated more that the skeletal muscle RyR1 isoform. Western blot analysis revealed decreased RyR2 and RyR3 bands in ischemic when compared with control ER preparations (Fig. 6B), with reduced reactivity to antibodies raised against RyR2 or RyR3 (Fig. 6C). In agreement with these antibody results, the RyR2 and RyR3 protein bands stained with Coomassie blue displayed lower intensities in ischemic relative to control brains (Fig. 7A). Ischemia decreased RyR2 and RyR3 content to 68 ± 8 and 49 ± 8% of their respective control values (Fig. 7B) (p < 0.05); both reductions were of similar magnitude (p = 0.17). Total RyR content (RyR2 + RyR3) was lower (p = 0.01) in ischemic (1.7 ± 0.1) than in control (2.7 ± 0.2) brains. RyR3 represented ∼¼ of the total RyR content in both control (29 ± 6%) and ischemic (23 ± 3%) cortical ER (Fig. 7B) (p = 0.38).
Figure 6.
Presence of different RyR isoforms in ER vesicles. A, Proteins bands of SR from skeletal (SM) and cardiac (CM) muscle and ER from rat brain cortex (BC) were separated by gel electrophoresis and electrotransferred to a PVDF membrane (for details, see Materials and Methods). Reactivity to antibodies that recognize RyR1 together with RyR2 (RyR1 + RyR2), RyR2, or RyR3 are shown. After exposure to the different antibodies, the membrane was stained with Coomassie blue to reveal protein bands (first left blot). B, Reactivity of ER vesicles isolated from control (C) and ischemic (I) brain cortex to specific RyR2 or RyR3 antibodies. A Coomassie blue-stained membrane for control ER vesicles is shown on the left side. C, The RyR2 and RyR3 contents in ER of control and ischemic brains were estimated from Western blot analysis; values were normalized by their respective controls. *p < 0.05, content differed from the corresponding control.
Figure 7.
Ischemia reduced content of RyR isoforms in cortical ER. A, Coomassie blue-stained PVDF membrane. Each lane corresponds to different independent control or ischemic ER vesicle preparations. The density of the band, marked with an asterisk, was used to normalize the RyR2 and RyR3 bands in each lane. B, Mean ± SE values of normalized RyR2 and RyR3 contents in ER vesicles obtained from control or ischemic brains are depicted. *p < 0.05, values obtained in ischemic ER differed significantly from that obtained in control ER. ‡p < 0.01, RyR3 content differed from the corresponding RyR2 value.
As an independent method to evaluate total RyR content in cortical ER vesicles, we measured the binding density of [3H]ryanodine, a plant alkaloid that preferentially binds to open RyR channels. Under conditions of maximal channel activation, ischemia reduced [3H]ryanodine binding density from 0.63 ± 0.05 pmol/mg (obtained with five independent control ER vesicle preparations) to 0.41 ± 0.04 pmol/mg (n = 7; p = 0.01). Therefore, [3H] binding from ischemic ER was 65 ± 12% of control ER, a value comparable with the decrease caused by ischemia (63 ± 9%) in total RyR (RyR2 + RyR3) protein band densities.
SH modification of cortical RyR isoforms
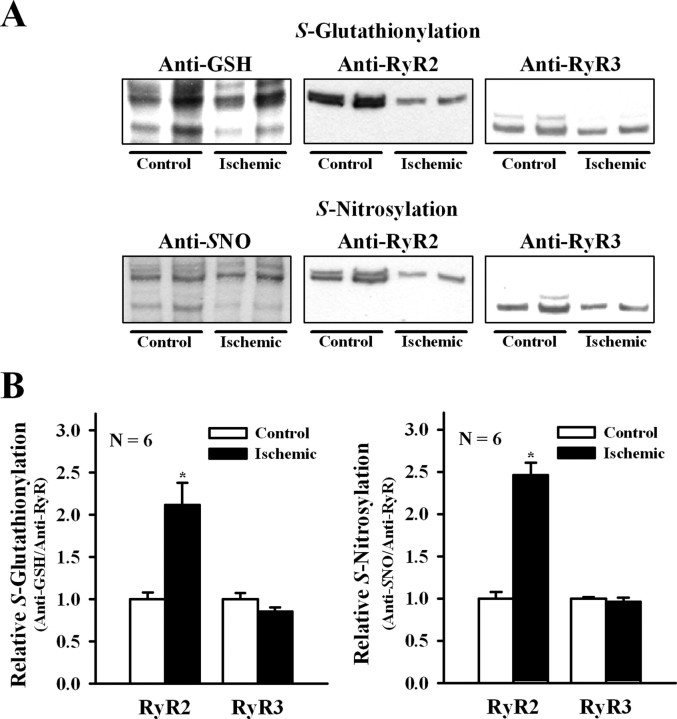
Our current findings show that ischemia increased the oxidative cellular tone and favored the appearance of channels displaying higher activation by Ca2+. Accordingly, we evaluated the redox state of the two RyR isoforms present in ischemic and control brains. As illustrated in Figure 8, ischemia increased significantly RyR2 S-glutathionylation and S-nitrosylation (p ≤ 0.01) but did not modify the endogenous levels of RyR3 S-glutathionylation and S-nitrosylation (p > 0.14).
Figure 8.
S-Glutathionylation and S-nitrosylation of RyR isoforms during ischemia. A, Representative Western blots in ER vesicles obtained from control or ischemic brains probed with anti-GSH or anti-nitrosocysteine (SNO). Membranes were stripped and sequentially probed with anti-RyR2 and anti-RyR3 antibodies as detailed in Materials and Methods. B, Mean ± SE values of normalized S-glutathionylation (anti-GSH/anti-RyR isoform) and S-nitrosylation (anti-SNO/anti-RyR isoform) calculated from blots like those shown in A. *p < 0.05.
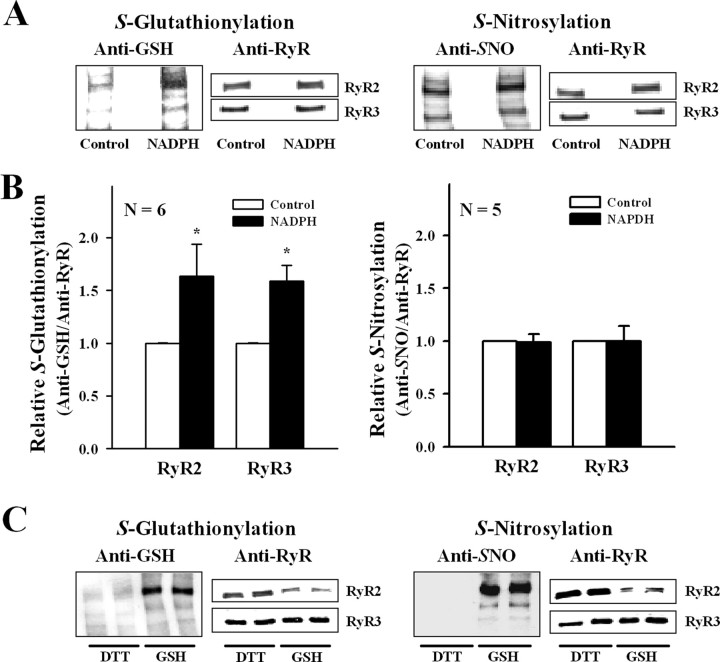
In the presence of 0.1 mm NADPH and 0.1 mm total glutathione (GSH/GSSG ratio of 200:1), ER vesicles isolated from control brains produced superoxide anion during at least 5 min of incubation and at a constant rate of 64 ± 8 nmol · mg−1 · min−1 (n = 4). To reproduce in vitro the SH modifications of RyR found during ischemia, we preincubated control ER vesicles with agents that selectively promote either S-glutathionylation or S-nitrosylation. For this purpose, we incubated control ER vesicles for 3 min at 30°C with NADPH, which, acting as a substrate for the NADPH oxidase, enhances RyR2 S-glutathionylation in cardiac SR vesicles (Sánchez et al., 2005). As shown in Figure 9, NADPH increased S-glutathionylation levels of RyR2 and RyR3, whereas the endogenous S-nitrosylation levels of both isoforms remained unchanged. In five independent experiments in which ER vesicles were preincubated with NADPH, RyR channels responded to cytoplasmic [Ca2+] with moderate or high activity; low activity channels were not observed. Moderate activity channels displayed, as usual, maximal Po values of 0.60 ± 0.18 at 10 μm [Ca2+] and were inhibited at 500 μm [Ca2+] (Po of 0.11 ± 0.06), whereas high activity channels reached maximal Po values of 0.95 ± 0.02 (mean ± range; n = 2) at 10 μm [Ca2+] and were not inhibited at 500 μm [Ca2+] (Po = 0.81 ± 0.13; n = 2). As shown in Table 2, 60% of the channels responded to Ca2+ with moderate activity and 40% with high activity; thus, single low activity channels, the most frequent channel response observed in control ER, were not observed after incubation with NADPH. This distribution resembles that found in ischemic ER and differs clearly (p = 0.003) from that displayed by control ER (Table 2).
Figure 9.
S-Glutathionylation and S-nitrosylation of RyR isoforms. A, Representative Western blots in control ER vesicles incubated for 3 min at 30°C without (Control) or with 100 μm NADPH and probed with anti-GSH (left) or anti-nitrosocysteine antibody (Anti-SNO, right). Membranes were stripped and sequentially probed with anti-RyR2 and anti-RyR3 antibodies, as detailed in Materials and Methods. B, Mean ± SE value of normalized S-glutathionylation (anti-GSH/anti-RyR isoform) and S-nitrosylation (anti-SNO/anti-RyR isoform) calculated from blots like those shown in A. C, Representative Western blots of ER vesicles isolated with DTT from brains not preincubated without blood flow or isolated with GSH/GSSG (GSH) from control brains preincubated at 4°C for 5 min, and probed with anti-GSH (left) or anti-SNO (right). Membranes were stripped and sequentially probed with anti-RyR2 and anti-RyR3 antibodies as detailed in Materials and Methods. *p < 0.05.
Table 2.
Number of low, moderate, and high activity channels incorporated from ER vesicles
| Condition | Calcium response |
||
|---|---|---|---|
| Low | Moderate | High | |
| Control | 64 | 41 | 6 |
| Ischemic* | 14 | 25 | 13 |
| NADPH* | 0 | 3 | 2 |
| NOR-3 | 2 | 2 | 0 |
Single RyR channels recorded after fusion of ER vesicles obtained from control or ischemic brains and of ER vesicles from control brains preincubated with NADPH or NOR-3.
*p < 0.005, the distribution of channel responses differed significantly from control.
Preincubation of control ER for 5 min at 25°C with 100 μm NOR-3 as NO donor increased by 1.5 ± 0.2-fold (mean ± range; n = 2) RyR2 S-nitrosylation levels but did not modify RyR3 endogenous levels (1.1 ± 0.3; n = 2). However, the frequency of obtaining the different RyR channel responses to Ca2+ did not change; 50% of the channels displayed low activity and 50% moderate activity, and no high activity channel was recorded (Table 2).
ER vesicles isolated from brains not subjected to a preincubation period without blood flow and isolated using 5 mm DTT during all isolation steps displayed negligible endogenous RyR SH modifications (Fig. 9C). The frequencies of emergence of the three responses to Ca2+ after fusion of ER isolated with DTT (77, 22, and 1% for low, moderate, and high activity channels, respectively) (Bull et al., 2007) differs from the frequencies found here with control ER isolated using physiological GSH/GSSG ratios (p = 0.02). The very low endogenous levels of S-glutathionylation and/or S-nitrosylation displayed by the RyR isoforms present in ER isolated with DTT may underlie their lower degree of Ca2+ activation when compared with RyR channels from control ER used in the present work.
Discussion
Summary of main findings
In a rat model of global cerebral ischemia without recirculation, we show, for the first time, that 5 min of ischemia increased fivefold the probability of finding RyR channels that displayed high activity in response to cytoplasmic Ca2+ when compared with controls, which seldom yielded high activity channels. Ischemia reduced the GSH/GSSG ratio (from ∼200 to ∼130) in the isolated tissue and decreased by 32 and 51% the density of the RyR2 and RyR3 protein bands, respectively. Ischemia also enhanced RyR2 redox modifications by increasing at least twofold its S-glutathionylation and S-nitrosylation levels over the endogenous values but did not modify the endogenous levels of RyR3 S-glutathionylation and S-nitrosylation relative to the control. Incubation of control vesicles with NADPH, which increased only S-glutathionylation levels of RyR2 and RyR3, yielded only moderate or high activity channels. On the contrary, although incubation of control ER with NOR-3 increased RyR2 S-nitrosylation, the frequencies of emergence of the different channel responses to Ca2+ did not change when compared with untreated controls.
Brain tissue redox state during ischemia
The GSH/GSSG ratios of ∼200 found in brains exposed to 37°C or 4°C for 2 min are within the range of values reported previously in brains from normal young rats (Lipton et al., 2003; Calabrese et al., 2004). The maintenance of GHS/GSSG ratios of ∼200 for at least 5 min at 4°C strongly suggests that brain incubation at low temperature prevents the change in global cellular redox state produced by our model of cerebral ischemia, probably by reducing free radical formation (Lei et al., 1997; McManus et al., 2004). Therefore, the preservation of a highly reduced intracellular environment may explain, at least in part, the neuronal protection afforded by hypothermia applied during an ischemic insult and reported previously for both in vivo and in vitro models (Lei et al., 1997; McManus et al., 2004). The maintenance of the GSH/GSSG ratio at values of ∼130, without additional decrease, observed both at 37°C and 4°C after 15 min in the absence of blood flow, may be explained by decreased ROS production caused by tissue oxygen depletion (Teilum et al., 2007).
Enhanced response of single RyR channels to cytoplasmic [Ca2+] after ischemia
Ischemia did not produce a new channel response to Ca2+ but increased markedly the relative frequency of appearance of single RyR channels with high activity. As discussed below, this increase is possibly the result of RyR redox modifications, which are known to modify RyR activity (Donoso et al., 2000; Eu et al., 2000; Xia et al., 2000; Pessah et al., 2002; Aracena et al., 2003). In particular, oxidation or alkylation of critical SH residues with dithiodipyridine or thimerosal, respectively, causes single RyR channel from rat brain cortex to display higher degrees of activation in response to Ca2+ (Marengo et al., 1998; Bull et al., 2003, 2007).
RyR isoforms present in rat brain ER
In accordance with previous findings in rabbit and bovine brain cortex (Giannini et al., 1995; Murayama and Ogawa, 1996), ER vesicles from rat brain cortex contained the RyR2 and RyR3 isoforms. As reported in brain tissue obtained from other mammals (Furuichi et al., 1994), RyR2 was the most abundant isoform present in rat brain cortex; however, RyR3 represented ∼30% of the total RyR protein content, a value higher than expected based on Northern blot analysis (Giannini et al., 1995). Ischemia promoted in only 5 min a reduction in the content of both RyR isoforms in cortical vesicles. The decrease in [3H]ryanodine binding to ER isolated from ischemic brains found in this work agrees with a report showing that 15 min of cerebral ischemia reduce by ∼30% [3H]ryanodine binding to gerbil hippocampal CA1 neurons (Nozaki et al., 1999). Noteworthy, and in agreement with the current results, after 50 min of ischemia, SR vesicles isolated from dog myocardium also exhibit increased activation by Ca2+ of RyR2 channels concurrently with ∼50% decreased RyR2 content (Domenech et al., 2003). Although we did not explore here the mechanisms responsible for the fast reduction in vesicular RyR content, ischemic conditions may enhance their degradation by the proteasome (Mackrill, 1998). The reduction in RyR content may reflect a compensatory cellular mechanism to counteract the considerable increase in RyR channels with high activity.
SH modification of RyR isoforms
As reported previously, ischemia increases the production of ROS and reactive nitrogen species (RNS) (Lei et al., 1997; McManus et al., 2004; Lo et al., 2005; Blomgren and Hagberg, 2006). Both ROS and RNS participate in normal and pathologic redox signaling and may modify RyR, among other protein targets with cysteine residues highly reactive at physiological pH (Liu et al., 1994). S-Glutathionylation and/or S-nitrosylation have been reported in skeletal RyR1 and cardiac RyR2 (Hidalgo et al., 2002; Aracena et al., 2003; Sánchez et al., 2005). Here, we report for the first time that RyR2 and RyR3 isoforms present in rat brain cortex exhibit endogenous levels of S-glutathionylation and S-nitrosylation, yet only RyR2 increased its S-glutathionylation and S-nitrosylation levels after ischemia. In contrast, incubation of control ER vesicles with NADPH enhanced S-glutathionylation of both isoforms. These results suggest the existence of intracellular compartmentalization of ROS/NO production in brain tissue, which may selectively modify RyR2 and RyR3 isoforms, because they are differentially distributed in rodent brain cortex (Furuichi et al., 1994). Accordingly, we propose that the RyR2 isoform may be more readily accessible to the cellular sources of ROS that are activated by ischemia. Hydrogen peroxide, synthesized from superoxide anion during ER incubation with NADPH, could lead to S-glutathionylation of RyR isoforms in the presence of glutathione via a sulfenic acid residue intermediate (Bindoli et al., 2008). In fact, hydrogen peroxide produces S-glutathionylation of RyR in hippocampal neurons in culture and in skeletal SR vesicles incubated in the presence of glutathione (Aracena et al., 2005; Kemmerling et al., 2007).
Correlation between RyR redox modifications and Ca2+ activation
Increased RyR2 S-glutathionylation correlated with the enhanced emergence of high activity channels, as seen in RyR from ischemic ER and control ER preincubated with NADPH. In contrast, increased S-nitrosylation of RyR2 by NOR-3 did not change the frequency distribution of channel responses to Ca2+. Therefore, we propose that ischemia-induced RyR2 S-glutathionylation underlies the increased emergence of high activity RyR channels and the accompanying reduction of low activity channels. This proposal is further supported by the low S-glutathionylation level of RyR2 in ER vesicles isolated with DTT, which display with higher frequency low activity channels and with very low frequency the high activity channels (Bull et al., 2007) when compared with RyR from ER isolated from brains exposed to brief interruption of blood flow at 4°C.
Because RyR2 represents >70% of total RyR content in cortical ER, ischemia-induced S-glutathionylation of RyR2 may be sufficient to explain the changes in the frequencies of emergence of the Ca2+ responses. We cannot exclude, however, the possible involvement of other redox modifications in the increased response to Ca2+ of RyR channels from ischemic brains such as the formation of disulfide bonds in RyR tetramers. The shift from low to moderate and from moderate to high activity responses of single channels during ischemia could reflect an allosteric increase, presumably attributable to enhanced RyR2 S-glutathionylation, in the affinity of Ca2+ binding to activation sites (reduced Ka values), associated with a decreased binding affinity of Ca2+ to inhibitory sites (increased Ki values). These interpretations agree with the effects of S-glutathionylation reported in skeletal RyR1 (Hidalgo et al., 2002; Aracena et al., 2003). In summary, the present results further support the hypothesis that the three Ca2+ responses exhibited by RyR channels arise from discrete redox states of the channel protein (Marengo et al., 1998); higher responses could be favored by physiological or pathological cellular production of reactive species.
Pathophysiological consequences
In our study, only 5 min of global ischemia increased considerably the fraction of RyR channels highly activated by micromolar cytoplasmic [Ca2+], an effect presumably attributable to enhanced RyR2 S-glutathionylation. The importance of our results resides in the fact that, at the concentrations of Mg2+ and ATP present in the cytoplasm, only high activity channels, such as those that preferentially emerged during ischemia, are sufficiently activated by Ca2+ to sustain CICR (Bull et al., 2007). Previous experiments, showing that RyR inhibition with dantrolene reduces the sustained [Ca2+] increase and the subsequent neuronal death in animal models of ischemia, support the hypothesis that RyR channels mediate CICR during ischemia (Frandsen and Schousboe, 1991; Zhang et al., 1993; Wei and Perry, 1996; Yano et al., 2001; Clodfelter et al., 2002; Nakayama et al., 2002; Li et al., 2005). We propose that local production of reactive species caused by ischemia initially increases markedly the high activity response of RyR channels by S-glutathionylation of RyR2 and thus facilitates RyR-mediated CICR in brain cortex and steadily amplifies the cytoplasmic [Ca2+] increase produced by ischemia-enhanced Ca2+ entry. A subsequent decrease in total RyR mass (∼35%) would only partially counteract RyR-mediated amplification of Ca2+ entry signals. Moreover, RyR-amplified [Ca2+] increase during 2–3 min could play a role in cerebral preconditioning, because cytoplasmic [Ca2+] increases and ROS have been implicated in the delayed ischemic tolerance induced by short periods of brain ischemia (Nandagopal et al., 2001; Tauskela and Morley, 2004; Furuichi et al., 2005; Pérez-Pinzon et al., 2005). However, a period of 5 min of ischemia that usually produces irreversible neuronal damage (Tauskela and Morley, 2004) may contribute to promote cell death through enhanced RyR-mediated CICR.
Footnotes
This work was supported by Fondo Nacional de Desarrollo Científico y Tecnológico Grants 1040717 and 1080497 and Fondo de Investigación Avanzada en Areas Prioritarias Grant 15010006. We gratefully acknowledge the technical assistance of Luis Montecinos.
References
- Aracena P, Sánchez G, Donoso P, Hamilton SL, Hidalgo C. S-glutathionylation decreases Mg2+ inhibition and S-nitrosylation enhances Ca2+ activation of RyR1 channels. J Biol Chem. 2003;278:42927–42935. doi: 10.1074/jbc.M306969200. [DOI] [PubMed] [Google Scholar]
- Aracena P, Tang W, Hamilton SL, Hidalgo C. Effects of S-glutathionylation and S-nitrosylation on calmodulin binding to triads and FKBP12 binding to type 1 calcium release channels. Antioxid Redox Signal. 2005;7:870–881. doi: 10.1089/ars.2005.7.870. [DOI] [PubMed] [Google Scholar]
- Aracena-Parks P, Goonasekera SA, Gilman CP, Dirksen RT, Hidalgo C, Hamilton SL. Identification of cysteines involved in S-nitrosylation, S-glutathionylation, and oxidation to disulfides in ryanodine receptor Type 1. J Biol Chem. 2006;281:40354–40368. doi: 10.1074/jbc.M600876200. [DOI] [PubMed] [Google Scholar]
- Bano D, Nicotera P. Ca2+ signals and neuronal death in brain ischemia. Stroke. 2007;38(Suppl 2):674–676. doi: 10.1161/01.STR.0000256294.46009.29. [DOI] [PubMed] [Google Scholar]
- Behrens MI, Finkelstein JP, Sánchez G, Donoso P, Bull R. Ischemia enhances calcium sensitivity of ryanodine receptor channels from rat brain cortex. Neurology. 2006;66(Suppl 2):A160. doi: 10.1523/JNEUROSCI.2286-08.2008. [DOI] [PMC free article] [PubMed] [Google Scholar]
- Berridge MJ, Bootman MD, Lipp P. Calcium—a life and death signal. Nature. 1998;395:645–648. doi: 10.1038/27094. [DOI] [PubMed] [Google Scholar]
- Bindoli A, Fukuto JM, Forman HJ. Thiol chemistry in peroxidase catalysis and redox signaling. Antioxid Redox Signal. 2008;10:1549–1564. doi: 10.1089/ars.2008.2063. [DOI] [PMC free article] [PubMed] [Google Scholar]
- Blomgren K, Hagberg H. Free radicals, mitochondria, and hypoxia-ischemia in the developing brain. Free Radic Biol Med. 2006;40:388–397. doi: 10.1016/j.freeradbiomed.2005.08.040. [DOI] [PubMed] [Google Scholar]
- Bull R, Marengo JJ, Suárez-Isla BA, Donoso P, Sutko JL, Hidalgo C. Activation of calcium channels in sarcoplasmic reticulum from frog muscle by nanomolar concentrations of ryanodine. Biophys J. 1989;56:749–756. doi: 10.1016/S0006-3495(89)82722-5. [DOI] [PMC free article] [PubMed] [Google Scholar]
- Bull R, Marengo JJ, Finkelstein JP, Behrens MI, Alvarez O. SH oxidation coordinates subunits of rat brain ryanodine receptor channels activated by calcium and ATP. Am J Physiol Cell Physiol. 2003;285:C119–C128. doi: 10.1152/ajpcell.00296.2002. [DOI] [PubMed] [Google Scholar]
- Bull R, Finkelstein JP, Humeres A, Behrens MI, Hidalgo C. Effects of ATP, Mg2+ and redox agents on the Ca2+ dependence of RyR-channels from rat brain cortex. Am J Physiol Cell Physiol. 2007;293:C162–C171. doi: 10.1152/ajpcell.00518.2006. [DOI] [PubMed] [Google Scholar]
- Calabrese V, Scapagnini G, Ravagna A, Colombrita C, Spadaro F, Butterfield DA, Giuffrida Stella AM. Increased expression of heat shock proteins in rat brain during aging: relationship with mitochondrial function and glutathione redox state. Mech Ageing Dev. 2004;125:325–335. doi: 10.1016/j.mad.2004.01.003. [DOI] [PubMed] [Google Scholar]
- Clodfelter GV, Porter NM, Landfield PW, Thibault O. Sustained Ca2+-induced Ca2+-release underlies the post-glutamate lethal Ca2+ plateau in older cultured hippocampal neurons. Eur J Pharmacol. 2002;447:189–200. doi: 10.1016/s0014-2999(02)01843-5. [DOI] [PubMed] [Google Scholar]
- Domenech RJ, Sánchez G, Donoso P, Parra V, Macho P. Effect of tachycardia on myocardial sarcoplasmic reticulum and Ca2+ dynamics: a mechanism for preconditioning? J Mol Cell Cardiol. 2003;35:1429–1437. doi: 10.1016/j.yjmcc.2003.09.006. [DOI] [PubMed] [Google Scholar]
- Donoso P, Aracena P, Hidalgo C. Sulphydryl oxidation overrides Mg2+ inhibition of calcium-induced calcium release in skeletal muscle triads. Biophys J. 2000;79:279–286. doi: 10.1016/S0006-3495(00)76290-4. [DOI] [PMC free article] [PubMed] [Google Scholar]
- Dringen R. Metabolism and functions of glutathione in brain. Prog Neurobiol. 2000;62:649–671. doi: 10.1016/s0301-0082(99)00060-x. [DOI] [PubMed] [Google Scholar]
- Emptage N, Bliss TV, Fine A. Single synaptic events evoke NMDA receptor-mediated release of calcium from internal stores in hippocampal dendritic spines. Neuron. 1999;22:115–124. doi: 10.1016/s0896-6273(00)80683-2. [DOI] [PubMed] [Google Scholar]
- Eu JP, Sun J, Xu L, Stamler JS, Meissner G. The skeletal muscle calcium release channel: coupled O2 sensor and NO signaling functions. Cell. 2000;102:499–509. doi: 10.1016/s0092-8674(00)00054-4. [DOI] [PubMed] [Google Scholar]
- Frandsen A, Schousboe A. Dantrolene prevents glutamate cytotoxicity and Ca2+ release from intracellular stores in cultured cerebral cortical neurons. J Neurochem. 1991;56:1075–1078. doi: 10.1111/j.1471-4159.1991.tb02031.x. [DOI] [PubMed] [Google Scholar]
- Furuichi T, Furutama D, Hakamata Y, Nakai J, Takeshima H, Mikoshiba K. Multiple types of ryanodine receptor/Ca2+ release channels are differentially expressed in rabbit brain. J Neurosci. 1994;14:4794–4805. doi: 10.1523/JNEUROSCI.14-08-04794.1994. [DOI] [PMC free article] [PubMed] [Google Scholar]
- Furuichi T, Liu W, Shi H, Miyake M, Liu KJ. Generation of hydrogen peroxide during brief oxygen-glucose deprivation induces preconditioning neuronal protection in primary cultured neurons. J Neurosci Res. 2005;79:816–824. doi: 10.1002/jnr.20402. [DOI] [PubMed] [Google Scholar]
- Giannini G, Conti A, Mammarella S, Scrobogna M, Sorrentino V. The ryanodine receptor/calcium channel genes are widely and differentially expressed in murine brain and peripheral tissues. J Cell Biol. 1995;128:893–904. doi: 10.1083/jcb.128.5.893. [DOI] [PMC free article] [PubMed] [Google Scholar]
- Griffith OW. Determination of glutathione and glutathione disulfide using glutathione reductase and 2-vinylpyridine. Anal Biochem. 1980;106:207–212. doi: 10.1016/0003-2697(80)90139-6. [DOI] [PubMed] [Google Scholar]
- Hernández-Fonseca K, Massieu L. Disruption of endoplasmic reticulum calcium stores is involved in neuronal death induced by glycolysis inhibition in cultured hippocampal neurons. J Neurosci Res. 2005;82:196–205. doi: 10.1002/jnr.20631. [DOI] [PubMed] [Google Scholar]
- Hidalgo C, Jorquera J, Tapia V, Donoso P. Triads and transverse tubules isolated from skeletal muscle contain high levels of inositol 1,4,5-trisphosphate. J Biol Chem. 1993;268:15111–15117. [PubMed] [Google Scholar]
- Hidalgo C, Aracena P, Sanchez G, Donoso P. Redox regulation of calcium release in skeletal and cardiac muscle. Biol Res. 2002;35:183–193. doi: 10.4067/s0716-97602002000200009. [DOI] [PubMed] [Google Scholar]
- Jeyakumar LH, Copello JA, O'Malley AM, Wu GM, Grassucci R, Wagenknecht T, Fleischer S. Purification and characterization of ryanodine receptor 3 from mammalian tissue. J Biol Chem. 1998;273:16011–16020. doi: 10.1074/jbc.273.26.16011. [DOI] [PubMed] [Google Scholar]
- Kemmerling U, Muñoz P, Müller M, Sánchez G, Aylwin ML, Klann E, Carrasco MA, Hidalgo C. Calcium release by ryanodine receptors mediates hydrogen peroxide-induced activation of ERK and CREB phosphorylation in N2a cells and hippocampal neurons. Cell Calcium. 2007;41:491–502. doi: 10.1016/j.ceca.2006.10.001. [DOI] [PubMed] [Google Scholar]
- Lei B, Adachi N, Arai T. The effect of hypothermia on H2O2 production during ischemia and reperfusion: a microdialysis study in the gerbil hippocampus. Neurosci Lett. 1997;222:91–94. doi: 10.1016/s0304-3940(97)13349-3. [DOI] [PubMed] [Google Scholar]
- Li F, Hayashi T, Jin G, Deguchi K, Nagotani S, Nagano I, Shoji M, Chan PH, Abe K. The protective effect of dantrolene on ischemic neuronal cell death is associated with reduced expression of endoplasmic reticulum stress markers. Brain Res. 2005;1048:59–68. doi: 10.1016/j.brainres.2005.04.058. [DOI] [PubMed] [Google Scholar]
- Lipton JW, Gyawali S, Borys ED, Koprich JB, Ptaszny M, McGuire SO. Prenatal cocaine administration increases glutathione and alpha-tocopherol oxidation in fetal rat brain. Brain Res Dev Brain Res. 2003;147:77–84. doi: 10.1016/j.devbrainres.2003.08.006. [DOI] [PubMed] [Google Scholar]
- Liu G, Abramson JJ, Zable AC, Pessah IN. Direct evidence for the existence and functional role of hyperreactive sulfhydryls on the ryanodine receptor-triadin complex selectively labeled by the coumarin maleimide 7-diethylamino-3-(4′-maleimidylphenyl)-4-methylcoumarin. Mol Pharmacol. 1994;45:189–200. [PubMed] [Google Scholar]
- Lo EH, Moskowitz MA, Jacobs TP. Exciting, radical, suicidal: how brain cells die after stroke. Stroke. 2005;36:189–192. doi: 10.1161/01.STR.0000153069.96296.fd. [DOI] [PubMed] [Google Scholar]
- Mackrill JJ. Possible regulation of the skeletal muscle ryanodine receptor by a polyubiquitin binding subunit of the 26S proteasome. Biochem Biophys Res Commun. 1998;245:428–429. doi: 10.1006/bbrc.1998.8450. [DOI] [PubMed] [Google Scholar]
- Marengo JJ, Bull R, Hidalgo C. Calcium dependence of ryanodine-sensitive calcium channels from brain cortex endoplasmic reticulum. FEBS Lett. 1996;383:59–62. doi: 10.1016/0014-5793(96)00222-0. [DOI] [PubMed] [Google Scholar]
- Marengo JJ, Hidalgo C, Bull R. Sulfhydryl oxidation modifies the calcium dependence of ryanodine-sensitive calcium channels. Biophys J. 1998;74:1263–1277. doi: 10.1016/S0006-3495(98)77840-3. [DOI] [PMC free article] [PubMed] [Google Scholar]
- McManus T, Sadgrove M, Pringle AK, Chad JE, Sundstrom LE. Intraischaemic hypothermia reduces free radical production and protects against ischaemic insults in cultured hippocampal slices. J Neurochem. 2004;91:327–336. doi: 10.1111/j.1471-4159.2004.02711.x. [DOI] [PubMed] [Google Scholar]
- Moncada S, Erusalimsky JD. Does nitric oxide modulate mitochondrial energy generation and apoptosis? Nat Rev Mol Cell Biol. 2002;3:214–220. doi: 10.1038/nrm762. [DOI] [PubMed] [Google Scholar]
- Murayama T, Ogawa Y. Properties of RyR3 ryanodine receptor isoform in mammalian brain. J Biol Chem. 1996;271:5079–5084. doi: 10.1074/jbc.271.9.5079. [DOI] [PubMed] [Google Scholar]
- Nakayama R, Yano T, Ushijima K, Abe E, Terasaki H. Effects of dantrolene on extracellular glutamate concentration and neuronal death in the rat hippocampal CA1 region subjected to transient ischemia. Anesthesiology. 2002;96:705–710. doi: 10.1097/00000542-200203000-00029. [DOI] [PubMed] [Google Scholar]
- Nandagopal K, Dawson TM, Dawson VL. Critical role for nitric oxide signaling in cardiac and neuronal ischemic preconditioning and tolerance. J Pharmacol Exp Ther. 2001;297:474–478. [PubMed] [Google Scholar]
- Nozaki H, Tanaka K, Gomi S, Mihara B, Nogawa S, Nagata E, Kondo T, Fukuuchi Y. Role of the ryanodine receptor in ischemic brain damage-localized reduction of ryanodine receptor binding during ischemia in hippocampus CA1. Cell Mol Neurobiol. 1999;19:119–131. doi: 10.1023/A:1006924826572. [DOI] [PMC free article] [PubMed] [Google Scholar]
- Ouardouz M, Nikolaeva MA, Coderre E, Zamponi GW, McRory JE, Trapp BD, Yin X, Wang W, Woulfe J, Stys PK. Depolarization-induced Ca2+ release in ischemic spinal cord white matter involves L-type Ca2+ channel activation of ryanodine receptors. Neuron. 2003;40:53–63. doi: 10.1016/j.neuron.2003.08.016. [DOI] [PubMed] [Google Scholar]
- Pape HC, Munsch T, Budde T. Novel vistas of calcium-mediated signalling in the thalamus. Pflugers Arch. 2004;448:131–138. doi: 10.1007/s00424-003-1234-5. [DOI] [PubMed] [Google Scholar]
- Perez-Pinzon MA, Dave KR, Raval AP. Role of reactive oxygen species and protein kinase C in ischemic tolerance in the brain. Antioxid Redox Signal. 2005;7:1150–1157. doi: 10.1089/ars.2005.7.1150. [DOI] [PubMed] [Google Scholar]
- Pessah IN, Kim KH, Feng W. Redox sensing properties of the ryanodine receptor complex. Front Biosci. 2002;7:a72–a79. doi: 10.2741/A741. [DOI] [PubMed] [Google Scholar]
- Sánchez G, Hidalgo C, Donoso P. Kinetic studies of calcium-induced calcium release in cardiac sarcoplasmic reticulum vesicles. Biophys J. 2003;84:2319–2330. doi: 10.1016/S0006-3495(03)75037-1. [DOI] [PMC free article] [PubMed] [Google Scholar]
- Sánchez G, Pedrozo Z, Domenech RJ, Hidalgo C, Donoso P. Tachycardia increases NADPH oxidase activity and RyR2 S-glutathionylation in ventricular muscle. J Mol Cell Cardiol. 2005;39:982–991. doi: 10.1016/j.yjmcc.2005.08.010. [DOI] [PubMed] [Google Scholar]
- Tauskela JS, Morley P. On the role of Ca2+ in cerebral ischemic preconditioning. Cell Calcium. 2004;36:313–322. doi: 10.1016/j.ceca.2004.02.008. [DOI] [PubMed] [Google Scholar]
- Teilum M, Krogh M, Wieloch T, Mattiasson G. Hypothermia affects translocation of numerous cytoplasmic proteins following global cerebral ischemia. J Proteome Res. 2007;6:2822–2832. doi: 10.1021/pr070057l. [DOI] [PubMed] [Google Scholar]
- Verkhratsky A. Physiology and pathophysiology of the calcium store in the endoplasmic reticulum of neurons. Physiol Rev. 2005;85:201–279. doi: 10.1152/physrev.00004.2004. [DOI] [PubMed] [Google Scholar]
- Verkhratsky A, Toescu EC. Endoplasmic reticulum Ca2+ homeostasis and neuronal death. J Cell Mol Med. 2003;7:351–361. doi: 10.1111/j.1582-4934.2003.tb00238.x. [DOI] [PMC free article] [PubMed] [Google Scholar]
- Wei H, Perry DC. Dantrolene is cytoprotective in two models of neuronal cell death. J Neurochem. 1996;67:2390–2398. doi: 10.1046/j.1471-4159.1996.67062390.x. [DOI] [PubMed] [Google Scholar]
- Xia R, Stangler T, Abramson JJ. Skeletal muscle ryanodine receptor is a redox sensor with a well-defined redox potential, which is sensitive to channel modulators. J Biol Chem. 2000;275:36556–36561. doi: 10.1074/jbc.M007613200. [DOI] [PubMed] [Google Scholar]
- Xing H, Azimi-Zonooz A, Shuttleworth CW, Connor JA. Caffeine releasable stores of Ca2+ show depletion prior to the final steps in delayed CA1 neuronal death. J Neurophysiol. 2004;92:2960–2967. doi: 10.1152/jn.00015.2004. [DOI] [PubMed] [Google Scholar]
- Xiong ZG, Chu XP, Simon RP. Acid sensing ion channels–novel therapeutic targets for ischemic brain injury. Front Biosci. 2007;12:1376–1386. doi: 10.2741/2154. [DOI] [PubMed] [Google Scholar]
- Yano T, Nakayama R, Imaizumi T, Terasaki H, Ushijima K. Dantrolene ameliorates delayed cell death and concomitant DNA fragmentation in the rat hippocampal CA1 neurons subjected to mild ischemia. Resuscitation. 2001;50:117–125. doi: 10.1016/s0300-9572(00)00369-5. [DOI] [PubMed] [Google Scholar]
- Zhang L, Andou Y, Masuda S, Mitani A, Kataoka K. Dantrolene protects against ischemic, delayed neuronal death in gerbil brain. Neurosci Lett. 1993;158:105–108. doi: 10.1016/0304-3940(93)90623-s. [DOI] [PubMed] [Google Scholar]


