

Abstract
Mammalian neuromuscular junctions are useful model synapses to study the relationship between synaptic structure and function, although these have rarely been studied together at the same synapses. To do this, we generated transgenic lines of mice in which the thy1.2 promoter drives expression of synaptopHluorin (spH) as a means of optically measuring synaptic vesicle distribution and release. SpH is colocalized with other synaptic vesicle proteins in presynaptic terminals and does not alter normal synaptic function. Nerve stimulation leads to readily detectable and reproducible fluorescence changes in motor axon terminals that vary with stimulus frequency and, when compared with electrophysiological recordings, are reliable indicators of neurotransmitter release. Measurements of fluorescence intensity changes reveal a surprising amount of heterogeneity in synaptic vesicle release throughout individual presynaptic motor axon terminals. Some discrete terminal regions consistently displayed a greater rate and extent of release than others, regardless of stimulation frequency. The amount of release at a particular site is highly correlated to the relative abundance of synaptic vesicles there, indicating that a relatively constant fraction of the total vesicular pool, ∼30%, is released in response to activity. These studies reveal previously unknown relationships between synaptic structure and function at mammalian neuromuscular junctions and demonstrate the usefulness of spH expressing mice as a tool for studying neuromuscular synapses in adults, as well as during development and diseases that affect neuromuscular synaptic function.
Keywords: pHluorin, synaptic vesicle, exocytosis, vesicle recycling, neuromuscular, synapse
Introduction
Proper functioning of the nervous system is dependent on effective synaptic communication between cells. Synapses are highly specialized cellular components whose function is closely tied to their unique structure. Of particular interest is the relationship between the presynaptic organization of neurotransmitter-filled vesicles and their release in response to activity (Delgado et al., 2000; Schikorski and Stevens, 2001; Rizzoli and Betz, 2004). One of the best studied systems for examining this relationship is the mammalian neuromuscular junction, the synapse between motor neurons and skeletal muscle fibers. Because this synapse is large and easily accessible, it is an attractive system for investigation.
Many early studies of neuromuscular junction structure and function were limited by the fact that these two features could not be simultaneously studied at the same junctions (Wood and Slater, 1997, 2001). Thus, presynaptic function was analyzed independently of structural information, and vice versa. Previously, the use of FM1–43 and related activity-dependent dyes has helped overcome this limitation and has advanced our understanding of synaptic structure and function (Ribchester et al., 1994; Reid et al., 1999, 2003; Polo-Parada et al., 2001). The effectiveness of these dyes, however, is limited by a number of technical issues, namely high nonspecific labeling and the time required to wash off excess dye after vesicle loading (Gaffield and Betz, 2006).
To circumvent these limitations we generated transgenic lines of mice in which synaptopHluorin (spH), a pH-sensitive variant of green fluorescent protein (GFP) tethered to the vesicular membrane protein vesicle-associated membrane protein 2 (VAMP2) (Miesenbock et al. 1998), is expressed in motor nerve terminals using the thy1.2 promoter (Feng et al., 2000; Li et al., 2005). This construct has been extensively used to investigate synaptic vesicle properties within hippocampal neurons in vitro (Sankaranarayanan and Ryan, 2000, 2001; Fernandez-Alfonso et al., 2006) and at Drosophila (Poskanzer et al., 2003; Reiff et al., 2005) and mouse (Tabares et al., 2007) neuromuscular junctions in vivo. The pH shift that occurs during exocytosis, when the acidic vesicle interior is exposed to the neutral extracellular space, leads to an increase in spH fluorescence. Fluorescence subsequently returns to resting levels as surface spH molecules are endocytosed and reacidified (Miesenbock et al., 1998). Thus, by monitoring activity-driven fluorescence changes, vesicle release across sites within individual motor nerve terminals can be measured. Furthermore, because spH molecules are recycled at the synapse, individual junctions can be repeatedly analyzed.
In this study, we report that spH is highly localized with endogenous synaptic vesicle proteins to presynaptic motor nerve terminals and does not alter normal synaptic function. Additionally, activity induced spH fluorescence changes appear to be a reliable indicator of neurotransmission. Analyses of these changes reveal that vesicle release is not uniform across the presynaptic terminal. Rather, there are distinct regions that consistently display a greater rate and extent of release than others. We also found that the amount of release at a site is correlated to the relative abundance of synaptic vesicles there, indicating that a constant fraction of the total vesicular pool is released with neural activity.
Materials and Methods
Generation of Thy1.2-spH transgenic mice.
The superecliptic spH construct (Miesenbock et al., 1998) was subcloned into a thy-1.2 expression cassette (Vidal et al., 1990; Caroni, 1997) between exons II and IV. The thy1-spH DNA fragment was excised from the parent vector by digestion with PvuI and NotI and purified with an Elutip column (Schleicher and Shuell, Keene, NH). Pronuclear injection of the purified thy1-spH fragment into mouse embryos was followed by transplantation into the uterus of foster female mice, and transgenic animals were obtained. Genotyping was performed 1–2 weeks after birth to identify animals carrying the spH transgene. Genomic DNA was extracted from tail samples, and PCRs were performed using primers to amplify a 475 bp fragment of the pHluorin segment of the transgene (5′- tgg aga ggg tga agg tga tgc aac and 5′- ggt ctg cta gtt gaa cgc ctc cat ctt). Mice carrying this gene were bred into the C57BL/6J (The Jackson Laboratory, Bar Harbor, ME) background for at least three generations before analysis. Transgenic mice were maintained in a hemizygotic state for additional breeding and experiments.
Nerve-muscle preparations for live imaging and electrophysiology.
Young adult transgenic thy1-spH mice (6–8 weeks) were anesthetized with a ketamine/xylazine mixture (17.4 mg/ml ketamine, 2.6 mg/ml xylazine, 0.1 cc/10 g mouse weight; Phoenix Pharmaceuticals, St. Joseph, MO). Sternomastoid muscles and a 2–3 mm length of the attached muscle nerve were rapidly dissected and pinned out onto a Sylgard-lined Petri dish superfused with oxygenated (95% O2–5% CO2) Rees' Ringers solution [containing (in mm) 110 NaCl, 5 KCl, 1 MgCl2, 25 NaHCO3, 2 CaCl2, and 11 glucose, pH = 7.4] (Rees, 1978). The nerve was placed into a suction electrode for stimulation, which was controlled by a Master 8 device and stumulus isolation units (AMPI, Jerusalem, Israel). The viability of the preparation was assessed by visual confirmation of stimulus-induced muscle twitches at 1 Hz. All experiments were performed at room temperature.
Live imaging of spH fluorescence changes.
Neuromuscular junctions in live preparations were imaged using an upright epifluorescence microscope (DMRX; Leica, Heidelberg, Germany) equipped with a 14-bit EM-CCD camera (C9100-02; Hamamatsu, Hamamatsu City, Japan), a 63×/0.95 numerical aperture water-immersion objective (Carl Zeiss, Mainz, Germany), and a 100 W mercury lamp. Additionally, a computer controlled shutter (Lambda 10; Sutter Instruments, Novato, CA) and several neutral density filters were used to reduce excess illumination and to lessen photobleaching and/or phototoxic effects. Most experiments were performed with illumination attenuated by at least 75%. Postsynaptic acetylcholine receptors (AChRs) were labeled by a brief (1 min) application of 10 μg/ml Alexa 594-conjugated α-bungarotoxin (Al594-αbtx; Invitrogen, Carlsbad, CA) to facilitate identification of junctions for imaging. Muscle fiber contractions during stimulation and imaging were blocked with 2 μm curare (Sigma, St. Louis, MO). Superficial spH expressing neuromuscular junctions were identified for study using appropriate filters (spH, excitation, 470/40 nm; emission, 535/50 nm; AChRs, excitation, 540/40 nm, emission, LP 590 nm; Chroma Technology, Rockingham, VT). The muscle nerve was stimulated with frequencies between 10 and 50 Hz and junctions were imaged at a rate of 1 Hz (200 ms per exposure, 2 × 2 binning) for fixed periods of time. Images were acquired and analyzed using interactive software (MetaMorph; Molecular Devices, Sunnyvale, CA). For experiments in which the same terminal was stimulated and imaged multiple times, the preparation was allowed to rest for several minutes between trials to allow for the complete recovery of baseline fluorescence levels. An attempt to correct for any focal drift occurring during this interval was made by manually readjusting the stage height before imaging until the original plane of focus was obtained, although a slight variability was sometimes unavoidable between trials. For experiments examining the effects of ammonium chloride (NH4Cl) on spH fluorescence, 50 mm NaCl in normal Rees' Ringers solution was replaced with 50 mm NH4Cl. The preparation was allowed to equilibrate for 30 s in the new solution before imaging.
Image analysis.
Image analysis and fluorescence intensity measurements were performed with MetaMorph software. Neuromuscular junction (NMJ) images were manually aligned and background subtracted using a region adjacent to the terminal. NMJs that showed focal drift along the z-axis during time-lapse imaging were excluded from analysis. Most NMJs were also intensity thresholded and masks created to exclude as many out of focus areas as possible before analysis. In a few experiments, NMJs were analyzed using regions of interest (ROIs). ROIs of 10–20 pixels were manually drawn over the terminal based on raw florescence signals. All measurements were performed on the original images, although many were processed for display using a low-pass Gaussian filter with a bin size of 3 × 3 pixels. All values are expressed as mean ± SEM.
SpH “hotspots” within a terminal were defined as all areas >3 × 3 pixels with an average intensity greater than two SDs above the mean fluorescence of the terminal. For experiments that examined a terminal's hotspots over a series of different stimulus frequencies or durations, all of the images in the series were averaged and the hotspot locations were determined by applying these criteria to the averaged image. These spots were then mapped onto the identical locations in the original images before making intensity measurements. A similar analytical approach was used recently to address related questions at the mouse NMJ (Tabares et al., 2007).
Electrophysiological recordings of neuromuscular synaptic transmission.
To prevent contractions, muscle preparations were incubated in 2 μm μ-conotoxin GIIIB (Bachem, Torrance, CA) for 30 min before recording. Electrophysiological recordings were made using pulled glass microelectrodes (20–40 MΩ) filled with a 3 m KCl solution. To elicit evoked potentials, the nerve was stimulated supramaximally with pulses of 0.2–0.5 V, 0.5 ms duration. Voltage recordings were amplified (Axoprobe-1A) and acquired in real time using a personal computer equipped with data acquisition hardware (Digidata 1322A) and software (Axoscope 9; Molecular Devices). Fibers with resting membrane potentials more depolarized than −60 mV or whose potentials changed >10% over the course of the recordings were excluded from analysis. All values are expressed as mean ± SEM.
Immunostaining and confocal imaging of NMJs.
Detailed methods for NMJ immunostaining and imaging have been described previously (cf. Hess et al., 2007). For most confocal imaging, young adult mice were transcardially perfused with 4% paraformaldehyde (PFA) in PBS, pH 7.4, and the sternomastoid muscles were removed and washed with PBS. For the experiments in which live-imaged sternomastoid preparations were subsequently immunostained and imaged, muscles were fixed with 4% PFA for 15 min at room temperature and then washed with PBS. All muscles were incubated in 10 μg/ml Al594-αbtx for 20 min to label postsynaptic AChRs. The synaptic vesicle protein SV2 was labeled with a mouse monoclonal antibody (1:50 dilution; Developmental Studies Hybridoma Bank, University of Iowa, Iowa City, IA) followed by a CY5-conjugated goat anti-mouse secondary antibody (1:200 dilution; Jackson ImmunoResearch, West Grove, PA).
NMJs were then imaged by confocal microscopy using 40×, 1.25 numerical aperture or 63×, 1.4 numerical aperture oil-immersion objectives (Leica SP2 AOBS system). SpH was excited with the 488 nm line of an argon-krypton laser and emission wavelengths of 500–563 nm were collected. AChRs were excited at 594 nm and emission detected at 600–625 nm, whereas SV2 was excited at 633 nm and detected at 665–715 nm. Single-plane projections were assembled from stacks of images and viewed using interactive software (MetaMorph; Leica).
Results
Spatial patterns of transgene expression in sternomastoid muscle
We identified six founder spH transgenic mouse lines using a PCR-based genetic screen (for details, see Materials and Methods). As has been shown in previous studies using the thy1.2 promoter to drive transgene expression in mice (Feng et al., 2000; Li et al., 2005), we found that the pattern of spH expression varied between the different lines (Fig. 1). In the sternomastoid muscle for example, spH was expressed at nearly all NMJs in one line (SpH 49; n = 236/239 NMJs examined) (Fig. 1A). In addition to the motor neurons, spH was also detected in terminals of other neural subtypes, notably in the spinal cord, hippocampus, and pituitary (data not shown). One line had expression in ∼50% of sternomastoid neuromuscular junctions examined (SpH 26; n = 296/547 junctions) (Fig. 1B), whereas the remaining four lines had no detectable expression in sternomastoid junctions (SpH 1, 12, 37, and 40; n = 0/573 junctions) (data not shown). Neuromuscular junctions in the SpH 49 line were used for these studies because of the high level of spH expression in virtually all junctions.
Figure 1.

SynaptopHluorin expression at mouse neuromuscular junctions. A, B, Confocal imaging of fixed sternomastoid muscles reveals patterns of transgene expression among different thy1-spH lines. Junctions were identified by labeling postsynaptic AChRs with Alexa 594 conjugated α-bungarotoxin (Al594-αbtx; red). Tissue fixation neutralizes the pH gradient across the vesicle membrane, allowing for the visualization of both the intracellular and extracellular spH pool. A, SpH (green) is expressed at nearly every junction in line SpH 49 (yellow in overlay, 98.7% of junctions examined). Scale bar, 70 μm. B, Approximately half of the junctions are spH-expressing in line SpH 26 (54.1% of junctions examined). Scale bar, 50 μm. C, SpH is highly localized to presynaptic terminal branches (arrow) and completely overlies postsynaptic AChRs. Much lower levels are also present in preterminal axon branches (arrowhead). The image is from line SpH 49. Scale bar, 20 μm.
We focused our studies on neuromuscular junctions within the sternomastoid muscle because of the ease of dissection and the fact that many previous studies of neuromuscular junction structure and function have been performed in this muscle (Gage and Murphy, 1981; Balice-Gordon and Lichtman, 1993; Gonzalez et al., 1999). Detailed examination of spH-expressing synaptic terminals revealed relatively high levels of expression within presynaptic motor neuron terminals, with lower levels of expression detected in the preterminal axon and intraterminal axon branches (Fig. 1C). The synaptic localization of spH was further demonstrated by the complete overlap of spH+ presynaptic terminals with postsynaptic AChRs (Fig. 1C, right).
SpH expression does not perturb normal synaptic function
Observations of transgenic mice and their wild type littermates revealed no apparent differences in behavior, body weight, or life-span. To determine whether the expression of the spH transgene in presynaptic terminals affected synaptic function, intracellular recordings from muscle fibers were performed to evaluate neuromuscular synaptic transmission. Analyses of recordings obtained from transgenic (Tg) SpH and wild-type mice revealed no significant differences in miniature end-plate potential (mEPP) amplitude or frequency, EPP amplitude, quantal content, or paired-pulse facilitation (PPF) (supplemental Fig. 1, available at www.jneurosci.org as supplemental material).
Measurements of spH fluorescence changes as an assay of synaptic transmission
We next asked how spH fluorescence changed in response to neural activity, and whether this measure could be used as a reliable assay for measuring presynaptic neurotransmitter release. SpH+ terminals imaged in live nerve-muscle preparations exhibited fluorescence levels just above that of the background muscle fiber, reflecting the small fraction of spH localized to the surface membrane (Fig. 2A, second panel). Electrical stimulation of the nerve (50 Hz for 15 s) led to a clear increase in fluorescence intensity throughout the presynaptic terminal (Fig. 2A, third panel) which gradually returned to prestimulus levels after stimulation ended, as spH-containing synaptic vesicles were endocytosed and reacidified (Fig. 2A, fourth panel). Replacing the normal Ringers solution with one containing ammonium chloride (NH4Cl) has been shown to unquench the fluorescence of the intracellular spH pool by alkalinizing the intravesicular pH via diffusion, thus providing a relative measure of the total intracellular vesicle pool (Miesenbock et al., 1998; Sankaranarayanan and Ryan, 2000). Application of a 50 mm NH4Cl-containing Ringers solution led to a dramatic increase in spH fluorescence. Relative to prestimulation baseline fluorescence, the fluorescence change observed with NH4Cl exposure was four to five times larger than the change observed with stimulation alone (Fig. 2B). This indicates a relatively large reserve pool of synaptic vesicles, consistent with previous observations at neuromuscular junctions (Tabares et al., 2007).
Figure 2.

Changes in spH fluorescence are dependent on neural activity. A, Raw fluorescence images of a spH-expressing neuromuscular junction. Resting fluorescence intensity (second panel) increases in response to nerve stimulation (third panel) but returns to near original levels 60 s later (fourth panel). Addition of 50 mm NH4Cl causes a robust increase in fluorescence (right panel). Postsynaptic AChRs are visualized with Al594-αbtx (left panel). Scale bar, 10 μm. B, Mean spH fluorescence intensities of terminals at rest (487 ± 73 AFU), stimulated at 50 Hz for 15 s (688 ± 80 AFU), and exposed to NH4Cl (1344 ± 112 AFU). Error bars indicate SEM. C, Fluorescence changes (ΔF) of a junction stimulated with action potential trains of various frequencies. The magnitude of fluorescence change increases with stimulus intensity up to 30–40 Hz. Prestimulus fluorescence levels are offset to zero for each trial. D, Graph showing fluorescence changes of six junctions (colored traces) in response to a stimulus train of 50 Hz. The observed intensity changes are largely reproducible between junctions in response to a stimulus of a specific frequency and duration. Black trace shows averaged ΔF for these junctions. E, Averaged results from six junctions that were initially stimulated in the presence of Rees' Ringer's solution (red trace), a calcium-free Ringer's (blue trace), and back in the normal solution (green trace). Activity induced changes in spH fluorescence are abolished with the removal of extracellular calcium, but return when it is replaced. Black bars in C–E indicate the duration of stimulus trains. F, EPP trains were recorded from Tg SpH muscle fibers during tetanic nerve stimulation (50 Hz, 15 s) and the average quantal content of each EPP in the train was calculated (n = 5 mice, 22 cells). The cumulative number of quanta released is plotted as a function of time (smooth gray line; left axis). Error bars are shown at every 50th EPP beginning at 0.5 s (gray error bars). Mean spH fluorescence changes obtained once every second during an identical 50 Hz, 15 s stimulus train are also plotted (black squares; right axis; n = 6 animals, 12 cells). The nearly complete superimposition of the two curves emphasizes the reliability of spH as an indicator of synaptic activity.
SpH fluorescence changes were also dependent on the frequency of nerve stimulation (Fig. 2C). The magnitude of the changes in fluorescence increased proportionately with increases in the stimulation frequency [∼150 arbitrary fluorescence units (AFUs) for every 10 Hz increase; units based on a 14-bit pixel intensity scale] up to rates of 30–40 Hz, above which no further increases in fluorescence intensity changes occurred. Additionally, the maximum activity-induced fluorescence change was relatively consistent, in that the same stimulation rate (50 Hz) evoked similar changes in terminal fluorescence in different junctions across animals (Fig. 2D). The spH fluorescence changes were dependent on extracellular calcium. When normal Ringers solution was replaced with calcium-free Ringers, no stimulus induced changes in fluorescence intensity were observed (Fig. 2E). When the preparation was returned to normal Ringers solution, stimulation induced changes in spH fluorescence were again observed.
To determine whether spH fluorescence changes provide a reliable and accurate estimate of neurotransmitter release, spH fluorescence changes were compared with electrophysiological measurements of ACh release (Betz and Bewick, 1992; Tabares et al., 2007). The nerve was stimulated for 15 s at 50 Hz and the resulting postsynaptic trains of EPPs were recorded. The quantal content of each EPP in the train was calculated using the direct method (McLachlan and Martin, 1981) and the cumulative number of quanta released was plotted over the duration of the stimulus. When plotted alongside the average change in spH fluorescence intensity during an identical stimulus, the rates were nearly identical (Fig. 2F). Thus, two independent measures of the rate of synaptic vesicle exocytosis give very similar results, suggesting that activity-induced spH fluorescence changes provide an accurate method for measuring presynaptic release.
SpH and endogenous synaptic vesicle proteins are heterogeneously distributed within terminals
One complication of using a transgenic approach is the potential for inappropriate trafficking of the spH construct within the neuron, which would compromise the usefulness of spH as a tool for looking at spatial patterns of neurotransmitter release. We therefore examined the pattern of spH distribution within synaptic terminals and compared it to that of the endogenous synaptic vesicle protein SV2 after fixation and immunostaining (Fig. 3A). As noted above, high levels of expression were observed within terminal areas overlying postsynaptic AChRs, but not within axon branches (Fig. 1C). Measurements of terminal spH fluorescence revealed that spH was highly colocalized with SV2 along terminal branches (Fig. 3B). The extent of spH and SV2 colocalization was assessed over several junctions by creating multiple ROIs over each junction and measuring the average fluorescence intensities within each ROI (n = 12 junctions). Both vesicle markers showed a high degree of correlation when their relative fluorescence/staining intensities were compared (r = 0.9) (Fig. 3C). To control for apparent intensity differences caused by imaging different focal depths within a junction, spH and SV2 fluorescence were also compared with AChR staining intensity (Fig. 3D,E, respectively). There was no significant correlation between either spH versus AChR or SV2 versus AChR labeling intensity (r = 0.3 for both comparisons), suggesting that the observed spH and SV2 colocalization throughout the presynaptic terminal was independent of postsynaptic receptor clustering.
Figure 3.

SpH and endogenous synaptic vesicle proteins are colocalized and heterogeneously distributed within synaptic terminals. A, Confocal images of a spH (green) expressing junction fixed and immunostained for the synaptic vesicle protein SV2 (grayscale; blue in overlay), and labeled with Al594-αbtx (AChRs, red). Scale bar, 25 μm. B, Linescan graph of AChR, SpH, and SV2 fluorescence intensities measured over a branch of the junction (white dashed line in A). The patterns of SpH and SV2 intensities are similar with respect to each other, but vary with respect to that of AChRs. C–E, Scatterplots comparing SV2 versus SpH (C), AChR versus SpH (D), and AChR versus SV2 (E) fluorescence from multiple immunostained junctions. Each point represents the average fluorescence intensities within a small manually selected ROI. SV2 and SpH fluorescence are highly correlated (linear correlation coefficient, r = 0.90), but AChR and SpH or SV2 fluorescence are not (r = 0.31 and 0.32, respectively).
However, synaptic vesicle markers were not evenly distributed along the terminal branches of the junctions examined (Fig. 3B,C). Rather, the labeling was quite heterogeneous, with multiple areas of high intensity interspersed among regions of weaker labeling. Furthermore, the peak intensities of these areas were variable as well. This was not the case with AChR labeling, which was relatively constant along terminal branches. Together, these results indicate that spH is correctly targeted within synaptic terminals to areas containing synaptic vesicles. Moreover, vesicles are not uniformly distributed throughout the terminal, but are clustered along the lengths of terminal branches. The fraction of the total vesicle pool comprised of spH-containing vesicles is relatively constant across all sites, regardless of the total pool size, as indicated by the linear relationship in Figure 3C. Thus, transgenic spH expression is a reliable indicator of the relative distribution of synaptic vesicles in motor axon terminals.
Neurotransmitter release rates vary across different terminal regions but are proportional to vesicle pool size
Because synaptic vesicles appear to be heterogeneously distributed within presynaptic terminals, we asked if there are differences in the rate and extent of vesicle release among different regions within individual junctions. Using a suction electrode, the nerve was stimulated with a train of action potentials (50 Hz for 15 s) and fluorescence changes were monitored within a single focal plane of terminals lying close to the muscle surface. Results from a typical experiment are illustrated in Figure 4. There was a remarkable degree of variability in the degree of spH intensity changes between regions within a junction, with some regions exhibiting a noticeably larger change than others (Fig. 4A, compare panels 10 s, 25 s). When the fluorescence changes of these regions were plotted over time, up to fourfold peak differences were observed (Fig. 4B). This suggested that, in addition to heterogeneity of synaptic vesicle distribution within a terminal, there was heterogeneity of vesicle release as well.
Figure 4.

The rate and extent of neurotransmitter release varies within active motor terminals. A, SpH expressing neuromuscular junction with pseudocolored panels illustrating fluorescence intensities at several time points before and after nerve stimulation. A 15 s, 50 Hz stimulus was delivered 10 s after imaging began (note increase in intensity between 10 and 25 s panels). The first and last panels in the series (0 and 90 s, respectively) were left in their original grayscale formats to illustrate observed SpH fluorescence levels. AChRs were visualized with Al594-αbtx. Scale bar, 5 μm. B, Mean fluorescence intensity measurements of several terminal ROIs (colored circles in the 0 s frame) plotted over time reveal heterogeneity in the extent of exocytosis within the junction. In this example, there was a four-fold range in intensity changes (ΔF) among these regions. Prestimulus fluorescence was set to zero for each ROI. Black bar indicates duration of stimulus train. C, Scatterplot comparing the maximum stimulus-induced fluorescence changes (ΔFstim) within each ROI with fluorescence changes induced by 50 mm NH4Cl application (ΔFNH4Cl). There is a strong linear correlation between the data (r = 0.94), suggesting a close, direct relationship between the relative abundance of synaptic vesicles within a terminal region (ΔFNH4Cl measurements) and the number released with stimulation (ΔFstim measurements).
We next asked whether, at a given region within a terminal, there was a correlation between the abundance of vesicles and the extent of exocytosis. We therefore compared the maximum stimulus-induced fluorescence changes for a junction with the changes caused by exposure to a 50 mm NH4Cl Ringer's solution, which provides a relative estimate of the total vesicle pool size at all regions within a terminal (Fig. 4C). When the fluorescence changes within multiple areas of the terminal were compared using these two conditions, we found a significant linear correlation in each of 16 junctions examined (mean slope, 0.3 ± 0.02; mean r, 0.7 ± 0.03; n = 16 junctions). This indicates that the extent of vesicle release appears to be directly proportional to the size of the total vesicle pool.
Similar results were obtained when these junctions are analyzed on a pixel-by-pixel basis (Fig. 5). After correcting for background fluorescence, the resting (prestimulus) spH image was subtracted from the peak fluorescence images produced by nerve stimulation as well as by NH4Cl application to create images illustrating these intensity changes (ΔFstim and ΔFNH4Cl) (Figs. 5A,B). When individual pixel intensities within the two terminal images were compared and plotted against each other (Fig. 5C), a relatively high degree of correlation was observed between activity-dependent vesicle release and vesicle pool size (mean r, 0.71 ± 0.02; n = 16 junctions), suggesting that a constant fraction of the total spH pool is released throughout the terminal. Additionally, by dividing the ΔFstim image by the ΔFNH4Cl image (and multiplying by a factor of 100), a “ratio” image illustrating the fraction of spH+ vesicles released over the entire junction was obtained (Fig. 5D). Using this processing technique, much of the heterogeneity in spH fluorescence intensity seen in the ΔFstim and ΔFNH4Cl images was lost, further emphasizing the direct relationship between vesicle release and vesicle pool size.
Figure 5.

The rate and extent of neurotransmitter release varies within active motor terminals. A, Pseudocolored image of a junction illustrating SpH fluorescence changes induced by nerve stimulation (ΔFstim; 50 Hz, 15 s). Scale bar, 15 μm. B, Pseudocolored image of the same junction illustrating fluorescence changes induced by application of 50 mm NH4Cl (ΔFNH4Cl). Note difference in intensity scales between the two images. C, Pixel-by-pixel intensity correlation plot of images in A and B. The images were aligned and the fluorescence intensities of each pixel location within the junction were compared. The black trendline was generated using least squares fit method. There is a relatively high degree of correlation (r = 0.75) between the images in that brighter pixels in one image were likely to be brighter in the other. D, Fluorescence ratio image obtained by dividing ΔFstim in A by ΔFNH4Cl in B and multiplying by a factor of 100. Pixel intensities provide a relative measure of the fraction of the total spH+ vesicle pool released with stimulation. Asterisks mark several examples of fluorescence hotspots. E, Pixel intensity histogram of image in D. Fluorescence intensities (x-axis) are normally distributed with a mean value of 34.7 ± 3.2. F, Averaged intensity histogram of several junctions analyzed as in D (n = 16 junctions). Each junction showed a normal intensity distribution with most having a peak between 25 and 35. Mean pixel intensity is 31.8 ± 2.6. Together, these results suggest, as in Figure 4, that a relatively constant fraction of the total vesicle pool at a given site is released with nerve stimulation.
The pixel intensities of these ratio images ranged from 0 to 100. These values can also be used as a relative measure of the fraction of the total spH+ vesicle pool released with nerve stimulation. When the pixel intensities for the junction shown are plotted as a histogram, the result is normally distributed with a clear peak around 35 (Fig. 5E). This trend was consistent among junctions examined, with all showing a peak between 25 and 35 (n = 16 junctions; mean, 31.8 ± 2.6) (Fig. 5F). These data suggest that, under these stimulation conditions, an average of ∼30% of spH-containing vesicles are released throughout presynaptic motor terminals.
SpH hotspots are evenly distributed along terminal branches
A few hotspots were observed in the ΔFstim/ΔFNH4Cl ratio images of each junction that were clearly brighter than the rest of the terminal (Fig. 5D, asterisks). This is also evident in the long ‘tail’ in the pixel intensity histograms (Fig. 5E,F). These hotspots were defined for each junction as all pixel intensity values, occurring in clusters of at least 3 × 3 pixels, greater than two SDs above the mean. Such spots denote terminal areas having proportionately more surface spH after stimulation than the rest of the junction, which could reflect either a relatively higher probability of release at these regions, recruitment of additional spH+ vesicles, or a decrease in endocytosis of newly exposed spH.
Previous studies of the Drosophila larval neuromuscular junction indicate that there is a spatial proximal-to-distal gradient of synaptic strength along motor axon terminals (Guerrero et al., 2005). We wanted to know whether there is a similar pattern of terminal hotspots along terminal branches of mammalian motor axons as well. The number of hotspots along several branches was counted starting from the point of entry of the preterminal axon. Because of the structural complexity of the mammalian neuromuscular junction (compared with that of Drosophila), multiple terminal branches were measured within each junction. Each terminal branch was divided into 5 μm segments and the average number of hotspots per segment was counted (supplemental Fig. 2, available at www.jneurosci.org as supplemental material). There were no significant differences in the average number of hotspots per segment or in the density of hotspots along terminal branches. Thus, there does not appear to be a gradient of terminal hotspots along mammalian motor axon terminals.
Neurotransmitter release is related to vesicle pool size at a given site regardless of stimulus intensity
It is possible that sites of high vesicle release are dependent on activity levels or patterns, with additional release sites recruited in response to increased activity. We therefore imaged the same neuromuscular junctions repeatedly while stimulating at different rates (10–50 Hz) and compared the distribution of release sites and hotspots (Fig. 6). The locations of release sites (Fig. 6A–E), vesicle pools (Fig. 6A'–E') and hotspots (Fig. 6A“–E”) were fairly constant between stimulation trials, with the major differences being increases in intensity with higher stimulation rates. The reproducibility of these patterns between trials suggests that hotspots are not an artifact of image processing such as amplified pixel noise or misalignment of images. Furthermore, when the ΔFstim and ΔFNH4Cl images at each stimulus frequency were compared on a pixel-by-pixel basis, we observed a high degree of correlation (r ≥ 0.6) (Fig. 6F–J), suggesting that the amount of stimulus induced exocytosis across a terminal is related to the total vesicle pool size regardless of stimulus intensity. When the pixel intensities of the ΔFstim/ΔFNH4Cl ratio images were plotted as a cumulative histogram, the fraction of total spH+ vesicles released increased proportionately with stimulation rates up to 30 Hz (Figs. 2C, 6K). Additionally, the distribution of intensities became more widespread, indicating that with higher stimulation rates, the probability of release relative to other sites or surface accumulation of spH increases at certain spots within a terminal. Finally, we measured the intensities of defined hotspot locations within the terminal at each frequency (Fig. 6A“–E”, colored asterisks) and found that the average pixel brightness at each of these locations was consistently above the mean intensity of the entire terminal (Fig. 6L). Thus, the appearance of these hotspots appears to be fairly consistent across trials at different stimulation frequencies.
Figure 6.
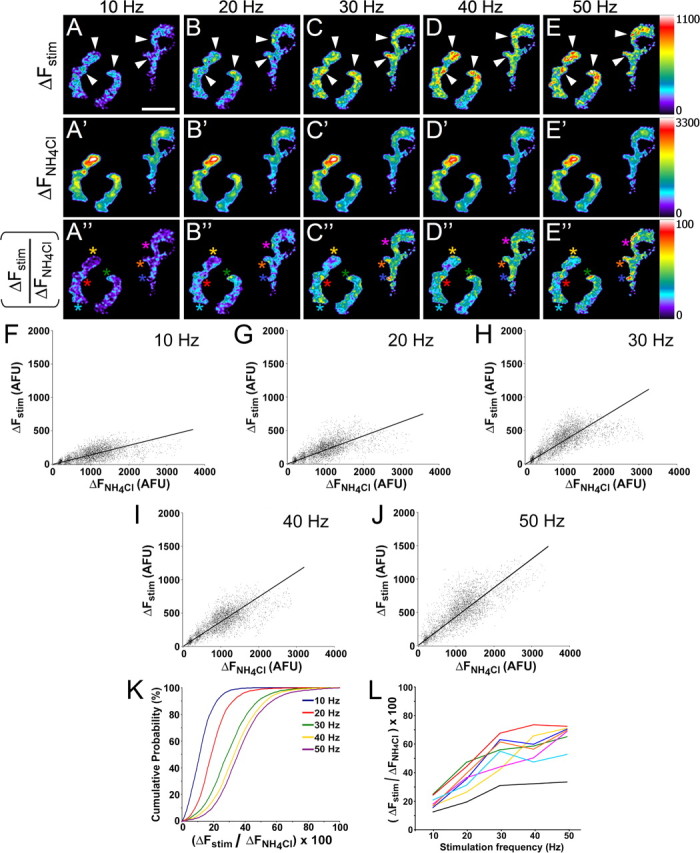
Neurotransmitter release is related to vesicle pool size at a given site regardless of stimulus intensity. A–E, Maximum activity-induced fluorescence changes (ΔFstim) within a junction stimulated at 10, 20, 30, 40, and 50 Hz. Each stimulus train was 15 s. Scale bar, 15 μm. Arrowheads mark several representative areas that consistently show greater vesicle release relative to other regions within the terminal. A'–E', Intensity changes induced by 50 mm NH4Cl (ΔFNH4Cl), applied before each train. The muscle was bathed in normal Ringer's solution for at least 5 min before nerve stimulation and allowed to rest for at least 5 min after to ensure complete recovery of resting fluorescence levels. A“–E”, Fluorescence ratio images for each stimulus frequency obtained by dividing ΔFstim images by ΔFNH4Cl images (as in Fig. 5D). F–J, Pixel intensity correlation plots of ΔFstim versus ΔFNH4Cl for each stimulus frequency. Black line represents best linear fit. The trendline slope increases with frequency, as does the correlation coefficient. F, 10 Hz, slope = 0.10; r = 0.60. G, 20 Hz, slope = 0.17; r = 0.66. H, 30 Hz, slope = 0.25; r = 0.71. I, 40 Hz, slope = 0.29; r = 0.77. J, 50 Hz, slope = 0.33; r = 0.78. K, Cumulative pixel intensity histograms of ΔFstim/ΔFNH4Cl ratio images from A“–E”. As expected, the histograms shift steadily toward larger intensity values with increasing frequencies up to 30–40 Hz (compare with Fig. 2C). In addition, the slopes of the linear portion of the curves are less steep at higher frequencies, indicating a relatively wider distribution of pixel intensities. L, Colored traces show average ΔFstim/ΔFNH4Cl values for seven hotspots (colored asterisks in A“–E”) within the junction shown. Color of each trace corresponds to asterisk color. Black trace depicts the average ΔFstim/ΔFNH4Cl value for the entire junction at each stimulus frequency. Although there is some variability between trials, the average pixel intensity values of each hotspot region are consistently greater than the mean for the junction.
In addition, the spatial patterns of vesicle release sites and hotspots were consistent throughout the duration of a stimulus train (Fig. 7A–C'). Average pixel intensity histograms of ΔFstim/ΔFNH4Cl ratio images from several junctions (n = 12 junctions) (Fig. 7D–F) revealed that, as seen with increasing stimulation frequencies, the mean fluorescence levels increased, but the range of intensities became broader during the stimulus as well. Furthermore, hotspot intensity measurements within defined sites of the junction (Fig. 7A'–C', colored asterisks) were greater than the average intensity of the terminal at each time point examined (Fig. 7G). The data from these experiments suggest that the locations of vesicle release sites within a terminal are constant and are independent of stimulation frequency and duration. However, the fraction of total spH released at some sites becomes larger relative to other sites with increased stimulation.
Figure 7.

Spatial patterns of vesicle release sites remain relatively constant over time. A–C, Pseudocolor images of the same junction shown in Figure 6 illustrating fluorescence increases during a 50 Hz stimulus train at 5, 10, and 15 s. Locations of greater release (several representative examples indicated by arrowheads) remain fairly stable over the duration of the stimulus. A'–C', ΔFstim/ΔFNH4Cl ratio images at each time point. Scale bar, 15 μm. The spatial distribution of hotspots (asterisks) also remains constant between time points, although their sizes and intensities tend to become larger. D–F, Pixel intensity histograms of ΔFstim/ΔFNH4Cl images in A'–C', respectively. The histograms shift to the right over the duration of the stimulus, as expected. Average ΔFstim/ΔFNH4Cl values = 17.3 (5 s), 23.2 (10 s), 29.2 (15 s). Additionally, the distribution of pixel intensities increases (note the increasing width of histograms), indicating larger and brighter hotspots as compared with earlier time points. G, Colored traces show average ΔFstim/ΔFNH4Cl values for eight hotspots (colored asterisks in A'–C') after 5, 10, and 15 s of stimulation at 50 Hz. Color of each trace corresponds to asterisk color. Black trace depicts the average ΔFstim/ΔFNH4Cl value for the entire junction at each time point. The average intensity of each hotspot region is greater than the mean for the junction at all time points.
Heterogeneity of release correlates with heterogeneity of synaptic vesicle distribution
Finally, we wanted to confirm our previous observations that spH+ synaptic vesicle release was correlated with the total size of the spH+ vesicle pool at a given site. To do this, synaptic vesicle release was compared with levels of SV2 staining, an independent marker which labels both spH− and spH+ vesicles in the terminal (Fig. 8A–C). After the live-imaging experiments, the preparations were fixed and immunostained for SV2. As with our previous comparisons to fluorescence changes induced by NH4Cl exposure, there was a strong correlation between exocytosis of spH+ vesicles and SV2 staining intensity (mean r, 0.84 ± 0.01) (Fig. 8D,E). It should also be noted that SV2 staining was imaged with a confocal microscope, which omits out of focus light. This approach controls for potential issues caused by imaging regions lying out of the focal plane (Figs. 4, 5) in which terminal regions appearing dimmer might lie just above or below the plane of focus. Thus, we were independently able to verify our observations that the amount of activity-induced vesicle release is proportional to the total size of the vesicle pool.
Figure 8.

Heterogeneity of vesicle release correlates with synaptic vesicle distribution as revealed by immunostaining. A, Images illustrating stimulus-induced terminal fluorescence changes (50 Hz, 15 s; ΔFstim). B, Fifty micromolar NH4Cl-induced fluorescence changes (ΔFNH4Cl) within the same junction. C, Confocal image of SV2 immunostaining after muscle fixation. Pseudocolor images correspond to boxed areas in grayscale panels above. Scale bars, 15 μm. D, Scatterplot comparing ΔFstim and SV2 staining intensities for multiple ROIs within the junction pictured. There is a high degree of linear correlation between the areas measured (black trendline; r = 0.88). E, Histogram of ΔFstim versus SV2 correlation coefficients (r values) for 16 junctions analyzed as above reveals a relatively close relationship between the number of vesicles released and the total vesicle pool size within a terminal.
Together, these experiments reveal a surprising amount of heterogeneity of synaptic vesicle release throughout presynaptic motor axon terminals. When compared with the distribution of synaptic vesicle pools, however, we find that the abundance of total vesicles at a given site is correlated with the amount of exocytosis. For the most part this relationship is fairly constant, but at higher stimulation frequencies or longer stimulation times, some areas release proportionately more than others. These studies reveal previously unknown relationships between synaptic structure and function at the mammalian neuromuscular junction and demonstrate the usefulness of transgenically expressing spH as a tool in future studies at this synapse.
Discussion
We generated lines of transgenic mice that express synaptopHluorin in motor axon terminals as a means of monitoring synaptic vesicle exocytosis and neurotransmitter release. Immunostaining for the endogenous synaptic vesicle protein SV2 reveals that spH is expressed in areas containing synaptic vesicles in proportion to the total number of vesicles in a given area. Additionally, comparisons of activity induced spH fluorescence changes with electrophysiological recordings of EPP trains show that the rate of fluorescence increase is identical to the rate of quantal neurotransmitter release. Thus spH fluorescence changes are a reliable indicator of activity driven presynaptic release. Supporting this idea, we show that the magnitude of fluorescence change is directly proportional to the frequency of nerve stimulation for rates up to and including 30 Hz and that the changes induced by a given stimulation frequency are consistent between junctions. Beyond 30 Hz, while the rate of action potentials increases, the number of vesicles released per action potential very likely decreases. Previous studies at neuromuscular junctions have shown that the quantal content of each EPP in a stimulus train decreases at a greater rate as stimulation frequency increases (Kamenskaya et al., 1975; Glavinovic, 1979).
The results reported here are consistent with many of the findings obtained in a previous study that also uses spH fluorescence to monitor synaptic function at mouse neuromuscular junctions (Tabares et al., 2007), and extends the work of Tabares et al. in important new ways. Both studies found that the extent of activity induced exocytosis is not spatially uniform across presynaptic terminals. While florescence levels increased throughout the terminal, areas of relatively greater intensity appeared as bright spots along presynaptic branches. Moreover, the appearance of these spots at the same positions within the terminal was reproducible between stimulus trains, indicating that they were not artifacts. Here, we report the novel finding that synaptic vesicles are heterogeneously distributed along terminal branches as well and that the number released is strongly correlated with the total number of vesicles present at a given site. Vesicle release was assessed via stimulus-induced changes in spH fluorescence measurements (ΔFstim) (Figs. 4–8), whereas the vesicle pool size was assessed in two independent ways. The first was through the application of an NH4Cl-containing Ringer's solution (ΔFNH4Cl) (Figs. 4–8). Previous work has shown that addition of 50 mm NH4Cl to the bath raises the intravesicular pH to 7.4 and unquenches internal spH fluorescence (Miesenbock et al., 1998; Sankaranarayanan and Ryan, 2000), thus providing a measure of the total intracellular spH pool. Although, individually, both ΔFstim and ΔFNH4Cl values varied throughout the terminals, these values were highly correlated when their spatial distributions were compared based on either manually defined regions or on a pixel by pixel basis. We found that, on average, a 15 s stimulus train of 50 Hz evoked spH fluorescence changes of ∼30% of those induced by NH4Cl. If we assume that the change in vesicular pH that occurs during exocytosis is equal to the change induced by NH4Cl application and that spH is distributed equally across all vesicles within the terminal, then this value can be taken as a measure of the fraction of the total vesicle pool released with stimulation. Although the size of the releasable pool of vesicles relative to the total vesicle pool size has not yet been determined at rodent neuromuscular junctions, previous work with FM1–43 and related dyes showed that there is a relatively large pool of vesicles that is not released with stimulation (Ribchester et al., 1994; Reid et al., 1999).
We were also able to generate spatial maps illustrating the fraction of total spH released with stimulation throughout the terminals studied (ΔFstim/ΔFNH4Cl) (Figs. 5–7). Pixel intensity measurements of these images revealed that this fraction is fairly uniform across the junction with lower stimulus frequencies and at early time points during a stimulus train. As the rate or duration of stimulation increased, this fraction became less constant and was illustrated by hotspots of relatively brighter pixel intensities than the rest of terminal. These hotspots likely represent regions of greater surface spH accumulation than average. It is unclear, however, whether this is the result of increased exocytosis at these sites or of lateral diffusion of spH from adjacent release sites. There is experimental evidence to support both possibilities. It has been shown in hippocampal neuron cultures that the release properties of individual synapses made by a single neuron vary significantly (Murthy et al., 1997). Additionally, at frog neuromuscular junctions, some active zones within a terminal have a high release probability whereas others in the same terminal do not (Bennett and Lavidis, 1989). Thus, it is possible that some regions within the junction are more likely to release vesicles, or release more of them, than others and that these differences in synaptic properties become more apparent with increasing stimulation.
However, the idea that hotspots represent lateral diffusion of exocytosed synaptic vesicle components from regions of intense release to less active nearby areas is supported by studies of frog and snake neuromuscular junctions (Heuser and Reese, 1973; Teng et al., 1999). Furthermore, photobleaching experiments performed by Tabares et al. (2007) indicated that surface spH can diffuse to adjacent regions of the terminal. However, the extent of spH diffusion after stimulated release has not been carefully explored. The third possibility is that hotspots represent sites of decreased endocytosis. However, Tabares et al. (2007) compared rates of exocytosis to rates of endocytosis at mouse neuromuscular junctions, and reported significant correlation between the two, suggesting that this possibility is unlikely.
In addition to NH4Cl-induced fluorescence changes, we also used SV2 immunostaining to assess the total synaptic vesicle pool size independently of spH measurements. As observed with NH4Cl-induced fluorescence changes, we found a strong relationship between ΔFstim values and SV2 staining intensities at sites throughout the observed terminals. Because these two measures were obtained with different experimental techniques and immunostaining results can be quite variable between preparations, we cannot consistently and quantitatively define one value as a function of the other as we could with ΔFstim and ΔFNH4Cl measurements. Nevertheless, for each junction imaged and immunostained there was a high correlation coefficient between ΔFstim and SV2 labeling, further emphasizing the connection between evoked synaptic vesicle release and vesicle pool size. It will be of interest to know whether the distribution of other proteins, such as those in active zones (Nishimune et al., 2004; Juranek et al., 2006) is also correlated to the relative amount of synaptic vesicle release across regions of a terminal.
Previous studies using electron microscopy to examine the distribution of synaptic vesicles in mammalian neuromuscular terminals have demonstrated that although vesicles are primarily clustered at active zones, they are also present throughout the terminal (Rowley et al., 2007). Consistent with this, we found that the addition of NH4Cl to reveal the total intracellular vesicle pool led to fluorescence increases over the entire presynaptic terminal. Although we also observed spots of greater intensity as compared with other areas of the terminal, it is unlikely that these represent individual active zones. Previous studies have estimated the density of active zones in mouse neuromuscular terminals to be ∼2.5 per μm2 (Fukunaga et al., 1982, 1983). Based on our imaging conditions, our limit of resolution is on the order of 1 μm. Therefore, each spH florescence “spot” likely encompasses several active zones. Recent advances in optical physics have led to the development of new tools such as “hyperlenses” or stimulated emission depletion microscopy that can resolve fluorescent objects on the order of tens of nanometers, including individual vesicles (Willig et al., 2006; Liu et al., 2007; Smolyaninov et al., 2007). Thus, these new imaging techniques may allow information obtained from spH measurements to provide additional new information about the structure and function of neuromuscular synapses in adults and during development, as well as in diseases of the neuromuscular axis that affect neuromuscular synaptic function, including motor neuron degenerative diseases such as spinal muscular atrophy and amyotrophic lateral sclerosis, among others.
Footnotes
This work was supported by National Institutes of Health Grant NS40763 (R.B.G.) and National Research Service Award Predoctoral Fellowship NS047777 (R.M.W.). We thank M. Scott and H.-Y. Zhou for technical assistance, Dr. J. Richa and the Penn Transgenic core for assistance in generating transgenic mice, Dr. G. Miesenbock for providing the synaptopHluorin construct, Drs. G.-P. Feng and J. R. Sanes for providing the thy1.2 construct, and Drs. T. D. Parsons, P. G. Haydon, and S. Scherer, and members of the Balice-Gordon laboratory for helpful discussions.
References
- Balice-Gordon RJ, Lichtman JW. In vivo observations of pre- and postsynaptic changes during the transition from multiple to single innervation at developing neuromuscular junctions. J Neurosci. 1993;13:834–855. doi: 10.1523/JNEUROSCI.13-02-00834.1993. [DOI] [PMC free article] [PubMed] [Google Scholar]
- Bennett MR, Lavidis NA. The probability of quantal secretion at release sites in different calcium concentrations in toad (Bufo marinus) muscle. J Physiol (Lond) 1989;418:219–233. doi: 10.1113/jphysiol.1989.sp017836. [DOI] [PMC free article] [PubMed] [Google Scholar]
- Betz WJ, Bewick GS. Optical analysis of synaptic vesicle recycling at the frog neuromuscular junction. Science. 1992;255:200–203. doi: 10.1126/science.1553547. [DOI] [PubMed] [Google Scholar]
- Caroni P. Overexpression of growth-associated proteins in the neurons of adult transgenic mice. J Neurosci Methods. 1997;71:3–9. doi: 10.1016/s0165-0270(96)00121-5. [DOI] [PubMed] [Google Scholar]
- Delgado R, Maureira C, Oliva C, Kidokoro Y, Labarca P. Size of vesicle pools, rates of mobilization, and recycling at neuromuscular synapses of a Drosophila mutant, shibire. Neuron. 2000;28:941–953. doi: 10.1016/s0896-6273(00)00165-3. [DOI] [PubMed] [Google Scholar]
- Feng G, Mellor RH, Bernstein M, Keller-Peck C, Nguyen QT, Wallace M, Nerbonne JM, Lichtman JW, Sanes JR. Imaging neuronal subsets in transgenic mice expressing multiple spectral variants of GFP. Neuron. 2000;28:41–51. doi: 10.1016/s0896-6273(00)00084-2. [DOI] [PubMed] [Google Scholar]
- Fernandez-Alfonso T, Kwan R, Ryan TA. Synaptic vesicles interchange their membrane proteins with a large surface reservoir during recycling. Neuron. 2006;51:179–186. doi: 10.1016/j.neuron.2006.06.008. [DOI] [PubMed] [Google Scholar]
- Fukunaga H, Engel AG, Osame M, Lambert EH. Paucity and disorganization of presynaptic membrane active zones in the Lambert-Eaton myasthenic syndrome. Muscle Nerve. 1982;5:686–697. [Google Scholar]
- Fukunaga H, Engel AG, Lang B, Newsom-Davis J, Vincent A. Passive transfer of Lambert-Eaton myasthenic syndrome with IgG from man to mouse depletes the presynaptic membrane active zones. Proc Natl Acad Sci USA. 1983;80:7636–7640. doi: 10.1073/pnas.80.24.7636. [DOI] [PMC free article] [PubMed] [Google Scholar]
- Gaffield MA, Betz WJ. Imaging synaptic vesicle exocytosis and endocytosis with FM dyes. Nat Protoc. 2006;1:2916–2921. doi: 10.1038/nprot.2006.476. [DOI] [PubMed] [Google Scholar]
- Gage PW, Murphy EC. Facilitation of acetylcholine secretion at a mouse neuromuscular junction. Brain Res. 1981;204:327–337. doi: 10.1016/0006-8993(81)90592-8. [DOI] [PubMed] [Google Scholar]
- Glavinovic MI. Change of statistical parameters of transmitter release during various kinetic tests in unparalyzed voltage-clamped rat diaphragm. J Physiol (Lond) 1979;290:481–497. doi: 10.1113/jphysiol.1979.sp012785. [DOI] [PMC free article] [PubMed] [Google Scholar]
- Gonzalez M, Ruggiero FP, Chang Q, Shi YJ, Rich MM, Kraner S, Balice-Gordon RJ. Disruption of TrkB-mediated signaling induces disassembly of postsynaptic receptor clusters at neuromuscular junctions. Neuron. 1999;24:567–583. doi: 10.1016/s0896-6273(00)81113-7. [DOI] [PubMed] [Google Scholar]
- Guerrero G, Reiff DF, Agarwal G, Ball RW, Borst A, Goodman CS, Isacoff EY. Heterogeneity in synaptic transmission along a Drosophila larval motor axon. Nat Neurosci. 2005;8:1188–1196. doi: 10.1038/nn1526. [DOI] [PMC free article] [PubMed] [Google Scholar]
- Hess DM, Scott MO, Potluri S, Pitts EV, Cisterni C, Balice-Gordon RJ. Localization of TrkC to Schwann cells and effects of neurotrophin-3 signaling at neuromuscular synapses. J Comp Neurol. 2007;501:465–482. doi: 10.1002/cne.21163. [DOI] [PubMed] [Google Scholar]
- Heuser JE, Reese TS. Evidence for recycling of synaptic vesicle membrane during transmitter release at the frog neuromuscular junction. J Cell Biol. 1973;57:315–344. doi: 10.1083/jcb.57.2.315. [DOI] [PMC free article] [PubMed] [Google Scholar]
- Juranek J, Mukherjee K, Rickmann M, Martens H, Calka J, Sudhof TC, Jahn R. Differential expression of active zone proteins in neuromuscular junctions suggests functional diversification. Eur J Neurosci. 2006;24:3043–3052. doi: 10.1111/j.1460-9568.2006.05183.x. [DOI] [PubMed] [Google Scholar]
- Kamenskaya MA, Elmqvist D, Thesleff S. Guanidine and neuromuscular transmission. II. Effect on transmitter release in response to repetitive nerve stimulation. Arch Neurol. 1975;32:510–518. doi: 10.1001/archneur.1975.00490500030002. [DOI] [PubMed] [Google Scholar]
- Li Z, Burrone J, Tyler WJ, Hartman KN, Albeanu DF, Murthy VN. Synaptic vesicle recycling studied in transgenic mice expressing synaptopHluorin. Proc Natl Acad Sci USA. 2005;102:6131–6136. doi: 10.1073/pnas.0501145102. [DOI] [PMC free article] [PubMed] [Google Scholar]
- Liu Z, Lee H, Xiong Y, Sun C, Zhang X. Far-field optical hyperlens magnifying sub-diffraction-limited objects. Science. 2007;315:1686. doi: 10.1126/science.1137368. [DOI] [PubMed] [Google Scholar]
- McLachlan EM, Martin AR. Non-linear summation of end-plate potentials in the frog and mouse. J Physiol (Lond) 1981;311:307–324. doi: 10.1113/jphysiol.1981.sp013586. [DOI] [PMC free article] [PubMed] [Google Scholar]
- Miesenbock G, De Angelis DA, Rothman JE. Visualizing secretion and synaptic transmission with pH-sensitive green fluorescent proteins. Nature. 1998;394:192–195. doi: 10.1038/28190. [DOI] [PubMed] [Google Scholar]
- Murthy VN, Sejnowski TJ, Stevens CF. Heterogeneous release properties of visualized individual hippocampal synapses. Neuron. 1997;18:599–612. doi: 10.1016/s0896-6273(00)80301-3. [DOI] [PubMed] [Google Scholar]
- Nishimune H, Sanes JR, Carlson SS. A synaptic laminin-calcium channel interaction organizes active zones in motor nerve terminals. Nature. 2004;432:580–587. doi: 10.1038/nature03112. [DOI] [PubMed] [Google Scholar]
- Polo-Parada L, Bose CM, Landmesser LT. Alterations in transmission, vesicle dynamics, and transmitter release machinery at NCAM-deficient neuromuscular junctions. Neuron. 2001;32:815–828. doi: 10.1016/s0896-6273(01)00521-9. [DOI] [PubMed] [Google Scholar]
- Poskanzer KE, Marek KW, Sweeney ST, Davis GW. Synaptotagmin I is necessary for compensatory synaptic vesicle endocytosis in vivo. Nature. 2003;426:559–563. doi: 10.1038/nature02184. [DOI] [PubMed] [Google Scholar]
- Rees D. A non-phosphate-buffered physiological saline for in vitro electrophysiological studies on the mammalina neuromuscular junctions. J Physiol (Lond) 1978;278:8P–9P. [PubMed] [Google Scholar]
- Reid B, Slater CR, Bewick GS. Synaptic vesicle dynamics in rat fast and slow motor nerve terminals. J Neurosci. 1999;19:2511–2521. doi: 10.1523/JNEUROSCI.19-07-02511.1999. [DOI] [PMC free article] [PubMed] [Google Scholar]
- Reid B, Martinov VN, Nja A, Lomo T, Bewick GS. Activity-dependent plasticity of transmitter release from nerve terminals in rat fast and slow muscles. J Neurosci. 2003;23:9340–9348. doi: 10.1523/JNEUROSCI.23-28-09340.2003. [DOI] [PMC free article] [PubMed] [Google Scholar]
- Reiff DF, Ihring A, Guerrero G, Isacoff EY, Joesch M, Nakai J, Borst A. In vivo performance of genetically encoded indicators of neural activity in flies. J Neurosci. 2005;25:4766–4778. doi: 10.1523/JNEUROSCI.4900-04.2005. [DOI] [PMC free article] [PubMed] [Google Scholar]
- Ribchester RR, Mao F, Betz WJ. Optical measurements of activity-dependent membrane recycling in motor nerve terminals of mammalian skeletal muscle. Proc Biol Sci. 1994;255:61–66. doi: 10.1098/rspb.1994.0009. [DOI] [PubMed] [Google Scholar]
- Rizzoli SO, Betz WJ. The structural organization of the readily releasable pool of synaptic vesicles. Science. 2004;303:2037–2039. doi: 10.1126/science.1094682. [DOI] [PubMed] [Google Scholar]
- Rowley KL, Mantilla CB, Ermilov LG, Sieck GC. Synaptic vesicle distribution and release at rat diaphragm neuromuscular junctions. J Neurophysiol. 2007;98:478–487. doi: 10.1152/jn.00251.2006. [DOI] [PubMed] [Google Scholar]
- Sankaranarayanan S, Ryan TA. Real-time measurements of vesicle-SNARE recycling in synapses of the central nervous system. Nat Cell Biol. 2000;2:197–204. doi: 10.1038/35008615. [DOI] [PubMed] [Google Scholar]
- Sankaranarayanan S, Ryan TA. Calcium accelerates endocytosis of vSNAREs at hippocampal synapses. Nat Neurosci. 2001;4:129–136. doi: 10.1038/83949. [DOI] [PubMed] [Google Scholar]
- Schikorski T, Stevens CF. Morphological correlates of functionally defined synaptic vesicle populations. Nat Neurosci. 2001;4:391–395. doi: 10.1038/86042. [DOI] [PubMed] [Google Scholar]
- Smolyaninov II, Hung YJ, Davis CC. Magnifying superlens in the visible frequency range. Science. 2007;315:1699–1701. doi: 10.1126/science.1138746. [DOI] [PubMed] [Google Scholar]
- Tabares L, Ruiz R, Linares-Clemente P, Gaffield MA, Alvarez de Toledo G, Fernandez-Chacon R, Betz WJ. Monitoring synaptic function at the neuromuscular junction of a mouse expressing synaptopHluorin. J Neurosci. 2007;27:5422–5430. doi: 10.1523/JNEUROSCI.0670-07.2007. [DOI] [PMC free article] [PubMed] [Google Scholar]
- Teng H, Cole JC, Roberts RL, Wilkinson RS. Endocytic active zones: hot spots for endocytosis in vertebrate neuromuscular terminals. J Neurosci. 1999;19:4855–4866. doi: 10.1523/JNEUROSCI.19-12-04855.1999. [DOI] [PMC free article] [PubMed] [Google Scholar]
- Vidal M, Morris R, Grosveld F, Spanopoulou E. Tissue-specific control elements of the Thy-1 gene. EMBO J. 1990;9:833–840. doi: 10.1002/j.1460-2075.1990.tb08180.x. [DOI] [PMC free article] [PubMed] [Google Scholar]
- Willig KI, Rizzoli SO, Westphal V, Jahn R, Hell SW. STED microscopy reveals that synaptotagmin remains clustered after synaptic vesicle exocytosis. Nature. 2006;440:935–939. doi: 10.1038/nature04592. [DOI] [PubMed] [Google Scholar]
- Wood SJ, Slater CR. The contribution of postsynaptic folds to the safety factor for neuromuscular transmission in rat fast- and slow-twitch muscles. J Physiol (Lond) 1997;500:165–176. doi: 10.1113/jphysiol.1997.sp022007. [DOI] [PMC free article] [PubMed] [Google Scholar]
- Wood SJ, Slater CR. Safety factor at the neuromuscular junction. Prog Neurobiol. 2001;64:393–429. doi: 10.1016/s0301-0082(00)00055-1. [DOI] [PubMed] [Google Scholar]