

Abstract
In higher mammals, environmentally driven patterns of neural activity do not play a role in the establishment of orientation specificity and maps. It has been proposed that specific long-range interactions provide the scaffold for developing orientation maps. Our model aims at explaining how such a scaffold could develop in the first place. Broad spontaneous activity waves and locally evoked spatially periodic response pattern are used. The model is discussed in relation to biological evidence, and experiments to test the model are proposed. We show that reliable orientation specificity cannot be a result of haphazard cortical wiring, as has been proposed.
Keywords: neonatal prenatal, development, area 17, plasticity, orientation specificity, horizontal connectivity
Introduction
Decades of neurophysiological studies have established orientation specificity as an important aspect of primary visual cortex organization in higher vertebrates (Hubel and Wiesel, 1974a; Baker and Issa, 2005). Although many models for the ontogenesis of this organization have been proposed [for reviews, see Erwin et al. (1995) and Swindale (1996)], no consensus has been reached as to the nature of this mechanism. A common hypothesis is based on the reshaping of afferent receptive fields (aRFs). Alternatively, selectivity might be established through appropriately structured intracortical connections alone (von der Malsburg, 1995; Durack and Katz, 1996). In this scenario, direct afferents of neurons would not need such specificity before birth. This role would instead be taken by elongated intracortical receptive fields (iRFs), neurons becoming selective to the orientation of the cortical activity patterns that result from visual stimuli retinotopically projected to the cortex. This intracortical scaffold would then fixate the distribution of orientation specificity over the cortical surface, leading to stable maturation of orientation maps (OMs) after eye opening (Shouval et al., 2000).
To the best of our knowledge, only one previous model aimed to explain the development of the intracortical connection scaffold. Ernst et al. (2001) proposed that random strengthening of neurons could lead to orientation selectivity. However, their simulation results were contaminated by assuming circular boundary conditions for the retina (our unpublished observations). Here we test the “random wiring” hypothesis and conclude that horizontal connections developed according to our model provide a much more robust scaffold for orientation selectivity.
The learning proposed here, following a sketch by von der Malsburg (1995), is based on elongated spontaneous waves of activity, as observed in the retina (Wong, 1999; Liets et al., 2003). Retinal waves were already used by others in aRF-based models (Elliott and Shadbolt, 1999; Miikkulainen et al., 2005). The problem with the retinal waves, however, is that they are spatially too broad in relation to cortical aRFs to account for the differentiation of the latter (Miller, 1994). This problem does not occur in our model, because intracortical connections can gather information from a larger field of view. Additionally, our hypothesis can be applied to an immature cortex, whereas other models often need to assume for it a perfect architecture (e.g., Linsker, 1986a,b,c; Miller, 1994; Grossberg and Seitz, 2003; Miikkulainen et al., 2005).
We assume that the cortex can generate activity that is locally patchy (spatially periodic), as in young ferrets (Chiu and Weliky, 2001). We show in simulations that this assumption combined with Hebbian learning of iRFs on broad cortical activity waves (projected from the retina or generated spontaneously) generates a scaffold for an orientation map. This mechanism lays the foundation for further development after eye opening, a process we discussed by referring to Shouval et al. (2000) but do not simulate.
We review the biological evidence for our assumptions available thus far and call for further studies in this fascinating field.
Materials and Methods
Architecture.
We apply the approach sketched in von der Malsburg (1995), representing activity patterns in a cortical patch of a diameter of ∼12 mm. We imagine that patch to be subdivided into an array of “minipatches,” which in turn are composed of minicolumns (Fig. 1A) [minicolumns are defined and discussed by Rockland and Ichinohe (2004)]. The minipatch size approximately corresponds to that of the cortical point image (Swindale, 1996): the group of neurons [also called a “retinotopic column,” (Lund et al., 2003)] whose aRFs all overlap one retinal point. Because it can code for more than one cycle of orientations, the thus defined minipatch may be somewhat larger than a hypercolumn as defined by Hubel and Wiesel (1974b). On this scale one can also assume retinotopy, which because of retinal scatter (Buzás et al., 2003) does not necessarily hold on a finer scale. Retinotopy means that neighboring minipatches respond to the activation of neighboring, nonoverlapping regions of retinal ganglion cells. (We ignore global geometric effects resulting from variation of the magnification factor, which would deform a straight retinal bar into a curve in cortex. Being interested only in the representation of orientation, we always represent straight retinal bars as straight bars in modeled cortex.)
Figure 1.
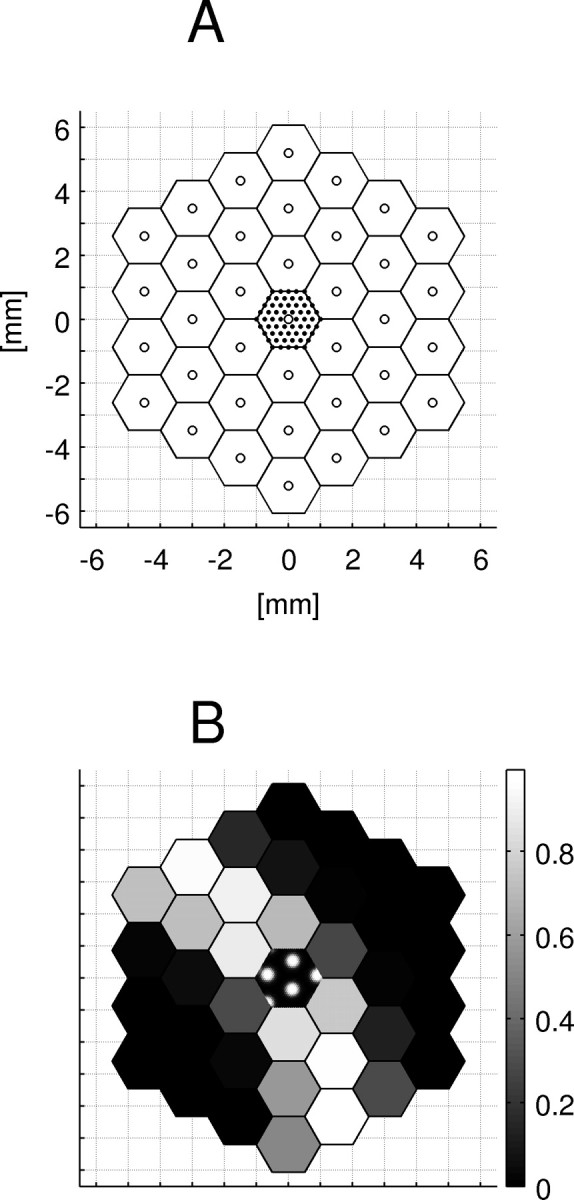
The architecture and activity. A, A cortical patch is represented at two levels of detail. Coarse scale (“minipatches”), Neighboring units are chosen such that they respond to separate, neighboring parts of the visual field. A single minipatch represents mean activity (fjM) over ∼3 mm2 of the cortical plane. Fine scale, Only the “central minipatch” (see the central part of the picture) is simulated in minicolumnar detail (for clarity, a reduced number of minicolumns is shown). fk, activity of minicolumn k. The grid presented here (1 mm spacing) will be used in all pictures of the cortical surface. B, An example of minipatch activity (“fine pattern”) is shown in the center. The columnar activity has the shape of blobs. On the coarse scale, we assume spontaneous activity in the form of arcs (wavefronts of spreading activity).
The activity of minicolumns forms a “fine pattern,” similar to those seen in optical image recordings (although the latter are limited to the outer cortical layers). Only the central minipatch is simulated in fine spatial detail, down to the level of single minicolumns. Activity in the rest of the cortical patch is sampled coarsely, with each sample representing the average activity of a whole minipatch. The coarse activity patterns over the patch would correspond approximately to surface EEG recordings. Samples of fine and coarse patterns are shown in Figure 1B.
We take the minipatch diameter (2Δr) to be of a value appropriate for higher mammals, i.e., 2 mm [compare the adult cat's cortical point image size of ∼2.7 mm, or the monkey's of 1–10 mm (Swindale, 1996)]. Assuming one minicolumn to have a diameter of ∼60 μm, we simulate 17 minicolumns per millimeter. Taking a finer grain [minicolumn diameter in cat's V1 is 56 μm, but in monkey it is half as wide (Buxhoeveden and Casanova, 2002)] does not affect the qualitative results of our simulation, only the smoothness of our maps.
Assumptions.
Primary visual cortex is considered at a time when patterned cortical waves of activity are present. We do not model afferent inputs explicitly. Rather, we generate the activity pattern they would evoke on the cortical level directly. Retinal waves were shown to start in core spots and diffuse over larger parts of the retina [see movies from Feller et al. (1996) and Syed et al. (2004)]. We assume that cortical activation is guided by a similar mechanism, although within the simulated patch only part of the diffusing activity can be seen. Taking into account rapid habituation of young cortical neurons, we assume activity to have the form of wavefronts (corresponding to the rim of the retinal activity patches), i.e., arcs of different curvature.
Cortical circuits are assumed to be mature enough to create fine patterns, whereas long-range horizontal connections (which are mainly excitatory) are not yet clustered. These assumptions are shared by a majority of OM ontogenesis models (von der Malsburg, 1973; Miikkulainen et al., 2005). We simulate activity pattern formation within the central minipatch with excitatory short-range connections and surround inhibition, using periodic boundary conditions to allow creation of fine patterns undisturbed by boundary effects. As to long-range connections, we consider only those that end in the central minipatch. They carry the global signal of other minipatches throughout the cortical patch and have uniform density initially.
Evaluation of assumptions.
The assumption that most distinguishes our model from others is that prenatal development is based on coarse and not a fine structure of input activity. The first candidate for coarse patterns spotted by experimentalists was retinal wave activity (Meister et al., 1991; Torborg and Feller, 2005). Its role in establishing ocular dominance columns was recently demonstrated in ferrets (Huberman et al., 2006).
The retinal waves were reported to disappear by the time the first crude clustering of cortical horizontal connections is completed (Sengpiel and Kind, 2002). However, it was shown that retinal activity is not necessary to sustain bursting activity in the LGN (Weliky and Katz, 1999) or the cortex (Chiu and Weliky, 2001). It is possible that higher structures learn to maintain wave-like activity later in development, contributing to the ontogenesis of OMs.
An alternative source of coarse pattern of activity are ponto-geniculo-occipital (PGO) waves, as discussed in Miikkulainen et al. (2005). These waves, normally appearing during rapid eye movement sleep, were shown to counteract the effects of monocular occlusion (Marks et al., 1995). The planar layout of PGO waves is, to the best of our knowledge, not yet known, but they seem to activate the visual system in a manner similar to visual input.
Additionally, coarse patterns of cortical activity may be generated through closed eyelids, as investigated by Akerman et al. (2004). This could work for cats or ferrets, which open their eyes long after birth. However, this cannot be the only source of coarse patterns, because these animals develop OMs even when reared in the dark (White et al., 2001).
The spatial patterns of cortical activity at early developmental stages are not known yet. Chiu and Weliky (2001) recorded cortical activity in the ferrets at a time when horizontal connections undergo first clustering, 2 weeks before eye opening. However, they used a single row of microelectrodes spanning 3.2 mm, approximately corresponding to the width (full-width at half-maximum) of spontaneous activity assumed in our model. Thus, they were able to record the response on a local scale, but not on a coarse scale, which remains to be disclosed.
Chiu and Weliky (2001) observed spatially periodic organization of spontaneous activity, similar to the fine patterns assumed in our model. They also provide evidence that this activity is generated by intrinsic circuits within the cortex, in accordance with our assumption that short-range interactions are responsible for the creation of fine patterns.
Despite theoretical assertions (Carreira-Perpiñán and Goodhill, 2004), there is little experimental evidence for the existence of Mexican hat-like interactions in adult animals. An alternative mechanisms for the creation of periodic patterns was proposed by Pinto and Ermentrout (2001) (see also Kang et al., 2003), with inhibition acting on a shorter range than excitation. For this scenario to work, inhibitory signals have to propagate faster than excitatory signals. Either fast or longer range inhibition could possibly be found in very young animals that develop OMs. Recent studies of inhibitory currents in the young cortex of ferrets (Chen et al., 2005) confirm the existence of inhibitory connections at this early stage of development and their two-fold shrinkage in more mature animals (≥P38). A study of GABAergic (inhibitory) neurons in cats provides evidence for short-range influences already in the youngest animals, as well as a lack of clustering of those cells (Albus and Wahle, 1994), as in our model.
Ontogenesis, as proposed here, could take place before orientation maps can actually be detected. Orientation selectivity can be recorded in ferret single cells at a time when retinal waves are still present (Krug et al., 2001). It is possible that the orientation bias is already present in the horizontal connections before the orientation map can be observed (presumably because high visual responsiveness of neurons in superficial layers is required for optical recording). It would be interesting to record the response to direct electric stimulation using an oriented excitation pattern that would skip the immature parts of the visual system.
At this developmental stage, long-range horizontal connections could be provided by transient layers: the cortical subplate and the marginal zone (L1), as proposed by Galuske and Singer (1996) and Schmidt et al. (1999). The role of subplate neurons in the functional maturation of orientation columns was recently demonstrated in cats by Kanold et al. (2003). They have shown that subplate ablation prevents formation of orientation maps.
Connections spanning up to 10 mm were recorded in L1 of P1 cats (Galuske and Singer, 1996) at a time when retinal waves are still detectable. Localization of elongated iRF in L1 agrees also with dark rearing experiments in ferrets, in which OMs were visible despite severe disruption of L2/3 connectivity (White et al., 2001). In cats, most of the L1 fibers vanish by the end of the critical period (Galuske and Singer, 1996), which, according to our hypothesis, could explain why orientation maps deteriorate in the absence of visual input.
Layers providing the horizontal input into the simulated central minipatch do not need to develop fine activity patterns themselves. If locally periodic activity is confined to other layers (e.g., L2/3), the absence of early terminal clustering in retrograde labeling studies is not a problem for our model.
Dynamics.
Activity fk of the central minipatch is governed by the following differential equations:
 |
with an initial condition drawn from a uniform distribution fk(0) ∈ (0, 1) and
where
 |
 |
and fk stands for the activity of the minicolumn k, fjM(t) is the activity of jth minipatch, j0 is the central one, gk(t) is the gain of activity arising from synaptic input coming through short-range connections (characterized by matrix W), or from neighboring minipatches. The influence of neighboring minipatches on the central one is represented by the matrix M. We call Mkj the intracortical receptive field (iRF) of a minicolumn k. All the random phenomena that add to the synaptic input are modeled by Gaussian noise η(t). They represent spontaneous activity from LGN and other brain structures.
The gain function is a standard sigmoidal S(x) with output range (0, 1). Activity fk(t) can be interpreted as population response, i.e., the ratio of neurons in the vertical minicolumn that are active at a certain point in time.
Analogously, fjM(t) stands for the population response of a minipatch. Significant activation of the whole minipatch is caused by broad cortical waves.
We model local interactions with a “Mexican hat” function (see Assumptions):
 |
where matrix Wkl is the strength of interaction between minicolumns l and k; JE and JI encode the strength of excitation and inhibition, respectively; σe and σi the range of their influence; and ||r⃗k − r⃗l|| stands for Euclidean distance between minicolumns k and l. Multiplication by the cortical surface element δS, corresponding to a size of one minicolumn, ensures that fine patterns remain unaltered when the number of represented minicolumns is modified.
 |
 |
where nΔr is the number of minicolumns within the radius Δr of the minipatch.
The initial state of the iRF-matrix, when connections are not yet clustered, is defined as follows:
 |
where Mkj represents the strength of synaptic connection from minipatch j to minicolumn k; cM is a constant (cM > 0, because the interactions are mainly excitatory), and nM is the number of minipatches. By definition, the central minipatch does not influence itself through long-range connections (Mkj0 = 0).
Coarse patterns.
The creation of fine patterns is triggered by broad waves, when these pass through the central minipatch. Therefore, we consider only those patterns, which pass through the central minipatch. These waves have an arc-like shape.
Each minipatch activity (fjM) represents an average activity over its hexagonal area. The algorithms describing coarse patterns are defined first in the finely sampled Cartesian plane (here sampled at 0.025 mm) and then averaged over relevant hexagons (Fig. 2, top).
Figure 2.

Cortical activity and coarse patterns. Cortical activity (top left) is averaged over hexagonal areas resulting in a coarse pattern (top right). Our simulated coarse patterns correspond to wavefronts of spreading activity. The edge curvature depends on the location of the activity center (R0, Φ0) and its radius (R = R0) at the time it reaches the simulated cortical patch. The arc is assumed to have a flattened Gaussian profile of width 2ΔR and smoothing constant σR. Representative coarse patterns used in learning are shown below, from the lowest R value to the highest R value used in the simulation. The values of R and Φ0 are as follows, from left to right: {0.2 mm, 129°}, {3.5 mm, 9°}, {5.3 mm, 251°}, {6.0 mm, 360°}, {9.1 mm, 122°}, and {20.0 mm, 88°}.
Spontaneous patterns of activity are defined as rings of amplitude 1 with Gaussian edges:
 |
where ρ is the distance from ring center, R stands for ring's radius, 2ΔR for its width, and ΦR is a Gaussian smoothing constant (Fig. 2, top left). The center of the ring is located at distance R0 = R from the center of the simulated cortex and at angle Φ0 from the horizontal.
Angle values of coarse patterns used in the simulation were generated randomly from uniform distribution spanning the whole plane [Φ0 ∈ (0°, 360°); note that the angles Φ0 and Φ0 + 180° correspond to the same orientation but different curvature of spontaneous activity]. Assuming that probability of wave generation grows linearly with distance (probability is proportional to the surface of the ring), we chose a probability distribution p(R) = 1/10R mm−1 for the ring radius (R = R0, R ≤ 20 mm). While choosing the width of activity patterns, we relied on the calculations provided by Miller (1994). Miller estimated the half-width correlation function of cortical patterns evoked by retinal waves to be at least two to four times larger than a single aRF. A minipatch in our model covers more than a single RF, because it represents neurons with partially overlapping RFs. We estimate Miller's activity pattern to cover ∼1–2 minipatches and choose appropriately 2ΔR = 3 mm, 2σR = 1 mm. Exemplary coarse patterns are shown in Figure 2.
Learning.
In addition to stimulating the emergence of fine patterns, coarse activity triggers plasticity in synapses of horizontal connections (represented by matrix M), which leads to their clustering. We do not investigate short-range connection changes, having assumed they are small enough to sustain stable fine patterns.
We found that the model does not depend strongly on the choice of a learning rule. We settled for the simplest (and computationally least expensive), Hebbian learning:
 |
 |
where M = M(t), f = f(t), fM = fM(t), and h defines the learning rate. The activity threshold f0H determines when a minicolumn is active enough to strengthen its connections, as in the BCM learning rule (Bienenstock et al., 1982). Instead of modeling depression directly [H(x < 0) would be set to −1], we keep the sum of all the synaptic weights connecting to a minicolumn constant. This normalization is enforced by the bracketed expression in Equation 10, ensuring convergence to a state, where
 |
Evaluating orientation maps.
To evaluate orientation maps, we pause learning and test the response of minipatches to oriented bars. In vivo, stimuli need to activate photoreceptors. Here, we can impose visual responsiveness and simulate the transfer of impulses by filtering the stimuli. We do not assume an ON/OFF mechanism working at this developmental stage; thus, our filtering will represent linear response to an overall RF stimulation.
The bars are defined as rectangles of a given width (ΔyB), length (ΔxB), and orientation (ΦB = {0, 30°, …, 150°}). The filtering is performed with a disk filter corresponding to the cortical point size (rB = 0.5 mm). They are cast onto a hexagonal grid the same way the spontaneous activity patterns are (see above and Fig. 2, top).
We calculate the stable response to stimuli of different orientations (fΦB) as an average response over 100 ms starting 400 ms after stimulus onset. We use a vector sum to find the preferred orientation:
 |
and a modified circular variance (Swindale, 1998) to estimate orientation selectivity:
 |
The similarity between two maps is calculated as an average circular difference between preferred orientations ΦOM1, ΦOM2 of every minicolumn k:
 |
where n stands for the number of minicolumns.
We decided to base our calculations on 50 trials (a number realistic in terms of animal experiments), averaging responses to each stimulus over trials before evaluating the map. A larger number of repetitions leads to higher similarity between investigated maps. Consequently, one finds significant correlations stemming from the slightest intracortical anisotropy, something that would never be revealed in real experiments.
Choice of parameters.
In our simulations, we adopted parameters from Ernst et al. (2001). Values of JE, JI, σE, and σI were set to fit a realistic spatial scale (Table 1). To keep the number of system parameters low, in contrast to their approach, we did not simulate spatial variability in the connection strengths. Our calculations confirm that modifying intracortical synaptic weights with a noise of reasonable amplitude does not influence the results of our simulation. Strong noise dominates the dynamics, letting activity blobs form only in certain places, as in Ernst et al. (2001). In our simulation, the corresponding effect is achieved by plasticity of long-range connections.
Table 1.
Parameters of the simulation
| Variable | Value | Unit |
|---|---|---|
| Δr | 1 | mm |
| JE | 40δS | mm2 |
| JI | 60δS | mm2 |
| σE | 0.13 | mm |
| σI | 0.24 | mm |
| S | 0.6 | mV−1 |
| ση | 0.5 | |
| h | 10−7 | |
| f0H | 0.7 | |
| cM | 1 |
The relaxation constant τ in Equation 1 is set to 5ΔT, where ΔT = 1 is the time step used to solve the above equations numerically (Euler method). This time unit can be interpreted as 1 ms, which implies that minicolumn activity would decay within 10 ms. Following Ernst et al. (2001), we do not consider synaptic delays, because we are interested in stable activity rather than modeling activity's emergence.
The time evolution of fine pattern depends on the strength of short-range connections W (Eq. 5), steepness s of sigmoid function (Eq. 3), and the input IM = Σj≠j0 Mkj fjM (Eq. 4). Increasing any of those parameters accelerates establishment of blobby activity (supplemental Fig. S1A,B, available at www.jneurosci.org as supplemental material). Phase space analysis has shown that the input noise variance ση2 (Eq. 4) has no effect on emergence, but its increase inhibits the stabilization of fine patterns (supplemental Fig. S1C, available at www.jneurosci.org as supplemental material).
After arbitrarily choosing ση to be 50% of the maximum long-range input value (cM), we set the parameter s such that the fine pattern is visible within 200 ms from the input onset and stabilizes within the next 100 ms (supplemental Fig. S1A, available at www.jneurosci.org as supplemental material). At the chosen working point, fine patterns develop even when IM is negligible, according to our assumption that all activity waves modeled are strong enough to induce this dynamics.
Results
At the beginning of our simulation, blobs of activity form in random places. Growth of a typical fine pattern is shown in Figure 3.
Figure 3.

Growth of a typical fine pattern. The generation of fine patterns is influenced by random activity [η(t)]; hence, its timing is not precisely determined. In most cases, fine patterns become visible within the first 200 ms and stabilize over the next 100 ms. First frame, initial activation by a spontaneous activity burst; middle frame, emergence of blobby activity (157 ms); last frame, a stable pattern (200 ms).
Simulated bursts of spontaneous coarse activity lead to Hebbian plasticity of long-range connections between active loci in fine and coarse patterns. The speed of learning is controlled by the rate constant h in Equation 10 or the time interval T over which a single pattern activates the central minipatch. Development of intracortical receptive fields for T = 2 s and h = 10−7 is shown in Figure 4 after different numbers nT of stimuli.
Figure 4.

Development of iRFs. The panels present iRFs of two minicolumns. The most anisotropic iRF is only slightly structured after nT = 25 stimulus presentations (top right), but becomes clearly elongated after a longer time of development (bottom right, nT = 2500). The most symmetric iRFs cover the whole patch in the beginning (top left), and they contract in the course of development (bottom left).
At an early stage, iRFs are flat, covering the whole patch (Fig. 4, top), and it is hard to detect elongated iRF (note the change of scale in the top right panel). Only after some time, elongated iRFs become visible (Fig. 4, bottom right), having lost connections from nonrelevant minipatches. All iRFs connect strongest to the closest neighbors, also the symmetric ones (Fig. 4, bottom left).
At a late stage of simulation, synapses originating from any remote minipatch are clearly clustered, as in anterograde labeling in vivo (Galuske and Singer, 1996). See Figure 5 for an example and supplemental Fig. S2 (available at www.jneurosci.org as supplemental material) for all iRFs.
Figure 5.

Axonal tuft. An example of distribution of connections from a remote minipatch to the central one (full representation is shown in supplemental Fig. S2, available at www.jneurosci.org as supplemental material). Axon terminals are clearly clustered.
Elongated iRFs cause symmetry breaking in minipattern generation, blobs form faster (10 ms on average) in response to oriented stimuli, and it is possible to define a mapping between coarse and fine patterns.
An OM established after nT = 2500 is presented as a polar map in Figure 6. Exemplary tuning curves from the extreme cases of low and high orientation selectivity (L) are shown at the bottom. The map resembles experimental findings: it contains regions of continuous change of orientation (linear zones), saddle points, fractures, and pinwheels. The map is periodic with a period of ∼1 mm, having a bandpass rather than a low-pass spectrum (see supplemental Fig. S3, available at www.jneurosci.org as supplemental material). Singularities are embedded in the area of lower orientation selectivity, and the strongest and most reliable responses come from linear zones, in accord with experimental findings.
Figure 6.

Orientation map established in the central minipatch at nT = 2500. The preferred orientation is represented by color and by the orientation of line segments, their length representing the strength of orientation selectivity (L). Bottom, Typical orientation tuning curves (left, high selectivity; right, low selectivity).
The distribution of preferred orientations is biased toward 90°, 30°, and −30°, corresponding to the symmetry axes of the hexagonal grid. Establishment of a similar map has been predicted theoretically for a case when the number of complex vectors determining map structure is restricted to three (Wolf, 2005). Less regular, more realistic maps are expected when the number of modes (complex vectors) increases. We would expect a similar result if our patch could be circular (if we used a finer grid). As shown by Wolf (2005), a second kind of map might have developed, in which there is a large overrepresentation of a single orientation.
Stability
Once an orientation map develops, it becomes very stable. We computed the correlation between subsequent OMs to reveal the time span of ontogenesis (supplemental Fig. S4, available at www.jneurosci.org as supplemental material). For the chosen parameter set, nT = 1500 spontaneous bursts were sufficient to establish a robust OM. Subsequent learning had little influence on the OM shape. Similar stability may be achieved with simple Hebbian learning (f0H = 0), provided that noise in the system is not high (supplemental Fig. S4, available at www.jneurosci.org as supplemental material). Thresholded learning prevents all the neurons from developing the same iRF, e.g., in cases when a similar pattern is repeatedly shown to the cortex.
Orientation selectivity
We performed a set of experiments to check how OM structure would depend on the kind of stimuli used for its evaluation. For comparison, we used an unorganized, “random,” system with long-range connections drawn from a uniform distribution [Mkj ∈ (0 … 1), Mkj0 = 0], normalized to comply with Equation 12. Our map did not change with changing testing bar width [in the range ΔyB ∈ (0.1, 6), ΔxB = 20 mm] or length [ΔxB ∈ (2.5, 13), ΔyB = 1.5 mm]. In contrast, the OM in the “random” system strongly depended on the stimuli used for evaluation (see supplemental Fig. S5, available at www.jneurosci.org as supplemental material). All these maps were continuous (see supplemental material, available at www.jneurosci.org), but their orientation selectivity was much lower than in our system. In supplemental material (available at www.jneurosci.org), we present maps evaluated in our two systems for the case when fine patterns are not forced to form. The “random” system produces a chaotically arranged OM, whereas our map has the typical structure observed in adult animals. That means that as soon as the intracortical scaffold evolves in the way presented by our simulation, our assumption on fine patterns is no longer necessary. Thus, our model does not require a Mexican hat-like connectivity in adult animals (see Discussion).
Our tests revealed that even in the “random” system, maps can be positively correlated, especially when evaluated with broad and long stimuli that stimulate major parts of iRFs. Could this correlation suffice as a scaffold for OM maturation in later stages of development? We performed one more comparison using more realistic stimuli, by adding a noisy background to every stimulus.
The resulting map in the “random” system, evaluated with broad stimuli, was different every time the background was changed, although average similarity among those maps was still positive. In contrast, the OM in our model did not change under the same conditions (Fig. 7). However, when the stimuli were weak compared with the noise in the background, neither system had a reliable orientation map. We conclude that regular arrangement of intracortical connections is a more reliable source of orientation-specific information than random connectivity.
Figure 7.

Can orientation specificity be set up by random horizontal connections? We compared orientation specificity in our system after development of elongated intracortical receptive fields to the behavior of a system having random intracortical connectivity. In every one of 40 experiments, we evaluated orientation maps using bar stimuli (ΔyB = 2 mm, ΔxB = 20 mm; see Materials and Methods) against a noisy background. The background was changed between experiments, intensity values being drawn from a uniform distribution (0, 1), but keeping the overall minipatch activity within the same range [fkM ∈ (0, 1)]. Pairwise similarities between maps (sOM, x-axis) for these stimuli are shown as a histogram (the total number of occurrences in the y-axis). For the “random” system, similarities are very dependent on the background (white bars), whereas the orientation map in our system stays the same (black bars).
However, the influence of our scaffold is limited to stimuli spanning a few neighboring RFs, because the orientation selectivity derives from interactions between neighboring minipatches (it is not feasible to use short stimuli, ΔxB <2 mm, to investigate our OMs). This requirement is described by Shouval et al. (2000), whose model we propose as a natural continuation of our simulation. Their definition of coaxial connectivity is equal to the iRFs achieved in our simulation. They claim the axial component alone is sufficient for the model to work, referring to a smaller simulation (Goldberg et al., 1999).
The comodular component of connectivity in Shouval et al. (2000) could be modeled in our simulation if the fine patterns were regarded also in the neighboring minipatches. This would lead to more evident clustering (available with retrograde tracers). Laterally connected groups of neurons would share similar orientation preference, as found in adult animals (Payne and Peters, 2001; Chisum et al., 2003). This could be responsible for clustering of L2/3 connections observed after eye opening, a period we are not simulating here.
Discussion
We have shown how intracortical connections may develop and serve as a scaffold for OMs. We made two basic assumptions: (1) Early cortical spontaneous activity can be described on a coarse scale, having a width of at least one orientation hypercolumn (≥1 mm). Most of such coarse activity patterns are elongated on a large scale; that is, they are several millimeters long. (2) These patterns induce a spatially periodic activity on a fine scale (“fine activity patterns”). Mexican hat connectivity within hypercolumns assures that periodic arrays of local patches are active at any given time.
Combining the above assumptions with Hebbian plasticity, one finds that a periodic set of patches within a hypercolumn comes to receive long-range intracortical connections elongated in one direction across cortex. Patches connect to neighbors with similar angle of elongation. Thus, a patch becomes an orientation column: it has a preferred orientation corresponding to the angle of elongation of its long-range connections, and nearby patches have similar preferred orientations.
Our mechanism is not upset by round or strongly curved stimuli, as generated by spots of spontaneous activity waves. What we propose is not a complete model of OM development, because given only such connectivity there would be no consistent orientation selectivity for localized stimuli that activate only one or two hypercolumns. We therefore assume that this connectivity (the iRF) serves as a scaffold for subsequent development of finer-scale feedforward connections (the aRF) that mediate finer scale selectivity. Shouval et al. (2000) have shown how such elongated iRFs could mediate learning of aRFs from natural images after eye opening. Only experiments may verify whether short stimuli and long stimuli yield identical OMs before exposure to natural vision. If they do, other means of bridging from iRFs to aRFs must be sought.
We encourage research in the youngest animals using low-frequency, slow-moving gratings to test whether the results predict a different time course of OM development than known so far. With electrophysiology, it has been shown previously that stimulation with very low-frequency gratings makes it possible to observe orientation selectivity in ferrets 1 week earlier than stimulation with sweeping bars (Chapman and Stryker, 1993; Krug et al., 2001). As discussed in Usrey et al. (2003), not only varying the stimuli, but also the anesthetics, may lead to different results than presently known.
Under the current state of the art, there are several empirical uncertainties for the presented scenario. The existence of the postulated coarse-scale activity patterns remains to be verified. Retinal waves could be one source of patterns on the proper scale, but these patterns disappear before OMs are visible in optical recording. It is possible that orientation selectivity is encoded in long-range horizontal connections before the visual system matures to the level allowing OM detection. Alternatively, other possible sources of large-scale patterns exist (see Materials and Methods, Evaluation of assumptions). In our model, the elongation of cortical connections is the first step in OM development. We postulate that long-range connections, observed earlier in development in L1 and/or the subplate (Galuske and Singer, 1996), may show the necessary elongation at the appropriate time across species.
Patchy axonal terminals observed in L2/3 of older animals (Crair et al., 1998) imply periodic fine activity patterns to occur in those layers. We used Mexican hat-like interactions to induce patchy activity, but there is little evidence for this architecture in adult animals. Inhibitory and excitatory interactions are said to act on a similar spatial range (Kang et al., 2003). However, this balance could be different in young animals; e.g., Chen et al. (2005) recorded twofold shrinkage of inhibitory axons in postnatal ferrets. Once the scaffold is established, our model no longer requires Mexican hat connectivity to induce periodic activity (supplemental Fig. S6, available at www.jneurosci.org as supplemental material).
Possibly, lack of Mexican hat interactions at the early time of development can be the reason why some mammals do not develop OMs. According to our model, the lack of fine patterns may also be attributable to (1) heterogeneous distribution of neuronal types, (2) low level of activity, or (3) strong noisy signals from other areas (supplemental Fig. S1, available at www.jneurosci.org as supplemental material). Comparative studies failed so far to find the reason for the variety of orientation preference arrangements in different species, but all of them were performed in adult animals (Van Hooser et al., 2005). We would be very interested in discovering how local interactions change with age in different species.
The role of horizontal connectivity in establishing and sustaining OMs has been predicted mathematically (Wolf, 2005) and confirmed in multiple experiments. For example, in recovery from retinal lesions, a part of a scotoma regains activity without rejoining thalamic input (Eysel and Schweigart, 1999). The OM of the reorganized cortex shows a close match to that obtained before placing the lesion, despite the large shift in topography, a finding which provides strong argument to the hypothesis that an intracortical scaffold is responsible for the remapping.
Another interesting experiment revealed that silencing early retinal activity in ferrets leads to RF enlargement of binocular neurons (Huberman et al., 2006). Is generation of coarse activity patterns affected in these ferrets, and do they lack the initial scaffold for OMs? Is maturation of afferents in binocular neurons impaired so that they still have to rely on (unstructured) intracortical connections? We look forward to results of OMs studies with retinal activity silencing.
The role of spontaneous activity in the establishment of OMs is experimentally confirmed: normally structured OMs develop in dark-reared ferrets (White et al., 2001) and binocularly deprived cats (Crair et al., 1998); identical OM structure is derived from contralateral and ipsilateral inputs in the absence of common visual experience (Gödecke and Bonhoeffer, 1996; Löwel et al., 1998). However, these observations can also be explained by aRF models (Miller and Erwin, 2001). What is then the advantage of an early establishment of orientation specificity by lateral connections?
Our model presents the most natural way to understand how orientation is arranged regularly before eye opening, whereas many properties referring to aRF structure (e.g., spatial phase and position) still vary randomly (DeAngelis et al., 1999). Until now, aRF-based Hebbian models have been able to simulate ontogenesis of continuous OMs with neural sensitivity to maximally two (orthogonal) spatial phases (Kayser and Miller, 2002). However, those maps are low-pass, in contrast to experimentally described bandpass maps. Such result is determined by regarding various input phases (as explained by Kayser and Miller). In our simulation, we achieve orientation specificity to afferent input of low resolution, which uniformly activates the whole aRF. In other words, the ontogenesis of complex cortical cells precedes the development of phase-dependent simple cells. As a consequence, bandpass maps emerge.
Low-pass OMs were recorded in the auditory cortex of ferrets after early rerouting of visual afferents (Sharma et al., 2000). This could indicate that those maps develop on the basis of an aRF-based mechanism rather than through intracortical connections.
The most recent reviews on modeling visual cortex development (Erwin et al., 1995; Swindale, 1996) have provided good motivation for further work in the field. Most of the models proposed since then are based on the idea of elongated aRFs. Bartsch and van Hemmen (2001) simulated short-range axon elongation, but they discuss neither the spatial phases nor the final OM spectrum, the two problems arising in Hebbian aRF-based learning. Other hypotheses are also further investigated, e.g., elastic nets (Carreira-Perpinan et al., 2005) or diffusive signaling (Bhaumik and Mathur, 2003). Ringach (2004) proposed that aRF ontogenesis results from statistical sampling of retinal ganglion cells. Authors rarely discuss the reason why proposed mechanisms do not work in mammals lacking OMs (but see Koulakov and Chklovskii, 2001).
In contrast to models proposed so far, we do not assume fine cortical arrangement and mature retinotopy in the young brain; therefore, our model is compatible with a large RF scatter (Buzás et al., 2003) and the vivid plasticity of afferent RFs observed postnatally (Hosoya et al., 2005). In addition, our model in its present form leaves open the possibility that a mechanism could be devised that would learn multiple spatial phases of a single orientation at a single location.
We have shown that random intracortical connectivity leads to a map that is hardly orientation specific; it changes when stimuli parameters other than orientation are changed. Whether such random scaffold suffices to set up a reliable OM after eye opening remains a question.
We encourage research in very young animals before visual experience. Comparing maps evaluated with broad gratings with maps induced by short and narrow stimuli can determine whether intracortical long-range connectivity is indeed responsible for OM establishment. Comparing anatomy and physiology of young visual cortices may reveal the reason why some mammalian species do not have OMs. According to our hypothesis, they should lack a mechanism leading to spatially periodic activity patterns. OMs in animals deprived of retinal waves could be low-pass rather than bandpass, as in “rewired” ferret A1. Any other abnormality in those animals would give an interesting insight into the role of intracortical scaffold in setting up the OM.
Footnotes
This work was supported by the Bochum International Graduate School of Neuroscience, the Hertie Foundation, and the Project Daisy of the European Union. We thank sincerely Marek Barwinski and an anonymous reviewer of this article for their help during the preparation of this manuscript.
References
- Akerman CJ, Grubb MS, Thompson ID. Spatial and temporal properties of visual responses in the thalamus of the developing ferret. J Neurosci. 2004;24:170–182. doi: 10.1523/JNEUROSCI.1002-03.2004. [DOI] [PMC free article] [PubMed] [Google Scholar]
- Albus K, Wahle P. The topography of tangential inhibitory connections in the postnatally developing and mature striate cortex of the cat. Eur J Neurosci. 1994;6:779–792. doi: 10.1111/j.1460-9568.1994.tb00989.x. [DOI] [PubMed] [Google Scholar]
- Baker T, Issa N. Cortical maps of separable tuning properties predict population responses to complex visual stimuli. J Neurophysiol. 2005;94:775–787. doi: 10.1152/jn.01093.2004. [DOI] [PubMed] [Google Scholar]
- Bartsch AP, van Hemmen JL. Combined Hebbian development of geniculocortical and lateral connectivity in a model of primary visual cortex. Biol Cybern. 2001;84:41–55. doi: 10.1007/s004220170003. [DOI] [PubMed] [Google Scholar]
- Bhaumik B, Mathur M. A cooperation and competition based simple cell receptive field model and study of feed-forward linear and nonlinear contributions to orientation selectivity. J Comput Neurosci. 2003;14:211–227. doi: 10.1023/a:1021911019241. [DOI] [PubMed] [Google Scholar]
- Bienenstock EL, Cooper LN, Munro PW. Theory for the development of neuron selectivity: orientation specificity and binocular interaction in visual cortex. J Neurosci. 1982;2:32–48. doi: 10.1523/JNEUROSCI.02-01-00032.1982. [DOI] [PMC free article] [PubMed] [Google Scholar]
- Buxhoeveden D, Casanova M. The minicolumn and evolution of the brain. Brain Behav Evol. 2002;60:125–151. doi: 10.1159/000065935. [DOI] [PubMed] [Google Scholar]
- Buzás P, Volgushev M, Eysel U, Kisvárday Z. Independence of visuotopic representation and orientation map in the visual cortex of the cat. Eur J Neurosci. 2003;18:957–968. doi: 10.1046/j.1460-9568.2003.02808.x. [DOI] [PubMed] [Google Scholar]
- Carreira-Perpiñán MA, Goodhill GJ. Influence of lateral connections on the structure of cortical maps. J Neurophysiol. 2004;92:2947–2959. doi: 10.1152/jn.00281.2004. [DOI] [PubMed] [Google Scholar]
- Carreira-Perpiñán MA, Lister RJ, Goodhill GJ. A computational model for the development of multiple maps in primary visual cortex. Cereb Cortex. 2005;15:1222–1233. doi: 10.1093/cercor/bhi004. [DOI] [PubMed] [Google Scholar]
- Chapman B, Stryker M. Development of orientation selectivity in ferret visual cortex and effects of deprivation. J Neurosci. 1993;13:5251–5262. doi: 10.1523/JNEUROSCI.13-12-05251.1993. [DOI] [PMC free article] [PubMed] [Google Scholar]
- Chen B, Boukamel K, Kao J, Roerig B. Spatial distribution of inhibitory synaptic connections during development of ferret primary visual cortex. Exp Brain Res. 2005;160:496–509. doi: 10.1007/s00221-004-2029-4. [DOI] [PubMed] [Google Scholar]
- Chisum HJ, Mooser F, Fitzpatrick D. Emergent properties of layer 2/3 neurons reflect the collinear arrangement of horizontal connections in tree shrew visual cortex. J Neurosci. 2003;23:2947–2960. doi: 10.1523/JNEUROSCI.23-07-02947.2003. [DOI] [PMC free article] [PubMed] [Google Scholar]
- Chiu C, Weliky M. Spontaneous activity in developing ferret visual cortex in vivo. J Neurosci. 2001;21:8906–8914. doi: 10.1523/JNEUROSCI.21-22-08906.2001. [DOI] [PMC free article] [PubMed] [Google Scholar]
- Crair M, Gillespie D, Stryker M. The role of visual experience in the development of columns in cat visual cortex. Science. 1998;279:566–570. doi: 10.1126/science.279.5350.566. [DOI] [PMC free article] [PubMed] [Google Scholar]
- DeAngelis G, Ghose G, Ohzawa I, Freeman R. Functional micro-organization of primary visual cortex: receptive field analysis of nearby neurons. J Neurosci. 1999;19:4046–4064. doi: 10.1523/JNEUROSCI.19-10-04046.1999. [DOI] [PMC free article] [PubMed] [Google Scholar]
- Durack J, Katz L. Development of horizontal projections in layer 2/3 of ferret visual cortex. Cereb Cortex. 1996;6:178–183. doi: 10.1093/cercor/6.2.178. [DOI] [PubMed] [Google Scholar]
- Elliott T, Shadbolt N. A neurotrophic model of the development of the retinogeniculocortical pathway induced by spontaneous retinal waves. J Neurosci. 1999;19:7951–7970. doi: 10.1523/JNEUROSCI.19-18-07951.1999. [DOI] [PMC free article] [PubMed] [Google Scholar]
- Ernst U, Pawelzik K, Sahar-Pikielny C, Tsodyks M. Intracortical origin of visual maps. Nature. 2001;4:431–436. doi: 10.1038/86089. [DOI] [PubMed] [Google Scholar]
- Erwin E, Obermayer K, Schulten K. Models of orientation and ocular dominance columns in the visual cortex: a critical comparison. Neural Comput. 1995;7:425–468. doi: 10.1162/neco.1995.7.3.425. [DOI] [PubMed] [Google Scholar]
- Eysel U, Schweigart G. Increased receptive field size in the surround of chronic lesions in the adult cat visual cortex. Cereb Cortex. 1999;9:101–109. doi: 10.1093/cercor/9.2.101. [DOI] [PubMed] [Google Scholar]
- Feller M, Wellis D, Stellwagen D, Werblin F, Shatz C. Requirement for cholinergic synaptic transmission in the propagation of spontaneous retinal waves. Science. 1996;272:1182–1187. doi: 10.1126/science.272.5265.1182. [DOI] [PubMed] [Google Scholar]
- Galuske R, Singer W. The origin and topography of long-range intrinsic projections in cat visual cortex: a developmental study. Cereb Cortex. 1996;6:417–430. doi: 10.1093/cercor/6.3.417. [DOI] [PubMed] [Google Scholar]
- Gödecke I, Bonhoeffer T. Development of identical orientation maps for two eyes without common visual experience. Nature. 1996;379:251–254. doi: 10.1038/379251a0. [DOI] [PubMed] [Google Scholar]
- Goldberg DH, Shouval H, Cooper LN. Lateral connectivity as a scaffold for developing orientation preference maps. Neurocomputing. 1999;26–27:381–387. [Google Scholar]
- Grossberg S, Seitz A. Laminar development of receptive fields, maps and columns in visual cortex: the coordinating role of the subplate. Cereb Cortex. 2003;13:852–863. doi: 10.1093/cercor/13.8.852. [DOI] [PubMed] [Google Scholar]
- Hosoya T, Baccus SA, Meister M. Dynamic predictive coding by the retina. Nature. 2005;436:71–77. doi: 10.1038/nature03689. [DOI] [PubMed] [Google Scholar]
- Hubel D, Wiesel T. Sequence regularity and geometry of orientation columns in the monkey striate cortex. J Comp Neurol. 1974a;158:267–294. doi: 10.1002/cne.901580304. [DOI] [PubMed] [Google Scholar]
- Hubel D, Wiesel T. Uniformity of monkey striate cortex: a parallel relationship between field size, scatter and magnification factor. J Comp Neurol. 1974b;158:295–306. doi: 10.1002/cne.901580305. [DOI] [PubMed] [Google Scholar]
- Huberman AD, Speer CM, Chapman B. Spontaneous retinal activity mediates development of ocular dominance columns and binocular receptive fields in V1. Neuron. 2006;52:247–254. doi: 10.1016/j.neuron.2006.07.028. [DOI] [PMC free article] [PubMed] [Google Scholar]
- Kang K, Shelley M, Sompolinsky H. Mexican hats and pinwheels in visual cortex. Proc Natl Acad Sci USA. 2003;100:2848–2853. doi: 10.1073/pnas.0138051100. [DOI] [PMC free article] [PubMed] [Google Scholar]
- Kanold P, Kara P, Reid R, Shatz C. Role of subplate neurons in functional maturation of visual cortical columns. Science. 2003;301:521–525. doi: 10.1126/science.1084152. [DOI] [PubMed] [Google Scholar]
- Kayser A, Miller K. Opponent inhibition: a developmental model of layer 4 of the neocortical circuit. Neuron. 2002;33:131–142. doi: 10.1016/s0896-6273(01)00570-0. [DOI] [PubMed] [Google Scholar]
- Koulakov AA, Chklovskii DB. Orientation preference patterns in mammalian visual cortex: a wire length minimization approach. Neuron. 2001;29:519–527. doi: 10.1016/s0896-6273(01)00223-9. [DOI] [PubMed] [Google Scholar]
- Krug K, Akerman C, Thompson I. Responses of neurons in neonatal cortex and thalamus to patterned visual stimulation through the naturally closed lids. J Neurophysiol. 2001;85:1436–1443. doi: 10.1152/jn.2001.85.4.1436. [DOI] [PubMed] [Google Scholar]
- Liets L, Olshausen A, Guo-Yong W, Chalupa L. Spontaneous activity of morphologically identified ganglion cells in the developing ferret retina. J Neurosci. 2003;23:7343–7350. doi: 10.1523/JNEUROSCI.23-19-07343.2003. [DOI] [PMC free article] [PubMed] [Google Scholar]
- Linsker R. From basic network principles to neural architecture: emergence of spatial-opponent cells. Proc Natl Acad Sci USA. 1986a;83:7508–7512. doi: 10.1073/pnas.83.19.7508. [DOI] [PMC free article] [PubMed] [Google Scholar]
- Linsker R. From basic network principles to neural architecture: emergence of orientation-selective cells. Proc Natl Acad Sci USA. 1986b;83:8390–8394. doi: 10.1073/pnas.83.21.8390. [DOI] [PMC free article] [PubMed] [Google Scholar]
- Linsker R. From basic network principles to neural architecture: emergence of orientation columns. Proc Natl Acad Sci USA. 1986c;83:8779–8783. doi: 10.1073/pnas.83.22.8779. [DOI] [PMC free article] [PubMed] [Google Scholar]
- Löwel S, Schmidt K, Kim D, Wolf F, Hoffsümmer F, Singer W, Bonhoeffer T. The layout of orientation and ocular dominance domains in area 17 of strabismic cats. Eur J Neurosci. 1998;10:2629–2643. doi: 10.1046/j.1460-9568.1998.00274.x. [DOI] [PubMed] [Google Scholar]
- Lund J, Angelucci A, Bressloff P. Anatomical substrates for functional columns in macaque monkey primary visual cortex. Cereb Cortex. 2003;13:15–24. doi: 10.1093/cercor/13.1.15. [DOI] [PubMed] [Google Scholar]
- Marks GA, Shaffery JP, Oksenberg A, Speciale SG, Roffwarg HP. A functional role for REM sleep in brain maturation. Behav Brain Res. 1995;69:1–11. doi: 10.1016/0166-4328(95)00018-o. [DOI] [PubMed] [Google Scholar]
- Meister M, Wong R, Baylor D, Shatz C. Synchronous bursts of action potentials in ganglion cells of the developing mammalian retina. Science. 1991;252:939–943. doi: 10.1126/science.2035024. [DOI] [PubMed] [Google Scholar]
- Miikkulainen R, Bednar J, Choe Y, Sirosh J. Berlin: Springer; 2005. Computational maps in the visual cortex. [Google Scholar]
- Miller KD. A model for the development of simple cell receptive fields and the ordered arrangement of orientation columns through the activity dependent competition between ON- and OFF-center inputs. J Neurosci. 1994;14:409–441. doi: 10.1523/JNEUROSCI.14-01-00409.1994. [DOI] [PMC free article] [PubMed] [Google Scholar]
- Miller KD, Erwin E. Effects of monocular deprivation and reverse suture on orientation maps can be explained by activity-instructed development of geniculocortical connections. Vis Neurosci. 2001;18:821–834. doi: 10.1017/s0952523801185159. [DOI] [PubMed] [Google Scholar]
- Payne B, Peters A, editors. San Diego: Academic; 2001. The cat primary visual cortex. [Google Scholar]
- Pinto D, Ermentrout G. Spatially structured activity in synaptically coupled neuronal networks: I. Traveling fronts and pulses. SIAM J Appl Math. 2001;62:206–225. [Google Scholar]
- Ringach D. Haphazard wiring of simple receptive fields and orientation columns in visual cortex. J Neurophysiol. 2004;92:468–476. doi: 10.1152/jn.01202.2003. [DOI] [PubMed] [Google Scholar]
- Rockland K, Ichinohe N. Some thoughts on cortical minicolumns. Exp Brain Res. 2004;158:265–277. doi: 10.1007/s00221-004-2024-9. [DOI] [PubMed] [Google Scholar]
- Schmidt KE, Galuske RA, Singer W. Matching the modules: cortical maps and long-range intrinsic connections in visual cortex during development. J Neurobiol. 1999;41:10–17. doi: 10.1002/(sici)1097-4695(199910)41:1<10::aid-neu3>3.0.co;2-l. [DOI] [PubMed] [Google Scholar]
- Sengpiel F, Kind P. The role of activity in development of the visual system. Curr Biol. 2002;12:818–826. doi: 10.1016/s0960-9822(02)01318-0. [DOI] [PubMed] [Google Scholar]
- Sharma J, Angelucci A, Sur M. Induction of visual orientation modules in auditory cortex. Nature. 2000;404:841–847. doi: 10.1038/35009043. [DOI] [PubMed] [Google Scholar]
- Shouval H, Goldberg D, Jones J, Beckermann M, Cooper L. Structured long-range connections can provide a scaffold for orientation maps. J Neurosci. 2000;20:1119–1128. doi: 10.1523/JNEUROSCI.20-03-01119.2000. [DOI] [PMC free article] [PubMed] [Google Scholar]
- Swindale N. The development of topography in the visual cortex: a review of models. Netw Comput Neural Syst. 1996;7:161–247. doi: 10.1088/0954-898X/7/2/002. [DOI] [PubMed] [Google Scholar]
- Swindale N. Orientation tuning curves: empirical description and estimation of parameters. Biol Cybern. 1998;78:45–56. doi: 10.1007/s004220050411. [DOI] [PubMed] [Google Scholar]
- Syed M, Lee S, He S, Zhou Z. Spontaneous waves in the ventricular zone of developing mammalian retina. J Neurophysiol. 2004;91:1999–2009. doi: 10.1152/jn.01129.2003. [DOI] [PubMed] [Google Scholar]
- Torborg CL, Feller MB. Spontaneous patterned retinal activity and the refinement of retinal projections. Prog Neurobiol. 2005;76:213–235. doi: 10.1016/j.pneurobio.2005.09.002. [DOI] [PubMed] [Google Scholar]
- Usrey W, Sceniak M, Chapman B. Receptive fields and response properties of neurons in layer 4 of ferret visual cortex. J Neurophysiol. 2003;89:1003–1015. doi: 10.1152/jn.00749.2002. [DOI] [PMC free article] [PubMed] [Google Scholar]
- Van Hooser S, Heimel J, Chung S, Nelson S, Toth L. Orientation selectivity without orientation maps in visual cortex of a highly visual mammal. J Neurosci. 2005;25:19–28. doi: 10.1523/JNEUROSCI.4042-04.2005. [DOI] [PMC free article] [PubMed] [Google Scholar]
- von der Malsburg C. Self-organization of orientation sensitive cells in the striate cortex. Kybernetik. 1973;14:85–100. doi: 10.1007/BF00288907. [DOI] [PubMed] [Google Scholar]
- von der Malsburg C. Network self-organization in the ontogenesis of the mammalian visual system. In: Zornetzer S, Davis J, Lau C, McKenna T, editors. An introduction to neural and electronic networks. Ed 2. San Diego: Academic; 1995. pp. 447–462. [Google Scholar]
- Weliky M, Katz L. Correlational structure of spontaneous neuronal activity in the developing lateral geniculate nucleus in vivo. Science. 1999;285:599–604. doi: 10.1126/science.285.5427.599. [DOI] [PubMed] [Google Scholar]
- White L, Coppola D, Fitzpatrick W. The contribution of sensory experience to the maturation of orientation selectivity in ferret visual cortex. Nature. 2001;411:1049–1052. doi: 10.1038/35082568. [DOI] [PubMed] [Google Scholar]
- Wolf F. Symmetry, multistability, and long-range interactions in brain development. Phys Rev Lett. 2005;95:208701. doi: 10.1103/PhysRevLett.95.208701. [DOI] [PubMed] [Google Scholar]
- Wong R. Retinal waves and visual system development. Annu Rev Neurosci. 1999;22:29–47. doi: 10.1146/annurev.neuro.22.1.29. [DOI] [PubMed] [Google Scholar]