

Abstract
Giant synapses between layer 5B (L5B) neurons of somatosensory (barrel) cortex and neurons of the posteromedial nucleus (POm) of thalamus reside in a key position of the cortico-thalamo-cortical (CTC) loop, yet their synaptic properties and contribution to CTC information processing remain poorly understood. Fluorescence-guided local stimulation of terminals were combined with postsynaptic whole-cell recordings in thalamus to study synaptic transmission at an identified giant synapse. We found large EPSCs mediated by Ca2+-permeable AMPA and NMDA receptors. A single presynaptic electrical stimulus evoked a train of postsynaptic action potentials, indicating that a single L5B input can effectively drive the thalamic neuron. Repetitive stimulation caused strong short-term depression (STD) with fast recovery. To examine how these synaptic properties affect information transfer, spontaneous and evoked activity of L5B neurons was recorded in vivo and played back to giant terminals in vitro. We found that suprathreshold synaptic transmission was suppressed because of spontaneous activity causing strong STD of the L5B–POm giant synapse. Thalamic neurons only spiked after intervals of presynaptic silence or when costimulating two giant terminals. Therefore, STD caused by spontaneous activity of L5B neurons can switch the synapse from a “driver mode” to a “coincidence mode.” Mechanisms decreasing spontaneous activity in L5B neurons and inputs synchronized by a sensory stimulus may thus gate the cortico-thalamo-cortical loop.
Keywords: giant synapse, corticothalamic, short-term depression, low-pass filtering, virus-mediated gene expression, posteromedial nucleus of thalamus
Introduction
Synaptic communication between thalamus and cortex is essential in sensory-guided behavior (Steriade et al., 1997; Alitto and Usrey, 2003; Cudeiro and Sillito, 2006). Synaptic connections exist both from thalamus to cortex and from cortex to thalamus, forming cortico-thalamo-cortical (CTC) loops (Bourassa et al., 1995; Deschênes et al., 1998; Killackey and Sherman, 2003). It has become clear that the thalamus is not a simple relay station of ascending sensory information but is involved in processing of sensory information by integrating input from multiple sources (Kleinfeld et al., 2006; Yu et al., 2006; Urbain and Deschênes, 2007). For instance, it has been suggested that feedback from motor cortex enables gating of somatosensory information via an intrathalamic network (Lavallée et al., 2005; Urbain and Deschênes, 2007).
It has been shown that corticothalamic projection neurons form large terminals (>2 μm) on thalamic relay neurons, comparable with the giant terminals formed by the sensory afferent fibers (Hoogland et al., 1991). In the rat somatosensory (whisker) system, corticothalamic giant synapses are exclusively formed by thick-tufted pyramidal neurons in L5B projecting to the posterior medial nucleus (POm) of the thalamus (Hoogland et al., 1991; Bourassa et al., 1995; Veinante et al., 2000; Killackey and Sherman, 2003). Giant synapses have been described in thalamic nuclei of rodents, cats, and primates (Rouiller and Welker, 2000). Giant synapses also exist in different sensory afferent systems such as the somatosensory, visual, and auditory system as well as the motor system (for review, see Rouiller and Welker 2000). Thus, giant synapses are a common property of thalamic pathways across species. Functionally, corticothalamic giant terminals are thought to be driver inputs to the thalamus (Reichova and Sherman, 2004). Although basic anatomical properties of these giant synapses are known (Hoogland et al., 1991), a functional description of an identified type of giant synapse is as of yet lacking.
To study synaptic connections between two areas of the brain it is necessary to obtain recordings from synaptically connected neuronal pairs (Bruno and Sakmann, 2006). Studying long-range connections, such as corticothalamic projections, with paired recordings is technically challenging. Here, we introduce a novel approach that allows the direct stimulation of single corticothalamic giant terminals in the POm nucleus of the thalamus. Using virus-mediated expression of fluorescent proteins in projection neurons of infragranular cortical layers we labeled giant terminals originating from L5B neurons. We used two-photon scanning-gradient-contrast imaging (2P-SGC) (Wimmer et al., 2004) to visualize individual giant terminals simultaneously with their postsynaptic target cells and stimulated identified terminals while recording from the postsynaptic POm neuron.
The results suggest that L5B–POm synapses function as conditional cortical drivers. Spontaneous activity of L5B neurons suppressed action potential (AP) transfer via strong presynaptic short-term depression (STD). This suppression could be unlocked by periods of presynaptic silence or synchronized activity of two or more giant terminals. Hence, STD caused by spontaneous activity of L5B neurons provides a mechanism to shift the giant synapse between two functional modes: driver or coincidence detector.
Materials and Methods
Adenoassociated virus particles for expression of fluorescent proteins.
The cDNAs of fluorescent proteins membrane-bound green fluorescent protein (mGFP) (De Paola et al., 2003), mOrange (Shaner et al., 2004), enhanced GFP (EGFP), and synaptophysin-EGFP (Wimmer et al., 2004) were subcloned into a plasmid (pAM) containing adenoassociated virus 2 (AAV2) inverted terminal repeats flanking a cassette consisting of the 1.1 kb cytomegalovirus enhancer/chicken β-actin promoter, the woodchuck post-transcriptional regulatory element and the bovine growth hormone polyA. rAAV chimeric vectors (virions containing a 1:1 ratio of AAV1 and AAV2 capsid proteins with AAV2 inverted terminal repeats) were generated as described previously (During et al., 2003). Briefly, human embryonic kidney 293 cells were transfected with pAM and the two helper plasmids (Grimm et al., 2003), pDP1 and pDP2, using calcium phosphate precipitation. A crude cell lysate using benzonase endonuclease (Sigma E1014) was obtained after 3 d. Viral particles were purified from the lysate using heparin column purification (heparin agarose type I columns; Sigma H 6508).
Stereotaxic injection.
Experiments were conducted in accordance with the German animal welfare guidelines. Stereotaxic procedures were performed as described previously (Wimmer et al., 2004) but using isoflurane anesthesia. Briefly, Wistar rats (7 d old) were anesthetized with 1% isoflurane in O2. Local anesthesia was maintained with subcutaneous injection of ∼100 μl of lidocaine. The body temperature was recorded with a sensor and maintained at 38–38.5°C with a heating pad. Surgery time was kept <1 h and anesthesia was terminated by removing the isoflurane. Animals recovered within minutes and were returned to their mother. The incubation times after injection were typically between 10 and 14 d. The SAS75 stereotaxic alignment system was used in combination with the EM70G manipulator (Kopf Instruments). The injection capillaries were pulled on a P97 horizontal puller (Sutter Instrument) using micropipettes (5 II, intraMARK; BlauBrand). After skin incision a craniotomy of ∼2 mm in diameter was established with a dental drill (Osada EXL-40). The skull was leveled and aligned using an electronic leveling device (eLeVeLeR; Sigmann Elektronik). For cortical injections, ∼1 μl of virus solution was distributed over 8 injection sites with the following x, y coordinates relative to bregma and midline (in mm): (1) −1, 3.5; (2) −1.5, 3.5; (3) −2, 3.5; (4) −2.5, 3.5; (5) −1.25, 3.8; (6) −1.75, 3.8; (7) −2.25, 3.8; (8) −2.75, 3.8. At each of these x–y positions, injections were made at z positions −1.5 and −1.2 from dura. For POm injections 0.2 μl of virus solution (AAV mOrange) was injected to the following coordinates relative to bregma and midline (in mm): −3, 1.9, and −4.9 (z relative to dura).
Preparation of acute brain slices.
Acute brain slices were prepared 11–14 d after injection at postnatal day 18 to 21 (P18–P21) as described previously (Wimmer et al., 2004). Briefly, virus-injected rats were decapitated after isoflurane anesthesia and thalamocortical slices of the right hemisphere containing the somatosensory cortex and the thalamus were cut according to the procedure established by Agmon and Connors (1991). Slices were cut at a thickness of 250–300 μm with a vibratome (HR2; Sigmann Elektronik) in ice-cold solution containing (in mm) 125 NaCl, 2.5 KCl, 1.25 NaH2PO4, 1 MgCl2, 3 myoinositol, 2 sodium pyruvate, 0.4 vitamin C, 0.1 CaCl2, 2 MgCl2, 25 glucose, and 25 NaHCO3 and maintained at pH 7.4 by bubbling with 95% O2 and 5% CO2. Immediately after cutting, slices were transferred to a solution containing (in mm) 109 NaCl, 20 HEPES, 25 NaHCO3, 5 KCl, 1.25 NaH2PO4, 1.3 MgCl2, 10 glucose, and 1.5 CaCl2. The slices were incubated for 30 min at 35°C and then kept at room temperature.
Electrophysiology.
Whole-cell recordings were acquired using an Axopatch 200B amplifier (Molecular Devices). All recordings were done at 33–35°C. Pipettes for current recordings were filled with a solution containing (in mm) 120 cesium gluconate, 10 HEPES, 10 sodium phosphocreatine, 10 sodium gluconate, 4 ATP-Mg2+, 4 NaCl, 0.3 GTP, 0.1 EGTA, 0.1 spermine, and 2.5 2(triethylamino)-N-(2,6-dimethylphenyl) acetamine (QX-314; Tocris Bioscience). For voltage recordings, 120 mm cesium gluconate was substituted with 130 mm K-gluconate, and spermine and QX-314 were omitted. Intracellular solutions were brought to pH 7.2 with KOH. Alexa Fluor 594 hydrazide (40 μm) was present in all pipette filling solutions. Recordings were not corrected for liquid junction potential (∼11 mV). Open tip resistances ranged from 2 to 3 MΩ. Series resistance was compensated to 70–90% and was usually 10–20 MΩ.
For electrophysiological recordings, slices were perfused with a saline containing (in mm)125 NaCl, 2.5 KCl, 1.25 NaH2PO4, 1 MgCl2, 25 glucose, 2 CaCl2, and 25 NaHCO3, at pH 7.4 when bubbled with 95% O2 and 5% CO2. Drugs added to the bath solution were 10 μm bicuculline or SR95531 [2-(3-carboxypropyl)-3-amino-6-(4-methoxyphenyl)-pyridazinium bromide], 10 μm CNQX, 50 μm APV, and 1 mm kynurenic acid. Drugs were obtained from Tocris Bioscience.
For quantal size estimates we used targeted juxtasynaptic stimulation (see below) in conditions of low release probability (external saline as stated above but with 1 mm Ca2+ and 5 mm Mg2+). The stimulation intensity was kept at stimulation threshold. Under these conditions, the failure rate was 68.8 ± 41.4% (n = 5). A high failure rate is important to minimize the potential contribution of multiquantal responses (Silver, 2003). Data were acquired as stated above using saline without further additions. For quantal analysis, we assumed that release occurs synchronously at independent sites with uniform release probability.
Labeling of giant terminals with fluorescent proteins.
Giant terminals could be visualized using GFP, mGFP, or synaptophysin-GFP. Morphology was studied in fixed slices using confocal microscopy and expression of GFP or mGFP. Physiology experiments in acute brain slices were preferentially done using synaptophysin-GFP, because terminals could be detected more readily in the absence of “contaminating” labeled axons. Axonal stimulation (supplemental Fig. S2, available at www.jneurosci.org as supplemental material) was done using simultaneous expression of mGFP (labeling the membrane) and synaptophysin-GFP (labeling synaptic vesicles), yielding improved visualization of axons and terminals.
Two-photon scanning-gradient-contrast microscopy.
Neurons and giant synapses were visualized with two-photon scanning-gradient-contrast imaging (Wimmer et al., 2004). This technique allows the simultaneous acquisition and online overlay of several fluorescence images and an infrared contrast-enhanced image. The ability to simultaneously visualize the green and red channels is instrumental to screen a neuron (filled with Alexa 594 dye via the patch pipette) for GFP-labeled giant terminals directly contacting its dendritic arbor. Parfocality of the fluorescent images and overlay with the infrared contrast-enhanced image then allows to directly target the bipolar electrode to the giant synapses for selective electrical stimulation.
Targeted juxtasynaptic stimulation.
Thalamic neurons with 15–25 μm diameters, spherical cell bodies embedded in clusters of fluorescently labeled giant terminals (see Fig. 2 B), were chosen for whole-cell recordings. They exhibited low input resistance (∼50 MΩ), hyperpolarization induced Ca2+-rebound spikes and the ability to switch from burst (default in our slices) to tonic fire mode after depolarization. Bipolar stimulation pipettes with tip diameters ranging from 1 to 4 μm were pulled from theta glass and filled with extracellular solution. After positioning the stimulation pipette 1–2 μm close to the terminal we applied a biphasic pulse with opposite sign (each pulse lasting for 30–100 μs) at increasing amplitudes (5–20 V) using a stimulus isolator (custom built by R. Rödel, Max Planck Institute for Medical Research, Heidelberg, Germany). To facilitate detection of large depressing EPSCs (>1 nA first EPSC), the fingerprint of L5B–POm synapses, we applied a paired biphasic pulse at an interval of 30 ms. After synaptic responses, the stimulation intensity was gradually decreased until failures occurred. Only when the response was all or none did we proceed with the experiments. Occasionally, the responses were compound EPSCs with different thresholds. To study the responses to L5B terminal stimulation in isolation, we adjusted the after parameters: the location of the stimulus pipette tip, the stimulus intensity, polarity, and duration until a unitary all-or-none response was established. Intensities were read from the stimulus isolator during the experiment and extracted from the stimulation artifact in the recording trace off-line. For the amplitude versus intensity plots, normalized artifact amplitudes were used.
Figure 2.

Juxtasynaptic stimulation of identified L5B giant terminals in acute brain slice. A, Experimental layout. Fluorescently labeled terminal and neuron filled with Alexa 594 via patch pipette. A theta glass stimulation electrode producing a very focal electrical field was positioned within 2 μm of the synapse. See Materials and Methods for additional details. B, Simultaneous visualization of slice morphology and synaptophysin-GFP-labeled giant terminals using 2P-SGC microscopy (Wimmer et al., 2004). C, The 2P-SGC image illustrates the recording configuration with the postsynaptic recording electrode (top) and the high impedance double-barrel stimulation pipette (bottom, asterisk). D, As in C, but with green and red fluorescence, by simultaneous online overlay of three channels depicting slice morphology (gray), postsynaptic fluorescence (red), and presynaptic fluorescence (green). The inset shows a higher magnification of the giant terminal and cognate dendrite. E, Current recording from a POm neuron while gradually increasing stimulus intensity. Current traces represent the response before and after reaching the threshold for presynaptic AP. Clamping the voltage at −70 mV caused a small steady-state outward current because of the resting potential of approximately −73 mV. F, All-or-none property of EPSC response. The EPSC peak amplitude as a function of stimulus intensity showed all-or-none behavior. After reaching threshold, the response was independent of stimulation intensity, suggesting that presynaptic APs evoked unitary EPSCs. Relative stimulation intensity was inferred from the amplitude of the stimulus artifact. Scale bars: B–D, 10 μm.
Rarely, responses were compound EPSCs with identical thresholds (4 of 48 recordings) indicating en passant terminals with multiple contacts onto the same POm neuron (supplemental Fig. S1, available at www.jneurosci.org as supplemental material). Some of these cases in which the EPSCs peaked with delays of up to 1 ms could resemble disynaptic AP transmission. Targeted stimulation of small synaptic terminals yielded currents with small amplitudes (70–150 pA), slower kinetics (decay time constant 4–10 ms), little synaptic depression, and subtreshold EPSPs (1–3 mV). Recordings with “atypical” responses were excluded from the analysis.
In vivo recordings of L5B activity patterns and generation of in vitro stimulus patterns.
Juxtasomal recordings from urethane anesthetized Wistar rats (P25–P30) were made as described previously (de Kock et al., 2007). Briefly, spontaneous APs were measured through continuous recording during 125 s. To record evoked activity, the principal whisker was deflected (20 repetitions) at 3.3° in the caudal direction. Only the 0–100 ms time interval after whisker deflection onset was analyzed.
Recordings were made using an Axoclamp 2B amplifier (Molecular Devices) in combination with a Lynx 8 amplifier, band filter settings 300 and 9000 Hz. Data were acquired using the Ntrode Virtual Instrument (R. Bruno, Columbia University, New York, NY) for Labview (National Instruments) and spike data were sorted off-line using MClust (A. David Redish, University of Minnesota, Minneapolis, MN). After physiological properties were measured, cells were filled with biocytin using current pulses (Pinault, 1996).
Spontaneous activity templates for in vitro recordings were generated by setting a trigger for every action potential present in the in vivo recording. The resulting binary pattern was used to drive the bipolar stimulus electrode. For costimulation experiments, the binary stimulus patterns were cut into 500 ms traces and arranged randomly to create 10 different stimulus patterns, each with a length of 10 s. A “probing” stimulus was added to each pattern at t = 7.5 s.
Confocal imaging of synapse morphology.
Virus-injected rats were anesthetized with a lethal dose of pentobarbital and transcardially perfused with 15 ml of PBS followed by 15 ml of PBS with 4% paraformaldehyde. The brain was extracted and kept overnight in PBS/4% paraformaldehyde at 4°C. Vibratome sections of 100 μm thickness were prepared and embedded in Slow Fade Gold (Invitrogen). Confocal image stacks of paraformaldehyde-fixed brain slices were acquired with a Leica TCS SP2 laser scanning microscope (Leica). Three-dimensional reconstructions were generated with Amira (version 4.0; Mercury Computer Systems).
Data acquisition and analysis.
Current and potential traces were acquired using Pulse software (HEKA) and IGOR (Wavemetrics) run with custom written routines. Stimulus patterns derived from in vivo spiking activity triggered the stimulus isolators (custom built by R. Rödel) via the acquisition software. Signals were filtered at 10 kHz and sampled at 50 kHz or 10 kHz (in vivo stimulation). Data were analyzed and plotted using Matlab (MathWorks) and IGOR with custom written routines. All mean values are given with the SD unless stated otherwise.
Results
Visualization of giant terminals and their thalamic target neurons
Corticothalamic projections were selectively labeled with fluorescent proteins by stereotaxic delivery of recombinant AAV particles encoding the fluorescent protein of choice into infragranular layers of rat barrel cortex (Fig. 1 A). The injections were confined to thalamus projecting layers 5 and 6 with a lateral spread designed to maximize numbers of labeled giant terminals in the POm. Corticofugal axons of L5 and L6 pyramidal cells and their ramifications in the reticular nucleus, ventral posterior medial nucleus (VPM) and POm could be readily identified (Fig. 1 B), consistent with previously reported patterns obtained with conventional labeling methods (Hoogland et al., 1987; Bourassa et al., 1995; Veinante et al., 2000). We labeled hundreds of giant terminals in each slice, preferentially clustered in the laterodorsal division of the POm (Fig. 1 B).
Figure 1.
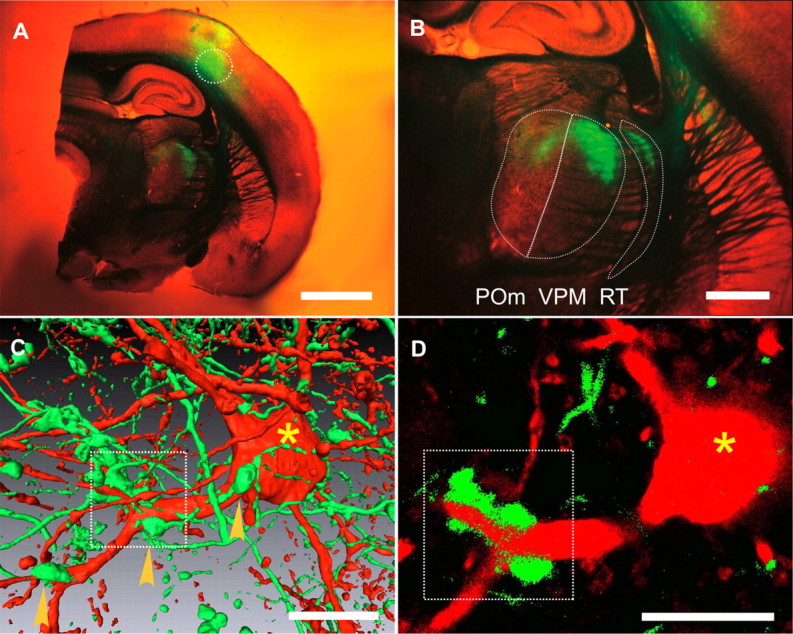
Giant terminals and thalamic target neurons labeled by dual targeted viral expression of fluorescent proteins. A, Fixed thalamocortical slice of right hemisphere showing mGFP-labeled neurons in deep layers of somatosensory cortex and their thalamic ramifications (green) after stereotaxic deposit (dashed circle) of AAV particles encoding mGFP. Overview was taken with stereomicroscope using simultaneous bright-field and fluorescence illumination. Scale bar, 2 mm. B, Same as in A at a higher magnification. Labeled axonal ramifications and synaptic varicosities in reticular nucleus (RT), VPM, and POm. Scale bar, 1 mm. C, Simultaneous expression of mOrange in the POm nucleus (red) and GFP in axons and endings of cortical L5B and L6 neurons (green). Arrowheads mark giant terminals formed by L5B neurons. Confocal image stack rendered in three dimensions using the Amira software package. The scale bar (10 μm) in this pseudo-three-dimensional representation is only an approximation. D, A single frame of the image stack shown in C at a higher magnification. The L5B terminal (green) wraps around the primary branch point of the POm neurons dendrite (red). Bifurcation with large terminal is indicated by a box, soma of the POm neuron indicated by an asterisk. Scale bar, 10 μm.
To identify the postsynaptic targets of labeled synaptic terminals we expressed GFP in the cortex and mOrange in the POm (Fig. 1 C,D). Giant terminals with diameters of 2–8 μm were typically in contact with the primary dendrite of the POm neuron close to the first dendritic bifurcation (Fig. 1 C,D) (Hoogland et al., 1987, 1991). Giant terminals were less frequently found at the soma (Fig. 1 C, right arrowhead). The axons giving rise to giant terminals were of large diameter (∼1 μm) (Deschênes et al., 1994). The postsynaptic neuron was of large size (soma: up to 25 μm diameter) and had a nonpolarized morphology with 5–8 thick primary dendrites (Fig. 1 C,D). Several giant terminals were found to contact each POm neuron. In addition numerous small, bouton-like terminals contacted the POm neuron (Fig. 1 C), (Hoogland et al., 1991; Bourassa et al., 1995; Veinante et al., 2000). Although infection of deep cortical layers 5 and 6 achieved limited specificity, it has been established that cortical giant terminals in the POm arise exclusively from L5B neurons (Bourassa et al., 1995; Veinante et al., 2000; Killackey and Sherman, 2003). Nevertheless, we cannot entirely rule out the possibility that cortical neurons of unknown identity may also form giant terminals. In conclusion, targeted expression of fluorescent proteins revealed giant terminals formed by L5B neurons onto the proximal dendrites of POm neurons.
Selective stimulation of GFP-labeled cortical giant terminals
The synaptic architecture described in Figure 1 offers the possibility to record thalamic responses elicited by selective stimulation of identified fluorescently labeled giant terminals (Fig. 2 A). In the acute thalamocortical slice, POm neurons with nearby synaptophysin-GFP-labeled corticothalamic giant terminals (Fig. 2 B) were selected for whole-cell recordings (Fig. 2 C). The POm neuron was filled with a red dye (Alexa 594) to enable identification of fluorescently labeled giant terminals contacting the dendrite (Fig. 2 D). In this example, the corticothalamic giant synapse was found in loco typico at the first branch point of a primary dendrite.
Giant terminals were readily accessible to direct electrical stimulation by a fine tipped double-barrel stimulation pipette positioned within 2 μm of the giant terminal (Fig. 2 D, asterisk). The stimulation intensity was gradually increased until an EPSC was evoked (Fig. 2 E). Characteristically, the response could be elicited in an all-or-none manner (Fig. 2 F).
At stimulation intensity threshold, responses could only be evoked when the pipette tip was positioned within 1 μm of the labeled terminal (Fig. 2 D). The EPSCs typically had amplitudes exceeding 1 nA at a holding potential of −70 mV and showed a rapid onset and decay time course (Fig. 2 E). Synaptic delays were not measurably fluctuating (data not shown). These results suggest that transmitter release was triggered from a single, GFP-labeled giant terminal. However, in a few cases, compound EPSCs possibly reflecting release from multiple terminals contacting the postsynaptic neuron en passant were observed (supplemental Fig. S1, available at www.jneurosci.org as supplemental material). To exclude a direct influence of the brief stimulus on the action potential wave form and transmitter release, we stimulated the axon labeled with mGFP ∼15 μm proximal to the nerve terminal (supplemental Fig. S2, available at www.jneurosci.org as supplemental material). The properties of synaptic transmission were indistinguishable from direct stimulations of the terminal (supplemental Fig. S2C,D, available at www.jneurosci.org as supplemental material), suggesting that the stimulation paradigm used here does not interfere with transmitter release.
In summary, expression of fluorescent proteins in deep layers of barrel cortex combined with 2P-SGC microscopy allows visualization and selective stimulation of a single identified corticothalamic terminal in the POm nucleus.
EPSC mediated by Ca2+-permeable AMPA and NMDA receptors
We then studied the EPSC and its underlying conductance changes. The EPSC was composed of a fast and a slow component mediated by ionotropic glutamate receptors (Fig. 3 A). The fast component of the EPSC was almost completely blocked by the AMPA receptor antagonist CNQX and unaffected by the NMDA receptor blocker APV (Fig. 3 B) The average EPSC amplitude was 3.33 ± 1.45 nA at −70 mV, the 20–80% rise-time was 0.43 ± 0.17 ms, and the decay time constant was 1.23 ± 0.27 ms (26 cells each). Furthermore, the peak current–voltage (I–V) relationship of the fast component was inwardly rectifying in the presence (Fig. 3 C) but not the absence (data not shown) of spermine in the recording pipette. The rectification indices calculated from the ratios of the slopes in the I–V plot were 0.4 and 0.7, with and without spermine, respectively. These results suggest that Ca2+-permeable AMPA receptors lacking the glutamate receptor-B (GluR-B) subunit mediate this current, similar to the situation found in the calyx of Held (Geiger et al., 1995) and some cortical synapses (Rozov and Burnashev, 1999).
Figure 3.

Properties and pharmacology of the EPSC. A, Postsynaptic current responses elicited by giant terminal stimulation at different membrane potentials. The fast component (1.8 ms after stimulus, gray bar, C) and slow component (10 ms after stimulus, gray bar, E) are highlighted. V m = −70, −50, −30, −10, +10, +30, +50, and +70 mV. The stimulation artifact is marked with an arrow. B, Fast inward current at −70 mV was insensitive to the NMDA receptor antagonist APV (50 μm) but was nearly completely blocked by the AMPA receptor antagonist CNQX (10 μm). C, Current–voltage relationship of the fast EPSC component in the presence of glutamate receptor blockers (n = 4). The pipette contained 100 μm spermine to maintain voltage-dependent block of Ca2+-permeable AMPA receptors. The current-voltage relationship is inwardly rectifying. Rectification index equals the slope at +20 to +70 mV divided by slope at −120 to +10 mV. D, As in B, but at +70 mV. Slow outward but not AMPAR current was blocked by APV. E, As in C but the current–voltage relationship of the slow EPSC component (n = 4).
The slower component of the EPSC was blocked by the NMDA receptor antagonist APV (Fig. 3 D). The delayed component of the response showed an I–V relationship with a negative slope in the region between −80 and −20 mV (Fig. 3 E). The current amplitude was 0.9 ± 0.7 nA (n = 4) at a membrane potential of +70 mV and −0.41 ± 0.17 nA (n = 4) at −20 mV. These results demonstrate that NMDA receptors mediate the slow component of the EPSC.
Thus, the L5B corticothalamic giant synapse transmits signals from the primary somatosensory cortex to the POm via glutamate release which coactivates Ca2+-permeable AMPA receptors and NMDA receptors. The fast rise and decay times of the AMPA receptor mediated currents may provide high temporal precision, whereas the large amplitude of the EPSC may establish reliable transfer of APs across this synapse.
Single presynaptic APs are reliably transmitted
The large amplitude of the EPSC and the location of the terminal close to the soma prompted the question of whether single presynaptic APs could elicit postsynaptic APs. Voltage recordings from the POm neuron revealed that each presynaptic stimulus could generate between one and six postsynaptic APs. A representative postsynaptic voltage response with three spikes is shown in Figure 4. The postsynaptic voltage response had three components. First, a rapid depolarization (15.1 ± 1.9 mV; n = 7; at −73 mV) reflecting the fast, glutamate-mediated EPSP. Second, a delayed depolarization that was large (up to 20 mV) and sustained (100–150 ms). The inward current underlying this depolarization showed a profile of voltage dependency, kinetics, and pharmacology (data not shown) typical for T-type calcium channels (Jahnsen and Llinás, 1984a,b). Third, one to six APs were generated on the peak of each low threshold depolarization. POm neurons in our slices were in burst mode because they had a typical resting membrane potential between −69 and −75 mV, a voltage range in which the T-type calcium conductance is largely available. Hence, the corticothalamic giant synapse can function as an amplifier converting a single cortical AP into a train of thalamic APs.
Figure 4.

Single presynaptic stimulus evokes multiple postsynaptic APs. Single presynaptic stimulus (arrow) evokes a fast EPSP component depolarizing the cell from −71 to −56 mV. Subsequently, a slow depolarizing phase develops lasting for 150 ms. Three high-frequency Na+ spikes are generated at the peak of the postsynaptic low-threshold spike. Similar results were obtained in 18 independent experiments.
Pronounced frequency-dependent STD and recovery from STD
We next examined presynaptic release properties under regimes of repetitive stimulation. Pronounced STD was found when stimulating the giant terminal 20 times at 50 Hz (Fig. 5 A). Remarkably, the EPSC amplitude dropped to 29 ± 12% after the first EPSC (Fig. 5 A,B). Also at lower stimulation frequencies, the amplitude of the second EPSC was strongly reduced (Fig. 5 B) (10 Hz, 58 ± 3%; 20 Hz, 49 ± 5%; n = 4–14). Relative to the second EPSC, the amplitudes of the subsequent EPSCs decreased less (Fig. 5 B). The steady-state reductions were 42 ± 3, 33 ± 8, 14 ± 7, 9 ± 2, and 6 ± 2% (n = 4–14) at 10, 20, 50, 100, and 200 Hz, respectively. The initially strong decrease followed by a smaller decrease after the second EPSC is reflected in the biphasic decline of the EPSC amplitudes with a fast and a slower component (Fig. 5 B). The fast component decreased strongly when increasing the frequency from 10 to 100 Hz, whereas the slow component changed less (Fig. 5 C). These observations suggest the presence of a large pool of releasable vesicles that is largely depleted by a single AP. Furthermore, two separate mechanisms may mediate the refilling of the releasable vesicle pool (Sakaba and Neher, 2001).
Figure 5.

STD at the giant synapse. A, Postsynaptic currents elicited by 50 Hz stimulation (20 APs, stimulus artifact removed). B, STD at different stimulation frequencies. Normalized data taken from eight neurons. The data could be described with a double-exponential function fitted to 20 data points (line) yielding frequency-dependent time constants. Only the first 100 ms are shown for clarity. C, Time constants of STD at different stimulation frequencies obtained from data shown in B. D, Time course of recovery from STD (fast component, 27 ms; slow component, 423 ms; n = 9). E, Example of EPSCs evoked by stimulating the giant terminal at 50 Hz in normal bath solution (dashed black line) and in the presence of 1 mm kynurenic acid (KYN; solid gray line). The bottom shows EPSCs normalized to the first peak amplitude to evaluate the time course of depression. F, Amplitudes normalized to the first EPSC are shown in the presence of KYN (gray open circle) and in standard ringer solution (control, black filled circle). Data could be described with double exponential functions (KYN, dashed gray line, control solid black line). Data were obtained from four independent experiments.
We next determined the time necessary for the terminal to recover from STD. To examine synaptic transfer as a function of presynaptic frequency, we applied a double-pulse protocol with variable interstimulus intervals (ISIs). Recovery to 80% of the first response of the double-pulse took 460 ms. The relationship between ISI and EPSC magnitude was biphasic showing a fast component of 27 ms and a slow component of 423 ms (Fig. 5 D). This relationship reflects the strong reduction of the second EPSC at high frequencies, but a less pronounced decrease at lower frequencies, predicting frequency-dependent corticothalamic AP transmission.
Because short-term depression can be caused by presynaptic as well as postsynaptic mechanisms, we examined the contribution of postsynaptic receptor saturation and desensitization. We compared EPSC amplitudes in response to 50 Hz stimulation in the presence and absence of the low affinity antagonist kynurenic acid, which reduces AMPA receptor saturation and desensitization (Scheuss et al., 2002). In the presence of kynurenic acid, the EPSC amplitudes were smaller (Fig. 5 E,F). The kinetics of depression during the 50 Hz stimulus could be described with a two-exponential function (Fig. 5 F). In the presence of kynurenic acid, the fast exponential decay was increased (14.6 ± 0.93 vs 8.4 ± 2.5 ms in control; n = 4; p = 0.0034, Student's t test), whereas the slow exponential decay remained unchanged (476 ± 176 vs 257 ± 190 ms in control; n = 4; p = 0.1418, Student's t test). Given the small magnitude of the effect of kynurenic acid on the time course of STD, we infer that predominantly presynaptic mechanisms govern STD at the L5B–POm giant synapse.
Estimation of quantal size and quantal content
To obtain further insight into the organization of the synaptic vesicle pool, we estimated quantal size and content. Identified giant terminals were stimulated in the presence of 1 mm Ca2+ and 5 mm Mg2+, a paradigm enforcing low release probability (Jonas et al., 1993). Under these conditions, the postsynaptic EPSC amplitudes fluctuated in a quantal manner (Fig. 6 A). Figure 6 B shows the distribution of EPSC amplitudes and failures of one representative experiment. The Gaussian fitted peaks of the populations represent multiples of single quanta, yielding a quantal size estimate of 64.2 ± 16 pA (n = 5). Thus, based on the total average pool charge of 4.1 ± 1.7 nA (n = 22) (Fig. 6 C), the readily releasable pool contained ∼64 synaptic vesicles. Taking the average EPSC amplitude of 3.33 nA into account, a release probability of ∼80 ± 9% (n = 22) can be inferred. Here, the release probability is defined as the fractional peak current evoked by a single stimulus from a nondepressed terminal compared with the cumulative peak current evoked by a depleting stimulus of 50 Hz. We estimate that a single AP releases on average ∼51 synaptic vesicles at the L5B–POm giant terminal.
Figure 6.

Quantal size estimation. A, Superimposed traces of representative EPSCs recorded under conditions of low release probability. Individual EPSCs are shown in different shades of gray. Similar results were obtained in five independent experiments. The stimulus artifact has been blanked for clarity, and the arrow marks time of stimulation. B, Distribution of EPSC amplitudes obtained from the experiment shown in A. The histogram was fitted with three Gaussians. Individual quantal amplitudes were determined from the peak-to-peak distances of multi-Gaussian fits to each of five independent experiments, yielding an average quantal amplitude of 64.2 ± 16 pA. C, EPSC peak amplitudes were integrated to give a plot of cumulative EPSC amplitudes during a 50 Hz train. Data points in the range of 120–400 ms were fitted with a linear function (dashed line) and back-extrapolated to time 0 ms to estimate the pool charge before steady-state depression.
Low-pass filtering of cortical AP patterns by STD
The properties of the corticothalamic synapse described above predict a strong low-pass filtering of cortical L5B neuron activity. To test corticothalamic transmission of APs evoked by natural stimuli, we first determined patterns of spontaneous and evoked APs of cortical L5B neurons in vivo [Fig. 7 A,B; this population of cells is reported by de Kock et al. (2007)]. The average spontaneous activity recorded in vivo was typically 4–6 Hz (de Kock et al., 2007). Interspike intervals were ranging from 5 ms up to 1 s with a preference of ∼100 ms (Fig. 7 C). Activity evoked by a single whisker deflection was sparse, consisting of only a single AP (80%) or of a short AP burst (20%), temporally linked to the stimulus (de Kock and Sakmann, 2008). Because a single L5B giant synapse is presumed to receive a constant flow of spontaneous APs with whisker-evoked single or double APs interspersed, we stimulated single terminals with patterns of spontaneous AP activity and recorded EPSCs (see Materials and Methods). Starting the stimulus protocol after a period of silence resulted in a typical EPSC of large amplitude followed by EPSCs of smaller amplitudes (Fig. 7 D). Normalized to the first EPSC, the subsequent EPSCs were on average reduced to approximately one-half the size (Fig. 7 E), consistent with the strong frequency-dependent STD at this synapse. Thus, spontaneous AP activity drives the giant synapse into a state of chronically depressed responsiveness by presynaptic STD.
Figure 7.
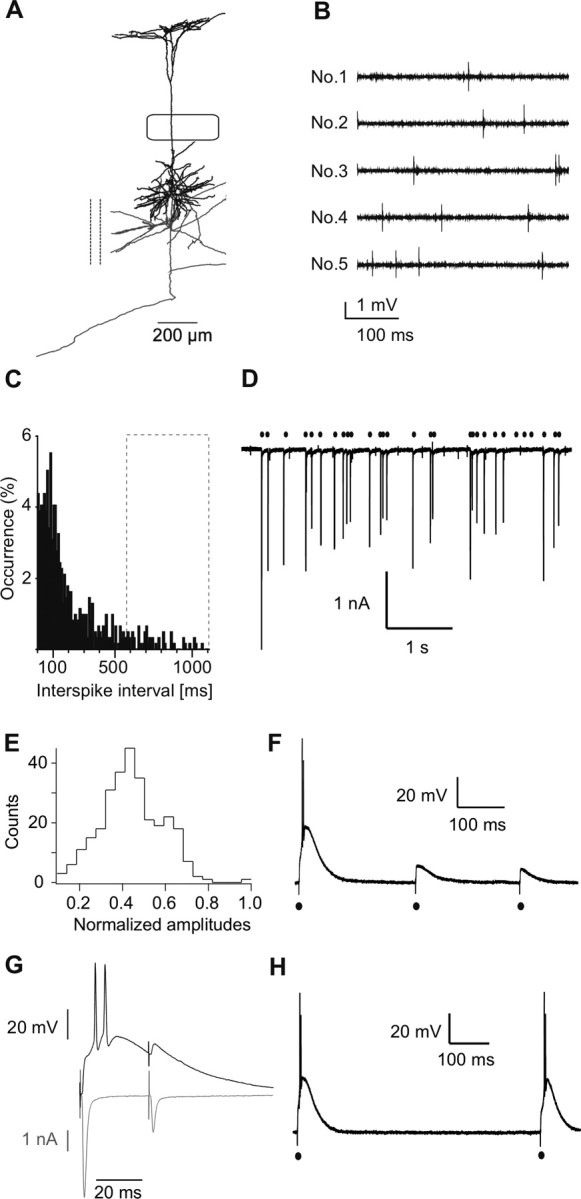
Low-pass filtering of cortical AP patterns. A, Cortical L5B neuron filled with biocytin during in vivo recordings and reconstructed with Neurolucida (MicroBrightField). Axon (gray), cortical collaterals cut (dashed line), box symbolizes D2 barrel borders. This cell is used as an example, the complete data set is published in the study by de Kock et al. (2007). B, Spontaneous APs recorded juxtasomally in vivo from the L5B neuron shown in A. Different epochs (No.1–No.5) from the same recording are shown. In vivo patterns used to stimulate L5B terminals were derived from these data. C, Interspike-interval histograms of spontaneous activity. D, In vitro recording of EPSCs in a POm neuron evoked by stimulation of the L5B terminal with spontaneous in vivo patterns shown in B. Similar results were obtained in three independent recordings. E, Distribution of EPSC amplitudes (from D) normalized to the first EPSC (−3.47 nA). The mean amplitude (−1.54 ± 0.49 nA) was 45% of first EPSC. Data were obtained from three independent recordings. F, Example of voltage responses to in vivo stimulus pattern (only first three stimuli). Episodes of 20 stimuli were applied in each of 11 independent recordings. V m = −72 mV. G, Alternating current and voltage recording of responses to a paired pulse (Δ = 30 ms) in the same neuron. Similar recordings were obtained in three independent experiments. H, Example of double-pulse stimulation with an ISI of 700 ms. This was the shortest interval evoking two subsequent AP bursts in this example. V m = −72 mV. Similar recordings were obtained in four independent experiments.
To assess the consequences of STD on relaying APs across the synapse, we recorded postsynaptic voltage responses evoked by an in vivo stimulus pattern (Fig. 7 F). Only the first presynaptic AP of a series of stimuli elicited postsynaptic APs, whereas the remainder only evoked subthreshold responses. We further investigated the block of transmission by recording responses to a depressing paired stimulus (Δ = 30 ms) in current clamp and the corresponding currents in voltage clamp (Fig. 7 G). In current clamp, only the first stimulus evoked a short AP burst, whereas the second remained subthreshold. The corresponding current recording, as a measure of presynaptic glutamate release, showed that the second stimulus was strongly depressed. We conclude that short-term depression at the corticothalamic giant synapse acts as a low-pass filter of activity generated by L5B pyramidal neurons.
The recovery rates derived from current recordings (see Fig. 5 D) predict that the transfer frequencies of cortical APs are in the range of a few hertz at the giant synapse. To estimate the cutoff frequency of AP transfer, we stimulated presynaptically with decreasing ISIs and recorded voltage responses postsynaptically. We found that two subsequent APs could be evoked reliably with ISIs of 580 ± 290 ms or longer, suggesting a cutoff frequency of 1.72 ± 0.63 Hz (four independent experiments) (Fig. 7 H). Such long ISIs represented only a minority of events recorded in vivo (Fig. 7 C, dashed box), suggesting that the majority of APs in a L5B neuron does not evoke APs in the connected POm neurons. In summary, the corticothalamic giant synapse acted as a low-pass filter with a cutoff frequency of ∼2 Hz.
Corticothalamic AP transfer can be gated by two mechanisms
We next tested AP transfer during sustained spontaneous in vivo activity lasting for several seconds. As expected, sustained stimulation of the giant synapse with in vivo patterns did not evoke postsynaptic APs in the POm neuron (Fig. 8 A). However, a period of silence preceding the second to last stimulus (Fig. 8 A, bar) sufficed to recover the synapse and trigger an AP. This behavior was expected, because glutamate release was restored to 80% within a period of inactivity of 600 ms (Figs. 5 D, 7 H) and thereby switched the synapse into a driver mode. Hence, spontaneous activity of L5B neurons drives the corticothalamic synapse into a refractory state that can, however, be unlocked to an active transmitting state by intervals of silence.
Figure 8.

Suppression and gating by silence and synchrony in AP patterns. A, EPSPs evoked by spontaneous in vivo pattern. APs were evoked only after a period of silence (1 s, bar). Gray dashes at bottom of traces in A–D mark individual stimuli of the in vivo pattern applied to giant terminals. V m = −70 mV. Similar results have been obtained in four independent experiments. B, Two giant terminals (1 and 2) on the same POm neuron were sequentially stimulated with two different spontaneous in vivo AP patterns. Each pattern had one additional stimulus (asterisk). Except for the first stimulus, the EPSPs remained subthreshold. V m = −71 mV. Similar results have been obtained in three independent experiments. C, Giant terminals 1 and 2 were simultaneously stimulated with the same spontaneous in vivo patterns as shown in B, with 8 of 10 stimulus patterns yielding stimulus-locked APs. Additional stimuli (asterisk) evoked an AP in the POm neuron. An AP was also evoked by random coincidence when the terminals were not fully depressed (arrow). V m = −71 mV. D, As in C but the region of the synchronized stimuli (asterisk) enlarged to show summation of the EPSPs evoked from terminal 1 and 2 (dashed line, AP threshold). V m = −71 mV.
Although periods of silence capable of gating AP transfer were rare in our in vivo recordings (Fig. 7 C, dashed box), L5B neurons reliably responded to whisker stimulation within a narrow time window (de Kock et al., 2007). Therefore, two or more L5B–POm terminals converging onto a POm neuron may release glutamate synchronously in response to a whisker stimulus, evoking an AP in the POm neuron. To test this hypothesis, we simultaneously stimulated two independent giant terminals contacting a single POm neuron (supplemental Fig. S3, available at www.jneurosci.org as supplemental material). The stimulated terminals were located on different primary dendritic branches ∼50–150 μm apart. Figure 8 B shows individual postsynaptic responses to stimulation of terminals 1 and 2, each with a different, randomly chosen pattern of spontaneous activity. The stimulus trains were first applied separately to each terminal with an extra stimulus (Fig. 8 B, asterisks) mimicking a whisker-evoked AP in L5B. As expected, the extra stimulus of one terminal did not evoke APs in the POm neuron because of STD caused by the spontaneous activity that switched the synapse into the coincidence detection mode. However, when terminals 1 and 2 were stimulated simultaneously, stimulus-locked APs were evoked (Fig. 8 C). Recordings at a higher time resolution revealed that these APs were evoked when two EPSPs were sufficiently synchronized to reach AP threshold (Fig. 8 D, dashed line). Summation of EPSPs elicited by random coincidence of two presynaptic “spontaneous” APs mostly failed to trigger postsynaptic APs. However, this random coincidence could occasionally also generate APs in the POm neuron (Fig. 8 C, arrow), particularly after a phase of low spontaneous activity. In some experiments, random coincidence was even more frequently encountered (up to 0.5 Hz, 3 of 10 stimulus patterns; data not shown). Given that several L5B terminals contact a POm neuron, the extent of random coincidence and stimulus-independent spiking in POm neurons is predicted to be higher in the intact brain.
Gating through synchronized activity of two synapses could fail, however, when the stimulus was applied immediately after periods of high frequency activity (data not shown). This result suggests that even more synapses have to be coactivated to reliably gate the POm neuron during episodes of increased rates of spontaneous activity.
In summary, we suggest that corticothalamic giant synapses are suppressed by spontaneous L5B cortical activity. APs from L5B can be reliably gated in the POm nucleus in the driver mode by periods of silence or, in the coincidence mode when L5B neurons spike synchronously, for example after a sensory stimulus. Hence, STD allows switching the gating mode of this synapse from a dominant driver to a coincidence detector activated by synchronized activity in cortical AP patterns.
Discussion
We characterized synaptic transmission at an identified corticothalamic synapse, formed between giant terminals of barrel cortex L5B pyramidal neurons and neurons of the thalamic POm nucleus. The functional properties of this giant synapse were studied by fluorescence-guided presynaptic stimulation and postsynaptic whole-cell recordings from POm neurons. We found a strong driver synapse capable of triggering multiple APs in the POm neuron. This driver capacity was counteracted in vitro by spontaneous in vivo activity patterns of L5B neurons via strong STD, eventually yielding tonic suppression of AP transfer. The results suggest two functional modes of the giant synapse, each providing a different mechanism to gate AP transfer in the CTC loop. At high rates of spontaneous activity, the synapse is suppressed and functions as a coincidence detector. This could be important for the detection of synchronized cortical activity, possibly resulting from multiwhisker deflections. Low rates of spontaneous activity in L5B neurons, which may occur during active whisking or periods of cortical silence, shift the synapse into the driver mode. Then, a single AP generated in a L5B neuron will trigger several APs in the thalamic neuron. Therefore, STD controlled by spontaneous activity allows this giant synapse to switch between two operational modes: detection of silence in the driver mode, or detection of synchrony in the coincidence detection mode.
Local stimulation of identified L5B inputs
Synaptic responses were elicited by stimulation of synaptophysin-GFP-labeled giant terminals originating from L5B neurons of the barrel cortex. Synaptophysin-GFP expression is restricted to synaptic vesicle clusters (Wimmer et al., 2004), making it particularly useful for the visualization of terminals. Giant terminals stick out because of their large vesicle clusters (Fig. 2 B). The selectivity and fidelity of the stimulation paradigm used here depends on several factors: (1) only labeled giant terminals should be stimulated (selectivity); (2) only the presynaptic side should be stimulated (specificity); (3) stimulation should not affect the properties of transmitter release (fidelity). Selectivity is inferred from the sharply delineated distance dependence of stimulation with minimal stimulation intensities (see Results) (Fig. 2). Furthermore, direct stimulation of the axon proximal to the terminal in slices expressing synaptophysin-GFP and membrane-bound mGFP resulted in postsynaptic responses identical to those found with direct stimulation of the terminal (supplemental Fig. S2, available at www.jneurosci.org as supplemental material). Specificity is supported by our findings that postsynaptic responses were blocked by glutamate receptor antagonists AP5, CNQX, and kynurenic acid, ruling out the possibility of direct dendritic stimulation (Fig. 3). Furthermore, the synaptic delays were highly invariant (data not shown) and the rise time of EPSCs was fast and consisted of only a single component. In a few cases (4 of 48), we found a biphasic rise of the EPSC, suggesting that here release occurred at two en-passant boutons formed by the same axon contacting a single postsynaptic neuron, suggesting that most experiments represent the properties of a single synapse. Fidelity is ensured by limiting the stimulus duration to 60–200 μs, making a direct effect of the stimulus on action potential waveform and release properties unlikely. Furthermore, varying the stimulus duration or amplitude did not affect the amplitude, time course, or threshold of the EPSCs (Fig. 2 F), consistent with the view that the stimulus itself does not affect presynaptic mechanisms.
Presynaptic properties and short-term depression
The L5B–POm synapse shows strong STD, reaching ∼50% (Fig. 5) already at low stimulation frequencies occurring in vivo (Fig. 7 D,E). Our STD measurements, obtained from rats at approximately P20, are in agreement with a report of STD in P21–P40 rats in the lateral posterior nucleus, the homolog of POm in the visual system (Li et al., 2003). Hence, the strong STD is a characteristic property of the L5B–POm synapse and might be a prerequisite to its presumed network function suggested below.
Unlike smaller bouton synapses, giant synapses can dominate excitation of the postsynaptic neuron because of the functionally parallel arrangement of multiple synaptic contacts, resembling the simultaneous action of many small bouton synapses. Assuming that L5B-L5B and L5B–POm synapses arise from collaterals of the same axon, single L5B neurons may form both small terminals with weak or no STD (Reyes et al., 1998) and giant terminals with strong STD, reflecting target-specific short-term plasticity.
The L5B giant terminals have a high release probability and a large pool of releasable vesicles organized in multiple active zones to generate large postsynaptic responses at low AP frequencies. Our estimates of the quantal size (64.2 ± 16 pA; n = 5) (Fig. 6), in conjunction with the large EPSC amplitude (3.33 ± 1.45 nA, n = 26), suggest that a single presynaptic AP triggers release of ∼51 synaptic vesicles from a releasable pool of ∼64 synaptic vesicles. This estimate is consistent with ultrastructural data documenting multiple active zones (Hoogland et al., 1991). The observations are in agreement with the high initial release probability (∼80%) of releasable synaptic vesicles resulting in pronounced STD of this synapse. The extent of STD was slightly decreased in the presence of kynurenic acid, a competitive glutamate receptor agonist that prevents receptor saturation (Fig. 5 E) (Scheuss et al., 2002). These results suggest that STD at the L5B–POm synapse is mainly caused by presynaptic vesicle depletion and, to a lesser extent, by glutamate receptor saturation.
Recovery from STD was 80% after 460 ms, Figure 5 D which is comparable with other cortical synapses (Varela et al., 1997; Fuhrmann et al., 2004). In contrast, L5B–POm giant synapse recovery is much faster than in the calyx of Held synapse, which requires 20 s to recover to 80% after stimulation with a high frequency train (Wimmer et al., 2004). The AP transfer rate determined with the double-pulse protocol (Fig. 7 H) matches well with the time required for recovery from STD, indicating that STD defines AP transfer rates at the L5B–POm giant synapse.
Postsynaptic properties
Glutamate release from the L5B terminal evoked large postsynaptic currents mediated by rapidly gated Ca2+-permeable AMPA receptors. A slower component was mediated by NMDA receptor channels. A similar composition was found for EPSPs elicited by corticofugal fiber stimulation in the lateral posterior nucleus (Li et al., 2003). A large and delayed depolarization after the synaptic depolarization is likely attributable to the low threshold calcium spike (Jahnsen and Llinás, 1984a,b). This spike could be evoked independent of synaptic stimulation after hyperpolarizing or depolarizing voltages or currents. The rapid decay kinetics of the EPSC suggest that the receptors contain GluR-Do subunits, which form AMPA receptors with the fastest kinetics (Mosbacher et al., 1994). This view is consistent with the finding that GluR-Do is prevalent in the thalamus (Mineff and Weinberg, 2000). Ca2+-permeable AMPA receptor channels have the highest conductance among AMPA receptor channels, thereby contributing to the large unitary EPSCs and quantal amplitudes (∼65 pA) (Fig. 6). Postsynaptic high-conductance glutamate receptors in combination with presynaptic high release probability ensure maximal synaptic strength and thus make single L5B–POm synapses conditional cortical drivers of POm neurons (Sherman and Guillery, 2006).
L5B giant driver synapse and cortico-thalamo-cortical circuit
A single presynaptic stimulus elicited several postsynaptic APs (Fig. 4, three APs) indicating that L5B terminals are strong drivers of target POm neurons. However, spontaneous activity recorded in vivo from L5B neurons of rats suppressed AP transmission across single L5B–POm inputs via strong frequency-dependent STD (Fig. 7 A). Similarly, occasional AP failures caused by Poisson-distributed spontaneous in-vivo-like activity has been described recently in the calyx of Held (Hermann et al., 2007).
As a result of recovery from STD, AP-transmission at the L5B–POm synapse was unlocked by an interval of presynaptic silence (Fig. 8 A). Hyperpolarizing, GABAergic inputs onto POm neurons could amplify the response to glutamatergic L5B–POm inputs by de-inactivation of T-type Ca2+ channels, increasing the excitability of POm neurons. It has been shown recently that POm receives inhibitory input that is activated by stimulation of the corticothalamic fiber tract (Landisman and Connors, 2007). Furthermore, thalamic nuclei have strong GABAergic inputs to POm that can even elicit APs via de-inactivation of T-type Ca2+ channels (Trageser and Keller, 2004; Bokor et al., 2005). Thus, the strength of L5B inputs is likely to be dependent on the resting membrane potential, which is controlled also by GABAergic synapses: in the intact brain single L5B inputs after GABA release may elicit APs even when they are depressed. However, it has to be shown whether such potent GABAergic innervation exists in L5B targeted POm neurons.
In vivo activity profiles of L5B neurons show only few periods of silence at least in the anesthetized animal (Fig. 7 C, dashed box). However, different brain states occurring in the awake, behaving animal may be associated with different rates of spontaneous activity in L5B neurons. Active whisking appears to be associated with a reduction of spontaneous activity in L5B neurons (C. P. J. de Kock and B. Sakmann, unpublished observations), providing a potential mechanism to unlock transmission at the L5B–POm synapse during a whisking episode.
Alternatively to unlocking by silence, synchronized activity of multiple L5B terminals is likely to gate AP transfer across the L5B–POm synapse similar to known mechanisms of gating by synchronized activity (Sillito et al., 1994; Bruno and Sakmann, 2006). Because L5B neurons respond most reliably within a narrow time window after single whisker deflection (de Kock et al., 2007), we assume that whisker stimulation would synchronize L5B activity. To test whether such synchronization would reliably evoke APs in POm neurons, we costimulated two terminals. Indeed, release from two converging giant terminals in the coincidence mode was sufficient to elicit APs in the POm neuron, even under conditions of normal spontaneous background activity (Fig. 7 B–D). Based on these findings we suggest a model in which synchrony detection is achieved by summation of individual inputs inherently depressed by spontaneous activity (Fig. S4, available at www.jneurosci.org as supplemental material). Gating of the CTC loop could be attained when comparatively sparse sensory responses in L5B are synchronized by whisker deflections. Anatomical evidence suggests that somatosensory L5B output from different barrels, each representing a whisker, converges at the level of the POm nucleus (Hoogland et al., 1987; Wright et al., 2000). Given this convergence, the capability of the L5B–POm synapse to reliably gate synchronized spikes from L5B might provide a synaptic substrate of reliable detection of sensory signals originating from multiple whiskers. The suggested synaptic model of gating multiwhisker events corresponds to the observation that POm neurons respond weakly to deflection of a single whisker, but reliably generate APs when several whiskers are stimulated (Diamond et al., 1992).
In conclusion, during periods of low spontaneous activity, a single AP in a L5B terminal can generate several APs in the target POm neuron, thereby dominating its activity. During periods of increased spontaneous activity, STD drives the synapse into the coincidence mode, which then allows the postsynaptic neuron to act as a synchrony detector. Therefore, on a functional level, spontaneous activity of the cortical L5B neuron is predicted to switch the giant synapse between two functional modes: detector of “silence” or “synchrony.” In the driver mode, a single asynchronous synaptic input suffices to drive the POm neuron, whereas in the coincidence mode, only synchronous activity in several inputs will cause the POm neuron to spike. These two modes are at first glance incompatible, because in the driver mode the synapse naturally cannot act as a coincidence detector. Conversely, synchrony detection requires multiple inputs in the coincidence mode. Therefore, STD caused by spontaneous activity switches the transmission mode of the giant synapse, establishing two fundamentally different modes of signaling in the CTC loop.
Footnotes
This work was supported by European Commission Grant LSHM-CT-2005-019055 (T.K.) and a Reemtsma doctoral fellowship (A.G.). We thank Aihua Zhou and Claudia Kocksch for virus production, Marlies Kaiser for expert technical assistance, Thomas Nevian for help with two-photon microscopy, Rebecca A. Mease for helpful discussions about intrinsic properties, and Sebastiano Bellanca for the Neurolucida reconstruction. We thank Erwin Neher, Randy Bruno, and Robert Renden for critically reading previous versions of this manuscript. We are grateful for materials provided by Pico Caroni (mGFP) and Roger Tsien (mOrange).
References
- Agmon A, Connors BW. Thalamocortical responses of mouse somatosensory (barrel) cortex in vitro. Neuroscience. 1991;41:365–379. doi: 10.1016/0306-4522(91)90333-j. [DOI] [PubMed] [Google Scholar]
- Bokor H, Frère SG, Eyre MD, Slézia A, Ulbert I, Lüthi A, Acsády L. Selective GABAergic control of higher-order thalamic relays. Neuron. 2005;45:929–940. doi: 10.1016/j.neuron.2005.01.048. [DOI] [PubMed] [Google Scholar]
- Bourassa J, Pinault D, Deschênes M. Corticothalamic projections from the cortical barrel field to the somatosensory thalamus in rats: a single-fibre study using biocytin as an anterograde tracer. Eur J Neurosci. 1995;7:19–30. doi: 10.1111/j.1460-9568.1995.tb01016.x. [DOI] [PubMed] [Google Scholar]
- Bruno RM, Sakmann B. Cortex is driven by weak but synchronously active thalamocortical synapses. Science. 2006;312:1622–1627. doi: 10.1126/science.1124593. [DOI] [PubMed] [Google Scholar]
- de Kock C, Sakmann B. High frequency action potential bursts (>= 100 Hz) in L2/3 and L5B thick tufted neurons in anaesthetized and awake rat primary somatosensory cortex. J Physiol. 2008;586:3353–3364. doi: 10.1113/jphysiol.2008.155580. [DOI] [PMC free article] [PubMed] [Google Scholar]
- de Kock CP, Bruno RM, Spors H, Sakmann B. Layer- and cell-type-specific suprathreshold stimulus representation in rat primary somatosensory cortex. J Physiol. 2007;581:139–154. doi: 10.1113/jphysiol.2006.124321. [DOI] [PMC free article] [PubMed] [Google Scholar]
- De Paola V, Arber S, Caroni P. AMPA receptors regulate dynamic equilibrium of presynaptic terminals in mature hippocampal networks. Nat Neurosci. 2003;6:491–500. doi: 10.1038/nn1046. [DOI] [PubMed] [Google Scholar]
- Deschênes M, Bourassa J, Pinault D. Corticothalamic projections from layer V cells in rat are collaterals of long-range corticofugal axons. Brain Res. 1994;664:215–219. doi: 10.1016/0006-8993(94)91974-7. [DOI] [PubMed] [Google Scholar]
- Deschênes M, Veinante P, Zhang ZW. The organization of corticothalamic projections: reciprocity versus parity. Brain Res Brain Res Rev. 1998;28:286–308. doi: 10.1016/s0165-0173(98)00017-4. [DOI] [PubMed] [Google Scholar]
- Diamond ME, Armstrong-James M, Budway MJ, Ebner FF. Somatic sensory responses in the rostral sector of the posterior group (POm) and in the ventral posterior medial nucleus (VPM) of the rat thalamus: dependence on the barrel field cortex. J Comp Neurol. 1992;319:66–84. doi: 10.1002/cne.903190108. [DOI] [PubMed] [Google Scholar]
- During MJ, Young D, Baer K, Lawlor P, Klugmann M. Development and optimization of adeno-associated virus vector transfer into the central nervous system. Methods Mol Med. 2003;76:221–236. doi: 10.1385/1-59259-304-6:221. [DOI] [PubMed] [Google Scholar]
- Fuhrmann G, Cowan A, Segev I, Tsodyks M, Stricker C. Multiple mechanisms govern the dynamics of depression at neocortical synapses of young rats. J Physiol. 2004;557:415–438. doi: 10.1113/jphysiol.2003.058107. [DOI] [PMC free article] [PubMed] [Google Scholar]
- Geiger JR, Melcher T, Koh DS, Sakmann B, Seeburg PH, Jonas P, Monyer H. Relative abundance of subunit mRNAs determines gating and Ca2+ permeability of AMPA receptors in principal neurons and interneurons in rat CNS. Neuron. 1995;15:193–204. doi: 10.1016/0896-6273(95)90076-4. [DOI] [PubMed] [Google Scholar]
- Grimm D, Kay MA, Kleinschmidt JA. Helper virus-free, optically controllable, and two-plasmid-based production of adeno-associated virus vectors of serotypes 1 to 6. Mol Ther. 2003;7:839–850. doi: 10.1016/s1525-0016(03)00095-9. [DOI] [PubMed] [Google Scholar]
- Hermann J, Pecka M, von Gersdorff H, Grothe B, Klug A. Synaptic transmission at the calyx of Held under in vivo like activity levels. J Neurophysiol. 2007;98:807–820. doi: 10.1152/jn.00355.2007. [DOI] [PubMed] [Google Scholar]
- Hoogland PV, Welker E, Van der Loos H. Organization of the projections from barrel cortex to thalamus in mice studied with Phaseolus vulgaris-leucoagglutinin and HRP. Exp Brain Res. 1987;68:73–87. doi: 10.1007/BF00255235. [DOI] [PubMed] [Google Scholar]
- Hoogland PV, Wouterlood FG, Welker E, Van der Loos H. Ultrastructure of giant and small thalamic terminals of cortical origin: a study of the projections from the barrel cortex in mice using Phaseolus vulgaris leuco-agglutinin (PHA-L) Exp Brain Res. 1991;87:159–172. doi: 10.1007/BF00228517. [DOI] [PubMed] [Google Scholar]
- Jahnsen H, Llinás R. Ionic basis for the electro-responsiveness and oscillatory properties of guinea-pig thalamic neurones in vitro. J Physiol. 1984a;349:227–247. doi: 10.1113/jphysiol.1984.sp015154. [DOI] [PMC free article] [PubMed] [Google Scholar]
- Jahnsen H, Llinás R. Voltage-dependent burst-to-tonic switching of thalamic cell activity: an in vitro study. Arch Ital Biol. 1984b;122:73–82. [PubMed] [Google Scholar]
- Jonas P, Major G, Sakmann B. Quantal components of unitary EPSCs at the mossy fibre synapse on CA3 pyramidal cells of rat hippocampus. J Physiol. 1993;472:615–663. doi: 10.1113/jphysiol.1993.sp019965. [DOI] [PMC free article] [PubMed] [Google Scholar]
- Killackey HP, Sherman SM. Corticothalamic projections from the rat primary somatosensory cortex. J Neurosci. 2003;23:7381–7384. doi: 10.1523/JNEUROSCI.23-19-07381.2003. [DOI] [PMC free article] [PubMed] [Google Scholar]
- Kleinfeld D, Ahissar E, Diamond ME. Active sensation: insights from the rodent vibrissa sensorimotor system. Curr Opin Neurobiol. 2006;16:435–444. doi: 10.1016/j.conb.2006.06.009. [DOI] [PubMed] [Google Scholar]
- Landisman CE, Connors BW. VPM and PoM nuclei of the rat somatosensory thalamus: intrinsic neuronal properties and corticothalamic feedback. Cereb Cortex. 2007;17:2853–2865. doi: 10.1093/cercor/bhm025. [DOI] [PubMed] [Google Scholar]
- Lavallée P, Urbain N, Dufresne C, Bokor H, Acsády L, Deschênes M. Feedforward inhibitory control of sensory information in higher-order thalamic nuclei. J Neurosci. 2005;25:7489–7498. doi: 10.1523/JNEUROSCI.2301-05.2005. [DOI] [PMC free article] [PubMed] [Google Scholar]
- Li J, Guido W, Bickford ME. Two distinct types of corticothalamic EPSPs and their contribution to short-term synaptic plasticity. J Neurophysiol. 2003;90:3429–3440. doi: 10.1152/jn.00456.2003. [DOI] [PubMed] [Google Scholar]
- Mineff EM, Weinberg RJ. Differential synaptic distribution of AMPA receptor subunits in the ventral posterior and reticular thalamic nuclei of the rat. Neuroscience. 2000;101:969–982. doi: 10.1016/s0306-4522(00)00421-8. [DOI] [PubMed] [Google Scholar]
- Mosbacher J, Schoepfer R, Monyer H, Burnashev N, Seeburg PH, Ruppersberg JP. A molecular determinant for submillisecond desensitization in glutamate receptors. Science. 1994;266:1059–1062. doi: 10.1126/science.7973663. [DOI] [PubMed] [Google Scholar]
- Pinault D. A novel single-cell staining procedure performed in vivo under electrophysiological control: morpho-functional features of juxtacellularly labeled thalamic cells and other central neurons with biocytin or Neurobiotin. J Neurosci Methods. 1996;65:113–136. doi: 10.1016/0165-0270(95)00144-1. [DOI] [PubMed] [Google Scholar]
- Reichova I, Sherman SM. Somatosensory corticothalamic projections: distinguishing drivers from modulators. J Neurophysiol. 2004;92:2185–2197. doi: 10.1152/jn.00322.2004. [DOI] [PubMed] [Google Scholar]
- Reyes A, Lujan R, Rozov A, Burnashev N, Somogyi P, Sakmann B. Target-cell-specific facilitation and depression in neocortical circuits. Nat Neurosci. 1998;1:279–285. doi: 10.1038/1092. [DOI] [PubMed] [Google Scholar]
- Rouiller EM, Welker E. A comparative analysis of the morphology of corticothalamic projections in mammals. Brain Res Bull. 2000;53:727–741. doi: 10.1016/s0361-9230(00)00364-6. [DOI] [PubMed] [Google Scholar]
- Rozov A, Burnashev N. Polyamine-dependent facilitation of postsynaptic AMPA receptors counteracts paired-pulse depression. Nature. 1999;401:594–598. doi: 10.1038/44151. [DOI] [PubMed] [Google Scholar]
- Sakaba T, Neher E. Calmodulin mediates rapid recruitment of fast-releasing synaptic vesicles at a calyx-type synapse. Neuron. 2001;32:1119–1131. doi: 10.1016/s0896-6273(01)00543-8. [DOI] [PubMed] [Google Scholar]
- Scheuss V, Schneggenburger R, Neher E. Separation of presynaptic and postsynaptic contributions to depression by covariance analysis of successive EPSCs at the calyx of held synapse. J Neurosci. 2002;22:728–739. doi: 10.1523/JNEUROSCI.22-03-00728.2002. [DOI] [PMC free article] [PubMed] [Google Scholar]
- Shaner NC, Campbell RE, Steinbach PA, Giepmans BN, Palmer AE, Tsien RY. Improved monomeric red, orange and yellow fluorescent proteins derived from Discosoma sp. red fluorescent protein. Nat Biotechnol. 2004;22:1567–1572. doi: 10.1038/nbt1037. [DOI] [PubMed] [Google Scholar]
- Sherman SM, Guillery RW. Cambridge, MA: MIT; 2006. Exploring the thalamus and its role in cortical function. [Google Scholar]
- Sillito AM, Jones HE, Gerstein GL, West DC. Feature-linked synchronization of thalamic relay cell firing induced by feedback from the visual cortex. Nature. 1994;369:479–482. doi: 10.1038/369479a0. [DOI] [PubMed] [Google Scholar]
- Silver RA. Estimation of nonuniform quantal parameters with multiple-probability fluctuation analysis: theory, application and limitations. J Neurosci Methods. 2003;130:127–141. doi: 10.1016/j.jneumeth.2003.09.030. [DOI] [PubMed] [Google Scholar]
- Trageser JC, Keller A. Reducing the uncertainty: gating of peripheral inputs by zona incerta. J Neurosci. 2004;24:8911–8915. doi: 10.1523/JNEUROSCI.3218-04.2004. [DOI] [PMC free article] [PubMed] [Google Scholar]
- Urbain N, Deschênes M. Motor cortex gates vibrissal responses in a thalamocortical projection pathway. Neuron. 2007;56:714–725. doi: 10.1016/j.neuron.2007.10.023. [DOI] [PubMed] [Google Scholar]
- Varela JA, Sen K, Gibson J, Fost J, Abbott LF, Nelson SB. A quantitative description of short-term plasticity at excitatory synapses in layer 2/3 of rat primary visual cortex. J Neurosci. 1997;17:7926–7940. doi: 10.1523/JNEUROSCI.17-20-07926.1997. [DOI] [PMC free article] [PubMed] [Google Scholar]
- Veinante P, Lavallée P, Deschênes M. Corticothalamic projections from layer 5 of the vibrissal barrel cortex in the rat. J Comp Neurol. 2000;424:197–204. doi: 10.1002/1096-9861(20000821)424:2<197::aid-cne1>3.0.co;2-6. [DOI] [PubMed] [Google Scholar]
- Wimmer VC, Nevian T, Kuner T. Targeted in vivo expression of proteins in the calyx of Held. Pflugers Arch. 2004;449:319–333. doi: 10.1007/s00424-004-1327-9. [DOI] [PubMed] [Google Scholar]
- Wright AK, Norrie L, Arbuthnott GW. Corticofugal axons from adjacent “barrel” columns of rat somatosensory cortex: cortical and thalamic terminal patterns. J Anat. 2000;196:379–390. doi: 10.1046/j.1469-7580.2000.19630379.x. [DOI] [PMC free article] [PubMed] [Google Scholar]
- Yu C, Derdikman D, Haidarliu S, Ahissar E. Parallel thalamic pathways for whisking and touch signals in the rat. PLoS Biol. 2006;4:e124. doi: 10.1371/journal.pbio.0040124. [DOI] [PMC free article] [PubMed] [Google Scholar]