

Abstract
The exact nature of the olfactory signals that arrive in the brain from the periphery, and their reproducibility, remain essentially unknown. In most organisms, the sheer number of olfactory sensory neurons (OSNs) makes it impossible to measure the individual responses of the entire population. We measured the individual in situ electrophysiological activity of OSNs in Drosophila larvae, in response to stimulation with 10 aliphatic odors (alcohols and esters). We studied control larvae (a total of 296 OSNs) and larvae with a single functional OSN, created using the Gal4-upstream activator sequence system. Most OSNs showed consistent, precise responses (either excitation or inhibition) in response to a given odor. Some OSNs also showed qualitatively variable responses (“fuzzy coding”). This robust variability was an intrinsic property of these neurons: it was not attributable to odor type, concentration, stimulus duration, genotype, or interindividual differences, and was seen in control larvae and in larvae with one and two functional OSNs. We conclude that in Drosophila larvae the peripheral code combines precise coding with fuzzy, stochastic responses in which neurons show qualitative variability in their responses to a given odor. We hypothesize that fuzzy coding occurs in other organisms, is translated into differing degrees of activation of the glomeruli, and forms a key component of response variability in the first stages of olfactory processing.
Keywords: olfaction, Drosophila, larvae, electrophysiology, coding, periphery
Introduction
Olfactory sensory neurons (OSNs) show a range of responses to specific odors, including excitation and inhibition, and variations in the temporal structure of their activity (Madrid et al., 2003; Hallem et al., 2004; Oka et al., 2004; Wilson and Mainen, 2006). These contribute to a peripheral “combinatorial code” which represents the physicochemical aspects of odorant molecules (Malnic et al., 1999). However, no attempts have been made to describe that combinatorial code in terms of how a full complement of OSNs responds simultaneously. Furthermore, although most descriptions of receptor–ligand relations are based around a “lock and key” analogy, the reproducibility of OSN activity remains unknown (Bhandawat et al., 2007); indeed, there are reports of substantial quantitative inter-OSN variability in response to a given odor (Bozza et al., 2002; Grosmaitre et al., 2006; Qiu et al., 2006).
To understand how odors are peripherally processed in situ, and to estimate the reliability of OSN responses, we studied the simultaneous electrophysiological responses of individual OSNs in whole Drosophila melanogaster larvae. The larva has only 21 pairs of OSNs that express 25 odorant receptor (Or) genes (Robertson et al., 2003), with most Ors expressed only in a single pair of OSNs (Fishilevich et al., 2005). Even a single OSN is sufficient for the larva to respond to odors, and bilateral sensory input enhances odor detection (Louis et al., 2008). Each OSN projects to a single glomerulus and on to a single projection neuron (this peripheral–central “wiring diagram” mirrors that of higher organisms in terms of its structure but is radically reduced to its most elementary components) (Raemekers et al., 2005; Vosshall and Stocker, 2007).
Individual response profiles of each larval Or have been described in an in vivo expression system (Kreher et al., 2005, 2008), but this “empty neuron” approach studies the function of Ors one by one in a non-natural neuronal setting, rather than as an in vivo and in situ ensemble (Pelz et al., 2006). Fishilevich et al. (2005) studied olfactory chemotaxis behavior in intact larvae and concluded that the larval olfactory code as a whole is highly redundant and does not function as the arithmetic sum of its parts. Our objective was to describe the activity and response reliability of all 21 larval OSNs in response to a restricted panel of 10 aliphatic odors (alcohols and esters) that are associated with the larva's natural food source (rotting fruit). We deliberately chose this small set of odors to focus on the reliability of the neuronal response, rather than attempting to describe the “molecular receptive range” of all larval OSNs. We expected to be able to “crack the code” by revealing the individual stimulus-response profiles of each of the 21 larval OSNs. As reported here, it turned out that the peripheral code held some surprises. Our findings help explain previous reports and suggest that the lowly maggot may hold a key to understanding OSN function.
Materials and Methods
Drosophila strains.
With the exception of w1118 (from Bloomington stock center), all strains [OrX-Gal4; upstream activator sequence (UAS)-Or83b; Or83b −] were gifts from Leslie Vosshall (The Rockefeller University, New York, NY) and were crossed according to the protocols outlined in Fishilevich et al. (2005) to create larvae with a single functional OSN. We used these strains to create a recombined stock that enable us to create [Or42a-Gal4/UAS-Or83b; Or59a-Gal4, Or83b −/−] larvae expressing two functional OSNs. All stocks were maintained at 25°C under a 12 h light/dark cycle on standard oatmeal and molasses medium. Individual third instar larvae were picked from tubes for electrophysiological study.
In vivo electrophysiology: extracellular multiunit recording.
A larva was secured with Parafilm onto a matchstick that had been soaked in distilled water, such that a small portion of the anterior end of the larva was uncovered. An earthed silver wire was placed in contact with the body of the larva. A silver wire reference electrode was also inserted into the abdomen, through the Parafilm, to allow differential recording. Glass microelectrodes, pulled on a Flaming/Brown micropipette puller (Sutter Instrument), from borosilicate glass capillaries (Harvard Apparatus), with an open-ended tip diameter of <1 μm were filled with Drosophila larval ringer solution composed of the following: (in mm) 2 KCl, 128 NaCl, 4 MgCl2, 18 CaCl2, 5 HEPES, and 36 sucrose, adjusted to pH 7.1 with HCl or NaOH (Jan and Jan, 1976). This recording electrode was inserted into the cuticle surrounding the dome of the larval dorsal organ (DO), past the level of the base of the dome, and onwards into the animal by as much as 50 μm toward the OSN cell bodies. Electrical activity was acquired using a Neurolog system (Digitimer). First, the AC preamp (NL104) subtracted reference electrode activity from the recording electrode activity. The remaining signal was then amplified and filtered at the following: low pass, 5 × 5 Hz; high pass, 50 k × 50 Hz with mains notch (50 Hz) in (filter units NL125 and 126). The signal was directed to a Cambridge Electronic Design (CED) micro 1401 (mk II) converter (Cambridge Electronic Design) converting the analog signal to a digital signal at a maximal sampling rate of 16,667 Hz. The digital signal was then recorded for storage and analysis.
In vivo electrophysiology: extracellular multiunit analysis.
Each recording could theoretically contain recordings from up to 21 OSNs. However, in fact we recorded from up to 11 OSNs, with many recordings containing far fewer (range, 1–11; mean number of OSNs, 5.9 ± 0.43, n = 50 in wild-type larvae). This implies that on average we can expect that each recording will contain signals from ∼28% of the larval OSNs and that to be confident of sampling the activity of a particular class of OSN at least once, recordings from at least four larvae will be necessary. Units were separated using the following conservative procedures which were adopted with the aim of reliably distinguishing cells, rather than picking up the maximum number of cells in each recording. First, all spikes that were less than twice the amplitude of baseline noise were discarded. We then used CED Spike2 (version 5.17) software to assign spikes to a number of separate classes (OSNs). We have previously used this approach to reliably identify the activity of neuroendocrine cells in the spinal cord of fish in which characteristic patterned activity of neurons as seen in Spike2 analysis of extracellular multiunit recordings was mirrored by intracellular recordings of the activity of individual neurons (Brierley et al., 2003; Ashworth et al., 2005). Spike2 identifies neuronal events on the basis of amplitude and waveform (Fig. 1). We presume that these two characters depend on features that are intrinsic properties of a given OSN type but are strongly mediated by the location of the neural processes with respect to the recording electrode, which varied randomly from larva to larva. As a result, identification of a particular amplitude/waveform combination for a given OSN type was not possible between larvae. The software removes baseline noise and generates a waveform marker for each individual spike. For each larva, these waveforms were subject to principal component analysis (PCA) which was able to discriminate the waveforms with a high degree of accuracy (Fig. 1 C), showing that within each recording we can reliably allocate responses to different OSN types. We then manually reviewed the allocation of every single spike (supplemental information, available at www.jneurosci.org as supplemental material); units that could not be separated according to waveform were discarded (Dobritsa et al., 2003). This procedure represents a technical advance over previous approaches to Drosophila larval olfactory electrophysiology, in which no attempt was made to distinguish the responses of individual OSNs (Oppliger et al., 2000; Kreher et al., 2005). We were able to succeed with respect to a subset of OSNs in each larva because we recorded from deep within the animal, where the dendritic processes are more diffuse. As a result, the relative amplitude of action potentials from different dendrites was apparently greater than those observed by Oppliger et al. (2000) and Kreher et al. (2005); we observed action potentials varying from 70 μV to 5 mV, providing a substantial variability in action potential amplitude to exploit during analysis [Oppliger et al. (2000) described action potentials of up to ∼1.5 mV; Kreher et al. (2005) did not provide a scale bar]. This variability compares favorably with that reported by Lu et al. (2007) who examined coding in the capitate peg (CP) of the mosquito Anopheles gambiae. The CP houses three chemosensory neurons which Lu et al. (2007) reliably distinguished according to amplitudes which varied from 20 to 320 μV: a 16-fold difference, compared with the 70-fold difference we observed. However, it should be reiterated that our method did not sort spikes on the basis of amplitude alone.
Figure 1.
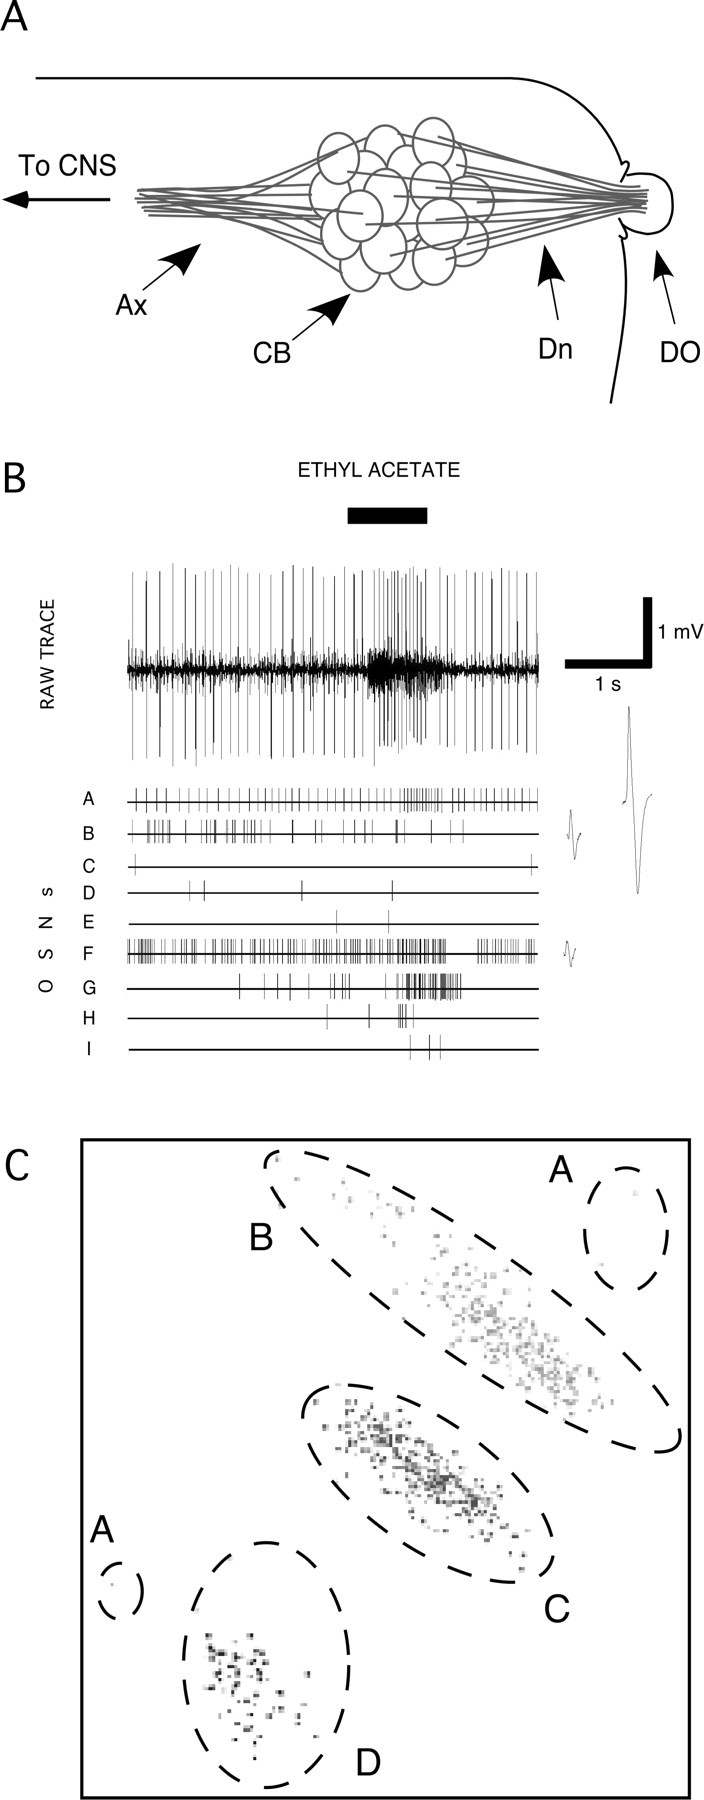
Identifying the differential activity of specific larval OSNs. A, Schematic drawing of the larval peripheral olfactory system. Dn, Dendrites; CB, cell bodies; Ax, axons. The electrode was placed in the larval body around the edge of the DO, and its tip advanced toward the dendrites. B, Typical multiunit recording from a single larva in response to a 1 s stimulation with ethyl acetate. Spike2 software was used to discriminate the activity of nine OSNs in this recording, on the basis of the shape and size of the action potential of each OSN. The lower traces show the firing activity of each OSN, as identified with Spike2. Expanded action potential waveforms are given beside OSNs A, B, and F to illustrate the differences between these neurons. C, Results of Spike2 PCA on signals from a multiunit recording in which the activity of four OSNs were identified. On these two dimensions, four nonoverlapping clouds of data were identified (indicated by different grayscale data points), corresponding to the activity of four OSNs, A–D. Data from unit A are in a single cloud when the data are projected on other principal components. For full details of the recording from which this PCA was taken, see supplemental information, available at www.jneurosci.org as supplemental material.
Odorants.
All odorants (five alcohols: butanol, pentanol, hexanol, octanol, nonanol; five aliphatic esters: ethyl acetate, propyl acetate, butyl acetate, iso-amyl acetate, pentyl acetate; and one aromatic compound: anisole) were from Sigma-Aldrich or BDH Laboratory Supplies and were of the highest purity available. For delivery, pure odorants were mixed to a final concentration of 0.01, 0.1, 1, 2, or 10%, as required, with distilled water at room temperature (∼25°C). Odorant preparations were shaken immediately before delivery to maintain an even concentration in solution. All experiments were performed using a 2% concentration, with the exception of the dose–response experiment (0.1, 2, and 10%) (see Fig. 6 C,D).
Figure 6.

Fuzzy coding is a property of OSNs. A, Overall percentage of OSNs showing each of the three response consistency values (100, 80, or 60) after stimulation with butanol or propyl acetate. B, Activity of five individual OSNs (identified by color), each from a different larva, in response to five presentations of butanol and propyl acetate. Dotted line, Threshold for classifying activity as a response. Response consistency was calculated by measuring the percentage of consistent responses (excitation or no response) over the five stimulus presentations. This could only have a value of 100 (5 of 5), 80 (4 of 5), or 60 (3 of 5). C, Percentage of OSNs reaching the qualitative response criterion over three concentrations of butanol and propyl acetate. Forty-two OSNs from eight larvae were tested. Each odor concentration was presented twice. The order of presentation was randomized, and there was a 2 min interstimulus interval. D, Percentage of OSNs showing precise (2 of 2) or fuzzy (1 of 2) responses to three concentrations of butanol and propyl acetate, each of which were presented twice. Red bar, Precise responses (2 of 2); black bar, precise nonresponses (2 of 2); gray bar, fuzzy responses (1 of 2).
Odor delivery.
A continuous stream of air was derived from an aquarium pump at 3 ml s−1. The air stream was directed via the “always open” connection of an electronic valve, through a 25 ml volume of distilled water in a sealed conical flask to a 1 ml syringe, from where it was released. The pipette tip was positioned 5 mm away from the preparation so that the airflow leaving the pipette was directed to the anterior of the larva. A second conical flask containing a 25 ml solution of the odor to be tested was connected to the “never open” connection of the valve and also to the syringe. Pulses were generated from a DS9A Stimulator (Digitimer UK) causing 1 s redirections of the air stream through the never open connection and hence the flask containing the odor. Each pulse therefore delivered 3 ml of air containing vapor from the odor solution to the continuous air stream. Distilled water was used as a control in all experiments.
Behavioral measures.
The procedure described by Cobb (1999) was adopted. Briefly, larvae were tested on a 9 cm diameter Petri dish covered with 2.5% agar. An undiluted odor source (2 μl) was loaded onto a circle of filter paper on one side of the dish; the paper was placed on the lid of an Eppendorf tube, to prevent larvae from coming into contact with it. The dish was placed on a sheet of paper such that the plate was divided into two halves with a central start zone. In a mass test, at least 20 third instar larvae were placed in the start zone, the lid of the dish was replaced, and the distribution of the larvae in the three zones (attracted, repulsed, not responding) was noted after 5 min, leading to the calculation of a behavioral response index (natt − nrep/ntot). In the case of individual measures of behavior, a single larva was placed in the start zone, and its position was recorded every minute.
Statistical analysis.
All analyses were performed using XLSTAT2007, a macro-based plug-in for Microsoft Excel.
Results
Larval olfactory sensory neurons show differential responses to odors
In a single larva, we recorded simultaneously from a random sample of up to 11 of the 21 OSNs in the larval DO (Fig. 1 A). In each recording, electrophysiological activity was allocated to particular response classes (OSNs) using Spike2 software and manual inspection (see Materials and Methods) (Fig. 1 C; supplemental information, available at www.jneurosci.org as supplemental material). The electrophysiological responses of these OSNs showed inter and intraneuronal variability. For example, Figure 1 B shows how a multiunit recording was composed of the differential responses of eight larval OSNs to a 1 s presentation of ethyl acetate. To demonstrate the validity of our procedure, and to investigate the responses of specific OSNs expressing a known Or, we used the system devised by Fishilevich et al. (2005), which uses the Or83b −/− anosmic mutant and conditionally expresses the wild-type form of Or83b under control of specific Or genes using the Gal4-UAS system, to produce a larva with a single functional OSN in each DO. We therefore began a survey of [OrX-Gal4/UAS-Or83b; Or83b −/−] larvae; Figure 2 shows the responses to butanol and propyl acetate of eight individual [Or42a-Gal4/UAS-Or83b; Or83b −/−] larvae. Each larva had the same, single functional OSN (Or42a), which was consistently identified in the electrophysiological analysis procedure, together with a varying number of nonresponding OSNs which nonetheless showed spontaneous activity. Responses of single-functional Or42a larvae to propyl acetate were qualitatively consistent but quantitatively variable. However, to our surprise, responses to butanol showed both quantitative and qualitative variability: change in activity during stimulation ranged from 17 to 133 spikes/s for propyl acetate and 0 to 54 spikes/s for butanol. As a result of this quantitative variation, there was also qualitative response variability: some Or42a OSNs responded to butanol, others apparently did not (e.g., larvae 1 and 8). This figure also shows that individual OSNs show varying levels of spontaneous activity: the functioning OSN in larva 8, for example, is particularly noisy, whereas that in larva 4 shows low levels of spontaneous activity. Figure 2 B confirms that the Or42a OSN does indeed show qualitative response variability to butanol: a single larva with one functional OSN (Or42a) was stimulated twice with propyl acetate and twice with butanol with a 2 min interstimulus interval; the response to propyl acetate was consistent, whereas the response to butanol was absent on the first presentation but present on the second.
Figure 2.
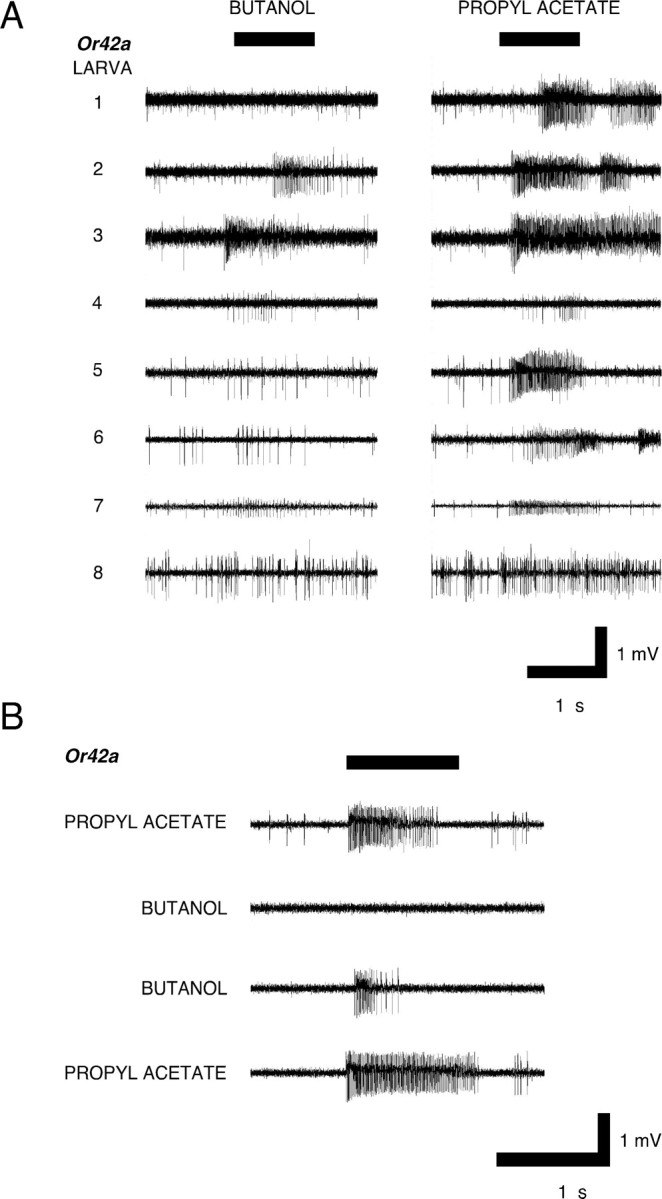
Variability and consistency in OSN responses. A, Electrophysiological responses of eight [Or42a-Gal4/UAS-Or83b; Or83b −/−] larvae to stimulation with butanol and propyl acetate. The order of presentation was rotated from larva to larva; there was a 2 min interstimulus interval. Only a single responding OSN was detected in each larva. Controls demonstrated that both OrX-Gal4 and UAS-Or83b larvae showed normal, wild-type multiunit responses (data not shown). B, Electrophysiological responses of a single OSN in a [Or42a-Gal4/UAS-Or83b; Or83b −/−] larva which was presented twice with propyl acetate and twice with butanol with a 2 min interstimulus interval. The Or42a OSN responded both times to propyl acetate but clearly failed to respond to the first presentation of butanol.
To provide an objective basis for estimations of qualitative variability (that is, to enable us to decide whether an OSN responded or not), we established a response criterion that took into account the spontaneous background activity of each OSN (supplemental information, available at www.jneurosci.org as supplemental material). We set the probability of making a Type 1 error (the proportion of spontaneous changes that would be mistakenly classified as a response) at 5%. To determine what change in firing rate would correspond to this 5% level, we studied the distribution of 522 spontaneous changes in OSN activity per second and of 2960 changes in activity in response to olfactory stimulation with a range of alcohols and esters (Fig. 3). Spontaneous changes are given in green; during stimulation, inhibition (blue) occurred relatively infrequently; the vast majority of changes during stimulation were excitatory (red). On the basis of these distributions, we determined that the 5% level corresponded to a change of ±4 Hz compared with spontaneous activity; this was the criterion we therefore adopted to indicate whether a given OSN showed a response or not. Because different OSNs show different levels of spontaneous activity, the absolute level of spiking required to be classified as a response differed between OSNs.
Figure 3.

Distribution of spontaneous OSN activity and of activity during olfactory stimulation. Green line, Frequency curve of 522 second-to-second changes in spontaneous firing rate over a period of 10 s in 58 OSNs from control w1118 larvae. Firing rates were binned into 2 Hz bins. The upper 2.5 percentile of the spontaneous changes was greater than +4 Hz; the lower 2.5 percentile of the spontaneous changes was less than −4 Hz. These cutoffs were used to establish objective criteria for excitation (greater than +4 Hz), inhibition (less than −4 Hz), and no response (−4 − +4 Hz) greater than the largest second-to-second change in spontaneous activity seen in each OSN in the 10 s before stimulation. Histogram, Cumulative frequency graph showing activity induced in 296 OSNs from 50 larvae by 10 stimulus odors, compared with the largest spontaneous change seen in each OSN in the 10 s before each stimulation. Each odor was presented for 1 s, in random order, with a 2 min interstimulus interval. Red, Activity above the excitation threshold; blue, activity below the inhibition threshold; black, activity defined as no response.
Before pursuing our investigation of the responses of [OrX-Gal4/UAS-Or83b; Or83b −/−] larvae, we confirmed that our technique can identify the activity of individual types of OSN by following the procedure adopted by Fishilevich et al. (2005) and driving UAS-diptherin toxin (DTI)-14 under the control of the Or42a promoter [Or42a-Gal4/UAS-DTI-14], thereby killing the pair of Or42a OSNs in each larva. We chose Or42a because it shows characteristically strong responses to ethyl acetate. We made recordings from 54 [Or42a-Gal4/UAS-DTI-14] larvae and compared the responses of 296 OSNs to ethyl acetate with the same number of OSNs from w1118 larvae. As expected, [Or42a-Gal4/UAS-DTI-14] larvae showed a significant reduction in the total number of units responding to ethyl acetate compared with w1118 larvae (30 vs 55 OSNs, respectively; χ2 = 7.913, p = 0.005). This is attributable to the absence of Or42a OSNs which are one of the OSN types that responds to ethyl acetate. There was also a significant reduction in the intensity of the responses (Mann–Whitney U test on activity of responding units, p = 0.017). Figure 4 shows that this was caused by the loss of the characteristic high-intensity response to ethyl acetate shown by most Or42a OSNs (>30 Hz above criterion) (Fig. 4 B). Other Or42a OSNs that show lower spike rates above criterion during stimulation (1–30 Hz) (Fig. 4 B) will also be absent from Figure 4 C; the responses in this range seen on Figure 4 C must be because of the activity of one or more of the 20 intact OSNs in [Or42a-Gal4/UAS-DTI-14] larvae which also respond to ethyl acetate.
Figure 4.

Loss of characteristic electrophysiological responses induced by killing a specific OSN. A–C, Larvae from control w1118 (A), [Or42a-Gal4/UAS-Or83b; Or83b −/−] (“Or42a only”) (B), and [Or42a-Gal4/UAS-DTI] (“Or42a-DTI”) (C) lines were stimulated with ethyl acetate for 1 s, and their electrophysiological responses were recorded. Responses were binned in spikes above criterion [criterion was +4 or −4 Hz (for excitation or inhibition, respectively) greater than the largest second-to-second change in spontaneous activity seen in each OSN in the 10 s before stimulation]. Or42a-DTI larvae, in which the Or42a OSN was killed, showed loss of the characteristic high-intensity responses (>30 Hz above criterion) that could be seen in Or42a-only and in w1118 larvae.
We next ensured that the lack of ORs in 20 of the larval OSNs did not affect the activity of the target OSN. As expected, the activity of OSNs in anosmic Or83b −/− larvae showed no change when stimulated with an odor (supplemental information, available at www.jneurosci.org as supplemental material). However, the mean frequency of spontaneous activity shown by Or83b −/− neurons was significantly lower than that of control w1118 larvae (3.63 ± 1.78 Hz and 7.6 ± 0.62 Hz, respectively; t (82) = 3.119, p = 0.002). There was no significant change in the activity of the nonresponding Or83b −/− OSNs during stimulation (data not shown), providing no evidence of peripheral interactions between OSNs in these [Or42a-Gal4/UAS-Or83b; Or83b −/−] larvae.
Using [OrX-Gal4/UAS-Or83b; Or83b −/−], we surveyed the responses of larvae containing a single functional OSN (Or1a, Or13a, Or42a, Or42b, Or45a, Or49a, Or59a, or Or83a). All these Ors (one-third of the total larval Or complement) are expressed in a single cell and are not known to coexpress with other Ors, apart from Or83b (Fishilevich et al., 2005). Figure 5 shows the mean response levels of each class of OSN above threshold, during stimulation with 10 odors, together with the percentage of OSNs that gave a response to each odor in those OSNs that responded to more than one odor (Fig. 5, legend). We studied electrophysiological activity in >350 single functional OSN larvae; not once did we detect more than one responding OSN. This not only validates the [OrX-Gal4/UAS-Or83b; Or83b −/−] preparation as a way of studying the activity of single OSNs, it again provides no evidence for peripheral interaction between the activity of OSNs.
Figure 5.

Electrophysiological responses of larvae expressing a single functional OSN. [OrX-Gal4/UAS-Or83b; Or83b −/−] larvae were stimulated with 10 odors, for 1 s each, in random order, with a 2 min interstimulus interval. Histograms show the mean (±SEM) firing rates of single OSNs in larvae expressing each class of Or. Criterion was +4 or −4 Hz (for excitation or inhibition, respectively) greater than the largest second-to-second change in spontaneous activity seen in each OSN in the 10 s before stimulation. Percentages indicate the percentage of OSNs that showed a response when stimulated with a given odor, in preparations in which the functional OSN had been identified by showing a response to another odor. By definition, this statistic is not available for OSNs that responded to only a single odor. A minimum of 60 OSNs were tested with each odor in each strain (most of these OSNs did not respond, presumably because they were Or83b −/− OSNs). A minimum of eight responsive OSNs were studied with each odor in each strain. Raw trace panel for an Or49a OSN shows an example of low levels of inhibition shown by this OSN in response to stimulation with butanol.
Most OSNs produced a consistent activity profile (“precise coding”) during stimulation with a given odor: they either showed a response or failed to respond. For example, OSNs expressing Or1a, Or45a, Or49a, Or59a, and Or83a showed precise coding in response to the range of odors used here, with identical qualitative profiles during each stimulus (excitation or no response; Or49a OSNs gave consistent, but small, inhibitory responses to butanol; further results described below) (Fig. 5, raw trace). However, as noted above, OSNs expressing Or13a, Or42a, or Or42b also showed qualitatively variable responses (sometimes they responded to a given odor, sometimes they did not). We describe this heterogeneous response profile as fuzzy coding. For example, 100% of [Or42a-Gal4/UAS-Or83b; Or83b −/−] OSNs responded to propyl acetate and to ethyl acetate, whereas only 57% responded to butanol, and only 50% responded to pentyl acetate (Fig. 5).
The sources of fuzziness
Is fuzzy coding inherent in OSN functioning, is it a function of interindividual variability, or is an artifact of our experimental setup? To eliminate the possibility that our findings were produced by the [OrX-Gal4/UAS-Or83b; Or83b −/−] system, we investigated the reliability of the responses of OSNs in control w1118 larvae, containing 21 functional OSNs. Forty-four OSNs in eight w1118 larvae were each stimulated five times with a 1 s dose of butanol, and five times with propyl acetate, presented in a random order, with a 2 min interstimulus interval. We then measured response consistency in these OSNs. There was no change in the percentage of OSNs responding over time, showing that there is no evidence of peripheral adaptation in our protocol.
Figure 6 A shows that, for each odor, 81.8% of OSNs (36 of 44) showed consistent, precise coding during stimulation with each odor: they either responded (excitation or, in one case, inhibition) or did not respond on each of the five presentations. However, for each odor, 18.2% of OSNs (8 of 44) showed one or two qualitatively variable, fuzzy responses (Fig. 6 A), showing that fuzzy responses are not an artifact of the Gal4/UAS system. The surprising identity of the proportion of OSNs showing each class of response consistency could imply that some OSNs are consistently fuzzy, whereas others are consistently precise. However, there was no evidence that a small subset of neurons were consistently fuzzy: 27.3% of OSNs (12 of 44) showed precise coding in response to one odor and fuzzy coding in response to the other; only 4.5% of OSNs (2 of 44) showed fuzzy responses to both odors, suggesting that at least one-third of the larval OSNs can show this kind of stochastic response. We conclude that a given OSN may show either fuzzy or precise responses, depending on the stimulus.
We found no evidence of interindividual variability in the frequency of fuzzy responses. Figure 6 B shows the activity of five randomly chosen responding OSNs from five separate larvae during repeated odor presentations. The extreme quantitative variation shown in response to butanol by OSN E (blue), and the qualitative variation shown in response to propyl acetate by the OSNs B and D (green and purple, respectively), demonstrate the reality of fuzzy coding. The manner with which each OSN met the response criterion over the five stimulus presentations of each odor demonstrates that OSNs can display precise, consistent responses to one odor, but fuzzy, variable responses to another.
We next tested whether fuzzy responses are an artifact of the particular odor concentrations used here. We studied the responses of 42 OSNs in eight larvae to three concentrations of butanol and of propyl acetate; each concentration was presented twice, in random order. These OSNs also showed both consistent and fuzzy coding in response to olfactory stimulation (Fig. 6 C,D). Increasing odor concentrations induced significantly more responding OSNs for propyl acetate (χ2 1 = 4.70, p = 0.03), but, surprisingly, not for butanol (χ2 1 = 0.57, p = 0.45). During stimulation, most neurons displayed consistent, precise coding, either not responding to any of the six presentations (butanol, 31 of 42; propyl acetate, 25 of 42) or showing a response each time (2 of 42 for each odor; these were four different neurons). The remaining OSNs (9 of 42 for butanol and 15 of 42 for propyl acetate) showed variable responses, including occasional inhibition in neurons that also showed excitation in response to that odor. Most importantly, there was no evidence that fuzzy responses are a function of odor concentration: the proportion of neurons showing a consistent qualitative activity profile during each of the two odor presentations at each concentration did not change significantly with increasing concentration of either odor (propyl acetate, χ2 2 = 1.81, p = 0.40; butanol, χ2 2 = 0.72, p = 0.70) (Fig. 6 D).
These data suggest that fuzziness is an intrinsic property of some OSNs in response to some odors and is not related to the concentration-dependent recruitment of OSNs shown by propyl acetate. This is confirmed by the fact that stimulation with butanol led to no significant concentration-dependent recruitment yet induced fuzzy coding at all three concentrations. There was also no indication that interindividual variability accounted for fuzzy responses. For example, every larva for which at least one OSN was recorded as responding to butanol showed some fuzzy coding in response to stimulation with this odor. Finally, to test whether fuzziness is a function of stimulus duration, we measured the activity of OSNs in response to three 5 s presentations of butanol, with an interstimulus interval of 2 min (Fig. 7). Although the overall response of the observed OSNs was the same each time (strong excitation), different patterns of OSN activity contributed to this response on each occasion. Patterns of OSN activity were not constant from stimulus to stimulus or within the 5 s stimulus duration. There was no evidence to suggest that with a longer stimulation more OSNs were recruited or that OSNs showed continuous excitation; fuzzy, qualitatively variable coding was observed in all three examples of this longer stimulus presentation. Together, these control experiments confirm our initial finding that Drosophila larval OSNs show both precise and fuzzy coding in response to odor stimulation.
Figure 7.
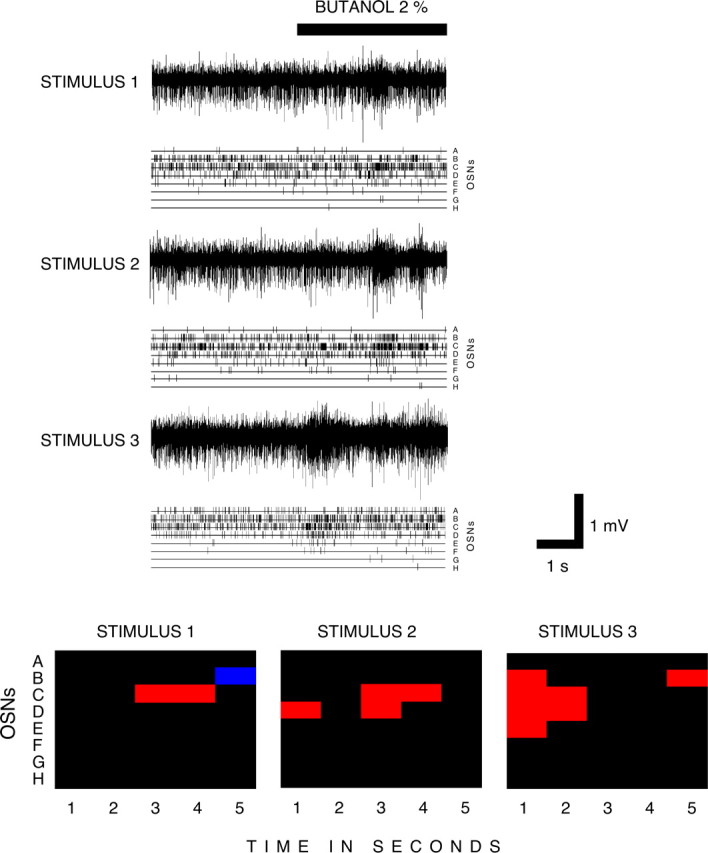
Fuzzy coding is not a function of stimulus duration. Three recordings from a w1118 control larva, showing its responses to three successive 5 s stimulations with butanol (2%). Eight OSNs were detected in these recordings. Top, Three successive raw traces, each corresponding to a stimulus, together with the firing activity for each OSN. Bottom, Responses of these OSNs expressed in terms of their activity above or below the response threshold. The responses for each 5 s stimulus are divided into five successive 1 s periods. Red, Excitation; blue, inhibition; black, no response.
Measuring the responses of larvae with two functional OSNs
Given that particular OSN types can show a combination of precise and fuzzy responses, the same profiles should be observed in larvae that express only two Ors. This would also enable us further to exclude any problems associated with stimulus delivery. We therefore studied the responses of [Or42a-Gal4/UAS-Or83b; Or59a-Gal4, Or83b −/−] larvae, in which only the Or42a and Or59a OSNs were functional. To confirm that only two cells showed Gal4 expression, we studied [Or42a-Gal4/UAS-GFP; Or59a-Gal4, Or83b −/−] larvae and found GFP expression only in two cells of the DO (data not shown). Preliminary experiments showed that [Or42a-Gal4/UAS-Or83b; Or83b −/−] larvae showed precise activation in response to ethyl acetate and never responded to anisole, whereas [UAS-Or83b; Or59a-Gal4, Or83b −/−] larvae showed fuzzy responses to both odors (Fig. 8 A). Responses to odors in these two-functional Or larvae were consistent with the profile of each Or separately. In recordings from 40 larvae, we found that 16 showed no responses to any stimulation (this was attributable to the fact that, by chance, we did not record from either functional OSN and underlines the fact that the recording procedure is essentially random with regard to any specific OSN); 17 contained one responsive OSN that either showed a precise response to ethyl acetate and no response to anisole, or a fuzzy response to both odors. The remaining seven recordings contained two responsive OSNs that were clearly separable into the same two response profiles (Fig. 8 B). We gave each larva four presentations of each odor, in random order, with a 2 min interstimulus interval; this gave an almost perfect match to the two single Or profiles (Fig. 8 B). If we simply took the first presentation of each odor, the result was less precise, although the sample size was much smaller (n = 7) (Fig. 8 C). This experiment confirms that fuzzy responses are a property of specific OSN types in response to specific kinds of stimulation. It also finally excludes any potential effect attributable to the stimulus delivery system as the precision of one OSN was maintained throughout repeated stimulations, whereas the responsiveness of a second OSN in the same larva to the same odor stimulus was fuzzy.
Figure 8.
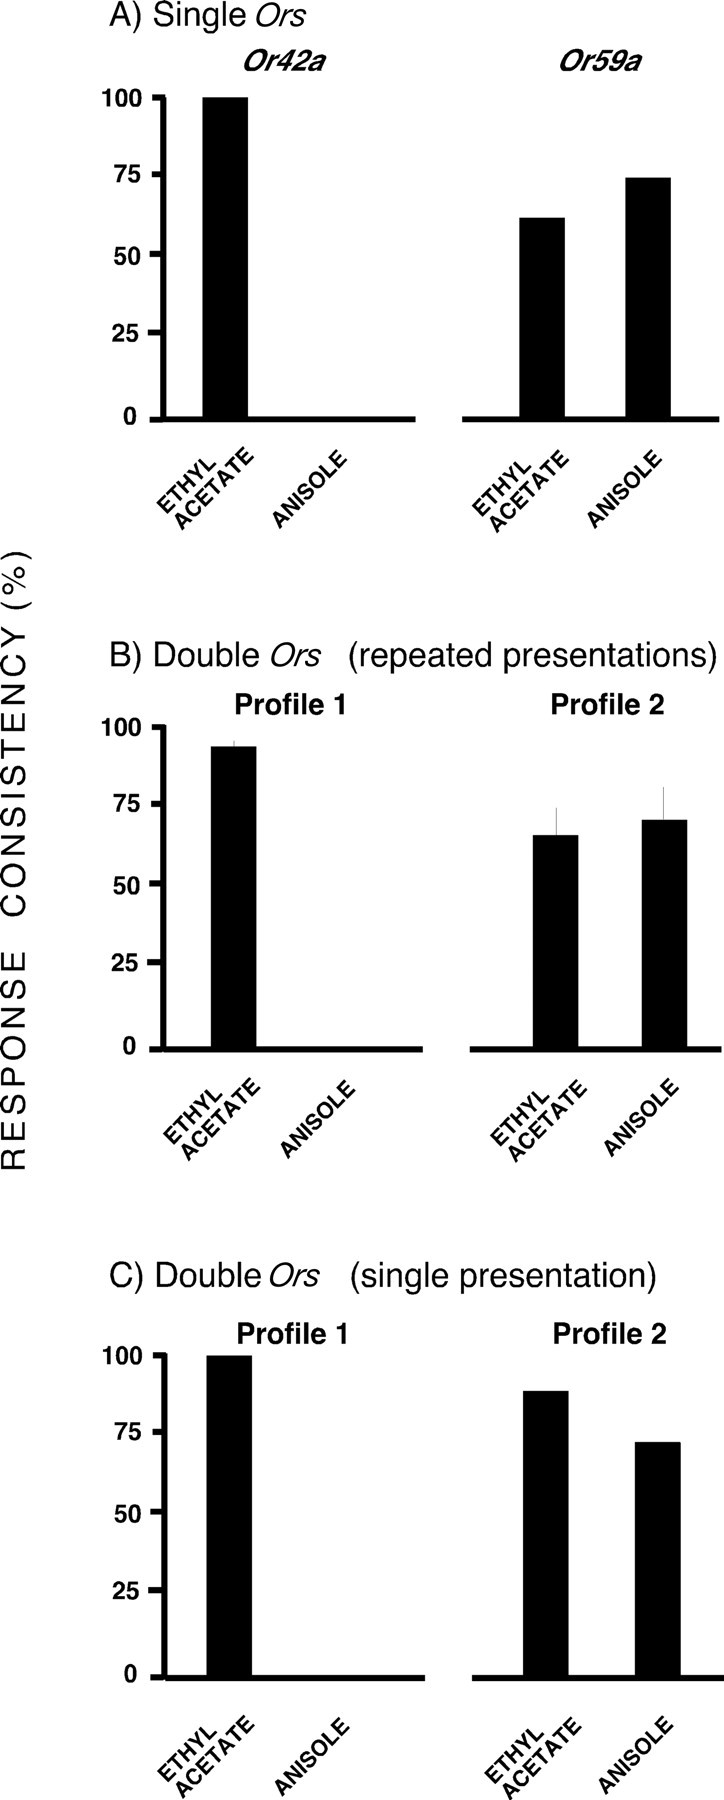
Larvae with two functional OSNs show the same response profiles as larvae with each of the OSNs alone. Electrophysiological activity of OSNs from [Or42a-Gal4/UAS-Or83b; Or83b −/−] (“Or42a”), [UAS-Or83b; Or59a-Gal4, Or83b −/−] (“Or59a”), and [Or42a-Gal4/UAS- Or83b; Or59a-Gal4, Or83b −/−] (“Double Or”) larvae, in response to 1 s presentations of ethyl acetate and anisole. A, Single Or larvae were presented with each odor once and either showed a response or did not. B, Double Or larvae (n = 7) were presented with each odor four times (“repeated presentations”); the mean response consistency is presented for these larvae (±SEM). C, Response consistency of double Or larvae on the first presentation of each odor (“single presentation”).
Precise and fuzzy coding combine to produce a large range of response patterns
To investigate how the varied forms of coding we have observed (precise excitation, precise inhibition, fuzzy excitation) interact in larvae with a full complement of OSNs, we recorded the electrophysiological activity of 296 OSNs from 50 control w1118 larvae. Each larva was subjected to a 1 s period of stimulation with the same panel of five alcohols and five aliphatic esters used previously. Odors were presented in random order, with a 2 min interstimulus interval. The spontaneous activity of these OSNs showed a highly significant correlation between the spontaneous activity in the 10 s before the first odor presentation and a similar period before the final odor presentation (r (590) = 0.45, p < 0.001). No change was seen in mean OSN activity [t (296) = 0.432, p = not significant (n.s.)], and no change in the number of firing OSNs was detected in the final prestimulus period compared with the first prestimulus period (χ2 1 = 1.53, p = n.s.). We assumed that the 296 neurons recorded represent a random sample of all 21 OSNs in the larval DO, with each OSN represented ∼14 times. The types of responses induced by the 10 odors (excitation, inhibition, and no response), and their frequency, are summarized in supplemental information, available at www.jneurosci.org as supplemental material, together with the raw data.
Figure 9 A shows the qualitative response profiles of each of the 296 OSNs, grouped after having been subject to cluster analysis using Ward's method (Ward, 1963) [for previous uses of this method in classifying the responses of OSNs, see de Bruyne et al. (1999); Ward (1963); Hallem and Carlson (2006)]. These data are highly variable, with little reproducibility in the response profiles shown by these OSNs. We did not, for example, see just 21 qualitative response profiles, although there must be a maximum of 21 different OSN types present in this sample. Strikingly, the five precise coding profiles seen for the single Or larvae in Figure 5 were rarely seen in the data in Figure 9 A and always at a lower frequency than expected (14 times): the Or1a profile (butanol alone) was seen five times, the Or45a profile (hexanol and pentyl acetate) was not seen at all, the Or49a profile (butanol inhibition) was seen twice, the Or59a profile (ethyl acetate alone) was seen nine times, whereas the Or83a profile (propyl acetate alone) was seen six times.
Figure 9.
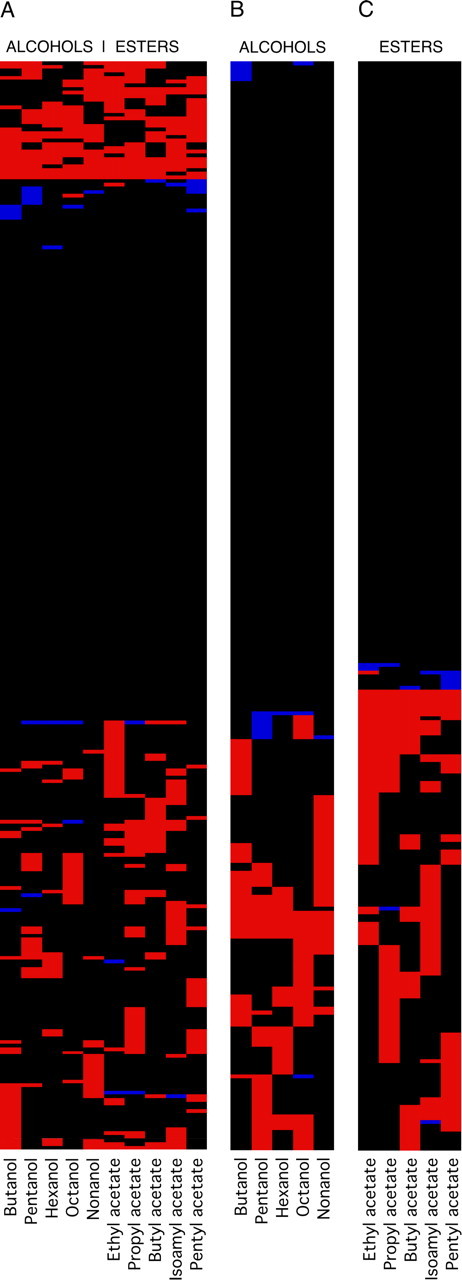
Patterns of OSN activity. Qualitative response patterns for 296 OSNs from control w1118 larvae stimulated with 10 odors. Red, Excitation; blue, inhibition; black, no response. A, Responses to all 10 odors; B, responses to alcohols alone; C, responses to esters alone. Data were grouped using cluster analysis (Ward's method). Raw data can be found in supplemental information, available at www.jneurosci.org as supplemental material.
To reveal the underlying mixtures of precise and fuzzy coding shown by these OSNs, we first investigated whether the apparent responsiveness of each OSN could be explained by inter-OSN differences in spontaneous activity. One-hundred and thirty-five OSNs (45.6% of the total which we take to represent 9–10 types of OSN) showed no response to any of the 10 odors tested here. We compared the spontaneous activity of these 135 OSNs with that of the other 161 and found no significant difference (Mann–Whitney U test, p = 0.109), indicating that these two populations of OSNs (responders and nonresponders) were indistinguishable with respect to their baseline electrophysiological activity. Furthermore, the number of odors detected by each OSN was not a function of its spontaneous activity: there was no significant correlation between these two factors (r (158) = −0.084, p = 0.290). Finally, we reanalyzed the data using higher and lower criteria for determining a response and examined the patterns produced by the raw levels of activity for each OSN in response to stimulation. None of these alternative analyses produced any clearer patterns (analyses not shown) (raw data are presented in supplemental information, available at www.jneurosci.org as supplemental material). We conclude that the variety of coding shown in Figure 9 A is a genuine function of the activity of the larval OSNs which shows both precise and fuzzy coding.
To explore these data, we divided the responses of all 296 OSNs according to the five odors from each functional group (alcohols and esters) and again subjected these data to cluster analysis using Ward's method (Fig. 9 B,C, respectively). As expected, these reduced data sets produced a smaller number of response profiles. Here, 56.76% of OSNs (the equivalent of 12 types of OSNs out of 21) showed no response to any of the five esters tested, whereas 60.81% (the equivalent of 12–13 types of OSNs) showed no response to any of the five alcohols. In both cases there were ≫21 response profiles, supporting the view that each type of OSN is capable of producing a range of response profiles to these odors through a combination of precise and fuzzy coding.
To investigate how individual OSNs combine fuzzy and precise coding, we studied those neurons from the 296 shown in Figure 8 that responded to butanol, but not to other alcohols (n = 14) (Fig. 10 A), and those which responded to propyl acetate, but not to other esters (n = 9) (Fig. 10 B). These groups of OSNs did not overlap (i.e., none of the neurons in Fig. 10 A are shown in Fig. 10 B) and included no examples of inhibitory responses. The absolute firing rates during odor stimulation (top, heat charts) demonstrate that our response criterion has not blurred out significant variability: in general, there was a clear distinction between the response to either butanol and propyl acetate, respectively, and the activity levels seen during stimulation with other odors, in particular those from the same functional group, which our response criterion classified as nonresponders. Both groups of neurons showed specific responses to alcohols or esters and variable responses when stimulated with odors from the other functional group. For example, nine of the butanol-responding OSNs (Fig. 10 A) displayed varying levels of responsiveness to the five esters. There was no significant correlation between the amplitude of the response to butanol and the number of esters to which each OSN in Figure 10 A responded (r (13) = 0.511, p = n.s.), nor between the amplitude of the response to propyl acetate and the number of alcohols to which each OSN in Figure 10 B responded (r (8) = 0.662, p = n.s.). These results reinforce our finding that OSN response profiles are not a reflection of inter-OSN differences in responsiveness.
Figure 10.

Specific and variable OSN responses to functional groups. A, B, Responses of OSNs showing specific responses to one odor in each functional group: either butanol (A; n = 14) or propyl acetate (B; n = 9). Data taken from Figure 9. Histograms show mean (±SEM) firing rates above threshold of responding OSNs. Lower heat charts show qualitative response patterns (red, excitation; blue, inhibition; black, no response); top heat charts show absolute firing rates (regardless of spontaneous activity).
Larval OSNs act together to discriminate odors according to molecular weight and structure
To explore the data in Figure 9 A, and provide an initial insight into the possible significance of these inputs for the larval brain, we performed PCA using a covariance matrix. Figure 11, A–C, shows the results of these analyses, presented as three two-dimensional (2D) plots and a fourth 3D plot (movies showing the 3D plots in rotation can be found in supplemental information, available at www.jneurosci.org as supplemental material) (for full details of PCAs, see Fig. 11, legend). Figure 11 A shows the PCA results for all 10 odors. Interestingly, when responses to all 10 odors were analyzed together, none of the PCs discriminated responses to odors by their functional group. PC2 separated the alcohols and pentyl acetate from the rest of the esters, whereas PC3 mixed the two functional groups but separated the 10 odors into two clusters. Figure 11 B shows the PCA results for alcohols alone. Butanol and nonanol were grouped together (this was particularly evident in the 3D projection, and along PC2). PC3 discriminated octanol and pentanol, whereas the remaining three odors were grouped in between. There was no clear grouping/alignment of the odors according to carbon number. In all three 2D plots of the PCA on responses to aliphatic esters (Fig. 11 C), butyl acetate and propyl acetate were grouped close together, suggesting these two odors may be processed similarly by the larval OSNs. PC2 of the ester analysis distinguished between the branched isoamyl acetate and the remaining linear aliphatic esters which were aligned in order of increasing molecular weight. Principal component 3 discriminated solely on the basis of molecular weight: plotting PC3 against PC2 produced a diagonal distribution of the linear aliphatic esters.
Figure 11.

Principal components analysis of OSN responses. The first three PCs in each analysis of the data from Figure 9 are presented as three pairwise 2D plots and a single 3D plot. A, PCA results for all 10 odors; PC1–3 accounted for 55.32% of the total variability. B, PCA results for alcohols; PC1–3 accounted for 79.1% of the total variability. C, PCA results for esters; PC1–3 accounted for 74.32% of the total variability. For 3D plots, x = PC1; y = PC2; z = PC3. Movies showing the 3D plots in rotation can be found in supplemental information, available at www.jneurosci.org as supplemental material.
The effect of precise and fuzzy coding on behavior
We measured the behavioral responses of larvae expressing single Ors (Or42a and Or59a) and larvae expressing both these Ors ([Or42a-Gal4/UAS-Or83b; Or59a-Gal4, Or83b −/−]), stimulating them with a range of odors that induce both precise and fuzzy responses (Fig. 12) in these OSNs. We used the mass “plate test” in which at least 20 larvae are tested simultaneously. Single OSN larvae revealed no consistent relationship between the electrophysiological response shown by a particular OSN and the behavioral response displayed by larvae in which only that OSN was functional. Thus ethyl acetate, which consistently activated Or42a OSNs, did not induce any significant behavioral response in [Or42a-Gal4/UAS-Or83b; Or83b −/−] larvae, whereas odors that induced fuzzy electrophysiological responses sometimes induced significant levels of attraction (e.g., ethyl acetate/Or59a). However, the responses of [Or42a-Gal4/UAS-Or83b; Or59a-Gal4, Or83b −/−] larvae, which are a step closer to the full complement of OSNs, did provide an initial glimpse of the behavioral significance of the combinatorial peripheral code: the two significantly attractive responses were induced by combination of a fuzzy response in the Or42a neuron and a consistent nonresponse in the Or59a OSN. In both cases, these responses were qualitatively greater than in either of the single Or lines (in the case of the response to pentyl acetate, the attraction was significantly greater than in control larvae) (Fig. 12 D).
Figure 12.
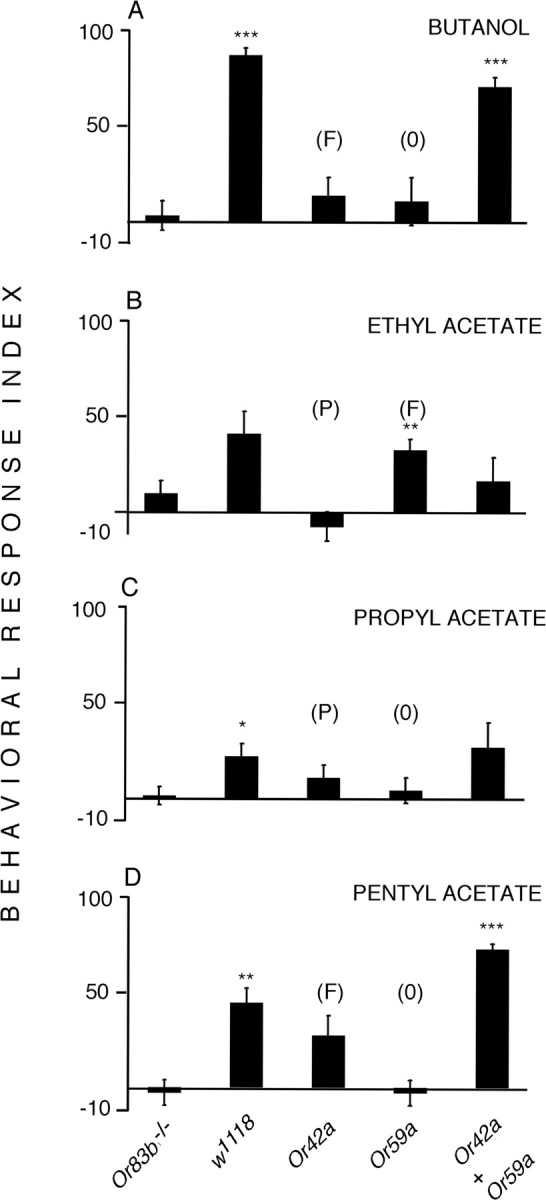
Behavioral responses of larvae with one or two functional OSNs. Mean behavioral response indices (±SEM) for w1118, [Or42a-Gal4/UAS-Or83b; Or83b −/−] (“Or42a”), [UAS-Or83b; Or59a-Gal4, Or83b −/−] (“Or59a”), and [Or42a-Gal4/UAS-Or83b; Or59a-Gal4, Or83b −/−] (“Or4a + Or59a”) larvae in a mass olfactory test. Anosmic Or83b −/− larvae were included as a control. Larvae were tested separately with four odors (A, butanol; B, ethyl acetate; C, propyl acetate; D, pentyl acetate). Eight tests, each involving at least 20 larvae, were performed for each genotype/odor combination. For full details, see Materials and Methods. P, Odor that induces precise, consistent electrophysiological activation in that OSN; O, odor that induces consistent absence of electrophysiological response in that OSN; F, odor that induces variable, fuzzy electrophysiological responses in that OSN (Fig. 5). Statistical comparisons (t test) were made compared with the responses of Or83b −/− larvae; *p < 0.05; **p < 0.01; ***p < 0.001.
To further investigate the behavioral response induced by precise and fuzzy coding, we observed the behavior of single [Or42a-Gal4/UAS-Or83b; Or83b −/−] larvae, under the same conditions as in the mass plate test, and to the same four odors, except that here we noted larval position each minute. As with the mass test, no significant behavioral responses were induced by any of these odors in these larvae at 5 min. However, when the responses to odors that induced precise responses (ethyl acetate and propyl acetate) and to those that induced fuzzy responses (butanol and pentyl acetate) were pooled, we found a significant attractive response at 1 min to the odors coded by precise responses (χ2 2 = 8.24, p = 0.016) but not to those coded by fuzzy responses (χ2 2 = 5.36, p = n.s.).
Discussion
The noisy nose: OSNs show both precise and fuzzy coding
Against our expectations, we found that in whole Drosophila larvae, responses to a narrow range of ecologically significant odors involved a mixture of (1) precise, reproducible neuronal coding in which specific neurons were consistently excited, inhibited, or never responded, and (2) variable, fuzzy coding, in which some neurons responded inconsistently to certain odors. The result is a noisy peripheral signal, in which patterns of OSN activity are rarely repeated, even when an identical stimulus is presented (Figs. 2 B, 7). Our first assumption was that these responses must reflect some kind of artifact. However, control experiments showed that these phenomena were not a function of odor, of concentration, of stimulus duration, or of stimulus delivery, nor were they related to differences in responsiveness shown by OSNs or by individual larvae. Strong evidence for the existence of fuzzy coding is provided by the existence of such profiles in [OrX-Gal4/UAS-Or83b; Or83b −/−] larvae in which only one OSN is functional (Fig. 5) and in which the activity of the given OSN is readily identifiable (this also shows that our procedure for detecting the activity of single OSNs in a multiunit recording was not the cause of our observation of qualitative response variability). Following our prediction, the typical response profiles seen in single-functional OSN larvae of two different OSN classes were also found in larvae in which these two OSNs were expressed together (Fig. 8). Gal4 lines can vary in penetrance across a population or between lines, thus the existence of fuzzy responses could be produced by low or absent OR83b levels in particular individuals or lines. We found that given single-functional OSN lines consistently showed both precise and fuzzy responses and that all individuals of that genotype showed both types of response (Fig. 5), strongly suggesting that our results are not caused by differential penetrance of Or83b across or within lines. Finally, it should be recalled that stochastic activity in response to certain odors was also observed in the full complement of larval OSNs in two unmanipulated control strains: this was not a phenomenon that was limited to genetically manipulated strains.
Faced with this accumulation of evidence we conclude that, as expected, OSNs can show precise, consistent responses to odors, but also that they can show stochastic, fuzzy responses to other odors. Similar findings have been reported previously. Bozza et al. (2002) found that the responses of mouse OSNs expressing MOR71 showed consistent calcium increases when stimulated with acetophenone, but only 33% showed such a response to benzaldehyde. Grosmaitre et al. (2006) found that response thresholds to lyral in MOR23 mouse OSNs varied over three log units of odor concentration. Bhandawat et al. (2007) found an intraclass correlation of only 0.65 in the responses of adult Drosophila OSN types and also described heterogeneity in the response profile of OSNs projecting to the same glomerulus. Finally, in a clear parallel to our findings, Qiu et al. (2006) reported that Anopheles gambiae TE1A OSNs responded >80% of the time to 4-ethylphenol but <20% of the time to pentatonic acid. Overall, we consider that these studies support our findings and are given coherence by our interpretation that some OSNs, when presented with some odors, can show stochastic or fuzzy responses.
The mechanism underlying fuzzy coding is unknown. We speculate that it may reflect less effective receptor-ligand binding at the “edge” of the molecular receptive range of a receptor, or that lateral peripheral interactions between OSNs may shape the response. We found no evidence for such peripheral interactions in [Or42a-Gal4/UAS-Or83b; Or83b −/−] larvae (stimulation with an odor led to no significant change in the activity of the nonresponsive Or83b −/− OSNs), but this may merely indicate that such peripheral interactions require the presence of a functioning receptor in the OSN membrane. In this case, it is possible that fuzzy coding in wild-type 21-OSN larvae reflects the existence of lateral interactions between OSNs, whereas fuzzy coding in single OSN larvae would be attributable to the lack of such interactions because the nonfunctional OSNs present a constant signal. Further electrophysiological, genetic, and pharmacological investigations will be required to test this possibility.
The function of fuzzy coding is also unclear, although our behavioral data suggest it may form part of the peripheral code in this organism. Recent studies of central processing have suggested that the introduction of noise via lateral inhibition and excitation may be involved in gain control of faint signals (Bhandawat et al., 2007; Shang et al., 2007; Olsen and Wilson, 2008). The existence of noise in a subset of OSNs that respond to a particular odor may increase this effect. In organisms in which there is more than one OSN for each Or (that is, for the vast majority of organisms but not the Drosophila larva), the consequence of fuzzy coding would presumably be an intermediate level of excitation in the appropriate glomerulus, as only a proportion of the OSNs would respond to a given presentation of an odor. In this way, fuzzy coding may represent a means by which greater signal variability is introduced into central processing by peripheral events. This is reinforced by the growing appreciation that variability (noise) may be an essential component of neuronal function, in particular for synchronizing the activity of groups of neurons (Ermentrout et al., 2008) and by data from models of the activity of sensory neuronal networks, which suggest that fuzzy coding may be involved in processing incomplete or variable data (Muller et al., 1998; Buhusi, 2000).
The specificities of larval olfaction
Our data show both similarities and differences with three previously published larval Or response profiles (Fishilevich et al., 2005; Kreher et al., 2005, 2008), although differences in approach make comparisons difficult (whole organism or in vivo expression system, method of odor delivery, duration of odor delivery, active behavior vs passive recipient). Our data suggest that larval OSNs show relatively sparse, selective responses to the alcohols and esters studied here. Only one Or (Or42a) responded to more than two odors, and its responses to two of these odors were fuzzy. The OSNs studied here (one-third of the total larval Or complement) show relatively fine tuning, with only Or42a showing responses to two odors with the same functional group but differing by only one carbon in their molecular composition. The firing rates described here are much lower than those recorded by Kreher et al. (2005, 2008) in an in situ expression system; many of the mean responses they reported as induced by larval Ors in adult OSNs were >100 spikes/s, whereas the maximum response frequency seen in our data from 296 OSNs (Figs. 3, 9) was ∼50 spikes/s, which is comparable with the data reported by Bhandawat et al. (2007) from the adult. This may reflect differences in stimulus intensity, or it may be a function of the specific activity dynamics of the adult ab3A neuron, which is used to express Ors in the empty neuron method.
We chose a more restricted odor panel than those used by either Kreher et al. (2005, 2008) or Fishilevich (2005), preferring to measure OSN response reliability. Two comparisons of OSN responses between the three studies are particularly interesting. Kreher et al. (2005) report that Or42a responded to six of the ten odors we tested, although Fishilevich et al. (2005) found that larvae with a single, Or42a OSN responded behaviorally to three of those we tested. We found significant responses for Or42a to only four of our ten odors and observed qualitative interneuronal variation (fuzzy coding) in response to two of these (pentyl acetate and butanol) (Fig. 5). These differences may arise from the fact that our laboratories use different background strains of Drosophila, or from differences in methodology (this is particularly the case in comparing electrophysiology and behavioral responses), or both, and underline the difficulty in coming to a single, reliable description of the functional role of a given Or. Kreher et al. (2008) found no evidence for inhibition or excitation in adult empty neurons expressing the larval-specific gene Or49a; Fishilevich et al. (2005) found that larvae with a single Or49a OSN showed no behavioral responses to odor stimulation (this was also the case for their Or1a larvae). In our preparation, however, both these OSNs (Or49a and Or1a) showed responses only to butanol. In particular, Or49a OSNs displayed reliable levels of inhibition in response to butanol.
The analyses presented here represent an initial approach to peripheral coding (the data we have collected contain more than spike frequency). We have not examined the temporal structure of the responses, in terms of latency, changes in firing rate, or inactivation dynamics, all of which may play a role in olfactory coding. Further insight into the biophysics of precise and fuzzy coding may be provided by whole-cell patch-clamp studies of labeled larval OSNs; we are currently pursuing this line of enquiry. It is possible that peripheral interactions exist between OSNs, although when we looked for such effects, we found none. Finally, we recognize that in its normal state, the Drosophila larva is surrounded by food and is continuously bathed in olfactory stimuli; this may lead to a semipermanent adaptation state in the olfactory network, with consequences for neuronal activity and response profile (Cobb, 1999). However, despite the problems of comparing odor concentrations and delivery durations between electrophysiological and behavioral studies, we have been able to show that fuzzy coding from a single OSN can provide larvae with sufficient information to make a rapid behavioral response. Using 2-functional OSN larvae, we have also been able to gain an initial glimpse of the combinatorial peripheral code: significantly attractive behavioral responses were induced by combination of a fuzzy response in one OSN and consistent nonresponses in the other.
Conclusions
In Drosophila larvae the combinatorial code involves not only lock and key-style precise coding but also patterns of stochastic, fuzzy activity. Previous data showing heterogeneous responses in mouse OSNs (Bozzo et al., 2002; Grosmaitre et al., 2006), in Drosophila (Bhandawat et al., 2007) and in Anopheles gambiae mosquitoes (Qiu et al., 2006), can be explained by our findings, suggesting that this may be a general feature of the peripheral olfactory code. In organisms in which a particular OSN class consists of more than one cell, we speculate that fuzzy coding would lead to only a subset of that class responding to a given odor; as a result the glomerulus to which they projected might show lower levels of excitation than in response to precise coding. In Drosophila adults, the antennal lobe carries out nonlinear transformation of OSN inputs, amplifying weak but not strong signals (Bhandawat et al., 2007), introducing noise by excitatory lateral neurons (Shang et al., 2007), carrying out gain control by lateral presynaptic inhibition (Olsen and Wilson, 2008), and detecting synchrony in patterns of projection neuron output (Wilson et al., 2004; Wilson and Mainen, 2006). These processes may be necessary at least partly because there is variability in the responses of classes of OSN; in the larva, in which the olfactory system is reduced to a single pair of each type of OSN, it is more difficult to see how animal copes with the unreliability of aspects of the peripheral signal. More extensive research on a wider range of organisms will be necessary to subject this radical hypothesis to rigorous testing.
Footnotes
This work was supported by the Biotechnology and Biological Sciences Research Council (D.J.H.) and by the Royal Society (C.R.M., M.C.). Members of the Cobb lab, in particular Matthew Kaiser, are thanked for their comments and suggestions. Two anonymous referees are thanked for their comments which substantially strengthened this manuscript. Dr. Fernando Martin provided invaluable genetic assistance in the early stages of this work.
References
- Ashworth AJ, Banks JR, Brierley MJ, Balment RJ, McCrohan CR. Electrical activity of caudal neurosecretory neurons in seawater and freshwater-adapted Platichthys flesus, in vivo. J Exp Biol. 2005;208:267–275. doi: 10.1242/jeb.01372. [DOI] [PubMed] [Google Scholar]
- Bhandawat V, Olsen SR, Gouwens NW, Schlief ML, Wilson RI. Sensory processing in the Drosophila antennal lobe increases reliability and separability of ensemble odor presentations. Nat Neurosci. 2007;10:1474–1482. doi: 10.1038/nn1976. [DOI] [PMC free article] [PubMed] [Google Scholar]
- Bozza T, Feinstein P, Zheng C, Mombaerts P. Odorant receptor expression defines functional units in the mouse olfactory system. J Neurosci. 2002;22:3033–3043. doi: 10.1523/JNEUROSCI.22-08-03033.2002. [DOI] [PMC free article] [PubMed] [Google Scholar]
- Brierley MJ, Ashworth AJ, Craven TP, Woodburn M, Banks JR, Lu W, Riccardi D, Balment RJ, McCrohan CR. Electrical activity of caudal neurosecretory neurons in seawater- and freshwater-adapted flounder: responses to cholinergic agonists. J Exp Biol. 2003;206:4011–4020. doi: 10.1242/jeb.00631. [DOI] [PubMed] [Google Scholar]
- Buhusi CV. The across-fiber pattern theory and fuzzy logic: A matter of taste. Physiol Behav. 2000;69:97–106. doi: 10.1016/s0031-9384(00)00192-x. [DOI] [PubMed] [Google Scholar]
- Cobb M. What and how do maggots smell? Biol Rev. 1999;74:425–459. [Google Scholar]
- de Bruyne M, Clyne PJ, Carlson JR. Odor coding in a model olfactory organ: the Drosophila maxillary palp. J Neurosci. 1999;19:4520–4532. doi: 10.1523/JNEUROSCI.19-11-04520.1999. [DOI] [PMC free article] [PubMed] [Google Scholar]
- Dobritsa AA, van der Goes van Naters W, Warr CG, Steinbrecht RA, Carlson JR. Integrating the molecular and cellular basis of odor coding in the Drosophila antenna. Neuron. 2003;37:827–841. doi: 10.1016/s0896-6273(03)00094-1. [DOI] [PubMed] [Google Scholar]
- Ermentrout GB, Galán RF, Urban NN. Reliability, synchront and noise. Trends Neurosci. 2008;31:428–434. doi: 10.1016/j.tins.2008.06.002. [DOI] [PMC free article] [PubMed] [Google Scholar]
- Fishilevich E, Domingos AI, Asahina K, Naef F, Vosshall LB, Louis M. Chemotaxis behavior mediated by single larval olfactory neurons in Drosophila . Curr Biol. 2005;15:2086–2096. doi: 10.1016/j.cub.2005.11.016. [DOI] [PubMed] [Google Scholar]
- Grosmaitre X, Vassalli A, Mombaerts P, Shepherd GM, Ma M. Odorant responses of olfactory sensory neurons expressing the odorant receptor MOR23: A patch clamp analysis in gene-targeted mice. Proc Natl Acad Sci U S A. 2006;103:1970–1975. doi: 10.1073/pnas.0508491103. [DOI] [PMC free article] [PubMed] [Google Scholar]
- Hallem EA, Carlson JR. Coding of odors by a receptor repertoire. Cell. 2006;125:143–160. doi: 10.1016/j.cell.2006.01.050. [DOI] [PubMed] [Google Scholar]
- Hallem EA, Ho MG, Carlson JR. The molecular basis of odor coding in the Drosophila antenna. Cell. 2004;117:965–979. doi: 10.1016/j.cell.2004.05.012. [DOI] [PubMed] [Google Scholar]
- Jan LY, Jan YN. Properties of the larval neuromuscular junction in Drosophila melanogaster . J Physiol. 1976;262:189–214. doi: 10.1113/jphysiol.1976.sp011592. [DOI] [PMC free article] [PubMed] [Google Scholar]
- Kreher SA, Kwon JY, Carlson JR. The molecular basis of odor coding in the Drosophila larva. Neuron. 2005;46:445–456. doi: 10.1016/j.neuron.2005.04.007. [DOI] [PubMed] [Google Scholar]
- Kreher SA, Mathew D, Kim J, Carlson JR. Translation of sensory input into behavioral output via an olfactory system. Neuron. 2008;59:110–124. doi: 10.1016/j.neuron.2008.06.010. [DOI] [PMC free article] [PubMed] [Google Scholar]
- Louis M, Huber T, Benton R, Sakmar TP, Vosshall LB. Bilateral olfactory sensory input enhances chemotaxis behavior. Nat Neurosci. 2008;11:187–199. doi: 10.1038/nn2031. [DOI] [PubMed] [Google Scholar]
- Lu T, Qiu YT, Wang G, Kwon JY, Rutzler M, Kwon HW, Pitts RJ, van Loon JJ, Takken W, Carlson JR, Zwiebel LJ. Odor coding in the maxillary palp of the malaria vector mosquito Anopheles gambiae . Curr Biol. 2007;17:1533–1544. doi: 10.1016/j.cub.2007.07.062. [DOI] [PMC free article] [PubMed] [Google Scholar]
- Madrid R, Sanhueza M, Alvarez O, Bacigalupo J. Tonic and phasic receptor neurons in the vertebrate olfactory epithelium. Biophys J. 2003;84:4167–4181. doi: 10.1016/S0006-3495(03)75141-8. [DOI] [PMC free article] [PubMed] [Google Scholar]
- Malnic B, Hirono J, Sato T, Buck LB. Combinatorial receptor codes for odors. Cell. 1999;96:713–723. doi: 10.1016/s0092-8674(00)80581-4. [DOI] [PubMed] [Google Scholar]
- Muller S, Garda P, Muller J-D, Crusem R, Cansi Y. A neuro-fuzzy coding for processing incomplete data: application to the classification of seismic events. Neural Process Lett. 1998;8:83–91. [Google Scholar]
- Oka Y, Omura M, Kataoka H, Touhara K. Olfactory receptor anatagonism between odorants. EMBO J. 2004;23:120–126. doi: 10.1038/sj.emboj.7600032. [DOI] [PMC free article] [PubMed] [Google Scholar]
- Olsen SR, Wilson RI. Lateral presynaptic inhibition mediates gain control in an olfactory circuit. Nature. 2008;452:956–960. doi: 10.1038/nature06864. [DOI] [PMC free article] [PubMed] [Google Scholar]
- Oppliger FY, M Guerin P, Vlimant M. Neurophysiological and behavioural evidence for an olfactory function for the dorsal organ and a gustatory one for the terminal organ in Drosophila melanogaster larvae. J Insect Physiol. 2000;46:135–144. doi: 10.1016/s0022-1910(99)00109-2. [DOI] [PubMed] [Google Scholar]
- Pelz D, Roeske T, Syed Z, de Bruyne M, Galizia CG. The molecular receptive range of an olfactory receptor in vivo (Drosophila melanogaster Or22a) J Neurobiol. 2006;66:1544–1563. doi: 10.1002/neu.20333. [DOI] [PubMed] [Google Scholar]
- Qiu YT, van Loon JJ, Takken W, Meijerink J, Smid HM. Olfactory coding in antennal neurons of the malaria mosquito Anopheles gambiae . Chem Senses. 2006;31:845–863. doi: 10.1093/chemse/bjl027. [DOI] [PubMed] [Google Scholar]
- Ramaekers A, Magnenat E, Marin EC, Gendre N, Jefferis GS, Luo L, Stocker RF. Glomerular maps without cellular redundancy at successive levels of the Drosophila larval olfactory circuit. Curr Biol. 2005;15:982–992. doi: 10.1016/j.cub.2005.04.032. [DOI] [PubMed] [Google Scholar]
- Robertson HM, Warr CG, Carlson JR. Molecular evolution of the insect chemoreceptor gene superfamily in Drosophila . Proc Natl Acad Sci U S A. 2003;100:14537–14542. doi: 10.1073/pnas.2335847100. [DOI] [PMC free article] [PubMed] [Google Scholar]
- Shang Y, Claridge-Chang A, Sjulson L, Pypaert M, Miesenböck G. Excitatory local circuits and their implications for olfactory processing in the fly antennal lobe. Cell. 2007;128:601–612. doi: 10.1016/j.cell.2006.12.034. [DOI] [PMC free article] [PubMed] [Google Scholar]
- Vosshall LB, Stocker RF. Molecular architecture of smell and taste in Drosophila . Annu Rev Neurosci. 2007;30:505–533. doi: 10.1146/annurev.neuro.30.051606.094306. [DOI] [PubMed] [Google Scholar]
- Ward JH., Jr Hierarchical grouping to optimize an objective function. J Am Stat Assoc. 1963;58:236–244. [Google Scholar]
- Wilson RI, Mainen ZF. Early events in olfactory processing. Annu Rev Neurosci. 2006;29:163–201. doi: 10.1146/annurev.neuro.29.051605.112950. [DOI] [PubMed] [Google Scholar]
- Wilson RI, Turner GC, Laurent G. Transformation of olfactory representations in the Drosophila antennal lobe. Science. 2004;303:366–370. doi: 10.1126/science.1090782. [DOI] [PubMed] [Google Scholar]