

Abstract
Many motion-sensitive tangential cells of the lobula plate in blowflies are well described with respect to their visual response properties and the connectivity among them. In addition to extensive connections between tangential cells within the lobula plate of one brain hemisphere, there exist many connections between the two hemispheres. Most of these connections have been found for neurons sensitive to horizontal motion. For neurons sensitive to vertical motion, however, only the connection of vertical sensitive cells (VS cells) and a cell (V1 cell) projecting to the other hemisphere has been demonstrated thus far. The ability to identify the presynaptic and postsynaptic cells as well as the good accessibility has made this specific synapse a model for graded transmission of synapses. However, the exact type of synapse, electrical or chemical, is not known. Investigating the connectivity between VS cells 1–3 and the V1 cell by means of dual recordings, we find that the VS cells are coupled via electrical synapses to the V1 cell. The results were confirmed by visualizing dye coupling between VS cells and V1.
Keywords: motion detection, insect, vision, descending, gap junction, flow field
Introduction
For visual course control, flies rely on the so-called lobula plate tangential cells, a set of ∼60 large neurons per brain hemisphere that can be individually identified by their invariant anatomy and characteristic visual response properties (Hausen 1977, 1981, 1982, 1984; Hengstenberg, 1982; Hengstenberg et al., 1982; Eckert and Dvorak, 1983; Borst and Haag, 1996, 2002; Haag and Borst, 1998, 2001, 2002, 2003, 2004; Egelhaaf et al., 2002; Egelhaaf, 2008). Lobula plate tangential cells are located in the posterior part of the third visual neuropile of the fly called the lobula plate. With their large dendrites they spatially pool the signals of thousands of local retinotopically arranged columnar elements. In addition to this immediate, dendritic input, tangential cells form an extensive network among themselves (Haag and Borst, 2002, 2003, 2004, 2005, 2007; Farrow et al., 2003, 2005, 2006). As a result of this, the receptive fields of the tangential cells are huge and can have different preferred directions in different parts of the receptive field (Krapp and Hengstenberg, 1996; Krapp et al., 1998, 2001).
However, lobula plate tangential cells not only are connected to each other within the lobula plate of each hemisphere: there exist many connections between the two hemispheres, and many neurons are known to connect from one lobula plate to the other (Borst and Haag, 2007). For neurons sensitive to vertical motion, however, only the connection of vertical sensitive cells (VS cells) with a frontal receptive field (VS1–VS3) and the spiking V1 cell has been demonstrated thus far (Kurtz et al., 2001). V1 has been found to be postsynaptic to these VS cells and projects to the contralateral lobula plate where it is presynaptic to the ventral centrifugal horizontal (vCH) cell (Krapp et al., 2001; Haag and Borst, 2003). Whereas V1 transmits visual motion information by action potentials (Hausen, 1984), VS cells respond to visual motion by graded depolarizations or hyperpolarizations superimposed with action potentials of variable amplitudes (Hengstenberg, 1977, 1982).
The ability to identify the presynaptic and postsynaptic cells as well as the good accessibility has made this specific synapse a model for graded transmission of chemical synapses (Kurtz et al., 2001; Warzecha et al., 2003; Beckers et al., 2007). However, the exact type of synapse, electrical or chemical, is not known. All the results thus far have shown that this synapse is fast, linear, does not adapt, and is very reliable. All of these results can be easily explained by the existence of electrical synapses between VS cells 1–3 and V1. A recent study where single VS cells were ablated by laser illumination suggested an electrical synapse between VS1 and V1, whereas the other VS cells were concluded to be chemically coupled to V1 (Kalb et al., 2006).
In this study, we investigate the connectivity between VS cells 1–3 and the V1 cell by means of dual-electrode recordings. We demonstrate that these VS cells and V1 are solely coupled via electrical synapses without an indication for chemical synapses. This result was corroborated by visualizing dye coupling between VS cells and V1.
Materials and Methods
Preparation and setup.
Female blowflies (Calliphora vicina) were briefly anesthetized with CO2 and mounted ventral side up with wax on a small preparation platform. The head capsule was opened from behind; the trachea and airsacs which normally cover the lobula plate were removed. To eliminate movements of the brain caused by peristaltic contractions of the esophagus, the proboscis of the animal was cut away and the gut was pulled out. This allowed stable intracellular recordings of up to 45 min. The fly was then mounted on a heavy recording table looking down onto the stimulus monitors. The fly brain was viewed from behind through a fluorescence microscope (Axiotech Vario 100 HD; Zeiss).
Stimulation.
Stimuli were generated on Tektronix 608 monitors by an image synthesizer (Picasso, Innisfree) and consisted of a one-dimensional grating of 16.7° spatial wavelength and 87% contrast displayed at a frame rate of 200 Hz. The mean luminosity of the screen was 11.2 cd/m2. The intensity of the pattern was square-wave modulated along its horizontal axis. The stimulus field extended from 10 to 42° for the left eye and from 16 to 48° for the right eye in the horizontal direction and from −30 to +30° in the vertical direction of the fly.
Electrical recording.
For intracellular recordings of the cells, electrodes were pulled on a Brown-Flaming micropipette puller (P-97) using thin-wall glass capillaries with an outer diameter of 1 mm (Clark; GC100TF-10). The tip of the electrode was filled with 8 mm Alexa 488 (Invitrogen). The shaft of the electrode was filled with a 2 m KAc/0.5 m KCl solution. They had resistances of ∼15 MΩ. For dual intracellular recordings of two cells in the same brain hemisphere, one electrode was filled with the green fluorescent dye Alexa 488, the other electrode filled with the red fluorescent dye Alexa 568 (Invitrogen). For Neurobiotin staining, the tip of the electrode was filled with a mixture of 3% Neurobiotin (Vector Laboratories) and 3% fluorescein (Sigma). An SEL10 amplifier (npi-electronics) operated in the bridge mode was used throughout the experiments. In the experiments with dual intracellular recordings, we used an additional SEL10 amplifier. When we accompanied the intracellular recording with a simultaneous extracellular recording from a spiking neuron, we used standard tungsten electrodes with a resistance of ∼1 MΩ. Extracellular signals were amplified, bandpass filtered, and subsequently processed by a threshold device delivering a 100 mV pulse of 1 ms duration on each spike detected. For data analysis, the output signal of the amplifiers (SEL10 and SEL10/threshold device) was fed to a PIII personal computer via a 12 bit A/D converter (DAS-1602/12; Computerboards) at a sampling rate of 5 kHz and stored to hard disc. The signals were evaluated off-line by a program written in Delphi (Borland).
Histology.
After filling a cell with the mixture of Neurobiotin and fluorescein, the neuron was identified under the fluorescence microscope (MZFLIII; Leica). The fly was then kept at +4°C for 15–30 min to allow for diffusion of Neurobiotin to coupled cells. The brain was taken out of the body and fixed overnight at 4°C in 4% paraformaldehyde and 0.2% glutaraldehyde mixture in 0.15 m phosphate buffer. After several rinses with PBS with 1% Triton, the brain was incubated with streptavidin-conjugated Alexa 568 conjugate (Invitrogen) overnight. The brain was then washed again in PBS buffer and embedded in mixture of distyrene, tricresyl phosphate, and xylene.
Microscopy.
For registering the anatomy of VS and V1 cells, we used a custom-built two-photon microscope (Denk et al., 1990; Haag et al., 2004; Borst et al., 2005) consisting of the following components: a 5W-pumped Ti:Sapphire laser (MaiTai; Spectra Physics), a pockels cell (Conoptics), scan mirrors including drivers (Cambridge Technology), a scan lens (4401-302; Rodenstock), a tube lens (MXA 22018; Nikon), a dichroic mirror (DCSPR 25.5 × 36; AHF Tuebingen), and a 40× water-immersion lens (Zeiss). The lens can move along all three axes by a step motor driven micromanipulator (MP285-3Z; Sutter Instrument Company). Emitted light is filtered in parallel by two bandpass filters (HQ 535/50M and HQ HQ610/75M; Chroma Technology) and collected by multialkali photomultipliers (R6357; Hamamatsu). The whole system is controlled by custom-written software (CfNT V1.569; Michael Mueller, Max Planck Institute for Medical Research, Heidelberg, Germany). The anatomy of the VS and V1 cells (see Figs. 1, 4, 5) was recorded with an x–y–z resolution of 0.4 × 0.4 × 2 μm3 and consisted of 11 z-stacks shifted in the x and y directions. Three-dimensional reconstruction of the cells was performed with the software package AMIRA V4.1 (Mercury Computer Systems).
Figure 1.

Intracellular recording from V1. a, Reconstruction of the cell and recording sites. Scale bar, 200 μm. b, Example response of V1 to vertical motion recorded in the dendrite. The cell responds to downward motion (l-PD) with an increase, to upward motion (l-ND) in front of the left eye with a decrease in spike frequency. In addition, a graded shift in membrane potential can be measured. The inset shows an averaged action potential. Calibration: 5 mV, 0.5 ms. c, Responses of V1 to vertical motion measured in the axon terminal. In contrast to the dendritic recording, no graded membrane potential change can be observed. The inset shows an averaged action potential. Calibration: 5 mV, 0.5 ms. Data in b and c are from two different flies.
Figure 4.
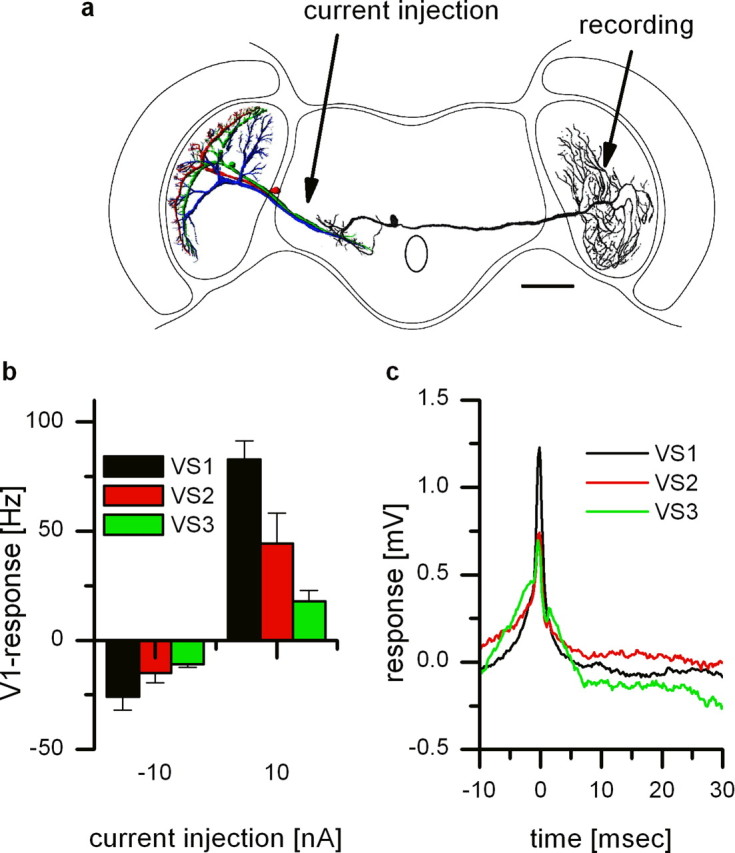
Extracellular recording from V1 and intracellular recording of different VS cells. a, Reconstruction of the cells and recording sites. Intracellular recordings were done from VS cells of the left brain hemisphere, whereas V1 was recorded in the right brain hemisphere. Note that the reconstructions of the VS cells and the V1 cell are from different flies. Scale bar, 200 μm. b, Current injection of −10 nA and +10 nA in different VS cells elicited different levels of spike frequency in V1. V1 responded with a decrease and increase when current was injected into VS1–VS3. The strongest response was found for current injection into VS1. Data represent the mean ± SEM of VS1 (n = 7), VS2 (n = 5), VS3 (n = 3). c, Spike-triggered average of the membrane potential of VS1–VS3. Extracellularly recorded spikes in V1 served as a trigger for averaging the membrane potential of the VS cells. As expected from the current injection experiments, VS1 (black line) showed the strongest peak and VS3 (green line) the weakest peak. The delay between V1 spikes and EPSPs in VS cells turned out to be 0.2 ms (SD ± 0.2 ms) for all VS cells. Note that the average waveform for all three VS cells looks quite similar.
Figure 5.
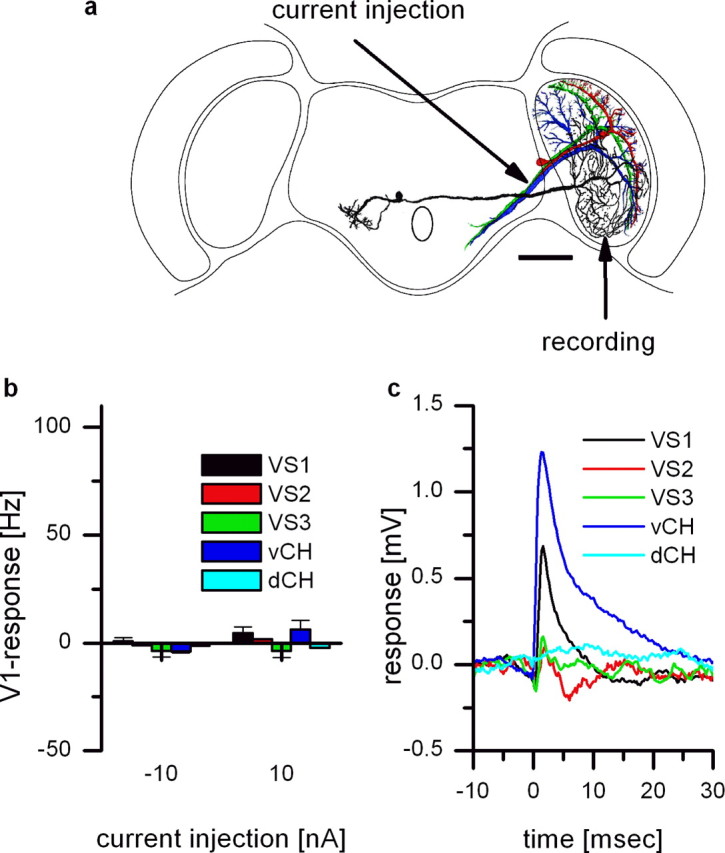
Extracellular recording from V1 and intracellular recording of different VS cells. a, Reconstruction of the cell and recording sites. Intracellular recordings of different tangential cells and extracellular recording of V1 were both done in the right brain hemisphere. Scale bar, 200 μm. b, Current injection of −10 nA and +10 nA in different tangential cells did not change spike frequency in V1. Data represent the mean ± SEM of VS1 (n = 6), VS2 (n = 1), VS3 (n = 3), dCH (n = 1), and vCH (n = 2). c, Spike-triggered average of the membrane potential of different tangential cells. Extracellularly recorded spikes in V1 served as a trigger for averaging the membrane potential of the VS and CH cells. Spikes occurring in V1 elicited discrete EPSPs in vCH and VS1. This shows that V1 is not only presynaptic to vCH but in addition to VS1.
Serial optical sections of the Neurobiotin-labeled cells were taken at 2 μm intervals with 0.5 μm x–y resolution using a confocal microscope (Leica; TCSNT) and oil-immersion 20× Plan-Apochromat objective. The individual confocal stacks were mounted and analyzed in AMIRA 4.1 (Mercury Computer Systems) software.
Results
In a first set of experiments, we recorded intracellularly from V1 and measured the response to up and downward motion (Fig. 1a). Figure 1b shows the result of a dendritic recording. In the absence of visual stimulation, V1 exhibited a spontaneous firing frequency of ∼20 spikes/s. The dendritic signal consists of graded shift of the membrane potential superimposed by action potentials of ∼30 mV amplitude. Motion in preferred direction of the cell leads to a depolarization of ∼4 mV and an increase in spike frequency, motion in null direction to a hyperpolarization and decrease in spike frequency. The graded potential shifts cannot be seen in the axonal recording of the membrane potential (Fig. 1c). Here, only the increase and decrease of the spike frequency in response to motion in the preferred and null direction, respectively, can be observed. The occurrence of the graded depolarization and hyperpolarization in the dendrite might indicate an electrical connection to presynaptic VS cells.
To investigate the type of synaptic contact, chemical or electrical, we performed double recordings of the VS1 and the V1 cell. Therefore, one electrode was placed in the axon terminal of a VS1 cell, and a V1 was recorded in the axon near the dendrite. Figure 2 shows the results of such a double recording. Both cells respond to up and downward motion in a similar manner (Fig. 2a). As already shown in Figure 1a, V1 responds with a depolarization and an increase in spike frequency to a pattern moving in the preferred direction. If the pattern moves in the null direction, both VS1 and V1 become hyperpolarized. In addition, during null direction motion, the membrane potential fluctuations of both cells look quite similar. We quantified the similarity by calculating the cross-correlation function (Kimpo et al., 2003) between the signals from both cells (Fig. 2b) (cross-correlation calculated for 0.82 s of responses during null direction, two trials). We found a strong positive correlation (peak value, 0.5) between the two signals which peaks at 0.6 ms time lag (SD ± 0.16 ms), where the signal of VS1 leads the signal of V1. The peak is almost symmetrical and has a half-width of 13.8 ms. Although the sampling rate of 5 kHz is at the lower end to precisely determine the delay time between the simultaneously recorded signals, the small SDs over several repetitions indicate a highly significant time shift between the signals.
Figure 2.

Double intracellular recording from VS1 and V1. a, Time course of the response to motion stimuli of V1 (black) and a simultaneously recorded VS1 (red). Both cells respond to up (r-ND) and downward (r-PD) motion in front of the right eye in a similar manner: they respond with a depolarization to a pattern moving in the preferred direction and a hyperpolarization to a pattern moving in the null direction. In addition, in V1, full-blown action potentials can be recorded. b, Normalized cross correlogram (see Materials and Methods) of the signals shown in a. The cross correlograms were calculated for 0.8 s of the responses of the cells to null direction motion (time interval, 5.1–5.9 s; a). The peak of the cross correlogram occurs at 0.6 ms time lag (SD ± 0.16 ms) between the signal of VS1 and V1. CC, Cross correlation.
To investigate the connectivity between VS1 and V1, we injected current into one cell and recorded the potential response in the other. As an example, the black bars in Figure 3a show the change in membrane potential of V1 in response to current injection into the VS1 cell. Negative current injection led to a hyperpolarization, positive current to a depolarization of V1. Thus, current of both polarities is transmitted from VS1 onto V1. The gray bars demonstrate that the connection works both ways: when the current was injected into V1, VS1 became depolarized or hyperpolarized, respectively, depending on the sign of current injection (Fig. 3a). This bidirectional and bipolar coupling of the two cells speaks in favor of electrical synapses between them (Haag and Borst, 2004). The current injection did not only alter the membrane potential of V1, but, in addition, changed the frequency of action potentials elicited in V1. Thereby, the amplitude of the frequency change depended on whether the depolarizing current was injected into VS1 or V1. Whereas direct current injection into V1 increased the spike frequency up to 550 Hz, current injection of +10 nA into VS1 increased the spike frequency of V1 only to ∼130 Hz (Fig. 3b).
Figure 3.

Current injection into VS1 and V1. a, Current injection of −10 nA and +10 nA in V1 led to a hyper and depolarization of VS1 (gray bars), respectively. Current injection into VS1 elicited a hyper and depolarization in V1 (black bars). This bidirectional and bipolar coupling speaks in favor of electrical synapses. Data represent the mean ± SEM of three sweeps. b, Current injection altered the spike frequency of V1. Direct current injection of +10 nA into V1 resulted in a maximum firing frequency of 550 Hz. Depolarizing current injection in VS1 changed the firing frequency of V1 to a lesser extent. c, Spike-triggered average of the VS1 membrane potential. The black line shows the average spike in V1 which served as a trigger for averaging the membrane potential of VS1 (gray line). The peak of the VS1 cell signal is delayed by 0.2 ms (SD ± 0.16 ms) compared with the peak of the V1 cell signal.
A consequence of the electrical synapses between VS1 and V1 can be seen in Figure 3c. Here, the action potentials in V1 (black line) were used as a trigger to average the corresponding VS1 membrane potential (gray line). A spike in V1 is followed by a fast potential deflection in VS1. The deflection in the VS1 membrane potential is delayed by 0.2 ms (SD ± 0.16 ms) and reached an amplitude of 0.9 mV. This signal reflects the passive spread of the action potential elicited in V1 propagating back through the gap junction into VS1.
Because double intracellular recordings are difficult to achieve, we recorded the activity of V1 extracellularly while recording VS cells intracellularly. The results of these recordings are shown in Figure 4. Figure 4a shows a schematic representation of the recording arrangement. VS cells were recorded in the left brain hemisphere, and V1 was recorded in the terminal region in the right brain hemisphere. Current injection into different VS cells had different effects on the spike frequency of V1: while depolarizing current injection into VS1 resulted in the strongest increase in firing frequency, current injection into VS2 and VS3 had only a moderate but significant effect on V1 spike frequency (Fig. 4b). Current injection into VS5 or VS7 did not change the firing frequency (data not shown). The spike frequency was not only altered by depolarizing current injection but also hyperpolarizing current injection into VS1, VS2, and VS3 altered the spike frequency of V1. Note, the asymmetry in the response of V1 to negative and positive current injection is attributable to the smaller dynamic range of spiking neurons to hyperpolarization. A consequence of the coupling can also be seen in the spike-triggered average shown in Figure 4c. Here, we used the spontaneous occurring spikes in V1 to average the corresponding membrane potential in VS cells. As already seen in the intracellular recordings, the spike-triggered average of the VS1 signal revealed the shape of a passively reflected V1 spike. This is also true for the average of the membrane potential of VS2 and VS3. The signals obtained for these cells are smaller than the VS1 signal, possibly reflecting a weaker coupling to V1. These results indicate that VS1, VS2, and VS3 are electrically coupled to V1. However, the strength of the coupling is different for the three VS cells, with VS1 being coupled the strongest.
In a next set of experiments, we investigated whether current injections into various tangential cells of the right brain hemisphere influence the firing frequency of V1 that has its axon terminal also in the right hemisphere. As in Figure 4, the recording arrangement is shown in Figure 5a. We injected current in the axon of tangential cells while we recorded with an extracellular electrode from the V1 axonal region in the right brain hemisphere. The results of the current injections are shown in Figure 5b. Current injection into VS cells (VS1, VS2, VS3) and in CH cells [dorsal centrifugal horizontal (dCH), vCH] did not change the firing frequency of V1. However, the spike-triggered average revealed discrete EPSPs in vCH and VS1 cells (Fig. 5c). Although the coupling between V1 and vCH has already been demonstrated (Haag and Borst, 2003), the connectivity between V1 and VS1 has not been shown before. The fact that current injection into VS1 did not alter the spike frequency of V1 speaks in favor of chemical excitatory synapses from V1 onto VS1.
The consequence of this wiring scheme is shown in Figure 6. In this experiment, we performed a recording from the axon of a VS1 cell from the left brain hemisphere (black line) and a recording from the dendrite of a VS1 cell from the right brain hemisphere (red line) simultaneously (Fig. 6a). Both cells responded to downward motion of a grating presented in front of the left eye (Fig. 6b). Whereas the left VS1 responded with a graded potential change, the response of the right VS1 cells consisted of EPSPs only. These EPSPs are the result of the excitatory input from the contralateral V1 cell. To upward motion presented in front of the left eye, the left VS1 responded with a hyperpolarization. Because the response of the right VS1 to motion presented in the left monitor consisted of EPSPs only, the decrease in EPSP frequency in response to upward motion of the left monitor, together with the small amplitude of the EPSPs, does not lead to a detectable change in membrane potential of the right VS1.
Figure 6.
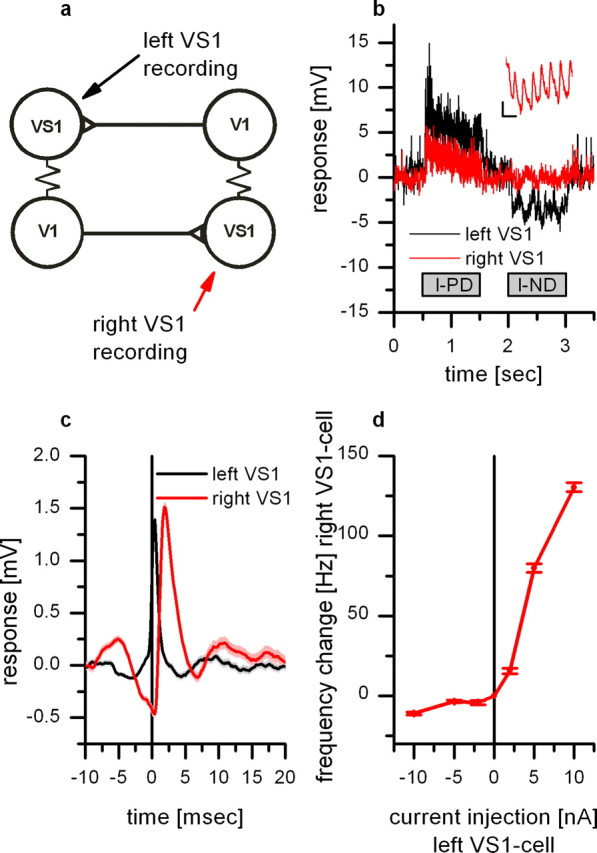
Double intracellular recording from a VS1 located in the right brain hemisphere and a VS1 from the left hemisphere. a, Schematic diagram illustrating the wiring scheme between VS1 cells and V1 cells. b, Time course of the response to motion stimuli of a VS1 located in the left brain hemisphere (black) and a simultaneously recorded VS1 from the right brain hemisphere (red). The motion stimulus was presented in front of the left eye. Although the left VS1 responds with a graded depolarization and hyperpolarization to preferred and null direction motion, respectively, the right VS1 did not respond to null direction motion. The response to preferred direction consisted mainly on EPSPs. The inset shows the response of the right VS1 cell during downward motion with a higher temporal resolution. Calibration: 1 mV, 10 ms. c, EPSP-triggered average of the right VS1 membrane potential. The black line shows the average EPSP in the left VS1 which served as a trigger for averaging the membrane potential of the right VS1 (red line). The EPSP found in the right VS1 reflects the spike input from the left V1. The signal in the right VS1 is delayed by 1.6 ms. Data show the mean ± SEM of 288 events recorded in five sweeps. d, Current injection in the left VS1 leads to an increase in EPSP frequency in the right VS1. Data show the mean ± SEM of five sweeps per stimulus condition.
The time course of the EPSPs can be seen in Figure 6c. Here, the spikelets recorded in the left VS1 (black line) served as a trigger for averaging the membrane potential of the right VS1 cell (red line). Each spikelet of the left VS1 (reflecting a spike in the left V1) is followed by an EPSP in the right VS1. The average amplitude of an EPSP was 1.5 mV, and the peaks of the two signals were delayed by 1.4 ms. Figure 6d shows that the frequency of the EPSPs recorded in the right VS1 cell can be altered by current injection into the left VS1 cell. Thereby, current injection of +10 nA leads to a frequency change of 130 Hz.
This circuit leads to the occurrence of EPSPs from two different sources within one VS1 cell: spikes of the ipsilateral V1 propagating back into VS1 lead to spikelets in VS1, and excitatory input from the contralateral V1 lead to discrete EPSPs. To demonstrate the occurrence of the two types of EPSPs directly, we used binocular visual stimuli to discriminate between the two. To ensure that the right VS1 cell becomes depolarized and therefore only the right V1 increases its spike frequency, we displayed a stimulus moving on the right monitor downward and on the left monitor upward. This stimulus leads to a depolarization of the right VS1 cell and a hyperpolarization of the left VS1 cell (Fig. 7a). When we calculated a triggered average of the membrane potential of the right VS1 cell using the EPSPs of the left VS1 cell as a trigger, the resulting EPSP reflects the occurrence of spikes in the right V1 cell (Fig. 7b). The EPSPs of the right VS1 cell are therefore leading the EPSPs measured in the left VS1 cell by ∼1 ms. In contrast, if a preferred direction stimulus is shown on the left monitor and a null direction stimulus on the right monitor, the left VS1 cell is depolarized, while the right V1 cell is hyperpolarized (Fig. 7c). In this case, the resulting EPSP in the right VS1 cell is following the EPSPs of the left VS1 cell by 1.8 ms (Fig. 7d). These experiments show that in VS1 cells, two different types of EPSPs can be recorded: an EPSP attributable to spikes from the ipsilateral V1 propagating back via gap junctions and EPSPs attributable to the presynaptic input from the contralateral V1 via excitatory chemical synapses.
Figure 7.
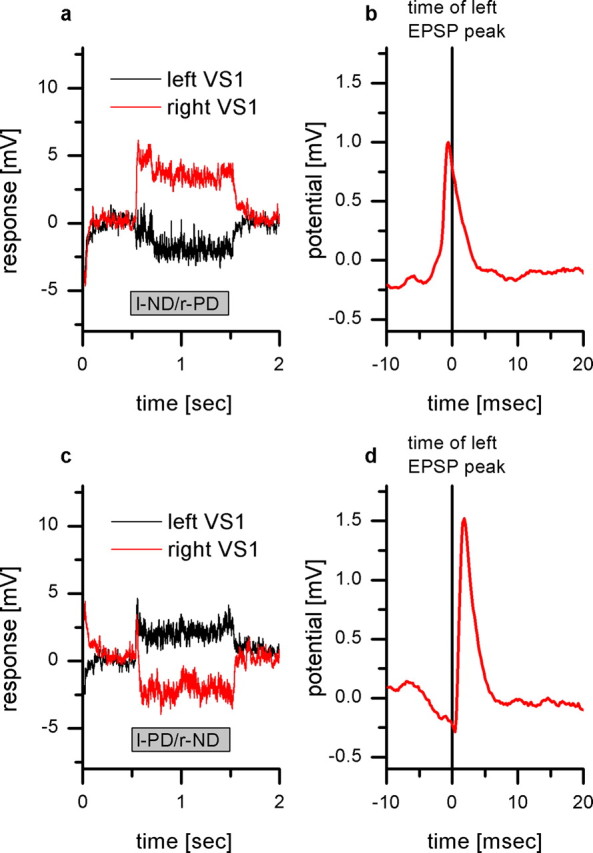
Responses of a right VS1 and a left VS1 to binocular motion stimuli. a, Response of the left VS1 (black line) and the right VS1 (red line) to preferred direction motion in front of the right eye and null direction motion in front of the left eye. This binocular stimulus leads to a hyperpolarization of the left VS1 and a depolarization of the right VS1. Data show the mean response averaged over five sweeps. b, EPSP-triggered average of the right VS1 membrane potential. As in Figure 6c, the detected EPSPs in the left VS1 were used as a trigger to average the membrane potential of the right VS1. The resulting peak occurs 0.6 ms before the peak of the right VS1 cells, representing the spikelet caused by the electrical coupling to the right V1 cell. Data show the mean of 305 events recorded in five sweeps. c, Response of the left VS1 (black line) and the right VS1 (red line) to preferred direction motion in front of the left eye and null direction motion in front of the right eye. This binocular stimulus leads to a depolarization of the left VS1 and a hyperpolarization of the right VS1. Data show the mean response averaged over five sweeps. d, EPSP-triggered average of the right VS1 membrane potential. Again, the detected EPSPs in the left VS1 were used as a trigger to average the membrane potential of the right VS1. The resulting peak occurs 1.8 ms after the peak of the right VS1 cells. The peak represents the input from the left V1 cell onto the right VS1. Data show the mean of 171 events recorded in five sweeps.
The double recording of VS cells and V1 shown above indicate electrical synapses between VS1–VS3 onto V1. To provide additional evidence for the proposed connectivity between VS cells and V1, we injected the fluorescein–Neurobiotin dyes into a VS1 cell (Fig. 8a). As was shown previously, Neurobiotin is a small enough molecule to pass through gap junctions in invertebrates and, thus, can be used to visualize gap junction coupled neurons via dye coupling (Basu and Kravitz, 2003; Fan et al., 2005; Haag and Borst, 2005; Joesch et al., 2008). The labeled cell was identified under the fluorescence microscope and a picture was taken. For the additional histological investigation, only those brains were taken in which only a single cell was visible under the fluorescence light. If the dye was injected either into a VS1 (Fig. 8a) or a VS2 (Fig. 8b), the V1 cell was costained. These results are in accordance with an electrical coupling of VS1–VS3 and V1. Because we did not find a labeling of the V1 cell having its axonal arborizations on the same side as the filled VS1 cell, the synaptic connections between the axon terminals of V1 and the dendrite of VS1 is most likely an excitatory chemical synapse.
Figure 8.

Dye coupling between VS1 and V1. a, Neurobiotin staining of a VS1. In addition to the costaining of adjacent VS cells, V1 was found to be labeled, too. This confirms the results about the electrical coupling between VS1 and the V1 (Fig. 2). The dye coupling between VS1 and V1 was found in a total of three different flies. b, Neurobiotin staining of a VS2 cell. If Neurobiotin was injected into VS2 or VS3, we found a costaining of V1, too. The images show x–y maximum intensity projections of the z-stacks. Scale bars, 200 mm.
Discussion
In this study, we investigated the connectivity between VS cells and the V1 cell. Our results presented above directly demonstrate that VS1 is electrically coupled to V1. This conclusion was derived from two kinds of experiments: current injection and Neurobiotin dye coupling. Dual intracellular recordings of VS1 and V1 showed that the synaptic connection between VS1 and V1 transmits current of both polarities and that the connection is bidirectional (Figs. 2, 3). Current injections into different VS cells showed that the strongest effect on the spiking frequency of V1 was obtained when the current was injected into VS1 (Fig. 4b). A smaller effect was obtained for current injection into VS2 and still a smaller one for VS3. Current injections into VS cells with a more lateral center of their receptive field yielded no effect on V1 spike frequency. A similar gradient in the coupling strength between VS1–VS3 and V1 can also be seen in the spike-triggered average of the VS cells membrane potential (Fig. 4c). Here again, the averaged potential of VS1 triggered by the V1 spike is larger than the one of VS2 and VS3.
These peaks in the spike-triggered average had been observed before (Kurtz et al., 2001; Warzecha et al., 2003). In contrast to our interpretation, however, these authors interpreted them as fast membrane depolarizations preceding and causing a spike in V1. Accordingly, these spikelets should occur before a spike in V1 occurs. Because the extracellularly recorded signal of V1 is processed by bandpass filters followed by a threshold operation, the exact timing of an action potential is difficult to determine. In a double recording experiment where we recorded the same V2 cell intra as well as extracellularly, we found a delay of the extracellular recorded spikes of 0.4–0.6 ms compared with the intracellular recordings (data not shown). This shift explains why the spike-triggered averages we measured peak 0.2 ms before the extracellular recorded V1 spikes (Fig. 4c). Taken into account the artificial shift of the extracellularly recorded spikes in V1, the fast membrane deflections recorded in VS cells actually follow the action potentials in V1 with a delay of 0.2–0.4 ms. This interpretation is in accordance with the dual intracellularly recorded responses of VS1 and V1. Here, we found that the fast membrane deflections in VS1 follow a spike generated in V1.
A recent study where different VS cells were laser ablated showed that ablation of VS1 had the strongest effect on V1 (Kalb et al., 2006). Shortly after laser ablation of VS1, the spontaneous firing rate of V1 increased to ∼120 Hz. Furthermore, the cell showed only weak responses to preferred direction motion stimuli. Ablation of a VS2/3 cell had a similar effect on the spike frequency of V1, although to a lesser extent. These results were discussed and found to be in general accordance with four different models of connectivity between VS cells and the V1 cell [see Kalb et al. (2006), their Fig. 6]. The connectivity scheme where VS1–VS4 are connected to V1 via chemical synapses turned out to be very unlikely. In one possible connectivity scheme, the VS1 is connected to V1 via electrical synapses, whereas VS2–VS4 are connected via chemical synapses to V1. In the second potential scheme, all VS cells are coupled to V1 via electrical synapses, but the coupling between VS1 and V1 is the strongest. The third possibility takes into account the electrical coupling within VS cells. It has been shown that all VS cells are coupled in a chain-like manner through electrical synapses in the terminal region of the cells (Haag and Borst, 2004; Cuntz et al., 2007). In this connectivity scheme, only VS1 is directly coupled to V1, whereas the coupling of VS2–VS4 is only indirect via VS1. According to this, current injection into VS2 would alter the membrane potential of VS1 and because VS1 is coupled to V1 in the end the membrane potential of V1.
Because we did not perform dual intracellular recordings from VS2 or VS3 and V1, we can only indirectly argue about the type of synapses between VS2 and VS3 to V1. Although we cannot completely exclude the existence of weak chemical synapses between VS2–VS3 and V1, the current injection experiments shown in Figure 4 did not provide any positive evidence that the coupling of VS2–VS3 to V1 is via chemical synapses. There are three points that speak against chemical and for electrical coupling: (1) Both depolarization and hyperpolarization is transmitted from VS2 and VS3 onto V1. Because the coupling strength between VS cells and V1 shows almost the same gradient for depolarization and hyperpolarization, it is unlikely that chemical synapses are involved. (2) The spike-triggered average of the VS cell membrane potential revealed the same signals in all VS cells but with different amplitudes. For a chemical synapse, no such signals are to be expected. (3) Injection of Neurobiotin in VS2 and VS3 revealed a dye coupling to V1. These findings could only be explained with electrical synapses. However, the question remains whether VS2 and VS3 are coupled directly to V1 or whether the coupling is indirect via VS1. The spike-triggered averages (Fig. 4c) speak in favor of a direct coupling, because the resulting signals for all three VS cells show an almost identical time course. Because the transmission of signals between VS1 and VS2 follows a second order low-pass filter with a time constant of 1.4 ms (Haag and Borst, 2004), one would expect a slower signal for the spike-triggered average of the VS2 signal than is actually observed (supplemental Fig. 1, available at www.jneurosci.org as supplemental material). In addition, the experiments where we injected Neurobiotin into VS2 revealed a dye coupling with V1 without an obvious costaining of VS1 (Fig. 8b). Together, these experiments provide strong evidence for a direct and purely electrical coupling of VS1–VS3 with V1 with no chemical synapses involved. This conclusion is furthermore in agreement with the previous finding of the broad range of signal amplitudes and frequencies that are transmitted between VS cells and the V1 cell (Warzecha et al., 2003; Beckers et al., 2007): given the purely electrical nature of the coupling, amplitude decrement and frequency dependence simply reflect the passive membrane properties of the cable between the two recording sites.
In addition to the described electrical coupling of VS cell axons to the dendrite of V1, we also found that V1 is presynaptic on the dendrite of the contralateral VS1. Thus far, only the connectivity between the contralateral V1 and the ipsilateral vCH has been described (Fig. 5c) (Haag and Borst, 2003; Krapp et al., 2001). Through double recordings, we now show that spikes in the contralateral V1 elicit EPSPs in VS1. This leads to the circuit diagram shown in Figure 6a. The experiments where we recorded from a VS1 cell of the left brain hemisphere and a VS1 cell from the right hemisphere showed that within a single VS1 cell two types of EPSPs can be detected: the reflectance of spikes occurring in the ipsilateral V1 and EPSP caused by excitatory input from the contralateral V1 contacting VS1 in the dendrite. Because current injection into the ipsilateral VS1 did not influence the spike frequency of the contralateral V1, this synaptic connection is via chemical synapses. Further evidence for chemical synapses comes from the dye injection experiments. If Neurobiotin was injected into VS1, we only found a costaining of the ipsilateral V1 but never of the contralateral V1.
The described connectivity (Fig. 6a) results in a sensitivity of VS1 for motion presented in front of the contralateral eye. As was recently found, the receptive fields of neck motor neurons have a much higher degree of binocularity than the VS cells in the lobula plate (Huston and Krapp, 2008). To what extend the described connectivity between the VS cells of both hemispheres contributes to this phenomenon remains to be investigated in future experiments.
Footnotes
This work was supported by the Max Planck Society and the Bernstein Center for Computational Neuroscience, Munich. We are grateful to Renate Gleich, Ursula Weber, and R. Schorner for excellent technical assistance.
References
- BasuAC, Kravitz EA (2003) Morphology and monoaminergic modulation of Crustacean Hyperglycemic Hormone-like immunoreactive neurons in the lobster nervous system. J Neurocytol 32:253–263. [DOI] [PubMed] [Google Scholar]
- BeckersU, Egelhaaf M, Kurtz R (2007) Synapses in the fly motion-vision pathway: evidence for a broad range of signal amplitudes and dynamics. J Neurophysiol 97:2032–2041. [DOI] [PubMed] [Google Scholar]
- BorstA, Haag J (1996) The intrinsic electrophysiological characteristics of fly lobula plate tangential cells: I. Passive membrane properties. J Comput Neurosci 3:313–336. [DOI] [PubMed] [Google Scholar]
- BorstA, Haag J (2002) Neural networks in the cockpit of the fly. J Comp Physiol A Neuroethol Sens Neural Behav Physiol 188:419–437. [DOI] [PubMed] [Google Scholar]
- BorstA, Haag J (2007) Optic flow processing in the cockpit of the fly. In: Invertebrate neurobiology (North G, Greenspan RJ, eds), pp 101–122. New York: Cold Spring Harbor.
- BorstA, Denk W, Haag J (2005) In vivo calcium imaging in the fly visual system. In: Imaging in neuroscience and development. A laboratory manual (Yuste R, Konnerth A, eds), pp 649–653. New York: Cold Spring Harbor.
- CuntzH, Haag J, Forstner F, Segev I, Borst A (2007) Robust coding of flow-field parameters by axo-axonal gap junctions between fly visual interneurons. Proc Natl Acad Sci U S A 104:10229–10233. [DOI] [PMC free article] [PubMed] [Google Scholar]
- DenkW, Strickler JH, Webb WW (1990) Two-photon laser scanning fluorescence microscopy. Science 248:73–76. [DOI] [PubMed] [Google Scholar]
- EckertH, Dvorak DR (1983) The centrifugal horizontal cells in the lobula plate of the blowfly Phaenicia sericata J Insect Physiol 29:547–560. [Google Scholar]
- EgelhaafM (2008) Fly vision: neural mechanisms of motion computation. Curr Biol 18:R339–R341. [DOI] [PubMed] [Google Scholar]
- EgelhaafM, Kern R, Krapp HG, Kretzberg J, Kurtz R, Warzecha AK (2002) Neural encoding of behaviourally relevant visual-motion information in the fly. Trends Neurosci 25:96–102. [DOI] [PubMed] [Google Scholar]
- FanRJ, Marin-Burgin A, French KA, Otto Friesen W (2005) A dye mixture (Neurobiotin and Alexa 488) reveals extensive dye-coupling among neurons in leeches; physiology confirms the connections. J Comp Physiol A Neuroethol Sens Neural Behav Physiol 191:1157–1171. [DOI] [PubMed] [Google Scholar]
- FarrowK, Haag J, Borst A (2003) Input organization of multifunctional motion sensitive neurons in the blowfly. J Neurosci 23:9805–9811. [DOI] [PMC free article] [PubMed] [Google Scholar]
- FarrowK, Borst A, Haag J (2005) Sharing receptive fields with your neighbors: tuning the vertical system cells to wide field motion. J Neurosci 25:3985–3993. [DOI] [PMC free article] [PubMed] [Google Scholar]
- FarrowK, Haag J, Borst A (2006) Nonlinear, binocular interactions underlying flow field selectivity of a motion-sensitive neuron. Nat Neurosci 9:1312–1320. [DOI] [PubMed] [Google Scholar]
- HaagJ, Borst A (1998) Active membrane characteristics and signal encoding in graded potential neurons. J Neurosci 18:7972–7986. [DOI] [PMC free article] [PubMed] [Google Scholar]
- HaagJ, Borst A (2001) Recurrent network interactions underlying flow-field selectivity of visual interneurons. J Neurosci 21:5685–5692. [DOI] [PMC free article] [PubMed] [Google Scholar]
- HaagJ, Borst A (2002) Dendro-dendritic interactions between motion-sensitive large-field neurons in the fly. J Neurosci 22:3227–3233. [DOI] [PMC free article] [PubMed] [Google Scholar]
- HaagJ, Borst A (2003) Orientation tuning of motion-sensitive neurons shaped by vertical-horizontal network interactions. J Comp Physiol A Neuroethol Sens Neural Behav Physiol 189:363–370. [DOI] [PubMed] [Google Scholar]
- HaagJ, Borst A (2004) Neural mechanism underlying complex receptive field properties of motion-sensitive interneurons. Nat Neurosci 7:628–634. [DOI] [PubMed] [Google Scholar]
- HaagJ, Borst A (2005) Dye-coupling visualizes networks of large-field motion-sensitive neurons in the fly. J Comp Physiol A Neuroethol Sens Neural Behav Physiol 191:445–454. [DOI] [PubMed] [Google Scholar]
- HaagJ, Borst A (2007) Reciprocal inhibitory connections within a neural network for rotational optic-flow processing. Front Neurosci 1:111–121. [DOI] [PMC free article] [PubMed] [Google Scholar]
- HaagJ, Denk W, Borst A (2004) Fly motion vision is based on Reichardt detectors regardless of the signal-to-noise ratio. Proc Natl Acad Sci U S A 101:16333–16338. [DOI] [PMC free article] [PubMed] [Google Scholar]
- HausenK (1977) Struktur, Funktion und Konnektivität bewegungsempfindlicher Interneurone im dritten optischen Neuropil der Schmeissfliege Calliphora erythrocephala. PhD Thesis, University of Tuebingen.
- HausenK (1981) Monocular and binocular computation of motion in the lobula plate of the fly. Verh Dtsch Zool Ges 74:49–70. [Google Scholar]
- HausenK (1982) Motion sensitive interneurons in the optomotor system of the fly. I. The horizontal cells: structure and signals. Biol Cybern 45:143–156. [Google Scholar]
- HausenK (1984) The lobula-complex of the fly: structure, function and significance in visual behaviour. In: Photoreception and vision in invertebrates (Ali MA, ed), pp 523–559. London: Plenum.
- HengstenbergR (1977) Spike response of “non-spiking” visual interneurone. Nature 270:338–340. [DOI] [PubMed] [Google Scholar]
- HengstenbergR (1982) Common visual response properties of giant vertical cells in the lobula plate of the blowfly Calliphora. J Comp Physiol A Neuroethol Sens Neural Behav Physiol 149:179–193. [Google Scholar]
- HengstenbergR, Hausen K, Hengstenberg B (1982) The number and structure of giant vertical cells (VS) in the lobula plate of the blowfly Calliphora erytrocephala J Comp Physiol A Neuroethol Sens Neural Behav Physiol 149:163–177. [Google Scholar]
- HustonSJ, Krapp HG (2008) Visuomotor transformation in the fly gaze stabilization system. PLoS Biology 6:e173. [DOI] [PMC free article] [PubMed] [Google Scholar]
- JoeschM, Plett J, Borst A, Reiff DF (2008) Response properties of motion-sensitive visual interneurons in the lobula plate of Drosophila melanogaster. Curr Biol 18:368–374. [DOI] [PubMed] [Google Scholar]
- KalbJ, Egelhaaf M, Kurtz R (2006) Robust integration of motion information in the fly visual system revealed by single cell photoablation. J Neurosci 26:7898–7906. [DOI] [PMC free article] [PubMed] [Google Scholar]
- KimpoRR, Theunissen FE, Doupe AJ (2003) Propagation of correlated activity through multiple stages of a neural circuit. J Neurosci 23:5750–5761. [DOI] [PMC free article] [PubMed] [Google Scholar]
- KrappHG, Hengstenberg R (1996) Estimation of self - motion by optic flow processing in single visual interneurons. Nature 384:463–466. [DOI] [PubMed] [Google Scholar]
- KrappHG, Hengstenberg B, Hengstenberg R (1998) Dendritic structure and receptive-field organization of optic flow processing interneurons in the fly. J Neurophysiol 79:1902–1917. [DOI] [PubMed] [Google Scholar]
- KrappHG, Hengstenberg R, Egelhaaf M (2001) Binocular contribution to optic flow processing in the fly visual system. J. Neurophysiol 85:724–734. [DOI] [PubMed] [Google Scholar]
- KurtzR, Warzecha AK, Egelhaaf M (2001) Transfer of visual motion information via graded synapses operates linearly in the natural activity range. J Neurosci 21:6957–6966. [DOI] [PMC free article] [PubMed] [Google Scholar]
- WarzechaAK, Kurtz R, Egelhaaf M (2003) Synaptic transfer of dynamic motion information between identified neurons in the visual system of the blowfly. Neuroscience 119:1103–1112. [DOI] [PubMed] [Google Scholar]