

Abstract
Humans rely heavily on shape similarity among objects for object categorization and identification. Studies using functional magnetic resonance imaging (fMRI) have shown that a large region in human occipitotemporal cortex processes the shape of meaningful as well as unfamiliar objects. Here, we investigate whether the functional organization of this region as measured with fMRI is related to perceived shape similarity. We found that unfamiliar object classes that are rated as having a similar shape were associated with a very similar response pattern distributed across object-selective cortex, whereas object classes that were rated as being very different in shape were associated with a more different response pattern. Human observers, as well as object-selective cortex, were very sensitive to differences in shape features of the objects such as straight versus curved versus “spiky” edges, more so than to differences in overall shape envelope. Response patterns in retinotopic areas V1, V2, and V4 were not found to be related to perceived shape. The functional organization in area V3 was partially related to perceived shape but without a stronger sensitivity for shape features relative to overall shape envelope. Thus, for unfamiliar objects, the organization of human object-selective cortex is strongly related to perceived shape, and this shape-based organization emerges gradually throughout the object vision pathway.
Keywords: object recognition, categorization, pattern classification, brain imaging, visual perception, familiarity
Introduction
Object shape and shape similarity among objects is important for the categorization and identification of objects (Rosch et al., 1976; Tversky and Hemenway, 1984; Biederman and Ju, 1988). The lateral occipital complex (LOC), a large region in human ventral visual cortex, plays a central role in the perception of object shape (Malach et al., 1995; Grill-Spector et al., 1998b; Murray et al., 2002; Grill-Spector and Malach, 2004). The overall LOC response depends on the perception of a coherent object shape (Grill-Spector et al., 1998a; Kourtzi and Kanwisher, 2000, 2001; Lerner et al., 2002; Hayworth and Biederman, 2006), and the shape representations in LOC are relatively invariant to image transformations such as size, position, and viewpoint (Grill-Spector et al., 1999; Vuilleumier et al., 2002; Ewbank et al., 2005). Furthermore, LOC is activated irrespectively of whether objects are meaningful (e.g., cars, flowers, etc.) or not (Malach et al., 1995; Kanwisher et al., 1997b).
Despite this overwhelming evidence that LOC processes perceived object shape, it is currently unknown what the role is of shape features for the functional organization of human LOC. Previous studies reporting distributed patterns of selectivity in LOC for well known object classes (cars, flowers, etc.) have not dissociated shape from nonvisual factors such as function and meaning, and from low-level visual factors such as retinotopic envelope (Haxby et al., 2001; Spiridon and Kanwisher, 2002; Cox and Savoy, 2003; O'Toole et al., 2005). Suggesting a role for visual factors, recent studies showed that unfamiliar, artificial objects evoke a distributed response pattern in LOC that is different for different objects (Op de Beeck et al., 2006; Williams et al., 2007). However, these recent studies included a very small stimulus set with only three object classes, and differences between the three object classes in their retinotopic envelope might explain the object-specific response patterns, especially as several recent studies have suggested that at least part of LOC contains a retinotopic map (Brewer et al., 2005; Larsson and Heeger, 2006). A recent study in monkeys (Op de Beeck et al., 2008b) suggested that the selectivity for unfamiliar objects in regions homolog to human LOC [monkey inferior temporal (IT) cortex] is tolerant to changes in stimulus position and task context; but also, this study did not directly show that the selectivity for unfamiliar objects is related to perceived shape.
Here, we present a study with stimuli from nine artificial object classes that was designed to directly show that the functional organization of LOC is related to perceived shape similarity. As done in many previous studies (Nosofsky, 1986; Edelman, 1998; Op de Beeck et al., 2001; Kayaert et al., 2005), we empirically verified perceived shape similarity among these object classes with similarity ratings. We found a highly significant relationship between the rated shape similarity among object classes and the amount of overlap in the pattern of selectivity in LOC. These findings demonstrate that the organization of human object-selective regions is related to perceived shape similarity.
Materials and Methods
Subjects
Twenty-eight adult volunteers participated in four experiments, two behavioral experiments (N = 8 in each) and two functional magnetic resonance imaging (fMRI) experiments (N = 6 in each; including eight males and 10 right handed). Each subject participated in only one experiment. The experiments were approved by the relevant ethical boards, that is, the ethical committee of the Faculty of Psychology and Educational Sciences (Katholieke Universiteit Leuven, Leuven, Belgium) and the committee for medical ethics of the Katholieke Universiteit Leuven, Leuven, Belgium, respectively.
Stimuli
The stimulus set consisted of exemplars from nine object classes. The prototype (“average exemplar”) of each object class is shown in Figure 1A,B. Other exemplars from an object class were very similar to the prototype (Fig. 1C), and within-class variation was very small compared with the differences between classes. We included multiple exemplars per object class in the fMRI experiment to be consistent with previous work and because we hoped that this within-class variation would reduce the amount of interstimulus adaptation in the fMRI blocks compared with a situation in which the same image would be shown throughout a block. More details on stimulus construction and the within-class variation in object shape can be found in previous studies (Op de Beeck et al., 2006). For all subjects in the behavioral experiments and for six subjects in the fMRI study (experiment 1), the novel object images were presented on a gray background (Fig. 1A). For the other six fMRI subjects (experiment 2), all novel object images were equated in their spatial frequency amplitude spectrum; this image manipulation resulted in extra 1/f frequency noise inserted on top of objects and background (Fig. 1B).
Figure 1.

Stimulus set used in all experiments. A, B, The prototypical exemplar from the nine object classes on a gray background (A) and after processing to equate Fourier amplitude spectrum (B). We refer to shape features to denote the shape properties that are the same within rows and different between rows, and shape envelope to denote the shape properties that are the same within columns and different between columns. C, The prototype of each class (middle row) is shown together with the exemplars that are most distinct from the prototype.
Each image was presented with a resolution of 200 × 200 pixels (corresponding to a retinal stimulus size between 8 and 10 visual degrees). The software used for stimulus presentation and response registration in the behavioral experiments was E-Prime (Psychology Software Tools). The software used for stimulus presentation and response registration in the fMRI study was PsychToolbox (Brainard, 1997).
As a simple measure of retinotopic overlap among the stimuli from different object classes, we computed a pixel-based measure of similarity between pairs of object classes, using the prototypical class exemplars. For each pair of images, we computed the difference in each pixel (maximal difference 1), squared it, summed it across all pixels, took the square root of this sum, and normalized the resulting number by the square root of the number of pixels. As the resulting number is a difference measure (diff) instead of a similarity index (sim), we inverted it to get an index of pixel-based similarity: sim = 1 − diff. Pixel-based measures have been used previously as a benchmark for physical similarity (Cutzu and Edelman, 1998; Grill-Spector et al., 1999; Op de Beeck et al., 2001; Allred et al., 2005). Although this measure is very simplistic, its relevance for low-level visual coding is supported by the correlation of 0.83 between the pixel-based physical similarity and the similarity among our stimuli in how they activate the simple cell-like S1 units in the input layer of the hierarchical model of Riesenhuber and Poggio (for this, the stimuli were rescaled to size 128 × 128 pixels) (Jiang et al., 2006). All these measures show higher similarity for images with the same shape envelope (same column in Fig. 1A) than for images with a different shape envelope (ratio of 1.37 over 1).
Behavioral experiments
We performed a behavioral experiment to assess perceived shape similarity. The experiment started with a very short familiarization phase in which the nine prototypes of the object classes were shown in a random order (1 s per image). This short preview was included to familiarize subjects with the range of objects in the experiment.
Next, subjects were requested to rate the similarity in shape between the successively presented prototypes of different object classes (stimulus duration, 150 ms; interstimulus interval, 500 ms) by pressing a key from 1 (shape is not similar at all) to 7 (very similar in shape). Subjects were instructed to use the entire scale for their responses in the rating task, and the preview phase allows them to calibrate the scale (as such avoiding a short period of instability at the start of the rating task). This procedure allows us to compare the relative similarity of different object pairs with maximal sensitivity. For each subject, each unique order of the nine object images was presented six times. No trials were included in which the two objects were exactly the same. These data were averaged to form a 9 × 9 similarity matrix, and further averaging of corresponding cells [e.g., cell (i,j) with cell (j,i)] was done to make this matrix symmetric.
In addition to this first behavioral experiment, we performed a control experiment that was an almost identical replication of the first experiment. There was one critical difference: the instructions in the control experiment and the behavioral labels of the rating scale did not mention “shape”. Instead, subjects were asked to rate the overall similarity between objects.
Scanning
Functional images were acquired in a 3T Philips Intera magnet (Department of Radiology, Katholieke Universiteit Leuven, Leuven, Belgium) with a 8-channel SENSE head coil with an echo-planar imaging sequence (105 time points per time series or “run”; repetition time, 3 s; echo time, 30 ms; acquisition matrix 104 × 104, resulting in a 2.1 × 2.1 in-plane voxel size; 50 slices oriented approximately halfway between a coronal and horizontal orientation and including most of cortex except the most superior parts of frontal and parietal cortex, with slice thickness 2 mm and interslice gap 0.2 mm). We also acquired a T1-weighted anatomical image (resolution 1 × 1 × 1.2 mm).
Experimental runs.
Runs (N = 9) consisted of 21 blocks of 15 s, including three fixation blocks (at the start, middle, and end of the run) and two blocks of each novel object class. The order of the conditions was counterbalanced across runs and across subjects. Twenty different exemplars of a particular object class were presented for 150 ms (interstimulus interval, 600 ms) in each stimulus block (the same 20 exemplars in each block of a particular condition). The spatial position of each stimulus was determined randomly with a maximum position offset from the fixation point of 6 visual degrees.
The task instructions in the experimental runs were different for two groups of subjects. In experiment 1, the six subjects performed a color-change detection task on images presented on a gray background. For this task, the objects were presented in color (low in saturation), and subjects had to press a key each time an object had a different color than the previous object (three changes in each block of 20 stimuli). The saturation of the color was adapted between runs so that the task required some effort to solve (low saturation) but was still associated with good performance (across all four subjects, 94% of the color changes were detected). In experiment 2, the six subjects viewed the images of Figure 1B with objects on a textured background. These subjects were given a short preview of the prototype exemplars from the nine object classes before the experiment, and they were instructed to simply press a button each time the object images changed from one class to another (so at the start of each block of 15 s). Subjects detected 93% of the block transitions. It is clear that the manipulations of image spatial frequency content and task are confounded across subjects. The purpose of these manipulations was not to investigate each factor by itself but to minimize the possibility that any effect of perceived shape similarity that we would observe would be restricted to a specific way of presenting the shape information (with or without differences among stimuli in spatial frequency content) or to a specific task context.
Localizer runs for object-selective cortex.
Runs (N = 2) consisted of 15 s blocks of fixation spot, intact object images, and Fourier-scrambled images (stimulus duration, 300 ms; interstimulus interval, 450 ms). In experiment 1, subjects performed the same color task during the localizer runs as they did during the experimental runs. In experiment 2, subjects were instructed to passively look at the fixation spot. In each stimulus block, stimulus position was either in the upper or in the lower visual field (border of the stimulus 0.6 visual degrees from the horizontal meridian), with a jitter in the horizontal stimulus position of maximum 4 visual degrees from the vertical meridian.
Retinotopic mapping.
Eight subjects (six from experiment 1 and two from experiment 2) participated in a short additional scan session in which we determined the anatomical location of the representations of the horizontal and vertical meridian. Runs (N = 3) consisted of 15 s blocks of fixation spot and of horizontally or vertically oriented wedges. The wedges were shown on a gray background and contained black and white patterns that changed at a frequency of 2.7 Hz (maximal extent of the wedges was 11.5 visual degrees from the fixation point). Changes included not only luminance reversals but also changes in the structure of the patterns (checkerboards with varying position of the checks and with rectangular as well as circular checks). Subjects were instructed to fixate a small red dot at the center of the screen.
Analysis of imaging data
Data were analyzed using the Statistical Parametric Mapping software package (SPM5, Wellcome Department of Cognitive Neurology, London, UK), as well as custom Matlab code.
Preprocessing.
Preprocessing involved realignment to correct for motion, coregistration of functional and anatomical images, segmentation (Ashburner and Friston, 2005), and spatial normalization to a Montreal Neurological Institute template. During spatial normalization, functional images were resampled to a voxel size of 2 × 2 × 2 mm. Finally, functional images were spatially smoothed (4 mm full-width-half-maximum kernel). We have shown previously in contrast-enhanced monkey fMRI that smoothing of twice the voxel size increases the signal-to-noise ratio also for multivoxel analyses with these stimuli (Op de Beeck et al., 2008b), and similar observations were made in the context of the present study (supplemental Fig. 1, available at www.jneurosci.org as supplemental material).
Localizer runs and object-selective regions of interest.
Statistical modeling of the signal in each voxel in each subject included a general linear model applied on preprocessed images, with four independent variables (one variable for each combination of intact vs Fourier-scrambled images and upper vs lower visual field) and six covariates (the translation and rotation parameters needed for realignment). Region of interest (ROI) definition was based on a combination of functional and anatomical criteria. LOC was defined as all voxels in lateral occipital (LO) and ventral occipitotemporal regions that were significantly activated in the contrast (intact objects − scrambled images). For some analyses, we made a further distinction between LO and occipitotemporal posterior fusiform (PF). If these two subregions were hard to distinguish because the object-selective activation was continuous, then we were conservative to include voxels, and we left out the voxels on the border. In nine of twelve subjects, significance for the ROI selection was determined with a threshold of p < 0.0001 (uncorrected for multiple comparisons). In three other subjects, we decided to take a more liberal threshold (p < 0.001 or p < 0.01, uncorrected for multiple comparisons) to compensate for a lower quality of the localizer data in these subjects. Across subjects, the LOC, LO, and PF ROI contained a median of 602, 321, and 189 voxels, respectively.
Retinotopic mapping.
Statistical modeling of the signal in each voxel in each subject included a general linear model applied on preprocessed images, with two independent variables (horizontal and vertical wedges) and six covariates (the translation and rotation parameters needed for realignment). The anatomical location of areas V1, V2, V3, and V4v was determined based on the activation in the contrast of horizontal versus vertical wedges. The selected voxels do not include the foveal confluence because of problems to reliably differentiate the retinotopic areas at this position (Dumoulin and Wandell, 2008); voxels on the border of areas were not included at all, and voxels were further constrained to be in gray matter. Across subjects, the V1, V2, V3, and V4v ROI contained a median of 279, 237, 156, and 149 voxels, respectively. As LOC was defined based on a functional criterion that might avoid the inclusion of voxels with noisy signal, we also defined a pooled V1 + V2 ROI for which we further constrained voxels to be significantly activated (p < 0.0001, uncorrected for multiple comparisons) during the object localizer scans in at least one of the following contrasts: upper visual field stimuli versus rest, lower visual field stimuli versus rest, or upper visual field stimuli versus lower visual field stimuli. This V1 + V2 ROI contained a median of 251 voxels.
Experimental runs.
For each block of each condition, we calculated the average signal in the time window 6–12 s after block onset in each LOC voxel, and we converted these arbitrary signal values in values of percentage signal change compared with the fixation blocks in the same run. Similar results were obtained by using the parameter estimates obtained after fitting a general linear model to the data (with nine conditions and six covariates to model the alignment parameters) instead of extracting PSC values directly from the raw data.
In the correlational analyses, we computed correlations after previously introduced methods for multivoxel pattern analysis (Haxby et al., 2001). The data were divided in two random subsets of runs (one with five runs and another one with four runs). We constructed lists as long as the number of voxels, and each list contained the PSC for all voxels for a particular condition in one subset. Then the values in each list of the first subset were correlated with the values in each list of the second subset, resulting in an asymmetrical 9 × 9 correlation matrix. This matrix was made symmetrical by averaging corresponding cells [e.g., cell (i,j) with cell (j,i)]. The procedure of dividing the data in two random subsets was applied nine times, and the obtained similarity matrices were averaged across these nine comparisons. These values are referred to as LOC, LO, PF, and V1 similarity (depending on the ROI). Finally, the similarity matrices of individual subjects were averaged.
Analysis of similarity matrices
For each type of similarity (e.g., perceived similarity, LOC similarity, and V1 similarity, etc.), we have a similarity matrix per subject and an averaged similarity matrix. In addition, we have a similarity matrix that contains the pixel-based similarity. We performed several analyses on these similarity matrices.
Computation of reliability.
Following methods published previously (Op de Beeck et al., 2008b), we determined the reliability of the data in each matrix by split-half analyses as commonly applied in psychometrics (Cronbach, 1949; Lewis-Beck, 1994). First, we vectorized each matrix by putting all 36 cells below the diagonal into a vector. Second, we split the total group of subjects in two halves, and we correlated the two vectors corresponding to the matrix of the two subject halves (we did this 50 times for each dataset to get a good estimate of reliability). Finally, we corrected this split-half correlation to get the reliability of the full dataset according to the Spearman-Brown formula: reliability = 2 × r/(1 + r).
Reliability as an upper bound for correlations between datasets.
The reliability of an experiment takes into account the noise in a dataset, and it provides us with an upper bound of the correlation that we can expect (the explainable variance) if we correlate data from different experiments, or data obtained from different sources (e.g., similarity ratings vs activation patterns in the brain). As explained previously (Op de Beeck et al., 2008b), if two datasets have a reliability R1 and R2, then the maximal correlation between the two experiments that we can expect given the noise within each experiment is equal to .
Permutation statistics.
We performed permutation statistics to determine the significance of correlations between vectorized similarity matrices, taking into account the variability across subjects. For each subject, we randomly shuffled the order of the nine conditions, and we reordered the individual similarity matrices according to the new condition order. Then we performed the aforementioned analyses to determine the reliability of the reshuffled data and the correlation between reshuffled datasets. We performed this procedure 1000 times, and we computed the probability that the reliability and correlations were equal or larger than, respectively, the reliability and correlations observed with the unshuffled data. The results from these permutation statistics were consistent with results from conventional parametric tests. For example, the correlation between LOC similarity and perceived shape similarity was also significantly higher than zero according to a t test across subjects (across all subjects: t = 9.66, p < 0.0001; experiment 1: t = 6.47, p = 0.0013; experiment 2: t = 6.73, p = 0.0011).
Multivoxel pattern classification.
We used a linear support vector machine (SVM) and a cross-validation procedure (Kamitani and Tong, 2005; Li et al., 2007) to further investigate the effects found in the correlational analyses. The input of the classifier was expressed in PSC as used for the correlational analyses. Linear SVM was implemented using the OSU SVM matlab toolbox (www.sourceforge.net/projects/svm/). For each pair of conditions, a linear SVM was trained using the data from five individual runs to find the hyperplane that separates the data from the two conditions, and the performance of the classifier on this pairwise classification was calculated for the average data from the remaining four runs; this procedure was applied nine times per pair of conditions with a random assignment of runs to the training and test set.
Multidimensional scaling
We performed multidimensional scaling (MDS) (using the Alternating Least-squares SCALing algorithm of F. W. Young, Psychometric Laboratory, University of North Carolina, Chapel Hill, NC) to visualize the representation space of the nine object classes according to the various metrics that we obtained (pixel-based, perceived, and LOC similarity). MDS places the nine stimuli in a low-dimensional space in a way that optimizes the correspondence between the relative proximity among the stimuli and the similarity in the similarity matrix (Shepard, 1980). For each two-dimensional space that is shown, we mention the proportion of the variance in the similarity data that is explained by the distances between stimuli. In this study, we use MDS as an exploratory tool for visualization, not as the basis for any statistical analysis, nor do we claim that two dimensions are the “true” dimensionality of each dataset.
Results
We designed a stimulus set containing artificial objects that allowed us to dissociate perceived object shape from the retinotopic envelope of stimuli (Fig. 1A,B). The stimulus set included object classes that overlapped strongly in retinotopic envelope and overall aspect ratio, shown in the same column. We will use the label “shape envelope” for the properties in common to object classes from the same column. At the same time, the object classes within each column differed greatly in the properties of the lines and angles that make up the object shape. In Figure 1A,B, the first row contains objects with smoothly varying contours, the second row objects with sharp protrusions/spikes, and the third row objects with straight edges and angles. We will use the label “shape features” for the properties in common to object classes from the same row. Note that we use these two labels, envelope and features, as descriptive terms to summarize a wide variety of underlying shape changes, but without any claim that these are the two dimensions along which shape is represented.
As an indication of the similarity of these object classes according to simple metrics of the local, pixel-wise overlap of images, we calculated a measure of pixel-based similarity, and we applied MDS to visualize the overall pattern of similarity (see Materials and Methods). The MDS-derived two-dimensional pixel-based object space (Fig. 2) reveals that object classes with a corresponding shape-envelope cluster together (indicating high similarity), whereas object class with corresponding shape features do not.
Figure 2.
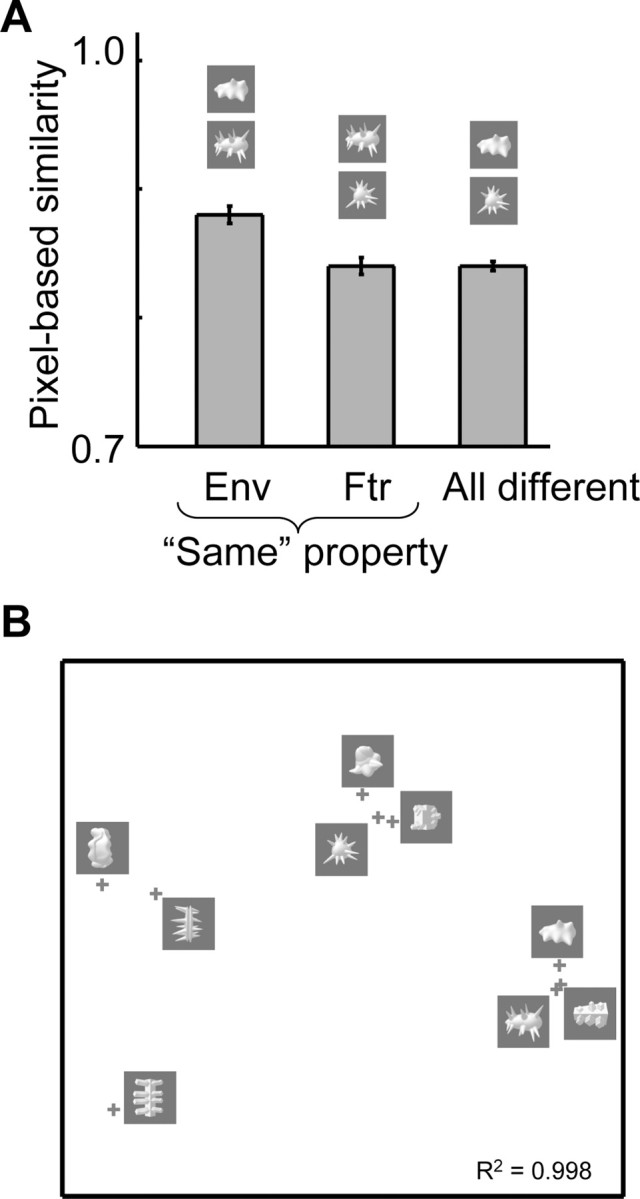
Pixel-based physical similarity among the nine object classes. A, Pixel-based similarity as a function of correspondence in shape envelope and shape features. The average similarity is shown for three groups of object pairs: objects that correspond in shape envelope (Env), objects that correspond in shape features (Ftr), and objects that are different in both envelope and features (all different). Error bars represent the SEM across stimulus pairs. B, The MDS-derived two-dimensional representation space of the nine prototypical exemplars based on the pixel-based measure of image similarity. If two stimuli are physically similar, then their points in this spatial representation are close together. The representation space shows that stimuli with the same shape envelope have a high pixel-based similarity. The R2 illustrates the fit between pixel-based similarity and the proximity between points.
Perceived shape similarity among the novel object classes
We asked human volunteers to rate the similarity in shape among pairs of novel object classes. Different subjects agreed very well in the object pairs they rated as being very similar and in the object pairs they rated as being more different in shape. Based on intersubject agreement, the reliability of the averaged similarity ratings was 0.94 (p < 0.001; see Materials and Methods, Permutation statistics).
As shown in Figure 3A, we computed for each observer the average rated similarity for pairs of objects that overlapped in shape envelope (“same envelope”), in shape features (“same features”), or in none of these properties (“all different”). Across subjects (two-tailed paired t test, N = 8), the rated similarity in the all-different pairs was significantly different from the same-features pairs (t = 6.27; p = 0.0004) and also from the same-envelope pairs (t = 5.92; p = 0.0006). Same-features pairs tended to be more similar than same-envelope pairs, but this difference did not reach significance (t = 1.83; p = 0.11).
Figure 3.
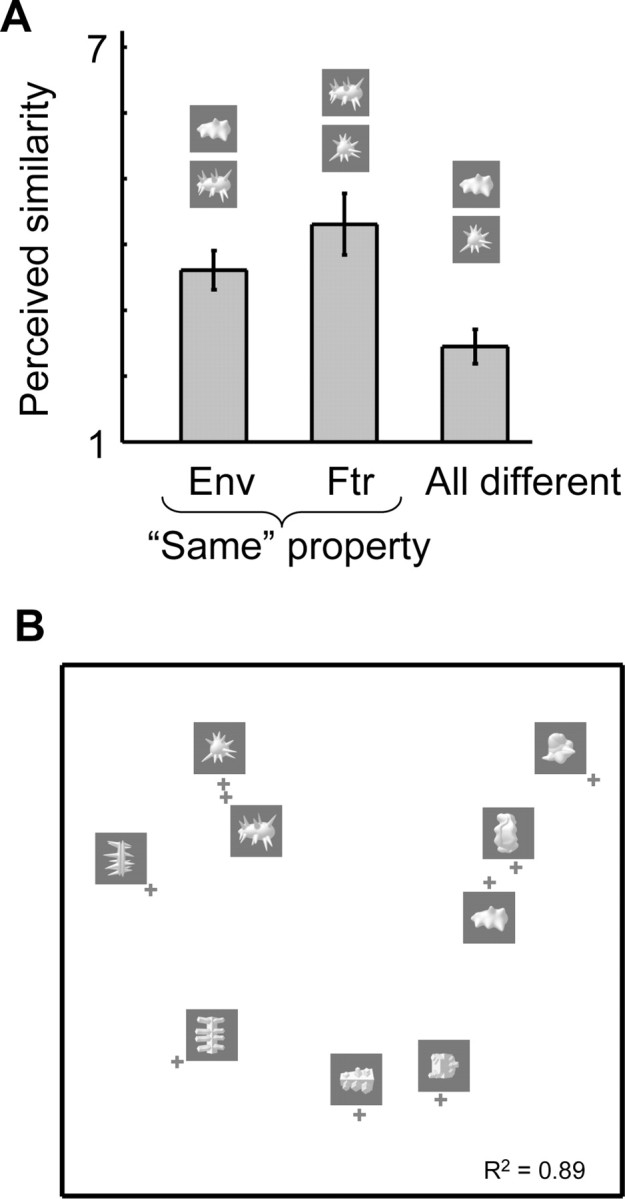
Perceived shape similarity among the nine object classes. A, Perceived similarity as a function of correspondence in shape envelope and shape features. The average similarity is shown for three groups of object pairs: objects that correspond in shape envelope (Env), objects that correspond in shape features (Ftr), and objects that are different in both shape envelope and features (all different). Error bars represent the SEM across subjects. B, The MDS-derived two-dimensional representation space of the nine object classes based on perceived shape similarity.
On top of averaging the data across such a limited number of conditions, we used MDS to analyze the full similarity matrix. The MDS-derived two-dimensional perceived object space in Figure 3B shows how important the shape features are for perceived shape: objects with corresponding shape features tend to be located in proximal locations. This result is very different from the pixel-based object space shown in Figure 2, where clustering was dominated by correspondence in shape envelope. Thus, it is especially the pairs with correspondence in shape features that allow for a dissociation between pixel-based similarity and perceived similarity. Across all possible object pairs (N = 36), the correlation between perceived similarity and pixel-based similarity was only 0.16 (p = 0.17; see Materials and Methods, Permutation statistics). Thus, the perceived shape similarity among two objects was independent from the pixel-based similarity among these objects. As a consequence, we can dissociate these two variables in how they relate to spatial patterns of brain activity.
Perceived shape similarity and similarity in the pattern of selectivity in object-selective cortex
Subjects were scanned while they viewed exemplars from the nine object classes, and LOC was localized in each subject (Fig. 4A). We used multivoxel correlational analyses, a sensitive tool for investigating patterns of activation distributed across voxels (Haxby et al., 2001; Norman et al., 2006; Downing et al., 2007), because univariate methods did not consistently reveal individual voxels with significant selectivity (either at a corrected threshold of p < 0.05 or an uncorrected threshold of p < 0.0001) in pairwise contrasts of object classes in the present study.
Figure 4.

Illustration of distributed patterns of selectivity in human object-selective cortex. A, Location of the LOC in a single subject. LOC voxels in lateral occipital and ventral occipitotemporal cortex were selected as having a significant preference in the contrast (intact objects − scrambled images) (thresholded at p < 0.0001, uncorrected for multiple comparisons). Data are shown on top of the PALS human atlas using CARET software (Van Essen et al., 2001, 2002) in a ventrolateral view of the inflated cortical surface. B, Patterns of selectivity for the same subject in LOC in odd runs for one object class (“smoothies”) and in even runs for a few object classes. Responses are expressed as PSC relative to the mean response to all object classes. These selectivity maps are not thresholded for significance, and individual voxels rarely display reliable selectivity for particular object classes. Nevertheless, part of the pattern of selectivity across voxels replicates across independent datasets. For each object class shown for the even runs, the correlation with the selectivity pattern for smoothies in odd runs is given below the images.
We applied these correlational analyses in the independently localized LOC to investigate whether distributed patterns of selectivity were present in our data and, most importantly, whether the similarity of the selectivity patterns for different object classes was related to perceived shape similarity. We obtained two measures of the pattern of selectivity for each object class in each subject by splitting time series in independent subsets of runs (illustrated for a few object classes in Fig. 4B). Next, the pattern of selectivity in one subset for each object class was correlated with the pattern of selectivity in the other subset for each object class. The strength of this correlation is a measure of how similar the patterns of selectivity are, here referred to as “LOC similarity.” Confirming the existence of reproducible patterns of selectivity, we found a significantly higher LOC similarity when comparing the same object class than when comparing different object classes (paired t test across all 12 subjects, t = 7.83; p < 0.0001). Thus, we obtained enough data for each object class to find reliable patterns of selectivity (even higher same-object correlations would be obtained if we would have more data per condition, requiring fewer conditions with equal scan time) (supplemental Fig. 1, available at www.jneurosci.org as supplemental material).
Here, we are interested in how LOC similarity varies depending on which two object classes are compared. As done previously for perceived similarity in Figure 3A, we computed for each observer the average LOC similarity for specific subgroups of object pairs (Fig. 5A): the correlation in the pattern of selectivity for the same object class between odd and even runs (“all same” pairs), or for two different object classes that overlapped in shape envelope (same-envelope pairs), in shape features (same-features pairs), or in none of these properties (all-different pairs). Across all 12 subjects, the LOC similarity in the same-features pairs was significantly higher than in the all-different pairs (t = 6.13; p < 0.0001; two-tailed paired t test, N = 12). A similar trend was observed for same-envelope pairs, but this effect did not reach significance (comparison of same-envelope pairs and all-different pairs, t = 2.09; p = 0.061). There was a significant difference between same-features pairs and same-envelope pairs (t = 3.87; p = 0.0026). Thus, of all comparisons of different object classes, the object classes that correspond in shape features, being perceptually very similar (Fig. 3), yielded the most similar patterns of selectivity in object-selective cortex. Despite this relatively high similarity in the pattern of selectivity, even the object classes that correspond in shape features (but differ in shape envelope) can be discriminated based on the pattern of selectivity in object-selective cortex: the LOC similarity in same-features pairs was significantly smaller than the LOC similarity in all same pairs (t = 6.13; p < 0.001).
Figure 5.
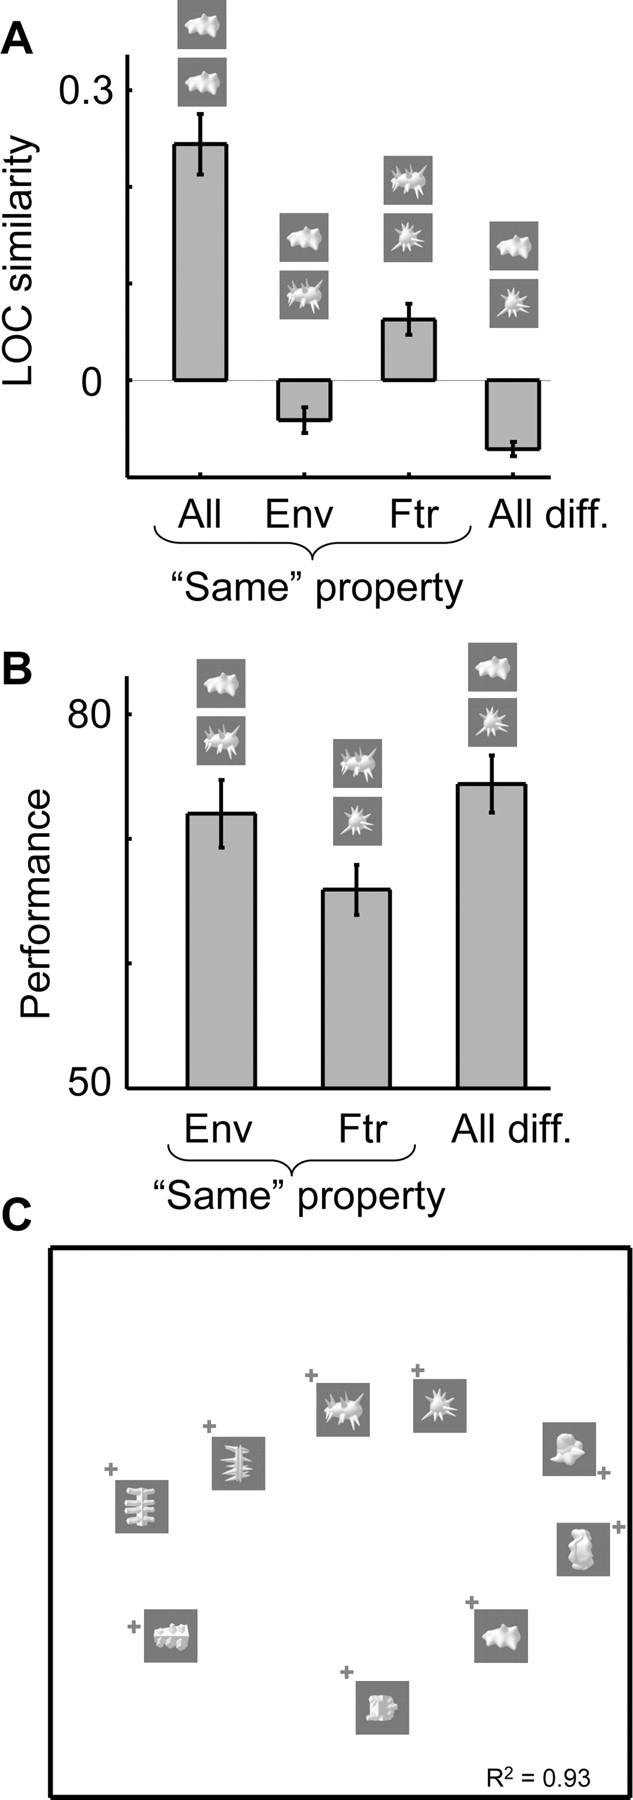
Similarity among the nine object classes with respect to the selectivity pattern in object-selective cortex (LOC similarity). A, The average LOC similarity is shown for four groups of object pairs: a comparison of the same object in odd and even runs (all same), a comparison of two objects that correspond in shape envelope (Env), in shape features (Ftr), or objects that are different in both envelope and features (all different). Error bars represent the SEM across subjects. B, Performance of a linear support vector machine classifier among the nine object classes as a function of correspondence in shape envelope and shape features. Error bars represent the SEM across subjects. Note that object pairs that are high in similarity in panel A (the Ftr condition), are more easily confused by a classifier. C, The MDS-derived two-dimensional representation space of the nine object classes based on LOC similarity.
From a brain decoding perspective, we expected that object classes that are perceptually similar would be hard to classify using a linear pattern classifier. For each pair of object classes, we determined how accurately linear SVMs could learn to assign a pattern of selectivity to the correct object class. As shown in Figure 5B, we computed for each observer the average classification performance for pairs of objects in three of the conditions defined previously (the fourth condition identified before, all same, is not applicable here as the classifier specifically serves to differentiate different conditions): pairs of objects that overlapped in shape envelope (same envelope), in shape features (same features), or in none of these properties (all different). Across subjects (two-tailed paired t test, N = 12), the classification performance in the same-features pairs was significantly worse than in the all-different pairs (t = 3.09; p = 0.01) and in the same-envelope pairs (t = 7.33; p < 0.0001). The classification performance was not different in the same-envelope pairs compared with the all-different pairs (t = 1.93; p = 0.080). Thus, of all comparisons of different object classes, the object classes that correspond in shape features, being perceptually very similar (Fig. 3), yielded the most confusable patterns of selectivity in object-selective cortex.
All these analyses focused on the average similarity in groups of object pairs. In addition, we analyzed the full similarity matrix with MDS. The MDS-derived two-dimensional perceived object space, shown in Figure 5C, reveals that the LOC object space is similar to the perceived object space shown in Figure 3B, in that objects with corresponding shape features tend to be located in proximal locations. This result is aga in very different from the pixel-based object space shown in Figure 2.
The role of perceived similarity and other factors for explaining LOC similarity in experiments 1 and 2
Confirming the existence of reproducible patterns of selectivity, we found a significantly higher LOC similarity when comparing the same object class than when comparing different object classes in each experiment (experiment 1: t = 10.18, p = 0.0001; experiment 2: t = 4.47, p = 0.0066). The importance of correspondence in shape features for the overlap in the spatial pattern of selectivity in LOC was also confirmed in each experiment (Fig. 6A). Each experiment showed a significant difference between same-features pairs and same-envelope pairs, with higher LOC similarity in the same-features pairs (experiment 1: t = 2.59, p = 0.049; experiment 2: t = 3.62, p = 0.0152). In addition, we correlated how LOC similarity varied across all 36 individual object pairs with how perceived shape similarity varied across object pairs (Fig. 6B; supplemental Table 1, available at www.jneurosci.org as supplemental material, shows correlations within the three subsets of object pairs defined above). Across these object pairs, LOC similarity correlated strongly with perceived shape similarity in experiment 1 (r = 0.49, p = 0.003; Materials and Methods, Permutation statistics) and in experiment 2 (r = 0.54, p = 0.001). Thus, the selectivity patterns in LOC are related to perceived similarity in each experiment.
Figure 6.

Relationship between LOC similarity and perceived shape similarity in experiment 1 (left) and in experiment 2 (right). A, The average LOC similarity is shown for four groups of object pairs: a comparison of the same object in odd and even runs (all same), a comparison of two objects that correspond in shape envelope (Env), in shape features (Ftr), or objects that are different in both envelope and features (all different). Error bars represent the SEM across subjects. B, Scatter plots of LOC similarity against perceived shape similarity for all object pairs. Coloring in these scatterplots refers to the object pair group that each pair belongs to in panel A: red for Env, green for Ftr, and blue for all different.
We found one significant difference between experiment 1 and experiment 2 and that is the strength of the correlations in the all same condition, which proved to be higher in experiment 1 than in experiment 2: t(10) = 2.65; p = 0.024. This finding suggests that the selectivity patterns were more reliable and probably stronger in experiment 1. Note, however, that the correlation with perceived similarity was at least as strong in experiment 2 compared with experiment 1 (see above).
Although we found that the correspondence in how two unfamiliar objects activate LOC is correlated strongly with perceived shape similarity in each experiment, the correlation is not equal to one. There are two possible explanations. First, the correlation might be less than one because data are inherently not perfect and contain a noise factor. Further analyses indicate that the correlation is definitely limited by noise inherent to the data. Based on intersubject agreement in the pattern of similarity across the 36 different object pairs, we computed the reliability of the averaged LOC similarity matrix (see Materials and Methods). This reliability was significantly higher than zero (Materials and Methods, Permutation statistics) in experiment 1 (r = 0.68; p < 0.001) and in experiment 2 (r = 0.67; p < 0.001). Based on this reliability and the reliability of our measure of perceived similarity (reliability of 0.94), the maximal correlation that can be expected given the limitations posed by data noise is 0.80 (experiment 1) and 0.79 (experiment 2). If we compare these values with the observed correlations of 0.49 and 0.54, then it is clear that a substantial part of LOC similarity is explained by perceived shape similarity.
Nevertheless, there is still some room for other factors that might contribute partly to LOC similarity. These factors might be methodological in nature and relate to the difficulty of comparing totally different variables (behavioral ratings and fMRI activity patterns). If this would be true, then perceived shape would still be a perfect explanation for LOC similarity, but methodological limitations would prevent us from finding a perfect fit. The simplest possibility would be that one of the measures would have to be monotonically scaled before comparing it with the other measure, but such a problem is not immediately obvious in the scatter plots.
A second explanation is suggested by a comparison of Figure 3A with Figure 5A and the related statistical analyses of each dataset. For perceived similarity, the effect of correspondence in shape envelope was significant, and it was approximately half as large as the effect of correspondence in shape features. For LOC similarity, the effect of correspondence in shape envelope (compared with the condition all different) failed to reach significance, and the LOC similarity in the same-envelope condition was much closer to the all-different than to the same-features condition. Is there really a differential role of shape envelope for perceived similarity compared with LOC similarity? Any explicit test of this question has to deal with the problem that the two types of similarity are expressed on different scales. To solve this problem, we calculated a normalized index that takes the similarity in same-envelope condition minus the similarity in the all-different condition, normalizing the resulting value by dividing it by the similarity in same-features condition minus the similarity in the all-different condition. The values in the numerator were calculated per individual subject, whereas the values in the denominator were averaged across subjects (the latter was done to improve the reliability of the index). Higher values indicate stronger effects of correspondence in shape envelope relative to the effect of correspondence in shape features. On average, this index was 0.51 (SEM = 0.29) for perceived similarity and 0.23 (SEM = 0.11) for LOC similarity. These two values were not significantly different (unpaired t test, t(18) = 1.03; p = 0.32). Thus, there is no significant difference between perceived similarity and LOC similarity in the effect of shape envelope.
Another explanation for the less than perfect fit between perceived shape similarity and LOC similarity is that other functional properties in addition to perceived shape might contribute to how LOC responds to unfamiliar objects. We investigated whether a simple, pixel-based metric of image similarity might explain part of the LOC similarity, but this was not the case (supplemental Fig. 2, scatter plots, available at www.jneurosci.org as supplemental material): LOC similarity was not correlated with pixel-based similarity in experiment 1 (r = −0.09; p = 0.69) nor in experiment 2 (r = 0.017; p = 0.42).
We wondered what other properties the object classes might have that are not shape. With familiar objects, several candidates would exist (e.g., semantic associations), but this is less clear with unfamiliar objects. Thus, we replicated our basic behavioral experiment with one small change: we asked subjects to rate the overall similarity between objects without mentioning shape in the instructions or in the verbal labels of the different numbers of the scale. If there would be any functional properties that subjects deem relevant for similarity but that do not fall under the concept of shape, then we would expect that this slight difference in the instructions and in the definition of the scale would matter and that it would affect the similarity ratings. However, the two behavioral experiments resulted in the same rated similarity: across all possible object pairs (N = 36), the correlation between perceived shape similarity (data from the initial experiment) and perceived “overall” similarity (data from the control experiment) was 0.94. Overall similarity was also affected strongly by correspondence in shape features, significantly more strongly (p < 0.05; paired t test across subjects) than by correspondence in shape envelope (higher similarity in same-features pairs than in same-envelope pairs). Thus, human observers do not use any other object features to rate overall similarity than the properties that are used in ratings of shape similarity.
The role of perceived shape similarity in subdivisions of LOC
Because LOC is a large cortical region, previous studies have focused on smaller subregions (Grill-Spector and Malach, 2004). The most common distinction is between the lateral occipital gyrus (area LO) and occipitotemporal or posterior fusiform cortex (area PF). Confirming the existence of reproducible patterns of selectivity in each area, we found a significantly higher similarity when comparing the same object class than when comparing different object classes (area LO: t = 9.5, p < 0.0001; area PF: t = 4.97, p = 0.0004; paired t tests across all 12 subjects). In addition, the same-condition correlations were significantly higher in area LO compared with area PF (t = 5.92; p < 0.0001).
Other analyses reveal that the selectivity patterns in each of these regions are related to perceived shape similarity. First, each region showed a significant difference between same-features pairs and same-envelope pairs (Fig. 7A), with highest similarity in selectivity patterns in the same-features pairs (area LO: t = 2.21, p = 0.049; area PF: t = 3.25, p = 0.0078). Second, the similarity of selectivity patterns correlated strongly with perceived shape similarity across all object pairs in area LO (r = 0.54, p = 0.001; Materials and Methods, Permutation statistics) and in area PF (r = 0.59; p < 0.001). No correlation was found with pixel-based similarity (area LO: r = 0.0062, p = 0.47; area PF: r = 0.013, p = 0.45) (supplemental Fig. 3, scatter plots, available at www.jneurosci.org as supplemental material). Thus, the selectivity patterns in each subregion of LOC are related to perceived shape similarity.
Figure 7.

Relationship between similarity in selectivity patterns and perceived shape in LO gyrus (left) and in the PF region (right). A, The average LO and PF similarity is shown for four groups of object pairs: a comparison of the same object in odd and even runs (all same), a comparison of two objects that correspond in shape envelope (Env), in shape features (Ftr), or objects that are different in both envelope and features (all different). Error bars represent the SEM across subjects. B, Scatter plots of LO and PF similarity against perceived shape similarity for all object pairs. Coloring in these scatterplots refers to the object pair group that each pair belongs to in panel A: red for Env, green for Ftr, and blue for all different.
The pattern of selectivity in retinotopic cortex
We expected a role of perceived shape similarity for the functional organization of higher regions in the object vision pathway. It is unclear to what extent shape contributes to the organization of lower stages in this hierarchically organized pathway. Several hypotheses can be formulated. First, lower stages in this hierarchy, such as primary visual cortex or V1, are known to be retinotopically organized, so the selectivity patterns in these regions might be related instead to our pixel-based measure of similarity that relates to the retinotopic envelope of the object classes. However, because we presented the objects with a wide scatter in retinotopic position (see Materials and Methods), we did not expect a strong effect of retinotopy.
Second, neurons in retinotopic regions process various attributes that are related to shape and curvature (Pasupathy and Connor, 1999; Hegdé and Van Essen, 2000, 2007). It is possible that these functional properties determine part of the organization of these regions, resulting in reliable patterns of selectivity that might be partially related to perceived shape similarity.
We defined the retinotopic areas V1, V2, V3, and V4v in eight subjects, and we obtained a measure of neural similarity in each ROI by correlating the pattern of selectivity for each object class in random subsets of runs with the pattern of selectivity for each object class in the other runs. The results are shown in Figures 8 and 9. In V1 and V2, we found no significantly higher similarity when comparing the same object class than when comparing different object classes (V1: t = 1.86, p = 0.11; V2: t = 2.03, p = 0.08), nor did V1 or V2 similarity correlate significantly with perceived shape similarity (V1: r = 0.25, p = 0.10; V2: r = 0.21, p = 0.12) or with pixel-based similarity (V1: r = 0.18, p = 0.17; V2: r = 0.23, p = 0.11). We also defined a pooled V1 + V2 ROI restricted to functionally active voxels (see Materials and Methods). This pooled V1 + V2 ROI still did not show (p > 0.10) a significantly higher similarity when comparing the same object class than when comparing different object classes nor did it show a significant correlation with perceived similarity (r = 0.22; p = 0.11). In contrast, the correlation between V1 + V2 similarity and pixel-based similarity did reach significance (r = 0.32; p = 0.028).
Figure 8.

Selectivity patterns in retinotopic areas V1, V2, V3, and V4v. The average similarity is shown for four groups of object pairs: a comparison of the same object in odd and even runs (all same), a comparison of two objects that correspond in shape envelope (Env), in shape features (Ftr), or objects that are different in both envelope and features (all different). Error bars represent the SEM across subjects.
Figure 9.

Relationship between similarity in selectivity patterns and perceived shape in retinotopic areas V1, V2, V3, and V4v. Coloring in these scatterplots refers to the object pair group that each pair belongs to in Figure 8: red for Env, green for Ftr, and blue for all different.
In V3 and V4, the patterns of selectivity were reliable, as we found a significantly higher similarity when comparing the same object class than when comparing different object classes (V3: t = 3.68, p = 0.0078; V4: t = 2.92, p = 0.022). The correlations in the all same condition in V3 were significantly higher than in V1 (t = 2.64; p = 0.033) and in V2 (t = 2.48; p = 0.042), but of similar strength as in V4 (t = 0.58; p > 0.4). V3 similarity correlated significantly with perceived shape similarity (r = 0.53; p = 0.003), whereas the correlation between V4 similarity and perceived shape similarity failed to reach significance (V4: r = 0.27, p = 0.052). V3 and V4 similarity did not correlate significantly with pixel-based similarity (V3: r = 0.27, p = 0.064; V4: r = 0.24, p = 0.11). Thus, of all these retinotopic regions, area V3 was the only one in which we found a significant correlation with perceived shape similarity.
As before, we also grouped object pairs in the previously described conditions same envelope, same features, and all different. All of the retinotopic regions, including area V3, showed a slightly higher similarity in same envelope compared with same-features, but this effect did not approach significance in any of these regions (p > 0.4). Note that area LOC showed the opposite effect, higher similarity in same-features than in same envelope (for the same group of eight subjects: t = 3.11; p = 0.017). To obtain an index of the same-features preference for each cortical regions, we subtracted same-envelope similarity from same-features similarity. This same-features preference in area LOC tended to be larger than in each retinotopic region: V1, p = 0.056; V2, p = 0.024; V3, p = 0.092; V4, p = 0.034 (p values according to a two-tailed t test across subjects; all p values would be <0.05 according to a one-tailed test).
The clearest demonstration of this differential role of shape envelope and shape features in V3 and LOC comes from the MDS-derived two-dimensional neural space obtained using the data from area V3 (Fig. 10). The first (horizontal) dimension in this space is highly correlated with shape envelope: elongated vertical objects at the left, compact objects in the middle, and elongated horizontal objects at the right. This is very different from the LOC object space in which shape features had a more important role (Fig. 5C). Thus, although the overlap in patterns of selectivity in V3 was correlated with perceived shape similarity, the neural similarity space of V3 did not show the same importance of shape features as was found for LOC and for behavioral ratings of perceived shape.
Figure 10.

The MDS-derived two-dimensional representation space of the nine object classes based on the between-class similarity in selectivity patterns in area V3.
Discussion
We showed a strong relationship between perceived shape similarity and selectivity patterns in the two major subregions of LOC. The effect of global shape envelope on perception and LOC response patterns was significantly smaller than the effect of shape features, which in the context of our stimulus set refers to various manipulations that affect the local curvature of the stimuli (e.g., straight vs curved edges). No reliable patterns of selectivity were observed in V1 and V2. Reliable patterns of selectivity were present in V3 and V4, and a significant effect of perceived shape was found in area V3, but without a stronger effect of shape features compared with shape envelope.
Our observation of the role of perceived shape similarity in two separate experiments indicates the robustness of this finding to changes in how exactly stimuli are shown (e.g., on a gray background or on a textured background) and changes in the task context (color or shape task). We found one difference between these experiments: the replicability of the selectivity patterns was strongest in the experiment with stimuli on a gray background and a color task. Several factors might explain this finding, including differences in Fourier amplitude spectrum (existence of spatial frequency map?), consequences of manipulating the image amplitude spectrum for the visibility of the object contour (most visible on a uniform background), and the degree to which each task engages subjects (with the color task requiring more frequent responses at more unpredictable times). Whatever the explanation of this finding, it does not alter the result that a strong correlation with perceived shape similarity was found in each experiment. Other task manipulations that we did not try might change (increase or decrease) the relationship with perceived shape similarity. A related question is what would happen if we would use a task that biases subjects to pay attention to specific shape properties (e.g., the aspect ratio of objects).
The present findings complement a previous single-unit study in monkey IT cortex that showed a tight relationship between the tuning of single IT neurons and perceived shape similarity (Op de Beeck et al., 2001). However, the present report looked at functional organization instead of single-unit selectivity, focused on a different species (human instead of monkey), and involved relatively large shape differences (selectivity for object classes) instead of fine metric shape differences (selectivity for exemplars within shape groups). Together, the two studies suggest that shape-selective regions in primates are functionally organized in terms of shape properties that distinguish perceptually distinct shapes (all nine object classes in the present study are easy to discriminate) and that single neurons in these regions discriminate objects in terms of finer metric shape differences in addition to being selective for perceptually more distinct shapes. The actual organizational unit for the clustering of functional responses might be smaller than our voxel size (Kamitani and Tong, 2005), and the underlying functional organization might be similar to the feature columns as revealed by optical imaging in monkey IT cortex (Fujita et al., 1992; Wang et al., 1996).
The hierarchical processing of shape in visual cortex
We dissociated perceived shape similarity from pixel-based/low-level stimulus differences. Nevertheless, a low-level representation of the incoming stimulus is the starting point from which higher-order shape representations are computed gradually (Riesenhuber and Poggio, 2000). Many empirical findings agree with this general hierarchical scheme (Kobatake and Tanaka, 1994; Riesenhuber and Poggio, 1999; Pasupathy and Connor, 2001). Nevertheless, current hierarchical models do not predict which shape properties IT neurons are most selective too, which are properties such as whether objects contain straight or curved edges (Kayaert et al., 2005). Likewise, these models do not predict the organization of shape-selective cortex as described here. For example, in our data, the correlation between similarity based on the output of the higher-level representations (“V4” units, and likewise for view-tuned units) in the model of Riesenhuber and Poggio (1999) and LOC similarity was only in the order of 0.10–0.15 (data not shown). Thus, the importance of these shape properties for shape representations is not a trivial consequence of the increase in invariance and complexity as implemented in this class of models. A more comprehensive computational model of shape recognition might include an adaptive feature dictionary (Serre et al., 2007) so that the tuning becomes more informative for object categorization (Biederman, 1987; Edelman and Intrator, 2000; Ullman et al., 2002; Kiani et al., 2007; Ullman, 2007).
Although the relationship between perceived shape similarity and the organization of object-selective cortex is not easily captured by existing biologically plausible object recognition models, our experiments with a relatively small set of essentially arbitrary complex objects do not inform us about the features, dimensions, or basis functions (Gallant et al., 1993) by which shape is represented. We based our choice of stimulus differences on previous studies in monkeys (Kayaert et al., 2005) and the need to dissociate perceived shape from pixel-based similarity, but the exact stimuli are still arbitrary and might not include the most optimal stimuli or shape properties. With our stimulus set, our data show a strong effect of what we have conveniently labeled shape features, a descriptive label that refers to a wide set of curvature properties of the objects: do objects consist of smoothly curved segments, sharp protrusions, or straight segments? The aforementioned biological model of object recognition does not explicitly code object curvature, in contrast to older models (Biederman, 1987). Neurophysiological studies have also suggested explicit processing of local shape curvature from area V1 up to area V4 (Dobbins et al., 1987; Pasupathy and Connor, 1999; Hegdé and Van Essen, 2007). Thus, the sensitivity for shape features as defined here might relate to the coding of curvature at various stages of the cortical hierarchy. In our study, which focused on functional organization instead of single-unit selectivity, the stronger sensitivity of shape features such as straight versus curved contours than for other shape properties such as aspect ratio was mostly found at the level of object-selective cortex and not in the retinotopic areas. Even area V3, in which the functional organization was correlated with perceived shape similarity, did not show a similarly strong sensitivity for shape features. The differences between V3 and LOC are consistent with the notion that shape processing progresses from orientation specific representations in V3 (high sensitivity for the orientation of the global shape envelope) (Fig. 10) to more orientation-independent representations in LOC (high sensitivity for shape features that might be helpful to achieve viewpoint independence) (Kayaert et al., 2003).
Unfamiliar objects versus familiar and meaningful objects
To what extent does object shape explain the category selectivity for highly familiar objects? Many previous studies have reported category-selective cortical patches and patterns of selectivity in the object vision pathway (Kanwisher et al., 1997a; Epstein and Kanwisher, 1998; Downing et al., 2001, 2006; Haxby et al., 2001; Schwarzlose et al., 2005; Spiridon et al., 2006). Two studies also compared the differences in activation patterns for familiar objects with similarity metrics, exactly as we did here, using either perceived similarity (Edelman et al., 1998) or image-based attributes (O'Toole et al., 2005). However, because these studies used exemplars from familiar object categories and did not explicitly dissociate perceived similarity for simple pixel-based metrics, this selectivity for familiar objects might be related to many factors: low-level visual similarity, object form/shape (Haxby et al., 2000), the way objects are processed (Gauthier, 2000), semantic attributes (Chao et al., 1999), and eccentricity biases (Hasson et al., 2002).
We reduced these confounds to a minimum by using unfamiliar object classes. Nevertheless, these factors cannot be excluded totally. For example, when we asked subjects to try to interpret the objects as known objects after the experiment, subjects were creative enough to come up with interpretations (Op de Beeck et al., 2006). However, subjects did not report using such interpretations to guide their similarity ratings, and probably the opposite is happening: shape similarity guides the interpretation of the stimuli. The irrelevance of these interpretations for the similarity ratings was further illustrated by the high intersubject variability in these interpretations, whereas the ratings (both shape ratings and ratings of overall similarity) were highly consistent across subjects (see Results).
The importance of the intersubject consistency of perceived shape ratings is illustrated by a recent study published in parallel with the preparation of this report. Haushofer et al. (2008) reported that manipulations of objective shape parameters relate to neural similarity in area LO but not in area PF, whereas behavioral confusion rates between stimuli correlated with neural similarity only in area PF. These confusion rates are a measure of overall similarity, not perceived shape similarity, and were very variable among subjects. This measure might reflect the variable interpretations of the stimuli by the subjects as the stimulus set consisted of ambiguous two-dimensional shape contours (De Winter and Wagemans, 2004; Wagemans et al., 2008). Furthermore, shape contours are suboptimal to activate LOC (Georgieva et al., 2008), and the stimulus set included only four contours that lacked many of the shape features manipulated in our study. Future studies are needed to investigate the role of each of these methodological differences and many other questions about the representation of shape in the human brain. Our study is the first demonstration that the selectivity patterns in area LO as well as area PF reflect the perceived shape of shaded three-dimensional objects varying in a range of shape properties.
For familiar objects, it is conceivable that several other factors in addition to perceived shape contribute significantly to the observed selectivity patterns. Selectivity patterns in high-level visual cortex change when additional experience is acquired with initially novel objects (Op de Beeck et al., 2006; Weisberg et al., 2007), thus the response pattern to familiar objects might be determined strongly by factors that have little relationship to perceived shape (Mahon et al., 2007). LOC is probably organized in terms of multiple properties, shape being one of them, and the same set of factors might have a different weight depending on object familiarity. How the different properties are combined, the relative weight of each property, and how these weights depend on familiarity, are all important questions for future research (Op de Beeck et al., 2008a).
Footnotes
This work was supported by a Federal Research Action Grant (Inter-Universitaire Attractie-Pool P6/29), the Research Council of Katholieke Universiteit Leuven (IMPH/06/GHW and CREA/07/004), and the Fund for Scientific Research–Flanders (G.0281.06 and 1.5.022.08). H.P.O.d.B. is a postdoctoral fellow of the Fund for Scientific Research–Flanders. We thank R. Peeters for technical support, A. Baeck for assistance with the first behavioral experiment, and C. Baker, G. Kayaert, and R. Vogels for helpful comments on this manuscript.
References
- Allred S, Liu Y, Jagadeesh B. Selectivity of inferior temporal neurons for realistic pictures predicted by algorithms for image database navigation. J Neurophysiol. 2005;94:4068–4081. doi: 10.1152/jn.00130.2005. [DOI] [PubMed] [Google Scholar]
- Ashburner J, Friston KJ. Unified segmentation. Neuroimage. 2005;26:839–851. doi: 10.1016/j.neuroimage.2005.02.018. [DOI] [PubMed] [Google Scholar]
- Biederman I. Recognition-by-components: a theory of human image understanding. Psychol Rev. 1987;94:115–147. doi: 10.1037/0033-295X.94.2.115. [DOI] [PubMed] [Google Scholar]
- Biederman I, Ju G. Surface versus edge-based determinants of visual recognition. Cognit Psychol. 1988;20:38–64. doi: 10.1016/0010-0285(88)90024-2. [DOI] [PubMed] [Google Scholar]
- Brainard DH. The psychophysics toolbox. Spat Vis. 1997;10:433–436. [PubMed] [Google Scholar]
- Brewer AA, Liu J, Wade AR, Wandell BA. Visual field maps and stimulus selectivity in human ventral occipital cortex. Nat Neurosci. 2005;8:1102–1109. doi: 10.1038/nn1507. [DOI] [PubMed] [Google Scholar]
- Chao LL, Haxby JV, Martin A. Attribute-based neural substrates in temporal cortex for perceiving and knowing about objects. Nat Neurosci. 1999;2:913–919. doi: 10.1038/13217. [DOI] [PubMed] [Google Scholar]
- Cox DD, Savoy RL. Functional magnetic resonance imaging (fMRI) “brain reading”: detecting and classifying distributed patterns of fMRI activity in human visual cortex. Neuroimage. 2003;19:261–270. doi: 10.1016/s1053-8119(03)00049-1. [DOI] [PubMed] [Google Scholar]
- Cronbach LJ. New York: Harper; 1949. Essentials of psychological testing. [Google Scholar]
- Cutzu F, Edelman S. Representation of object similarity in human vision: psychophysics and a computational model. Vision Res. 1998;38:2229–2257. doi: 10.1016/s0042-6989(97)00186-7. [DOI] [PubMed] [Google Scholar]
- De Winter J, Wagemans J. Contour-based object identification and segmentation: stimuli, norms and data, and software tools. Behav Res Methods Instrum Comput. 2004;36:604–624. doi: 10.3758/bf03206541. [DOI] [PubMed] [Google Scholar]
- Dobbins A, Zucker SW, Cynader MS. Endstopped neurons in the visual cortex as a substrate for calculating curvature. Nature. 1987;329:438–441. doi: 10.1038/329438a0. [DOI] [PubMed] [Google Scholar]
- Downing PE, Jiang Y, Shuman M, Kanwisher N. A cortical area selective for visual processing of the human body. Science. 2001;293:2470–2473. doi: 10.1126/science.1063414. [DOI] [PubMed] [Google Scholar]
- Downing PE, Chan AW, Peelen MV, Dodds CM, Kanwisher N. Domain specificity in visual cortex. Cereb Cortex. 2006;16:1453–1461. doi: 10.1093/cercor/bhj086. [DOI] [PubMed] [Google Scholar]
- Downing PE, Wiggett AJ, Peelen MV. Functional magnetic resonance imaging investigation of overlapping lateral occipitotemporal activations using multi-voxel pattern analysis. J Neurosci. 2007;27:226–233. doi: 10.1523/JNEUROSCI.3619-06.2007. [DOI] [PMC free article] [PubMed] [Google Scholar]
- Dumoulin SO, Wandell BA. Population receptive field estimates in human visual cortex. Neuroimage. 2008;39:647–660. doi: 10.1016/j.neuroimage.2007.09.034. [DOI] [PMC free article] [PubMed] [Google Scholar]
- Edelman S. Representation is representation of similarities. Behav Brain Sci. 1998;21:449–467. doi: 10.1017/s0140525x98001253. discussion 467–498. [DOI] [PubMed] [Google Scholar]
- Edelman S, Intrator N. (Coarse coding of shape fragments) + (retinotopy) approximately = representation of structure. Spat Vis. 2000;13:255–264. doi: 10.1163/156856800741072. [DOI] [PubMed] [Google Scholar]
- Edelman S, Grill-Spector K, Kushnir T, Malach R. Toward direct visualization of the internal shape representation space by fMRI. Psychobiology. 1998;26:309–321. [Google Scholar]
- Epstein R, Kanwisher N. A cortical representation of the local visual environment. Nature. 1998;392:598–601. doi: 10.1038/33402. [DOI] [PubMed] [Google Scholar]
- Ewbank MP, Schluppeck D, Andrews TJ. fMR-adaptation reveals a distributed representation of inanimate objects and places in human visual cortex. Neuroimage. 2005;28:268–279. doi: 10.1016/j.neuroimage.2005.06.036. [DOI] [PubMed] [Google Scholar]
- Fujita I, Tanaka K, Ito M, Cheng K. Columns for visual features of objects in monkey inferotemporal cortex. Nature. 1992;360:343–346. doi: 10.1038/360343a0. [DOI] [PubMed] [Google Scholar]
- Gallant JL, Braun J, Van Essen DC. Selectivity for polar, hyperbolic, and Cartesian gratings in macaque visual cortex. Science. 1993;259:100–103. doi: 10.1126/science.8418487. [DOI] [PubMed] [Google Scholar]
- Gauthier I., I What constrains the organization of the ventral temporal cortex? Trends Cogn Sci. 2000;4:1–2. doi: 10.1016/s1364-6613(99)01416-3. [DOI] [PubMed] [Google Scholar]
- Georgieva SS, Todd JT, Peeters R, Orban GA. The extraction of 3D shape from texture and shading in the human brain. Cereb Cortex. 2008;18:2416–2438. doi: 10.1093/cercor/bhn002. [DOI] [PMC free article] [PubMed] [Google Scholar]
- Grill-Spector K, Malach R. The human visual cortex. Annu Rev Neurosci. 2004;27:649–677. doi: 10.1146/annurev.neuro.27.070203.144220. [DOI] [PubMed] [Google Scholar]
- Grill-Spector K, Kushnir T, Edelman S, Itzchak Y, Malach R. Cue-invariant activation in object-related areas of the human occipital lobe. Neuron. 1998a;21:191–202. doi: 10.1016/s0896-6273(00)80526-7. [DOI] [PubMed] [Google Scholar]
- Grill-Spector K, Kushnir T, Hendler T, Edelman S, Itzchak Y, Malach R. A sequence of object-processing stages revealed by fMRI in the human occipital lobe. Hum Brain Mapp. 1998b;6:316–328. doi: 10.1002/(SICI)1097-0193(1998)6:4<316::AID-HBM9>3.0.CO;2-6. [DOI] [PMC free article] [PubMed] [Google Scholar]
- Grill-Spector K, Kushnir T, Edelman S, Avidan G, Itzchak Y, Malach R. Differential processing of objects under various viewing conditions in the human lateral occipital complex. Neuron. 1999;24:187–203. doi: 10.1016/s0896-6273(00)80832-6. [DOI] [PubMed] [Google Scholar]
- Hasson U, Levy I, Behrmann M, Hendler T, Malach R. Eccentricity bias as an organizing principle for human high-order object areas. Neuron. 2002;34:479–490. doi: 10.1016/s0896-6273(02)00662-1. [DOI] [PubMed] [Google Scholar]
- Haxby JV, Ishai I, I, Chao LL, Ungerleider LG, Martin I I. Object-form topology in the ventral temporal lobe. Response to I. Gauthier (2000) Trends Cogn Sci. 2000;4:3–4. doi: 10.1016/s1364-6613(99)01423-0. [DOI] [PubMed] [Google Scholar]
- Haxby JV, Gobbini MI, Furey ML, Ishai A, Schouten JL, Pietrini P. Distributed and overlapping representations of faces and objects in ventral temporal cortex. Science. 2001;293:2425–2430. doi: 10.1126/science.1063736. [DOI] [PubMed] [Google Scholar]
- Haushofer J, Livingstone MS, Kanwisher N. Multivariate patterns in object-selective cortex dissociate perceptual and physical shape similarity. PLoS Biol. 2008;6:e187. doi: 10.1371/journal.pbio.0060187. [DOI] [PMC free article] [PubMed] [Google Scholar]
- Hayworth KJ, Biederman I. Neural evidence for intermediate representations in object recognition. Vision Res. 2006;46:4024–4031. doi: 10.1016/j.visres.2006.07.015. [DOI] [PubMed] [Google Scholar]
- Hegdé J, Van Essen DC. Selectivity for complex shapes in primate visual area V2. J Neurosci. 2000;20:RC61. doi: 10.1523/JNEUROSCI.20-05-j0001.2000. [DOI] [PMC free article] [PubMed] [Google Scholar]
- Hegdé J, Van Essen DC. A comparative study of shape representation in Macaque visual areas V2 and V4. Cereb Cortex. 2007;17:1100–1116. doi: 10.1093/cercor/bhl020. [DOI] [PubMed] [Google Scholar]
- Jiang X, Rosen E, Zeffiro T, Vanmeter J, Blanz V, Riesenhuber M. Evaluation of a shape-based model of human face discrimination using FMRI and behavioral techniques. Neuron. 2006;50:159–172. doi: 10.1016/j.neuron.2006.03.012. [DOI] [PubMed] [Google Scholar]
- Kamitani Y, Tong F. Decoding the visual and subjective contents of the human brain. Nat Neurosci. 2005;8:679–685. doi: 10.1038/nn1444. [DOI] [PMC free article] [PubMed] [Google Scholar]
- Kanwisher N, McDermott J, Chun MM. The fusiform face area: a module in human extrastriate cortex specialized for face perception. J Neurosci. 1997a;17:4302–4311. doi: 10.1523/JNEUROSCI.17-11-04302.1997. [DOI] [PMC free article] [PubMed] [Google Scholar]
- Kanwisher N, Woods RP, Iacoboni M, Mazziotta JC. A locus in human extrastriate cortex for visual shape analysis. J Cogn Neurosci. 1997b;9:133–142. doi: 10.1162/jocn.1997.9.1.133. [DOI] [PubMed] [Google Scholar]
- Kayaert G, Biederman I, Vogels R. Shape tuning in macaque inferior temporal cortex. J Neurosci. 2003;23:3016–3027. doi: 10.1523/JNEUROSCI.23-07-03016.2003. [DOI] [PMC free article] [PubMed] [Google Scholar]
- Kayaert G, Biederman I, Vogels R. Representation of regular and irregular shapes in macaque inferotemporal cortex. Cereb Cortex. 2005;15:1308–1321. doi: 10.1093/cercor/bhi014. [DOI] [PubMed] [Google Scholar]
- Kiani R, Esteky H, Mirpour K, Tanaka K. Object category structure in response patterns of neuronal population in monkey inferior temporal cortex. J Neurophysiol. 2007;97:4296–4309. doi: 10.1152/jn.00024.2007. [DOI] [PubMed] [Google Scholar]
- Kobatake E, Tanaka K. Neuronal selectivities to complex object features in the ventral visual pathway of the macaque cerebral cortex. J Neurophysiol. 1994;71:856–867. doi: 10.1152/jn.1994.71.3.856. [DOI] [PubMed] [Google Scholar]
- Kourtzi Z, Kanwisher N. Cortical regions involved in perceiving object shape. J Neurosci. 2000;20:3310–3318. doi: 10.1523/JNEUROSCI.20-09-03310.2000. [DOI] [PMC free article] [PubMed] [Google Scholar]
- Kourtzi Z, Kanwisher N. Representation of perceived object shape by the human lateral occipital complex. Science. 2001;293:1506–1509. doi: 10.1126/science.1061133. [DOI] [PubMed] [Google Scholar]
- Larsson J, Heeger DJ. Two retinotopic visual areas in human lateral occipital cortex. J Neurosci. 2006;26:13128–13142. doi: 10.1523/JNEUROSCI.1657-06.2006. [DOI] [PMC free article] [PubMed] [Google Scholar]
- Lerner Y, Hendler T, Malach R. Object-completion effects in the human lateral occipital complex. Cereb Cortex. 2002;12:163–177. doi: 10.1093/cercor/12.2.163. [DOI] [PubMed] [Google Scholar]
- Lewis-Beck MS. Basic measurement. London: Sage; 1994. [Google Scholar]
- Li S, Ostwald D, Giese M, Kourtzi Z. Flexible coding for categorical decisions in the human brain. J Neurosci. 2007;27:12321–12330. doi: 10.1523/JNEUROSCI.3795-07.2007. [DOI] [PMC free article] [PubMed] [Google Scholar]
- Mahon BZ, Milleville SC, Negri GA, Rumiati RI, Caramazza A, Martin A. Action-related properties shape object representations in the ventral stream. Neuron. 2007;55:507–520. doi: 10.1016/j.neuron.2007.07.011. [DOI] [PMC free article] [PubMed] [Google Scholar]
- Malach R, Reppas JB, Benson RR, Kwong KK, Jiang H, Kennedy WA, Ledden PJ, Brady TJ, Rosen BR, Tootell RB. Object-related activity revealed by functional magnetic resonance imaging in human occipital cortex. Proc Natl Acad Sci U S A. 1995;92:8135–8139. doi: 10.1073/pnas.92.18.8135. [DOI] [PMC free article] [PubMed] [Google Scholar]
- Murray SO, Kersten D, Olshausen BA, Schrater P, Woods DL. Shape perception reduces activity in human primary visual cortex. Proc Natl Acad Sci U S A. 2002;99:15164–15169. doi: 10.1073/pnas.192579399. [DOI] [PMC free article] [PubMed] [Google Scholar]
- Norman KA, Polyn SM, Detre GJ, Haxby JV. Beyond mind-reading: multi-voxel pattern analysis of fMRI data. Trends Cogn Sci. 2006;10:424–430. doi: 10.1016/j.tics.2006.07.005. [DOI] [PubMed] [Google Scholar]
- Nosofsky RM. Attention, similarity, and the identification-categorization relationship. J Exp Psychol Gen. 1986;115:39–61. doi: 10.1037//0096-3445.115.1.39. [DOI] [PubMed] [Google Scholar]
- Op de Beeck H, Wagemans J, Vogels R. Inferotemporal neurons represent low-dimensional configurations of parameterized shapes. Nat Neurosci. 2001;4:1244–1252. doi: 10.1038/nn767. [DOI] [PubMed] [Google Scholar]
- Op de Beeck HP, Baker CI, DiCarlo JJ, Kanwisher NG. Discrimination training alters object representations in human extrastriate cortex. J Neurosci. 2006;26:13025–13036. doi: 10.1523/JNEUROSCI.2481-06.2006. [DOI] [PMC free article] [PubMed] [Google Scholar]
- Op de Beeck HP, Haushofer J, Kanwisher NG. Interpreting fMRI data: maps, modules and dimensions. Nat Rev Neurosci. 2008a;9:123–135. doi: 10.1038/nrn2314. [DOI] [PMC free article] [PubMed] [Google Scholar]
- Op de Beeck HP, Deutsch JA, Vanduffel W, Kanwisher NG, DiCarlo JJ. A stable topography of selectivity for unfamiliar shape classes in monkey inferior temporal cortex. Cereb Cortex. 2008b;18:1676–1694. doi: 10.1093/cercor/bhm196. [DOI] [PMC free article] [PubMed] [Google Scholar]
- O'Toole AJ, Jiang F, Abdi H, Haxby JV. Partially distributed representations of objects and faces in ventral temporal cortex. J Cogn Neurosci. 2005;17:580–590. doi: 10.1162/0898929053467550. [DOI] [PubMed] [Google Scholar]
- Pasupathy A, Connor CE. Responses to contour features in macaque area V4. J Neurophysiol. 1999;82:2490–2502. doi: 10.1152/jn.1999.82.5.2490. [DOI] [PubMed] [Google Scholar]
- Pasupathy A, Connor CE. Shape representation in area V4: position-specific tuning for boundary conformation. J Neurophysiol. 2001;86:2505–2509. doi: 10.1152/jn.2001.86.5.2505. [DOI] [PubMed] [Google Scholar]
- Riesenhuber M, Poggio T. Hierarchical models of object recognition in cortex. Nat Neurosci. 1999;2:1019–1025. doi: 10.1038/14819. [DOI] [PubMed] [Google Scholar]
- Riesenhuber M, Poggio T. Models of object recognition. Nat Neurosci. 2000;3(Suppl):1199–1204. doi: 10.1038/81479. [DOI] [PubMed] [Google Scholar]
- Rosch E, Mervis C, Gray W, Johnson D, Boyes-Braem P. Basic objects in natural categories. Cognit Psychol. 1976;8:382–439. [Google Scholar]
- Schwarzlose RF, Baker CI, Kanwisher N. Separate face and body selectivity on the fusiform gyrus. J Neurosci. 2005;25:11055–11059. doi: 10.1523/JNEUROSCI.2621-05.2005. [DOI] [PMC free article] [PubMed] [Google Scholar]
- Serre T, Oliva A, Poggio T. A feedforward architecture accounts for rapid categorization. Proc Natl Acad Sci U S A. 2007;104:6424–6429. doi: 10.1073/pnas.0700622104. [DOI] [PMC free article] [PubMed] [Google Scholar]
- Shepard RN. Multidimensional scaling, tree-fitting, and clustering. Science. 1980;210:390–398. doi: 10.1126/science.210.4468.390. [DOI] [PubMed] [Google Scholar]
- Spiridon M, Kanwisher N. How distributed is visual category information in human occipito-temporal cortex? An fMRI study. Neuron. 2002;35:1157–1165. doi: 10.1016/s0896-6273(02)00877-2. [DOI] [PubMed] [Google Scholar]
- Spiridon M, Fischl B, Kanwisher N. Location and spatial profile of category-specific regions in human extrastriate cortex. Hum Brain Mapp. 2006;27:77–89. doi: 10.1002/hbm.20169. [DOI] [PMC free article] [PubMed] [Google Scholar]
- Tversky B, Hemenway K. Objects, parts, and categories. J Exp Psychol Gen. 1984;113:169–197. [PubMed] [Google Scholar]
- Ullman S. Object recognition and segmentation by a fragment-based hierarchy. Trends Cogn Sci. 2007;11:58–64. doi: 10.1016/j.tics.2006.11.009. [DOI] [PubMed] [Google Scholar]
- Ullman S, Vidal-Naquet M, Sali E. Visual features of intermediate complexity and their use in classification. Nat Neurosci. 2002;5:682–687. doi: 10.1038/nn870. [DOI] [PubMed] [Google Scholar]
- Van Essen DC. Windows on the brain: the emerging role of atlases and databases in neuroscience. Curr Opin Neurobiol. 2002;12:574–579. doi: 10.1016/s0959-4388(02)00361-6. [DOI] [PubMed] [Google Scholar]
- Van Essen DC, Drury HA, Dickson J, Harwell J, Hanlon D, Anderson CH. An integrated software suite for surface-based analyses of cerebral cortex. J Am Med Inform Assoc. 2001;8:443–459. doi: 10.1136/jamia.2001.0080443. [DOI] [PMC free article] [PubMed] [Google Scholar]
- Vuilleumier P, Henson RN, Driver J, Dolan RJ. Multiple levels of visual object constancy revealed by event-related fMRI of repetition priming. Nat Neurosci. 2002;5:491–499. doi: 10.1038/nn839. [DOI] [PubMed] [Google Scholar]
- Wagemans J, De Winter J, Op de Beeck HP, Ploeger A, Beckers T, Vanroose P. Identification of everyday objects on the basis of silhouette and outline versions. Perception. 2008;37:207–244. doi: 10.1068/p5825. [DOI] [PubMed] [Google Scholar]
- Wang G, Tanaka K, Tanifuji M. Optical imaging of functional organization in the monkey inferotemporal cortex. Science. 1996;272:1665–1668. doi: 10.1126/science.272.5268.1665. [DOI] [PubMed] [Google Scholar]
- Weisberg J, van Turennout M, Martin A. A neural system for learning about object function. Cereb Cortex. 2007;17:513–521. doi: 10.1093/cercor/bhj176. [DOI] [PMC free article] [PubMed] [Google Scholar]
- Williams MA, Dang S, Kanwisher NG. Only some spatial patterns of fMRI response are read out in task performance. Nat Neurosci. 2007;10:685–686. doi: 10.1038/nn1900. [DOI] [PMC free article] [PubMed] [Google Scholar]