

Abstract
The Alzheimer's disease (AD) brain is characterized by plaques containing β-amyloid (Aβ) protein surrounded by astrocytes and reactive microglia. Activation of microglia by Aβ initiates production of reactive oxygen species (ROS) by the plasmalemmal NADPH oxidase; the resultant oxidative stress is thought to contribute to neurodegeneration in AD. We have previously shown that Aβ upregulates a chloride current mediated by the chloride intracellular channel 1 (CLIC1) protein in microglia. We now demonstrate that Aβ promotes the acute translocation of CLIC1 from the cytosol to the plasma membrane of microglia, where it mediates a chloride conductance. Both the Aβ induced Cl− conductance and ROS generation were prevented by pharmacological inhibition of CLIC1, by replacement of chloride with impermeant anions, by an anti-CLIC1 antibody and by suppression of CLIC1 expression using siRNA. Thus, the CLIC1-mediated Cl− conductance is required for Aβ-induced generation of neurotoxic ROS by microglia. Remarkably, CLIC1 activation is itself dependent on oxidation by ROS derived from the activated NADPH oxidase. We therefore propose that CLIC1 translocation from the cytosol to the plasma membrane, in response to redox modulation by NADPH oxidase-derived ROS, provides a feedforward mechanism that facilitates sustained microglial ROS generation by the NAPDH oxidase.
Keywords: microglia, β-amyloid, ROS, CLIC1, NADPH oxidase, neurodegeneration
Introduction
A major feature of Alzheimer's disease (AD) is the accumulation of extracellular β-amyloid (Aβ) into plaques infiltrated with activated microglia. Exposure of microglia to Aβ increases the expression of the chloride intracellular channel 1 (CLIC1). We have previously demonstrated that blocking CLIC1 reduces Aβ-induced microglial-mediated neurotoxicity (Novarino et al., 2004). In the present work, we identify a novel mechanism through which CLIC1 plays a pivotal role in the microglial response to Aβ, which could have profound implications for the pathophysiology of AD.
The CLIC family consists of seven proteins (Shanks et al., 2002), with CLICs 1, 4, and 5 known to possess chloride channel activity (Tonini et al., 2000; Tulk et al., 2002; Berryman et al., 2004; Singh and Ashley, 2006). CLIC1 was originally identified in monocytes (Valenzuela et al., 1997) and is able to insert into membranes from the aqueous phase (Tulk et al., 2002; Warton et al., 2002). CLIC1 channel activity is increased by oxidation, probably through the formation of an intrachain disulfide bond that promotes dimerization (Harrop et al., 2001; Littler et al., 2004). Although CLIC1 is the most highly expressed transcript of a range of chloride channels encoded by mammalian microglial mRNA (Ducharme et al., 2007), its functional role remains obscure.
In response to Aβ, microglia secrete a range of proinflammatory molecules including cytokines (Meda et al., 1999) and reactive oxygen species (ROS) (Bianca et al., 1999). Oxidative damage is a feature of the AD brain (Lyras et al., 1997), and considerable evidence suggests oxidative stress induced by microglial-derived ROS is a major contributor to neurodegeneration (Wilkinson and Landreth, 2006; Block et al., 2007). Exposure of microglia to Aβ in vitro induces ROS generation by the NADPH oxidase (McDonald et al., 1997; Bianca et al., 1999), specifically by NOX2 (Sankarapandi et al., 1998). Neurons are protected by pharmacological inhibition (Qin et al., 2002; Abramov et al., 2003) or genetic modification of the NADPH oxidase (Block et al., 2006), supporting a neurotoxic role for NADPH oxidase-derived ROS (Abramov and Duchen, 2005). Because NADPH oxidase-derived ROS and resultant oxidative stress are strongly implicated in the pathogenesis of AD (Shimohama et al., 2000; Wilkinson and Landreth, 2006; Park et al., 2008), these processes and their mechanisms clearly represent attractive therapeutic targets.
Both NADPH oxidase and CLIC1 are upregulated in the AD brain (Shimohama et al., 2000; Parachikova et al., 2007) and expression of both increases in microglia in response to Aβ in vitro (Bianca et al., 1999; Novarino et al., 2004). CLIC1 blockade limits Aβ-induced microglial-mediated neurotoxicity after 24 h (Novarino et al., 2004). Here, we describe a primary role for CLIC1 in microglial activation by Aβ. Using electrophysiological and live cell imaging approaches, we show that Aβ promotes the acute translocation of CLIC1 from the cytoplasm to the microglia cell membrane, resulting in the appearance of an anion conductance within minutes. This conductance is shown to be essential for ROS generation by the NADPH oxidase, and is itself regulated by it, thus defining a fundamental role for CLIC1 in Aβ-induced oxidative stress.
Materials and Methods
Cell culture and manipulation
Experiments have been performed using primary cultures of microglia from rat cortex and cells of the murine microglial immortalized cell line BV2 (Blasi et al., 1990; Bocchini et al., 1992). We have used the BV2 microglial cell line for most experiments that require manipulation of gene expression, because transfection of primary microglial is problematic with a very low transfection efficiency.
The BV2 cell line was maintained in DMEM supplemented with 10% fetal bovine serum and 2 mm l-glutamine, without antibiotic. Purified primary microglial cultures were obtained from mixed glial cultures as described previously (Novarino et al., 2004). Mixed cultures were obtained from 2-d-old Sprague Dawley rats. Cerebral cortices were isolated, mechanically dissociated and trypsinized, then centrifuged at 400 × g for 5 min. The resulting pellet was resuspended in DMEM. Cells were transferred to 75 cm2 poly-l-lysine-coated flasks and maintained in DMEM at 37°C in an atmosphere of 5% CO2. After 10–14 d, these cultures were shaken to detach the microglia, which were then plated onto poly-l-lysine-coated coverslips for 24–48 h before use. Purity was assessed directly through the addition of FITC-conjugated isolectin B4 (Griffonia simplicifolia) at the end of an experiment and independently through immunofluorescent staining using antibodies against OX42 (microglia) and GFAP (astrocytes).
BV2 and primary microglia cell cultures were stimulated in all of the experiments using Aβ25–35 at a concentration of 50 μm and Aβ1–42 at a concentration of 2.5 μm. Aβ25–35 is a truncated form of the peptide which contains the biologically active region; the concentrations chosen were those used routinely and known to elicit robust effect (Abramov et al., 2003). In some experiments, we also used the following (in μm): 100 H2O2, 500 tBOOH, 5 lipopolysaccharide (LPS), or 1 PMA. NADPH-oxidase activity was inhibited by diphenylene iodonium (DPI) (1 μm). Chloride channel blockers IAA94 and DIDS were used in all of the experiments at a concentration of 50 and 200 μm, respectively.
Transfections were performed using Lipofectamine 2000. For CLIC1 localization experiments, BV2 cells were transfected with the DNA sequence of CLIC1 cloned in an enhanced green fluorescent protein (peGFP)-N1 plasmid (Clontech) where CLIC1 is in fusion with the eGFP (CLIC1-eGFP). In other experiments, the CLIC1 sequence was tagged at the N terminus with a FLAG epitope (Sigma-Aldrich) cloned in pIRES2-eGFP plasmid (Clontech) where the CLIC1 is separate from eGFP (CLIC1-FLAG). The FLAG epitope is recognized by monoclonal anti-FLAG-m2 antibodies (Sigma-Aldrich).
To knock down CLIC1 protein expression, we manipulated psiUb-clic1B as described previously (Novarino et al., 2004) to generate siRNAs targeting a 21-nt region in exon 6 of CLIC1 mRNA (5′-GATGATGAAGAGATAGAGCTA-3′). The plasmid was produced by annealing corresponding complementary synthetic oligonucleotides which were then cloned into the BglII–XhoI sites of pSiUx. (Denti et al., 2004). To generate the pAAV 2.1-siUbclic1B derivative, the transcriptional unit was excised from psiUb-clic1B with XbaI and NheI and cloned in the same orientation as eGFP, into the NheI site of the pAAV2.1-CMV-eGFP plasmid (a kind gift from A. Auricchio, Telethon Institute of Genetics and Medicine, Naples, Italy) (Auricchio et al., 2001). Therefore, the construct expresses eGFP under the control of the CMV promoter. Cells transfected with siRNA were therefore identifiable using fluorescence microscopy through their green fluorescence.
Western blotting
SDS-PAGE and Western blotting were performed using standard techniques. Briefly, cells were lysed on ice in 10 mm Tris-HCl, pH 6.8, 0.1% Triton X-100, 100 mm NaCl, 300 mm sucrose, 5 mm MgCl2, and protease inhibitor mixture (Sigma-Aldrich). Samples were clarified by centrifugation at 4°C, 10,000 × g for 5 min and equivalent amounts of proteins (20 μg) of the surnatant were subjected to SDS-PAGE using 12% polyacrylamide gels, and proteins were electroblotted to nitrocellulose. The membranes were blocked with 5% milk powder in TBS for 1 h and then incubated overnight at 4°C with custom made anti-CLIC1 or with anti-mitogen-activated protein kinase (Sigma-Aldrich) in TBS containing 0.1% Tween 20 and 5% milk. After extensive washing, a peroxidase-conjugated anti-sheep (or anti-rabbit) antibody, diluted in TBS containing 0.1% Tween 20, was added for 1 h. Antibody binding was detected by chemiluminescence kit (ECL Blotting System; GE Healthcare).
Electrophysiology
Patch-clamp electrophysiology was performed in perforated-patch, whole-cell configuration using standard methods. In voltage-clamp mode, the bath solution was (in mm) 90 NaCl, 40 TEACl, 2 CaCl2, 2 MgCl2, 10 HEPES, 10 glucose, pH 7.35. For whole-cell perforated-patch experiments, the electrode contained (in mm) 20 TEACl, 120 TEACH3SO4, 10 HEPES, 10 glucose, pH 7.2. In current-clamp configuration, we used a different bath solution composed (in mm) of 145 NaCl, 5 KCl, 2 CaCl2, 2 MgCl2, 10 HEPES, 10 glucose, pH 7.35, and we filled the electrode with (in mm) 20 KCl, 120 KAsp, 10 HEPES, 10 glucose, pH 7.2. The antibiotic amphotericin B for voltage-clamp experiments and gramicidin for current-clamp trials (Sigma-Aldrich) were added to the pipette solution at a concentration of 60 μg/ml and 2.5 μg/ml, respectively. The first compound forms pores in the plasma membrane enabling the flow of monovalent ions, the second allows only the movement of cations providing electrical continuity between the recording pipette and the intracellular environment.
To obtain voltage–current relationship, we held the cell voltage at −50 mV, and we measured the current at the end of 800 ms voltage steps from −60 to +80 mV. We used a subtraction method using IAA94 and DIDS to isolate the current sensitive to the current inhibitors. In our experimental conditions, the calculated chloride reversal potential was −48 mV, assuming that in perforated-patch configuration, the intracellular chloride concentration is similar to that in the pipette. We calculated a tip potential of −9.8 mV (PClamp 9; Molecular Devices) that was added to all of the plots regarding whole-cell experiments. An Axopatch 200 B amplifier and PClamp 9 (both from Molecular Devices) were used to record and analyze the whole-cell currents. Current recordings were digitized at 5 kHz and filtered at 1000 Hz.
In current-clamp mode, we found two distinct populations of microglial cells with different resting potentials. Cells which were spread and ramified showed a more polarized membrane voltage (mean of −67 ± 2 mV; n = 21). At the other extreme were round cells that showed a more depolarized resting potential (mean of −45 ± 1.8 mV; n = 30). The average membrane potential from the entire population of BV2 microglial cells was −54 ± 2 mV, n = 51. However, we found that only the more polarized cells showed membrane potential changes in response to Aβ, suggesting that the other cells were already activated, dividing or somehow inactive. Therefore, all membrane potential data are presented only from the more polarized group of cells.
The junction potential was zeroed for each trial at the beginning when the electrode was immersed in the solution. At the end of each experiment, the configuration was changed from perforated-patch to whole-cell mode, comparing voltage values. The resulting difference was negligible. Voltage recordings were digitized at 1 kHz and filtered at 200 Hz.
Imaging
CLIC1 translocation.
Cells transfected with the CLIC1-eGFP plasmid or the empty vector were bathed in HBSS, while images were acquired using a Zeiss 510 LSM confocal microscope. eGFP was excited at 488 nm and fluorescence collected between 505 and 550 nm. In some cases, DiIC12, a red fluorescent lipophilic marker of phospholipid membranes, was used to clearly identify the plasma membrane of the imaged cells, in which case the DiIC12 fluorescence was excited using a 543 HeNe laser and light collected at >560 nm. Images were digitized to 12 bits.
GFP images were analyzed through construction of a fluorescence intensity profile across the brightest points of the cell membrane and extraction of the intensity values of pixels in the membrane region and comparison with values from the cytoplasmic region. Where DiIC12 was used, colocalization was assayed using Zeiss LSM software within a region of interest chosen to encompass only the cell membrane.
Immunofluorescence.
CLIC1 localization was probed using antibodies to the protein and, more specifically, its N terminus, after treatment with Aβ.
BV2 microglial cells were treated with 50 μm Aβ25–35 for 1 h before washing with PBS and fixation with 4% paraformaldehyde 5 min at 4°C. Nonspecific binding was minimized through blocking with 10% appropriate animal serum. Where the primary antibody to the whole protein was used, cells were permeabilized using Triton X-100 (0.1% in PBS), where the primary antibody to the extracellular N terminus of the CLIC1 protein was used, cells were not treated with detergent. Secondary donkey anti-sheep antibodies (1:100; Santa Cruz Biotechnology) or rabbit anti-goat antibodies (1:350; Santa Cruz Biotechnology) were incubated for 45 min. Cells were stained with 4′,6′-diamidino-2-phenylindole dihydrochloride (DAPI) to identify the nuclei and mounted for visualization.
Images were again acquired using a Zeiss 510 LSM META confocal microscope. FITC-conjugated secondary antibodies were excited at 488 nm, Cy5-conjugated secondary antibodies were excited at 633 nm, and DAPI was excited at either 364 or 405 nm.
ROS production.
Coverslips were transferred to small chambers for microscopy. Cells were imaged while bathing in a modified HBSS solution containing (in mm) 156 NaCl, 3 KCl, 2 MgSO4, 1.25 KH2PO4, 2 CaCl2, 10 glucose, and 10 HEPES, pH adjusted to 7.35 with NaOH. Dihydroethidium (HEt; 20 μm) was added immediately before the start of an experiment and remained in the solution for the duration. Images were obtained using a cooled charge-coupled device (CCD) camera or a confocal microscope. In the first instance, fluorescence measurements were obtained on an epifluorescence-inverted microscope (Axiovert; Zeiss) equipped with a 20× fluorite objective, using excitation light of 490 nm provided by a Xenon arc lamp with the beam passing a computer-controlled filter wheel (Cairn Research). Emitted fluorescence light was reflected through a 580 nm long-pass filter to a frame transfer cooled CCD camera (Hamamatsu 4880; Hamamatsu Corporation); data were collected and analyzed using Kinetic Imaging software. Alternatively, digital imaging of HEt fluorescence was performed using a Zeiss 510 LSM confocal microscope equipped with a 40× oil-immersion lens. Excitation was provided by the 543 line of the helium-neon laser line and emitted fluorescence collected >560 nm. In all experiments using HEt, data were collected every 10 s over a baseline period of 5 min and for 40 min after cell stimulation. The rate of HEt oxidation in cells at rest was then compared with the rate of HEt oxidation in the same cells after activation by the Aβ peptide. Every cell in a field of view was analyzed and included in the final measurements, except in instances of extreme movement.
Brain sections.
Analyses were performed on brains from the triple-transgenic mouse model of Alzheimer's disease 3×Tg-AD, which overexpress human amyloid precursor protein, mutant human tau, and express mutant human presenilin-1 (Oddo et al., 2003). Transgenic mice and their nontransgenic littermates were perfused with paraformaldehyde at 18 months of age. Vibratome sections of their brains were processed (1) for thioflavin S staining to reveal amyloid deposits and (2) for the detection of immunoreactivity for CLIC1 (using a custom made antibody, revealed by a secondary donkey anti-sheep antibodies) combined with the detection of microglia [using biotinylated Lycopersicon esculentum agglutinin (LEA) (1:2000; Vector Laboratories) revealed by streptavidin-Alexa 488 (Invitrogen)]. Sections were examined under a confocal laser scanning microscope (Leica). Fluorochromes were imaged separately and merged with Leica Power Scan software. Cells were only considered to have CLIC1 membrane localization when >40% of the cell body border showed reactivity to the antibody.
Analysis and statistics
Electrophysiology data are presented as mean ± SEM. Values obtained from different experiments were tested for statistical differences using two population t tests for two independent samples (OriginLab or SPSS). Images were analyzed using Lucida and AQM software or Zeiss LSM 510 imaging software. Statistical analysis was again performed using OriginLab or SPSS. Data were assessed for normality using the Shapiro–Wilk test, and nonparametric analyses used where appropriate. All data are presented as mean ± SE with n values given for both individual cells and coverslips. The point of minimum acceptable statistical significance was taken to be 0.05 and was Bonferroni corrected where required.
Results
Aβ induces an acute CLIC1-mediated membrane current in microglia
Exposure of rat primary microglia (PMG) or the microglial cell line BV2 (Blasi et al., 1990) to Aβ peptides during amphotericin-perforated patch-clamp recordings induced an anion conductance, typically after a delay of 5–10 min. The current had kinetic parameters identical to those measured in Chinese hamster ovary cells transfected with recombinant CLIC1 (Tonini et al., 2000). Because CLIC1 currents wash out rapidly after intracellular dialysis in the whole-cell patch configuration, the use of the perforated-patch configuration is critical.
Cells were clamped at a holding potential of −50 mV, close to the measured mean resting membrane potential of −54.5 ± 2 mV (n = 51). The basal current showed only a small component sensitive to the CLIC1 inhibitor, IAA94 (50 μm), or to the generic chloride channel blocker, DIDS (200 μm) (Fig. 1a). Application of Aβ25–35 (50 μm) caused the appearance of an outward chloride current which reached a plateau after 10–20 min (Fig. 1c). The current was inhibited by IAA94 (by 54%). Of the residual 46% current, nearly 25% was inhibited by DIDS. An example of current subtraction for both components is shown in Figure 1b (inset). The current–voltage relationships (Fig. 1b) show that both the IAA94 and DIDS sensitive currents have reversal potentials close to the calculated chloride equilibrium potential of −48 mV (−45.4 ± 2.7 mV and −42.7 ± 2.2 mV, respectively; n = 9)
Figure 1.
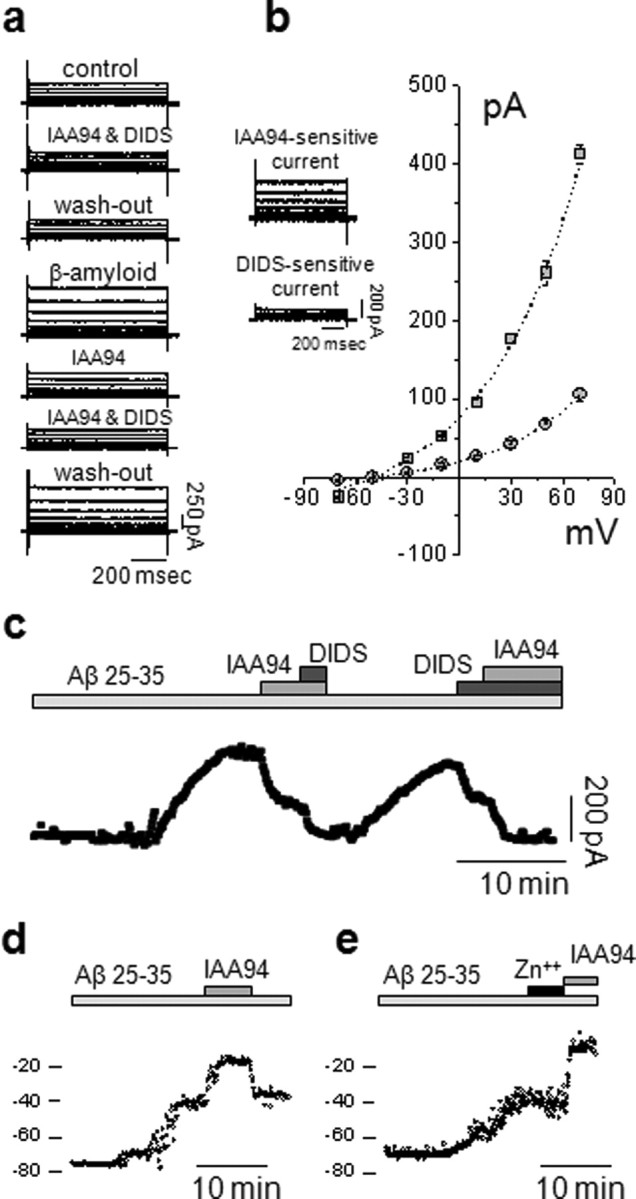
Aβ peptide increases CLIC1-mediated membrane chloride current in microglial cells. a, Perforated-patch current recordings from BV2 cells during 20 mV voltage steps from −60 to +80 mV from a holding potential of −50 mV. Traces show (from top to bottom) the following: membrane current in control conditions, perfused with 50 μm IAA94 and 200 μm DIDS then washed, during exposure to 50 μm Aβ25–35; after the current increase reached a plateau and in the constant presence of Aβ25–35, 50 μm IAA94 was added to the solution, followed by 200 μm DIDS, followed by washout of the current blockers. b, Subtracted currents, showing the components sensitive to IAA94 (411.3 ± 11.6 pA) and DIDS (109.8 ± 8.5 pA), respectively (inset), and the current–voltage relationships of the IAA94- (squares) and DIDS- (circles) sensitive currents. Both currents show reversal potentials close to the Cl− equilibrium potential given our experimental conditions (−45.4 ± 2.7 mV and −42.7 ± 2.2 mV, respectively; n = 9). c, Time course of the BV2 microglial cell membrane current amplitude measured at 700 ms of an 800 ms voltage step from −50/+50 mV, delivered every 10 s. Starting from a steady value, the cell was perfused with Aβ25–35. After 5–15 min, the current increased, reaching a plateau over 10–20 min (n = 21). Application of IAA94 reduced the current amplitude from 339.5 ± 21.6 pA to 118.3 ± 12.1 pA (n = 21; p < 0.001, independent samples t test) which was further reduced by 200 μm DIDS. The opposite sequence of chloride channel blockers was then followed, showing that IAA94 and DIDS act on different targets. d, Membrane potential measurements during Aβ exposure. Shown is an example in which a microglial cell depolarized from −75 mV to −43 mV after perfusion with Aβ25–35 (50 μm); after reaching a plateau, addition of 50 μm IAA94 prompted a further 25 mV depolarization. The effect of the chloride channel blocker was completely reversible. e, In a similar experiment from another cell, 3 mm zinc had no effect on the membrane depolarization caused by Aβ. The effect of IAA94 was still evident.
A further analysis of the membrane current after exposure to Aβ25–35 (Fig. 1c) shows that the current increased after a delay of ∼10 min to reach a stable value over 13 ± 2 min (n = 21). The membrane current was seen in 21 of 34 trials (61%), with a mean amplitude of 340 ± 22 pA (n = 21). The current was reduced by 66% by IAA94, whereas the residual current (34%) was blocked by DIDS. The blockers caused the same degree of inhibition regardless of the order in which they were applied after exposure to Aβ25–35, suggesting that the IAA94 and DIDS sensitive currents are mediated by two different conductances.
The effect of Aβ on resting membrane potential in microglial cells revealed that activation of NADPH oxidase depolarizes the cells (Bianca et al., 1999; Wilkinson and Landreth, 2006), whereas activation of the CLIC1 current reduces the depolarization. In current-clamp experiments (Fig. 1d,e), 50 μm Aβ25–35 caused a depolarization of the more polarized group of BV2 cells (see Materials and Methods) from a mean resting potential of −67 ± 2 mV to a new stable plateau of −45.9 ± 4.5 (n = 21). The membrane potential was then further depolarized by addition of 50 μm IAA94 to inhibit CLIC1 to a new value of −19.6 ± 3.2 mV (n = 21). This effect was completely reversible on washout of the IAA94 (Fig. 1d) (n = 8). The depolarization caused by the CLIC1 channel blocker was not mimicked by perfusion of the proton channel inhibitor, ZnCl (3 mm) (Fig. 1e) (n = 5). Thus, the CLIC1 conductance clamps the membrane potential toward ECl, limiting the membrane depolarization that results from activation of the electrogenic NADPH oxidase.
We have previously confirmed that the IAA94-sensitive membrane current is specifically associated with the functional expression of the CLIC1 channel at the plasma membrane (Novarino et al., 2004). In occlusion experiments, pretreatment with IAA94 prevented the effect of Aβ on both components (n = 7; data not shown), suggesting that the DIDS-sensitive current is dependent on prior activation of the IAA-94-sensitive component. The DIDS-sensitive component of the Aβ-dependent current is probably a consequence of the change in cell shape and volume that accompany microglial activation (Eder et al., 1998; Ducharme et al., 2007).
Because the IAA-94 sensitive (and DIDS-insensitive) component is specifically associated with the functional expression of the CLIC1 channel, we conclude that stimulation with Aβ rapidly generates a CLIC1-mediated current in the microglial membrane (Novarino et al., 2004). Because the CLIC1-mediated current is likely to result from the insertion of CLIC1 directly into the membrane from its cytoplasmic environment, we explored CLIC1 translocation using confocal imaging.
CLIC1 translocates acutely from the cytosol to the microglial membrane in response to Aβ and within AD mouse brain
It has been suggested that CLIC1 can translocate directly from the aqueous phase into artificial lipid bilayers (Tulk et al., 2002; Warton et al., 2002). This rapid translocation can be demonstrated in microglial cells in real time, in response to Aβ, and again suggests a primary role for CLIC1 in altering microglial function in the presence of the peptide. CLIC1 movement was studied using a CLIC1-eGFP construct in live BV2 cells. Aβ-induced translocation of CLIC1-eGFP to the membrane is illustrated in Figure 2a, which shows images of a single cell before and ∼1 h after exposure to Aβ25–35. Quantification of membrane-associated fluorescence (see Materials and Methods) showed that the ratio of membrane-associated signal to cytosolic signal was significantly increased from 0.97 ± 0.02 (n = 14 cells) in untreated cells to 2.05 ± 0.1 (n = 14 cells unpaired; p < 0.01) after Aβ25–35 exposure.
Figure 2.
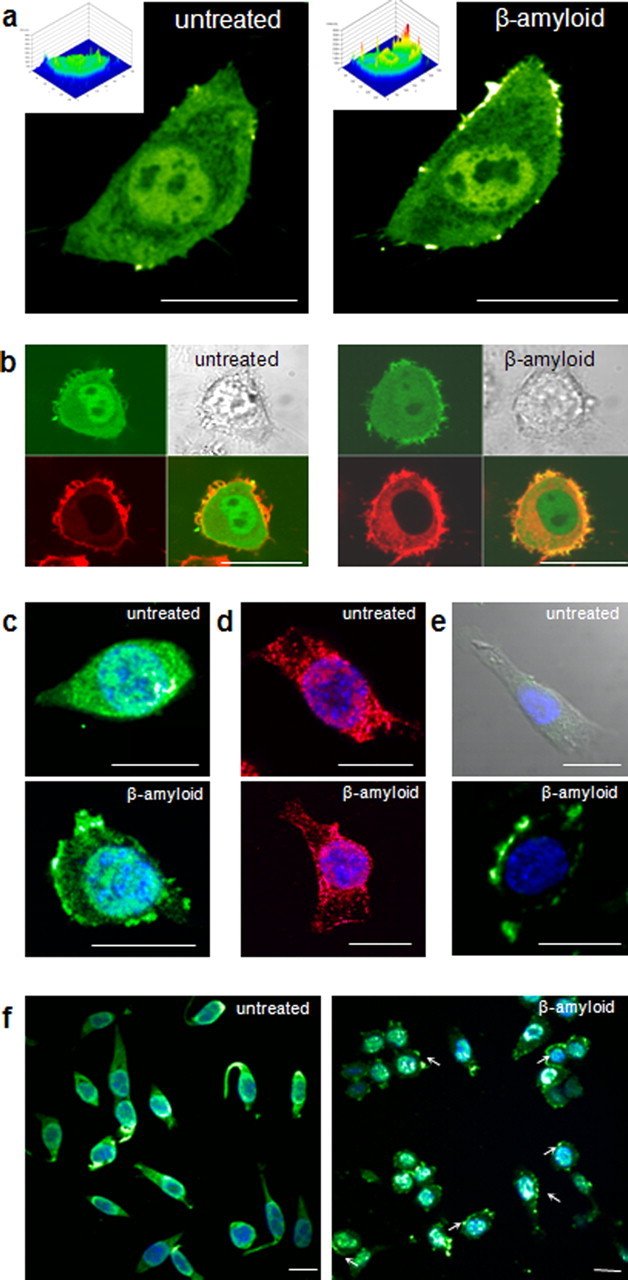
The CLIC1 protein translocates to the cell membrane during acute exposure to Aβ peptides. a, A BV2 microglial cell transfected with a CLIC1-eGFP fusion protein, shown before (left) and after (right) stimulation with 50 μm Aβ25–35. Three-dimensional plots of GFP fluorescence distribution (insets) highlight the increased fluorescence concentrated on the plasma membrane and around the nucleus in the presence of Aβ. Group data showed that in the presence of Aβ, the ratio of CLIC1-eGFP in the membrane relative to the cytoplasm is significantly increased (n = 28 cells; p < 0.001; Mann–Whitney). b, A CLIC1-eGFP-transfected cell labeled with the membrane marker DiIC12 (red) treated with Aβ, showing colocalization of green and red fluorescence in the membrane after treatment (right). Overall, CLIC1-GFP/DiIC12 fluorescence showed a significant increase in colocalization within the cell membrane region after Aβ exposure (n = 7 cells; p ≤ 0.01, paired t test). c, d, Immunofluorescence of permeabilized BV2 cells using antibodies against CLIC1, both commercially sourced (c; green) and laboratory generated (d; red), in untreated cells (top) and confirming the membrane localization of CLIC1 after stimulation with Aβ25–35 for 1 h before fixation (bottom). Cells were also stained with DAPI (blue). The ratio of CLIC1 immunofluorescence signal in the membrane to that in the cytoplasm was significantly increased by Aβ (n = 10 cells in each condition from different coverslips; p < 0.001, Mann–Whitney and independent samples t test, respectively, see Results). e, Unpermeabilized BV2 cells were probed using an antibody to the extracellular N terminus of CLIC1; untreated cells exhibited no immunoreactivity (top), whereas the resulting immunoreactivity in Aβ-treated cells (bottom) confirmed the membrane localization of CLIC1. For the untreated cell (top), the transmitted light image has been added to delineate the cell borders where fluorescence might be expected but is absent. f, Lower magnification images showing CLIC1 distribution in untreated (left) and Aβ-treated cells (right) stained using a laboratory-generated antibody to CLIC1. Some examples of regions of membrane staining have been indicated with arrows. Scale bars, 20 μm.
The fluorescence distribution seen in CLIC1-eGFP transfected cells treated with Aβ was also significantly different from that seen in untreated CLIC1-eGFP transfected cells over the same time period (ratio of 1.14 ± 0.11; n = 4 cells; p < 0.001) and sham transfected cells (empty vector) treated with Aβ (ratio of 0.88 ± 0.02; n = 4 cells; p < 0.001).
To confirm that the CLIC1-eGFP was specifically localized to the membrane after Aβ treatment, transfected cells were colabeled with DiIC12, a lipophilic membrane-specific fluorescent dye (Fig. 2b). Quantification of the colocalization of the CLIC1-eGFP (green) and DiIC12 (red) signals in the cell membrane area gave a mean correlation coefficient (r) which increased from 0.04 ± 0.06 before treatment to 0.44 ± 0.08 in the presence of Aβ (n = 7 cells; paired p = 0.01), clearly demonstrating the rapid Aβ-induced increase in the specific membrane localization of the CLIC1 protein.
Immunofluorescence studies verified the translocation of endogenous CLIC1 (in untransfected cells) to the membrane. Cells were treated with Aβ25–35 or vehicle for 1 h before fixation, permeabilization, and staining with antibodies to the CLIC1 protein and DAPI. After treatment with Aβ, the membrane region showed more than twice the level of fluorescent immunoreactivity of the cytoplasm, using either commercially available (Fig. 2c, bottom) or custom-generated antibodies (Fig. 2d, bottom). Membrane:cytoplasm fluorescence ratios were 2.79 ± 0.4 and 2.10 ± 0.2 using commercial and custom antibodies, respectively, significantly higher than in untreated cells (Fig. 2c,d, top) in which the ratios were 1.10 ± 0.1 and 0.73 ± 0.3 (p < 0.01; n = 40 cells total). Nonpermeabilized BV2 cells were exposed to a polyclonal antibody against the extracellular N terminus of CLIC1 (Fig. 2e). Aβ-treated cells (2e, bottom) clearly exhibited CLIC1-NH2 immunoreactivity at the plasma membrane, which was negligible in untreated cells (Fig. 2e, top). In lower magnification images (Fig. 2f), CLIC1 distribution in untreated (left) and Aβ-treated (right) cells is revealed by a laboratory-generated antibody to the protein. Several treated BV2 cells show that CLIC1 translocation to the plasma membrane is a common response to Aβ.
Localization of CLIC1 was also examined in brain sections from triple-mutant 3×Tg-AD mice (Oddo et al., 2003). With aging, these transgenic mice develop amyloid deposits, detectable with thioflavin S staining, which are absent in their wild type (WT) littermates (Fig. 3a,b). Immunostaining revealed that CLIC1 is strongly expressed in microglial cells, identified by the binding of LEA, in brain sections of both transgenic and WT mice at 18 months of age. In 3×Tg-AD mice, however, microglial cells were more numerous than in WT mice (elevated by 42 ± 8%; n = 3 sections from 3 mice) and showed a higher level of CLIC1 immunostaining (Fig. 3c,d). Microglia cells in 3×Tg-AD brain show different morphology (Streit, 2005). In WT samples (Fig. 3e–g), microglia cells are characterized by a ramified phenotype and CLIC1 immunoreactivity was present only in the cytosol (Fig. 3e,g). 3×Tg-AD model microglia show two morphologically distinct cell types: “activated” microglia, characterized by shorter ramifications than WT, and round “phagocytic” microglia. Activated microglia, in addition to cytoplasmic presence, show CLIC1 immunoreactivity in several segments of the plasma membrane (Fig. 3h). In phagocytic microglia, the distribution of CLIC1 was more prominent in the cell membrane (Fig. 3i–l).
Figure 3.
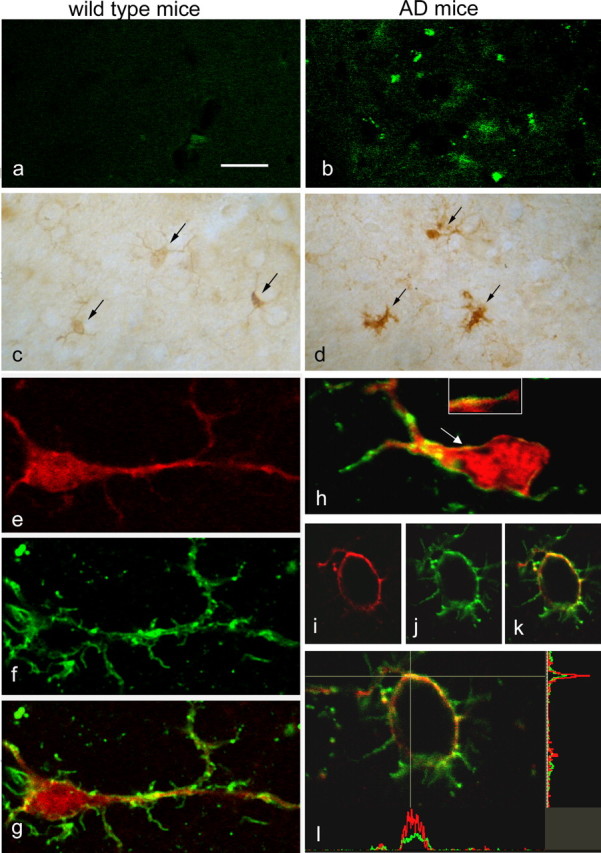
CLIC1 is expressed in microglial cells in wild-type aged mice and in the microglial cell membrane in an AD mouse model. a, b, At 18 months of age, thioflavin S staining reveals amyloid deposits (green spots) only in the brain of 3×TgAD mice (b). c, d, Immunoperoxidase labeling shows a more intense CLIC1 staining in cells morphologically identifiable as microglia (arrows) in AD mice (d) compared with wild type controls (c). e–l, Immunofluorescence double labeling shows that CLIC1 (e, h, i, l; red) is expressed in cells identified as microglia by their binding of LEA (f, h, j, l; green); g, h, k, l, Merged images. CLIC1 labeling is diffuse in ramified resting microglia from control mice (e–g; 9 positive cells of 75 analyzed; n = 3 mice), whereas in AD mice (h–l), it is present also in the cell membrane of activated microglia (arrow and inset in h) and of round phagocytic microglia (I–l; 65 positive cells of 84 analyzed; n = 3 mice). l, The enlargement of the cell shown in k is accompanied by intensity profiles along the horizontal and vertical lines demonstrating enrichment of CLIC1 labeling in the membrane stained by LEA. Scale bars: a–d, 25 μm; e–k, 10 μm; l, 8 μm.
CLIC1-NH2-FLAG shows the acute membrane insertion and channel function of the protein in response to Aβ
We used CLIC1 tagged at its N terminus with a FLAG epitope, combined with anti-FLAG-m2 antibodies, to demonstrate that Aβ causes CLIC1 to indeed span the membrane, because the anti-FLAG identifies the N terminus exposed extracellularly. BV2 cells were transfected with a pIRES2-eGFP CLIC1-NH2-FLAG construct (see Materials and Methods). Fluorescent anti-m2 antibodies were used in live intact cells to confirm the membrane-spanning translocation of the CLIC1-NH2-FLAG after exposure to Aβ25–35 (Fig. 4a–d). Binding of the anti-m2 Cy3 conjugate antibody was only seen in GFP-expressing cells after Aβ treatment (Fig. 4a–c).
Figure 4.
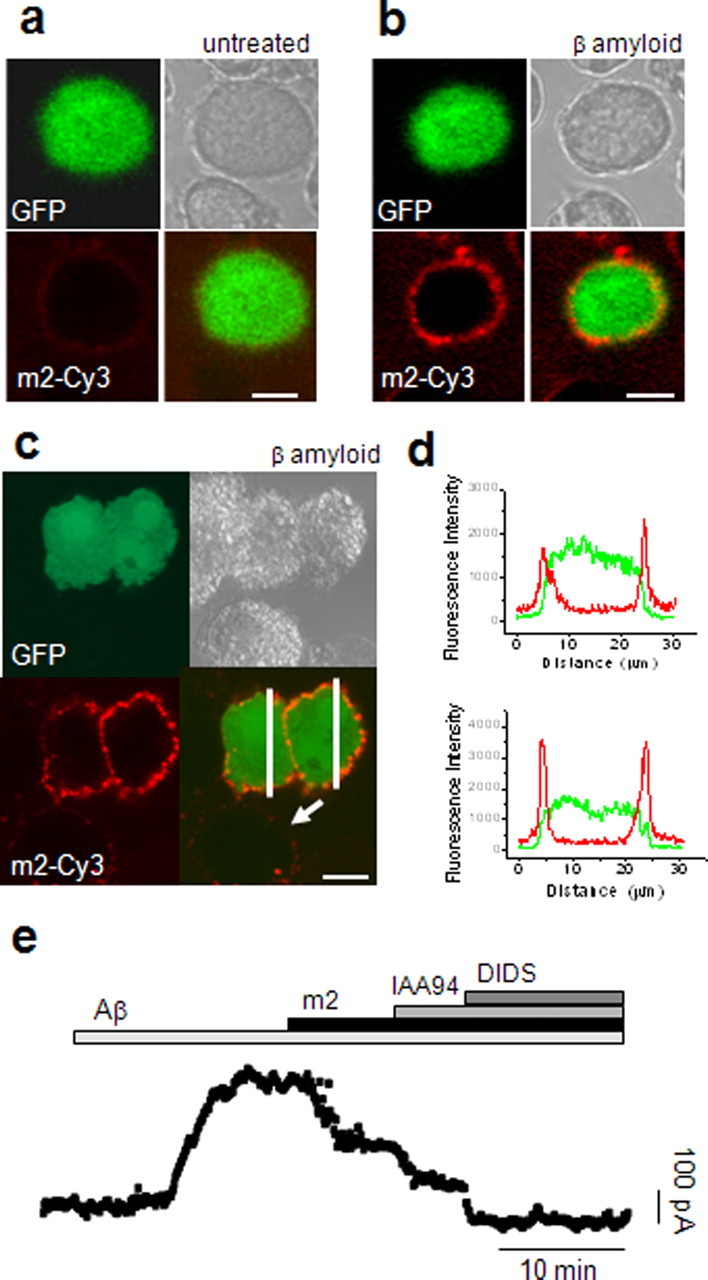
a–d, CLIC1 with an N terminus FLAG epitope forms a functional channel in the presence of Aβ. BV2 cells were transfected with a CLIC1 protein tagged with a FLAG epitope at the N terminus. a, b, Images acquired before (a) and after (b) treatment with Aβ in the presence of the anti-m2 Cy3-conjugated antibody demonstrate the movement of the FLAG epitope to the plasma membrane. A further example is shown in c, where fluorescence intensities along the lines drawn in the bottom right panel are graphically represented in d. After treatment with Aβ, profiles of fluorescence intensity highlight the Aβ-induced increase in anti-m2-Cy3 binding to CLIC1-FLAG at the cell membrane. Scale bar, 10 μm. e, The Aβ-induced membrane current in CLIC1-FLAG-transfected cells was reduced by application of the anti-FLAG antibody. IAA94 and DIDS caused a further reduction in current blocking the endogenous conductances. The average current after m2 antibody (171.8 ± 18.8 pA) compared with the average control current triggered by Aβ (321.7 ± 26.8 pA) was significantly reduced (n = 7; p < 0.001, independent samples t test).
The same anti-m2 antibody was then used to explore the contribution of the CLIC1 channel to the Aβ-induced membrane current, using perforated-patch recordings, as above (Fig. 4e). The Aβ-induced current was reduced by a mean of 46.7% (n = 7; p < 0.001) after application of the antibody. Any residual CLIC1-mediated current in the presence of m2 (seen as the IAA94 sensitive component in Fig. 4e) is likely to be attributable to endogenous (untagged) CLIC1.
CLIC1 is required for Aβ-induced microglial ROS production
We hypothesized that the translocation of CLIC1 could be linked to other aspects of Aβ-induced microglial activation, specifically to NAPDH (NOX2) oxidase function. Production of superoxide (O2*−) by NOX2 is electrogenic (Henderson et al., 1987). If the charge generated by NOX2 activity is not compensated, enzyme activity becomes limited by the membrane depolarization (Henderson et al., 1987; DeCoursey et al., 2003). Because any functional membrane conductance will inevitably provide a route for current flow, we hypothesized that CLIC1-mediated conductances might therefore modulate NOX2 function. To examine the impact of CLIC1 translocation and currents on ROS production by NOX2, we used HEt to measure the rate of ROS generation in response to Aβ. HEt is oxidized to a fluorescent product by ROS, such that the rate of fluorescence increase is a function of the rate of ROS generation (Bindokas et al., 1996; Abramov et al., 2005).
Exposure to Aβ25–35 (50 μm) increased the rate of ROS generation by 2.18 ± 0.1-fold in BV2 cells (Fig. 5c,e) (n = 196 cells; 5 coverslips; p < 0.01) and 2.04 ± 0.1-fold in PMG cells (Fig. 5d,e) (n = 134 cells; 6 coverslips; p < 0.01). Aβ1–42 (5 μm) had a similar effect in BV2 cells, with an increased rate of HEt oxidation of 2.26 ± 0.06-fold over basal (Fig. 5e) (n = 196 cells; 5 coverslips; p < 0.01). No significant increases were seen in the rate of ROS production when cells were treated with the inactive reverse peptide (Aβ35–25; n = 129 cells from 3 coverslips; p = 0.399). Interestingly, the divergence of the Aβ stimulated response from baseline was delayed by 5–10 min after application of the Aβ, showing a similar time course to the CLIC1-mediated current (Fig. 5a,b). ROS generation by both BV2 and PMG cells in response to Aβ25–35 was significantly hampered by IAA94 (Fig. 5e). The activated:baseline ratios were just 1.33 ± 0.05 (n = 128 cells; 4 coverslips; p < 0.01) in BV2 cells and 1.34 ± 0.04 (n = 145 cells; 4 coverslips; p < 0.01) in PMG cells and only 1.64 ± 0.05 (n = 146 cells; 5 coverslips; p < 0.01) in BV2 cells treated with Aβ1–42. Thus, the rate of ROS production is strongly dependent on CLIC1 function in both BV2 and PMG in response to Aβ.
Figure 5.
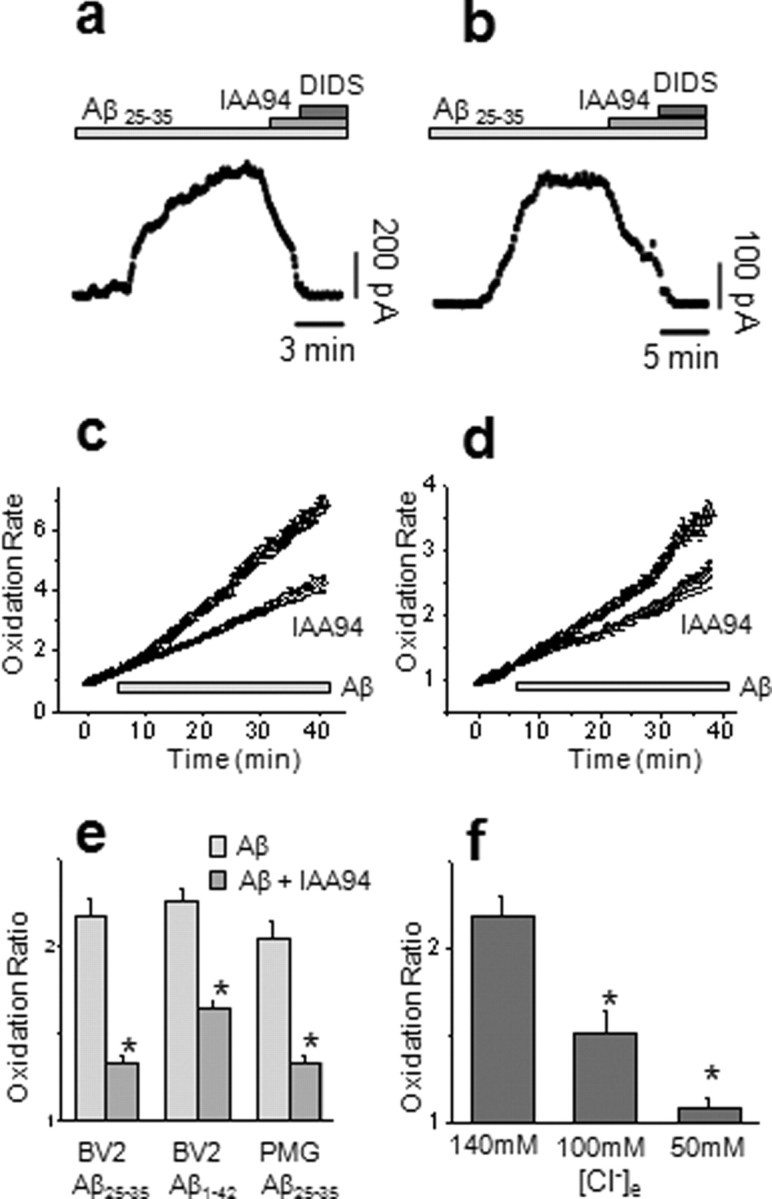
CLIC1 is required for Aβ-induced microglial ROS production. a, b, Treatment of BV2 (a) and primary rat (b) microglia cells with Aβ25–35 promotes a membrane current partially blocked by IAA94 and by DIDS. c, d, BV2 (c) and primary rat (d) microglia cells respond to Aβ with an increase in ROS production, measured as an increase in the rate of change of fluorescence derived from HEt oxidation (triangles 37 and circle 31 cells, respectively). Blockade of CLIC1 by IAA94 (50 μm) prevented the Aβ-induced ROS production (circles, 37 and 26 cells, respectively). The solid black line represents an extrapolation of the baseline. e, IAA94 (50 μm; shaded columns) significantly inhibited the ROS responses (mean ± SEM) of BV2 cells to both Aβ25–35 (50 μm) and Aβ1–42 (5 μm); control (Aβ25–35) n = 196 and (Aβ1–42) n = 196 cells, respectively, IAA94, n = 128 and 146 cells. The response of PMG cells was similarly modulated [n = 134 cells (Aβ25–35) and n = 145 cells (Aβ25–35) with IAA94; *p < 0.001, Mann–Whitney]. f, Replacement of extracellular Cl− ions with methanesulphonate significantly inhibited Aβ-induced microglial ROS production (n = 196, 149, and 130 cells, respectively; *p < 0.001, Mann–Whitney).
The data shown above and previous electrophysiological studies of the CLIC1 conductance suggest that the main permeant ion is chloride. We therefore replaced extracellular chloride with the impermeant ion, methanesulphonate (Fig. 5f), and found a dose-dependent relationship between extracellular chloride concentration and ROS production. Partial replacement of Cl− with 56 mm sodium methanesulphonate reduced the activated:baseline ratio of HEt fluorescence in response to Aβ25–35 to 1.54 ± 0.10-fold (n = 149 cells; 4 coverslips; p < 0.01). A further reduction in chloride (100 mm sodium methanesulphonate) reduced the activated:baseline ratio to just 1.06 ± 0.06-fold (n = 130 cells; 4 coverslips; p < 0.001). These data emphasize the importance of the CLIC1-mediated chloride conductance in microglial ROS generation in response to Aβ.
Suppression of the CLIC1 conductance with antibody and with siRNA confirms the specific requirement for the CLIC1 conductance in ROS production
In a similar manner to the anti-m2 antibody, an antibody against the native extracellular N terminus of native CLIC1 reduces the membrane chloride current (Fig. 6). After activation of the Aβ-induced current in perforated-patch whole-cell recordings from rat PMG cells (Fig. 6a), perfusion with the CLIC1 antibody significantly reduced the average current amplitude by 52% (n = 8; p < 0.001). The current was unaffected by control purified sheep IgG (n = 6). Not only did the antibody to the CLIC1 N terminus reduce the current, it also inhibited microglial Aβ-induced ROS production. The oxidation of HEt after exposure of PMGs to Aβ in the presence of the antibody was reduced relative to the control increase (2.04 ± 0.11-fold) to 1.37 ± 0.06-fold (activated:baseline ratio; n = 89 cells; 4 coverslips; p < 0.01).
Figure 6.
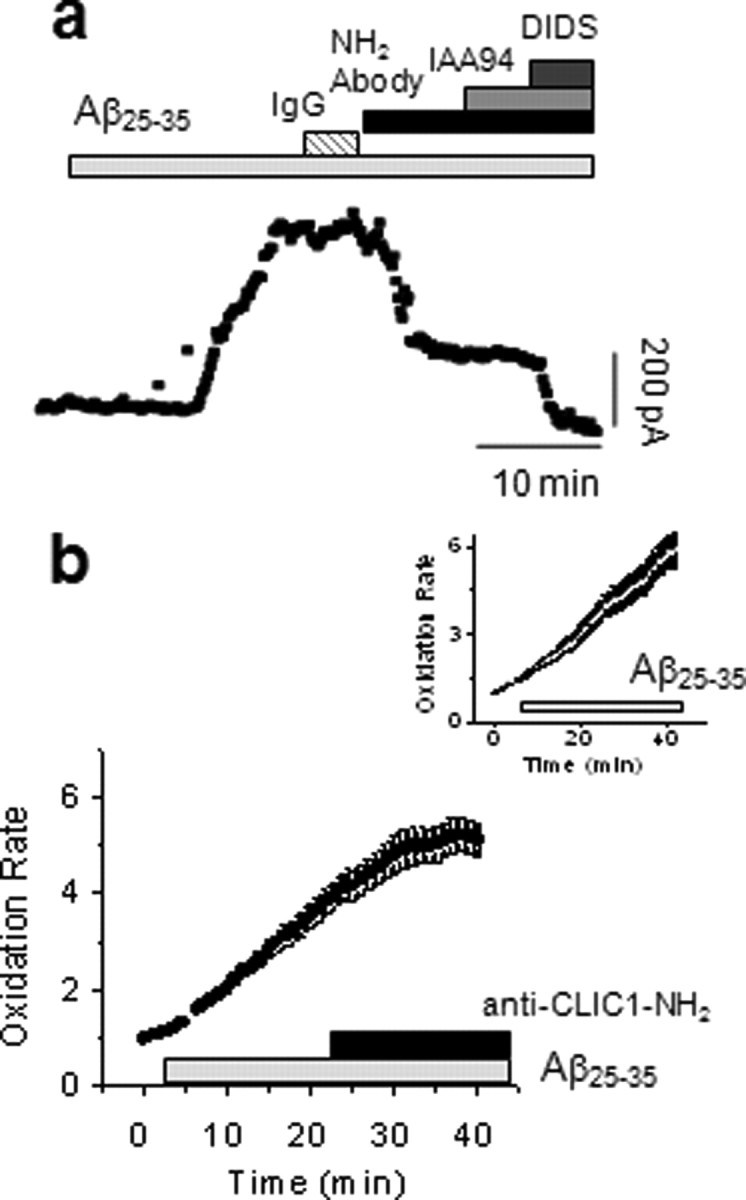
Anti-CLIC1 antibodies inhibit both the anion current and ROS production by Aβ-stimulated microglia. a, The Aβ-induced increase in membrane current was insensitive to purified sheep IgG (n = 6), but was reduced by application of the CLIC1-NH2 specific antibody, after which IAA94 did not reduce the current further. The residual current was blocked by DIDS. The amplitude of the average current after Aβ was 365.3 ± 18.8 pA and was reduced significantly by the anti-CLIC1 antibody to 153.8 ± 11.8 pA (n = 8; p < 0.001, independent samples t test). b, Addition of the antibody 20 min after Aβ-induced activation inhibited established ROS production. Control cells (inset) showed a 67.4 ± 22% increase in the rate of HEt oxidation between 10–20 and 20–30 min periods (n = 134 cells). Addition of the anti-CLIC1 antibody at 20 min significantly reduced the rate, which instead of increasing, now decreases by 16.2 ± 8% (mean ± SEM; n = 38 cells; p < 0.001, Mann–Whitney).
Addition of the antibody also stopped ROS production in cells which had previously been activated (Fig. 6b). In the presence of Aβ alone, the rate of ROS production increases, but subsequent addition of the CLIC1 antibody actually causes a decrease. During exposure to Aβ only, the rate of ROS generation was higher after 20–30 min than it was during the 10–20 min period (+69.3 ± 22%) (Fig. 6b, inset). However, addition of CLIC1 antibody at the 20 min time point after Aβ resulted in a significant decrease in the slope (−16.2 ± 8%; n = 38 cells from 2 coverslips; p < 0.01), relative to the slope over the previous time points.
Transfection of BV2 cells with siRNA results in a significant downregulation of the CLIC1 protein (Fig. 7a). In microglial cells treated with the siRNA, the Aβ-induced current was significantly reduced by an average of 44% (n = 8; p < 0.01) (Fig. 7b) compared with control cells transfected with the pAAV 2.1-CMV eGFP alone (n = 8). Aβ-induced ROS generation in response to Aβ25–35 was also significantly reduced by CLIC1 siRNA, compared with neighboring untransfected cells (Fig. 7c,f,h). The increased rate of HEt oxidation induced by Aβ25–35 in the siRNA transfected cells was only 1.67 ± 0.09-fold (n = 125 cells; 8 coverslips) compared with 2.34 ± 0.06-fold in the neighboring control cells (n = 309 cells; p < 0.001) (Fig. 7c,f); the same effect was seen using Aβ1–42 (Fig. 7d). Sham transfection of BV2 cells caused no significant difference in the ROS response to Aβ compared with adjacent untransfected cells (ratio of stimulated:basal HEt signal was 2.49 ± 0.19, n = 91 transfected cells from 6 coverslips and 2.40 ± 0.09, n = 168 untransfected cells from 6 coverslips, respectively; p = 0.883) (Fig. 7e). The rates of ROS production in the untransfected cells under each transfection condition were not significantly different (p = 0.551). Consistent with the above results, CLIC1 levels at the cell membrane in siRNA transfected cells were lower than in control cells (Fig. 7g). The difference in the ROS response to Aβ after transfection with CLIC1 siRNA is highlighted by the reduced levels of HEt fluorescence (right panel) in cells transfected with the CLIC1 siRNA (green cells, left panel) compared with neighboring untransfected cells (Fig. 7h).
Figure 7.
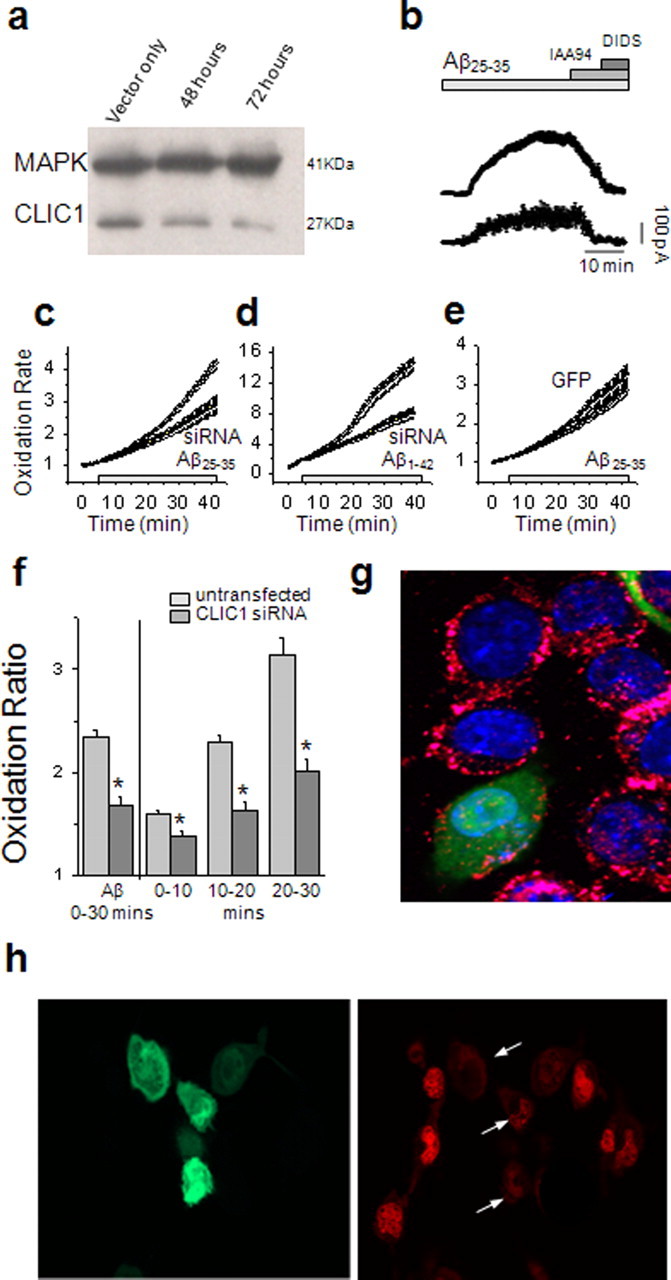
Suppression of CLIC1 expression with siRNA reduces both CLIC1 membrane current and the rate of Aβ-induced ROS generation. a, Western blotting shows that CLIC1 protein expression is decreased in BV2 cells treated with siRNA. b, The averaged time course of the Aβ1–42-induced membrane current in BV2 cells transfected with the pAAV-2.1 eGFP alone and siRNA eGFP plasmid. In the plateau region, the amplitude of the siRNA current was 124.2 ± 39.5, significantly reduced from a control current of 214.2 ± 0.9 pA (n = 8; p < 0.01, independent samples t test). c, d, HEt traces showing that ROS production by BV2 cells in response to Aβ25–35 (c) and Aβ1–42 (d) was significantly reduced after suppression of CLIC1 expression by siRNA, compared with neighboring untransfected cells. e, Cells transfected with the empty vector (pAAV-2.1-eGFP) were not significantly different from untransfected cells. f, The ratio of Aβ-induced ROS production to baseline levels was significantly reduced in siRNA-transfected cells (dark shaded columns) compared with neighboring untransfected cells (mean ± SEM; n = 125 transfected cells, 309 untransfected cells, 8 coverslips; *p < 0.01 Kruskal–Wallis and post hoc Mann–Whitney with Bonferroni correction). g, Immunofluorescence demonstrates that cells expressing CLIC1 siRNA show reduced CLIC1 expression on the plasma membrane after treatment with Aβ, compared with untransfected cells. h, BV2 cells transfected with the CLIC1-siRNA (pAAV 2.1-CMV eGFPsiUbclic1B) were exposed to 50 μm Aβ25–35 for 40 min in the presence of the ROS indicator HEt, when this image was acquired as the final image of a time sequence. The CLIC1 siRNA-expressing cells (green, left) exhibit reduced levels of HEt fluorescence (red, right, transfected cells indicated by the arrows) compared with surrounding untransfected cells.
CLIC1 function is not only required for ROS production but is also activated by oxidants and by NADPH oxidase activity
The membrane insertion and channel activity of CLIC1 seem crucial for generation of ROS by microglial NOX2. However, the ability of CLIC1 to associate directly with the membrane itself likely depends on a redox controlled structural transition (Littler et al., 2004).
The NADPH oxidase inhibitor DPI (1 μm) inhibited the ROS response to Aβ as expected (the HEt signal after Aβ was not significantly different from baseline; p = 0.205; 135 cells from 3 coverslips), confirming that the ROS response is attributable to the NADPH oxidase (Fig. 8a). Remarkably, in perforated-patch experiments, the presence of DPI diminished the increase in CLIC1-mediated current in response to Aβ (Fig. 8b). The membrane current in the presence of DPI showed a mean increase of only 85 ± 10 pA (n = 23), significantly reduced (p < 0.01) when compared with the control current of 394 ± 22 pA (n = 21). We therefore tested the impact of prooxidant stimuli on CLIC1 channel activity (Fig. 8c,d). Application of either the prooxidants H2O2 (100 μm) or tBOOH (500 μm) caused the increase of an outward current as after the stimulation with the bacterial endotoxin LPS (5 μm), the protein kinase C activator PMA (1 μm) or Aβ25–35 (Fig. 8c). The currents could again be separated into two components: the first sensitive to the CLIC1 blocker IAA94 and the second to DIDS. H2O2 and tBOOH on average activated more total membrane current than LPS, PMA, or Aβ (Fig. 8d).
Figure 8.

Prooxidants are required to promote the CLIC1 anion current in microglial cells. a, The ROS production induced by 50 μm Aβ25–35 was significantly reduced by the NOX2 inhibitor DPI, measured using HEt. b, Inhibition of NOX2 by DPI also inhibited the Aβ-induced increase in CLIC1 conductance. The maximum amplitude reached by the averaged current in the presence of Aβ25–35 and DPI 1 μm (black trace; n = 23) was significantly reduced compared with the current normally induced by Aβ25–35 (gray trace; n = 21; p < 0.01, independent samples t test). c, Perforated-patch membrane current time course recordings of BV2 cells stimulated with an array of prooxidant compounds. From top to bottom, BV2 cells were perfused with 100 μm peroxide, 500 μm tBOOH, 5 μm LPS, 5 μm PMA, or 50 μm Aβ25–35. The peak currents are quantified in d. The number of experiments is given above each bar.
These data together argue strongly that activation of the CLIC1 current requires prior activation of the NADPH oxidase and lead us to suggest a model whereby activation of the NADPH oxidase promotes oxidation of cytosolic CLIC1, which translocates to the membrane, generating a Cl− conductance. The conductance then provides a route for charge compensation that supports activity of NADPH oxidase. The model suggests that the redox regulation of CLIC1 localization and function together permit sustained ROS generation by the NADPH oxidase in microglia activated by Aβ.
Discussion
ROS generation and the resultant oxidative stress in the CNS are believed to constitute a major mechanism underlying the neurodegeneration in Alzheimer's disease and other disorders (McDonald et al., 1997; Butterfield and Boyd-Kimball, 2004; Abramov and Duchen, 2005). Activation of the NADPH oxidase (NOX2) in both astrocytes and microglia seems to represent the major source of ROS generation in response to Aβ accumulation (Abramov et al., 2005; Qin et al., 2005). Several significant findings have emerged from the current study. Perhaps of most importance, we have shown that the CLIC1-mediated chloride conductance is required for sustained microglial ROS generation. This finding suggests that CLIC1 represents a novel potential therapeutic target in AD. Where inhibitors of the NADPH oxidase risk global immunosuppression, targeting the enzyme through modulation of CLIC1 offers a new approach to this problem (Qin et al., 2002, 2006; Abramov and Duchen, 2005; Wilkinson and Landreth, 2006; Block et al., 2007).
The data presented here throw light on the fundamental cell biology of the microglial NADPH oxidase. The extrusion of electrons across the membrane to generate superoxide develops a potential across the membrane. The depolarization will impose bioenergetic limits on the enzyme activity and thus curtail ROS generation if there is no route for charge compensation (Henderson et al., 1987; Bankers-Fulbright et al., 2003; Rada et al., 2005). Although several ion channels have been ascribed this role in other cell types, an issue that has proven highly controversial (DeCoursey, 2003; Ahluwalia et al., 2004), it is evident that any functional conductance in the membrane during NOX2 activity will inevitably contribute to setting the membrane potential. Our data demonstrate that the chloride conductance generated by CLIC1 insertion into the plasma membrane clamps the membrane potential close to ECl, providing a mechanism that offsets the electrogenic activity of the enzyme and thus supports the sustained generation of ROS by the oxidase.
The experiments in both voltage clamp and current clamp show the predominance of this ionic pathway during microglial activation by Aβ (Fig. 1). Among candidate compensation channel proteins, microglia express greater levels of CLIC1 mRNA than ClC3, ICln, ClC2 and Kv1.3 mRNA (Ducharme et al., 2007). The specific role of CLIC1 may well have been over-looked previously, because of its sensitivity to cytoplasmic washout in patch-clamp recordings and the requirement for perforated patch-clamp techniques. The role of CLIC1 may be specifically linked to Aβ exposure, because there is some evidence that different NOX2-activating stimuli elicit different compensatory mechanisms in microglia (Thomas et al., 2007). It is clear, however, from the present study that the CLIC1-mediated chloride conductance represents the major mechanism for charge compensation in microglial exposed to Aβ, and it clearly plays a central role in the regulation of Aβ-induced microglial NADPH oxidase function. The increased presence of CLIC1 in microglial cell membranes seen within section from 3×Tg-AD mouse brain associates CLIC1 with Aβ pathology. This work thus provides an insight into AD pathophysiology while addressing the fundamental issue of regulation of ROS generation by the NADPH oxidase.
We also described some fascinating properties of the recently discovered but poorly understood CLIC1 protein. Although CLIC proteins are widely expressed, their functional roles have remained obscure. We have shown that Aβ causes the rapid redox dependent translocation of CLIC1 from the cytoplasm to insert into the cell membrane where it functions as a chloride channel. Thus, the Aβ-induced activation of the CLIC1 current requires NOX2 activity, while exogenous prooxidant stimuli also promote the CLIC1 current. We therefore propose a novel feedforward mechanism, whereby activation of the oxidase and resultant ROS production promotes a redox-controlled structural transition of CLIC1 and promotes its insertion into the membrane where it carries an anion conductance. The increase in CLIC1-mediated chloride conductance then facilitates ROS generation by NOX2 by providing a conductance that offsets the membrane potential change generated by NOX2 activity and permitting sustained ROS generation by the oxidase (Henderson et al., 1987; Bankers-Fulbright et al., 2003; Rada et al., 2005).
Microglial NOX2-derived ROS are strongly implicated in neurodegeneration; oxidative stress is known to cause widespread damage to lipids (Ambroggio et al., 2005), proteins (Butterfield et al., 2006), and DNA (Lovell and Markesbery, 2007) and may alter neuronal function and cause cell death. Neurons are particularly vulnerable to oxidative stress because of their low antioxidant capacity (Dringen et al., 2000) and high metabolic requirements (Attwell and Laughlin, 2001). It is worth mentioning that, although the overall contribution of microglia and macrophages might be positive, or at least complex and somewhat ambivalent, in AD, the role of microglial-derived ROS is almost certainly negative (Hanisch and Kettenmann, 2007). ROS have been implicated extensively in Aβ-induced microglial-mediated neurotoxicity and synaptic dysfunction (Wang et al., 2004; Qin et al., 2005), and Aβ-induced NADPH oxidase-derived ROS also impair cerebral blood flow (Park et al., 2005). In microglia, the ROS produced by NADPH oxidase are not only thought to have a direct impact on surrounding cells but are also required as a signal for microglial proliferation through regulation of TNFα production (Jekabsone et al., 2006) and promotion of further signaling cascades (Qin et al., 2004). The present results go some way toward explaining the mechanism through which CLIC1 inhibition reduces microglial proliferation and TNFα production (Novarino et al., 2004), which we have shown previously; we have now identified CLIC1 regulation of ROS as a potential signaling mechanism controlling these functions. Other roles of CLIC1, for example in the cytosol or intracellular membranes, are not yet understood and may add further dimensions to this account.
Despite a massive research effort, effective treatments and targets for AD remain elusive. The inexorable neurodegeneration has been linked to the inflammatory response because high levels of inflammatory markers correlate with neuronal loss (Lue et al., 2001) and cognitive decline (Parachikova et al., 2007) in AD patients. The inflammatory response is, however, complex and only harmful when misdirected. Inhibition of ROS production through direct global inhibition of the NADPH oxidase could prove undesirable, therefore, given the many important roles of the enzyme in physiology and in antibacterial defense. We have shown previously that CLIC1 is implicated in microglial-mediated Aβ-induced neurotoxicity (Novarino et al., 2004); it is now clear that CLIC1 has a specific role in the initiation and facilitation of microglial ROS production and, therefore, represents an ideal and novel therapeutic target to counteract the neurodegeneration in AD.
Footnotes
This work was supported by the Wellcome Trust, the Ministero dell'Istruzione e della Ricerca Scientifica, Progetti di Ricerca di Interesse Nazionale Funds to M.M., and by Centro Interdipartimentale di Microscopia Avanzata, Milan, Italy. R.H.M. is in the 4 year PhD program in Neuroscience at UCL. We are grateful to S. Sensi and F. La Ferla for providing the AD mouse model. We thank A. Y. Abramov for initiating the experiments in amyloid-induced ROS production and R. Tonini for critical reading of this manuscript. The Duchen and Mazzanti labs contributed equally to this work.
References
- Abramov AY, Duchen MR. The role of an astrocytic NADPH oxidase in the neurotoxicity of amyloid beta peptides. Philos Trans R Soc Lond B Biol Sci. 2005;360:2309–2314. doi: 10.1098/rstb.2005.1766. [DOI] [PMC free article] [PubMed] [Google Scholar]
- Abramov AY, Canevari L, Duchen MR. Changes in intracellular calcium and glutathione in astrocytes as the primary mechanism of amyloid neurotoxicity. J Neurosci. 2003;23:5088–5095. doi: 10.1523/JNEUROSCI.23-12-05088.2003. [DOI] [PMC free article] [PubMed] [Google Scholar]
- Abramov AY, Jacobson J, Wientjes F, Hothersall J, Canevari L, Duchen MR. Expression and modulation of an NADPH oxidase in mammalian astrocytes. J Neurosci. 2005;25:9176–9184. doi: 10.1523/JNEUROSCI.1632-05.2005. [DOI] [PMC free article] [PubMed] [Google Scholar]
- Ahluwalia J, Tinker A, Clapp LH, Duchen MR, Abramov AY, Pope S, Nobles M, Segal AW. The large-conductance Ca2+-activated K+ channel is essential for innate immunity. Nature. 2004;427:853–858. doi: 10.1038/nature02356. [DOI] [PMC free article] [PubMed] [Google Scholar] [Retracted]
- Ambroggio EE, Kim DH, Separovic F, Barrow CJ, Barnham KJ, Bagatolli LA, Fidelio GD. Surface behavior and lipid interaction of Alzheimer beta-amyloid peptide 1–42: a membrane-disrupting peptide. Biophys J. 2005;88:2706–2713. doi: 10.1529/biophysj.104.055582. [DOI] [PMC free article] [PubMed] [Google Scholar]
- Attwell D, Laughlin SB. An energy budget for signaling in the grey matter of the brain. J Cereb Blood Flow Metab. 2001;21:1133–1145. doi: 10.1097/00004647-200110000-00001. [DOI] [PubMed] [Google Scholar]
- Auricchio A, Hildinger M, O'Connor E, Gao GP, Wilson JM. Isolation of highly infectious and pure adeno-associated virus type 2 vectors with a single-step gravity-flow column. Hum Gene Ther. 2001;12:71–76. doi: 10.1089/104303401450988. [DOI] [PubMed] [Google Scholar]
- Bankers-Fulbright JL, Gleich GJ, Kephart GM, Kita H, O'Grady SM. Regulation of eosinophil membrane depolarization during NADPH oxidase activation. J Cell Sci. 2003;116:3221–3226. doi: 10.1242/jcs.00627. [DOI] [PubMed] [Google Scholar]
- Berryman M, Bruno J, Price J, Edwards JC. CLIC-5A functions as a chloride channel in vitro and associates with the cortical actin cytoskeleton in vitro and in vivo. J Biol Chem. 2004;279:34794–34801. doi: 10.1074/jbc.M402835200. [DOI] [PubMed] [Google Scholar]
- Bianca VD, Dusi S, Bianchini E, Dal Prà I, Rossi F. beta-amyloid activates the O-2 forming NADPH oxidase in microglia, monocytes, and neutrophils. A possible inflammatory mechanism of neuronal damage in Alzheimer's disease. J Biol Chem. 1999;274:15493–15499. doi: 10.1074/jbc.274.22.15493. [DOI] [PubMed] [Google Scholar]
- Bindokas VP, Jordán J, Lee CC, Miller RJ. Superoxide production in rat hippocampal neurons: selective imaging with hydroethidine. J Neurosci. 1996;16:1324–1336. doi: 10.1523/JNEUROSCI.16-04-01324.1996. [DOI] [PMC free article] [PubMed] [Google Scholar]
- Blasi E, Barluzzi R, Bocchini V, Mazzolla R, Bistoni F. Immortalization of murine microglial cells by a v-raf/v-myc carrying retrovirus. J Neuroimmunol. 1990;27:229–237. doi: 10.1016/0165-5728(90)90073-v. [DOI] [PubMed] [Google Scholar]
- Block ML, Li G, Qin L, Wu X, Pei Z, Wang T, Wilson B, Yang J, Hong JS. Potent regulation of microglia-derived oxidative stress and dopaminergic neuron survival: substance P vs. dynorphin. FASEB J. 2006;20:251–258. doi: 10.1096/fj.05-4553com. [DOI] [PubMed] [Google Scholar]
- Block ML, Zecca L, Hong JS. Microglia-mediated neurotoxicity: uncovering the molecular mechanisms. Nat Rev Neurosci. 2007;8:57–69. doi: 10.1038/nrn2038. [DOI] [PubMed] [Google Scholar]
- Bocchini V, Mazzolla R, Barluzzi R, Blasi E, Sick P, Kettenmann H. An immortalized cell line expresses properties of activated microglial cells. J Neurosci Res. 1992;31:616–621. doi: 10.1002/jnr.490310405. [DOI] [PubMed] [Google Scholar]
- Butterfield DA, Boyd-Kimball D. Amyloid beta-peptide(1–42) contributes to the oxidative stress and neurodegeneration found in Alzheimer disease brain. Brain Pathol. 2004;14:426–432. doi: 10.1111/j.1750-3639.2004.tb00087.x. [DOI] [PMC free article] [PubMed] [Google Scholar]
- Butterfield DA, Gnjec A, Poon HF, Castegna A, Pierce WM, Klein JB, Martins RN. Redox proteomics identification of oxidatively modified brain proteins in inherited Alzheimer's disease: an initial assessment. J Alzheimers Dis. 2006;10:391–397. doi: 10.3233/jad-2006-10407. [DOI] [PubMed] [Google Scholar]
- DeCoursey TE. Interactions between NADPH oxidase and voltage-gated proton channels: why electron transport depends on proton transport. FEBS Lett. 2003;555:57–61. doi: 10.1016/s0014-5793(03)01103-7. [DOI] [PubMed] [Google Scholar]
- DeCoursey TE, Morgan D, Cherny VV. The voltage dependence of NADPH oxidase reveals why phagocytes need proton channels. Nature. 2003;422:531–534. doi: 10.1038/nature01523. [DOI] [PubMed] [Google Scholar]
- Denti MA, Rosa A, Sthandier O, De Angelis FG, Bozzoni I. A new vector, based on the PolII promoter of the U1 snRNA gene, for the expression of siRNAs in mammalian cells. Mol Ther. 2004;10:191–199. doi: 10.1016/j.ymthe.2004.04.008. [DOI] [PubMed] [Google Scholar]
- Dringen R, Gutterer JM, Hirrlinger J. Glutathione metabolism in brain metabolic interaction between astrocytes and neurons in the defense against reactive oxygen species. Eur J Biochem. 2000;267:4912–4916. doi: 10.1046/j.1432-1327.2000.01597.x. [DOI] [PubMed] [Google Scholar]
- Ducharme G, Newell EW, Pinto C, Schlichter LC. Small-conductance Cl- channels contribute to volume regulation and phagocytosis in microglia. Eur J Neurosci. 2007;26:2119–2130. doi: 10.1111/j.1460-9568.2007.05802.x. [DOI] [PubMed] [Google Scholar]
- Eder C, Klee R, Heinemann U. Involvement of stretch-activated Cl- channels in ramification of murine microglia. J Neurosci. 1998;18:7127–7137. doi: 10.1523/JNEUROSCI.18-18-07127.1998. [DOI] [PMC free article] [PubMed] [Google Scholar]
- Hanisch UK, Kettenmann H. Microglia: active sensor and versatile effector cells in the normal and pathologic brain. Nat Neurosci. 2007;10:1387–1394. doi: 10.1038/nn1997. [DOI] [PubMed] [Google Scholar]
- Harrop SJ, DeMaere MZ, Fairlie WD, Reztsova T, Valenzuela SM, Mazzanti M, Tonini R, Qiu MR, Jankova L, Warton K, Bauskin AR, Wu WM, Pankhurst S, Campbell TJ, Breit SN, Curmi PM. Crystal structure of a soluble form of the intracellular chloride ion channel CLIC1 (NCC27) at 1.4-A resolution. J Biol Chem. 2001;276:44993–45000. doi: 10.1074/jbc.M107804200. [DOI] [PubMed] [Google Scholar]
- Henderson LM, Chappell JB, Jones OT. The superoxide-generating NADPH oxidase of human neutrophils is electrogenic and associated with an H+ channel. Biochem J. 1987;246:325–329. doi: 10.1042/bj2460325. [DOI] [PMC free article] [PubMed] [Google Scholar]
- Jekabsone A, Mander PK, Tickler A, Sharpe M, Brown GC. Fibrillar beta-amyloid peptide Abeta1–40 activates microglial proliferation via stimulating TNF-alpha release and H2O2 derived from NADPH oxidase: a cell culture study. J Neuroinflammation. 2006;3:24. doi: 10.1186/1742-2094-3-24. [DOI] [PMC free article] [PubMed] [Google Scholar]
- Littler DR, Harrop SJ, Fairlie WD, Brown LJ, Pankhurst GJ, Pankhurst S, DeMaere MZ, Campbell TJ, Bauskin AR, Tonini R, Mazzanti M, Breit SN, Curmi PM. The intracellular chloride ion channel protein CLIC1 undergoes a redox-controlled structural transition. J Biol Chem. 2004;279:9298–9305. doi: 10.1074/jbc.M308444200. [DOI] [PubMed] [Google Scholar]
- Lovell MA, Markesbery WR. Oxidative DNA damage in mild cognitive impairment and late-stage Alzheimer's disease. Nucleic Acids Res. 2007;35:7497–7504. doi: 10.1093/nar/gkm821. [DOI] [PMC free article] [PubMed] [Google Scholar]
- Lue LF, Walker DG, Brachova L, Beach TG, Rogers J, Schmidt AM, Stern DM, Yan SD. Involvement of microglial receptor for advanced glycation endproducts (RAGE) in Alzheimer's disease: identification of a cellular activation mechanism. Exp Neurol. 2001;171:29–45. doi: 10.1006/exnr.2001.7732. [DOI] [PubMed] [Google Scholar]
- Lyras L, Cairns NJ, Jenner A, Jenner P, Halliwell B. An assessment of oxidative damage to proteins, lipids, and DNA in brain from patients with Alzheimer's disease. J Neurochem. 1997;68:2061–2069. doi: 10.1046/j.1471-4159.1997.68052061.x. [DOI] [PubMed] [Google Scholar]
- McDonald DR, Brunden KR, Landreth GE. Amyloid fibrils activate tyrosine kinase-dependent signaling and superoxide production in microglia. J Neurosci. 1997;17:2284–2294. doi: 10.1523/JNEUROSCI.17-07-02284.1997. [DOI] [PMC free article] [PubMed] [Google Scholar]
- Meda L, Baron P, Prat E, Scarpini E, Scarlato G, Cassatella MA, Rossi F. Proinflammatory profile of cytokine production by human monocytes and murine microglia stimulated with beta-amyloid[25–35] J Neuroimmunol. 1999;93:45–52. doi: 10.1016/s0165-5728(98)00188-x. [DOI] [PubMed] [Google Scholar]
- Novarino G, Fabrizi C, Tonini R, Denti MA, Malchiodi-Albedi F, Lauro GM, Sacchetti B, Paradisi S, Ferroni A, Curmi PM, Breit SN, Mazzanti M. Involvement of the intracellular ion channel CLIC1 in microglia-mediated beta-amyloid-induced neurotoxicity. J Neurosci. 2004;24:5322–5330. doi: 10.1523/JNEUROSCI.1170-04.2004. [DOI] [PMC free article] [PubMed] [Google Scholar]
- Oddo S, Caccamo A, Shepherd JD, Murphy MP, Golde TE, Kayed R, Metherate R, Mattson MP, Akbari Y, LaFerla FM. Triple-transgenic model of Alzheimer's disease with plaques and tangles: intracellular Abeta and synaptic dysfunction. Neuron. 2003;39:409–421. doi: 10.1016/s0896-6273(03)00434-3. [DOI] [PubMed] [Google Scholar]
- Parachikova A, Agadjanyan MG, Cribbs DH, Blurton-Jones M, Perreau V, Rogers J, Beach TG, Cotman CW. Inflammatory changes parallel the early stages of Alzheimer disease. Neurobiol Aging. 2007;28:1821–1833. doi: 10.1016/j.neurobiolaging.2006.08.014. [DOI] [PMC free article] [PubMed] [Google Scholar]
- Park L, Anrather J, Zhou P, Frys K, Pitstick R, Younkin S, Carlson GA, Iadecola C. NADPH-oxidase-derived reactive oxygen species mediate the cerebrovascular dysfunction induced by the amyloid beta peptide. J Neurosci. 2005;25:1769–1777. doi: 10.1523/JNEUROSCI.5207-04.2005. [DOI] [PMC free article] [PubMed] [Google Scholar]
- Park L, Zhou P, Pitstick R, Capone C, Anrather J, Norris EH, Younkin L, Younkin S, Carlson G, McEwen BS, Iadecola C. Nox2-derived radicals contribute to neurovascular and behavioral dysfunction in mice overexpressing the amyloid precursor protein. Proc Natl Acad Sci U S A. 2008;105:1347–1352. doi: 10.1073/pnas.0711568105. [DOI] [PMC free article] [PubMed] [Google Scholar]
- Qin B, Cartier L, Dubois-Dauphin M, Li B, Serrander L, Krause KH. A key role for the microglial NADPH oxidase in APP-dependent killing of neurons. Neurobiol Aging. 2006;27:1577–1587. doi: 10.1016/j.neurobiolaging.2005.09.036. [DOI] [PubMed] [Google Scholar]
- Qin L, Liu Y, Cooper C, Liu B, Wilson B, Hong JS. Microglia enhance beta-amyloid peptide-induced toxicity in cortical and mesencephalic neurons by producing reactive oxygen species. J Neurochem. 2002;83:973–983. doi: 10.1046/j.1471-4159.2002.01210.x. [DOI] [PubMed] [Google Scholar]
- Qin L, Liu Y, Wang T, Wei SJ, Block ML, Wilson B, Liu B, Hong JS. NADPH oxidase mediates lipopolysaccharide-induced neurotoxicity and proinflammatory gene expression in activated microglia. J Biol Chem. 2004;279:1415–1421. doi: 10.1074/jbc.M307657200. [DOI] [PubMed] [Google Scholar]
- Qin L, Block ML, Liu Y, Bienstock RJ, Pei Z, Zhang W, Wu X, Wilson B, Burka T, Hong JS. Microglial NADPH oxidase is a novel target for femtomolar neuroprotection against oxidative stress. FASEB J. 2005;19:550–557. doi: 10.1096/fj.04-2857com. [DOI] [PubMed] [Google Scholar]
- Rada BK, Geiszt M, Hably C, Ligeti E. Consequences of the electrogenic function of the phagocytic NADPH oxidase. Philos Trans R Soc Lond B Biol Sci. 2005;360:2293–2300. doi: 10.1098/rstb.2005.1768. [DOI] [PMC free article] [PubMed] [Google Scholar]
- Sankarapandi S, Zweier JL, Mukherjee G, Quinn MT, Huso DL. Measurement and characterization of superoxide generation in microglial cells: evidence for an NADPH oxidase-dependent pathway. Arch Biochem Biophys. 1998;353:312–321. doi: 10.1006/abbi.1998.0658. [DOI] [PubMed] [Google Scholar]
- Shanks RA, Larocca MC, Berryman M, Edwards JC, Urushidani T, Navarre J, Goldenring JR. AKAP350 at the Golgi apparatus. II. Association of AKAP350 with a novel chloride intracellular channel (CLIC) family member. J Biol Chem. 2002;277:40973–40980. doi: 10.1074/jbc.M112277200. [DOI] [PubMed] [Google Scholar]
- Shimohama S, Tanino H, Kawakami N, Okamura N, Kodama H, Yamaguchi T, Hayakawa T, Nunomura A, Chiba S, Perry G, Smith MA, Fujimoto S. Activation of NADPH oxidase in Alzheimer's disease brains. Biochem Biophys Res Commun. 2000;273:5–9. doi: 10.1006/bbrc.2000.2897. [DOI] [PubMed] [Google Scholar]
- Singh H, Ashley RH. Redox regulation of CLIC1 by cysteine residues associated with the putative channel pore. Biophys J. 2006;90:1628–1638. doi: 10.1529/biophysj.105.072678. [DOI] [PMC free article] [PubMed] [Google Scholar]
- Streit WJ. Microglial cells. In: Kettenmann H, Ransom BR, editors. Neuroglia. Ed 2. New York: Oxford UP; 2005. pp. 60–71. [Google Scholar]
- Thomas MP, Chartrand K, Reynolds A, Vitvitsky V, Banerjee R, Gendelman HE. Ion channel blockade attenuates aggregated alpha synuclein induction of microglial reactive oxygen species: relevance for the pathogenesis of Parkinson's disease. J Neurochem. 2007;100:503–519. doi: 10.1111/j.1471-4159.2006.04315.x. [DOI] [PubMed] [Google Scholar]
- Tonini R, Ferroni A, Valenzuela SM, Warton K, Campbell TJ, Breit SN, Mazzanti M. Functional characterization of the NCC27 nuclear protein in stable transfected cho-k1 cells. FASEB J. 2000;14:1171–1178. doi: 10.1096/fasebj.14.9.1171. [DOI] [PubMed] [Google Scholar]
- Tulk BM, Kapadia S, Edwards JC. CLIC1 inserts from the aqueous phase into phospholipid membranes, where it functions as an anion channel. Am J Physiol Cell Physiol. 2002;282:C1103–C1112. doi: 10.1152/ajpcell.00402.2001. [DOI] [PubMed] [Google Scholar]
- Valenzuela SM, Martin DK, Por SB, Robbins JM, Warton K, Bootcov MR, Schofield PR, Campbell TJ, Breit SN. Molecular cloning and expression of a chloride ion channel of cell nuclei. J Biol Chem. 1997;272:12575–12582. doi: 10.1074/jbc.272.19.12575. [DOI] [PubMed] [Google Scholar]
- Wang Q, Walsh DM, Rowan MJ, Selkoe DJ, Anwyl R. Block of long-term potentiation by naturally secreted and synthetic amyloid beta-peptide in hippocampal slices is mediated via activation of the kinases c-Jun N-terminal kinase, cyclin-dependent kinase 5, and p38 mitogen-activated protein kinase as well as metabotropic glutamate receptor type 5. J Neurosci. 2004;24:3370–3378. doi: 10.1523/JNEUROSCI.1633-03.2004. [DOI] [PMC free article] [PubMed] [Google Scholar]
- Warton K, Tonini R, Fairlie WD, Matthews JM, Valenzuela SM, Qiu MR, Wu WM, Pankhurst S, Bauskin AR, Harrop SJ, Campbell TJ, Curmi PM, Breit SN, Mazzanti M. Recombinant CLIC1 (NCC27) assembles in lipid bilayers via a pH-dependent two-state process to form chloride ion channels with identical characteristics to those observed in Chinese hamster ovary cells expressing CLIC1. J Biol Chem. 2002;277:26003–26011. doi: 10.1074/jbc.M203666200. [DOI] [PubMed] [Google Scholar]
- Wilkinson BL, Landreth GE. The microglial NADPH oxidase complex as a source of oxidative stress in Alzheimer's disease. J Neuroinflammation. 2006;3:30. doi: 10.1186/1742-2094-3-30. [DOI] [PMC free article] [PubMed] [Google Scholar]