

Abstract
ClC-3 is an intracellular chloride transport protein known to reside on endosomes and synaptic vesicles. The endogenous protein has been notoriously difficult to detect in immunohistological experiments because of the lack of reliable antibodies. Using newly generated antibodies, we now examine its expression pattern at the cellular and subcellular level. In all tissues examined, immunostaining indicated that ClC-3 is a vesicular protein, with a prominent expression in endocrine cells like adrenal chromaffin cells and pancreatic islet cells. In line with a possible function of ClC-3 in regulating vesicle trafficking or exocytosis in those secretory cells, capacitance measurements and amperometry indicated that exocytosis of large dense-core vesicles (LDCVs) was decreased in chromaffin cells from ClC-3 knock-out mice. However, immunohistochemistry complemented with subcellular fractionation showed that ClC-3 is not detectable on LDCVs of endocrine cells, but localizes to endosomes and synaptic-like microvesicles in both adrenal chromaffin and pancreatic β cells. This observation points to an indirect influence of ClC-3 on LDCV exocytosis in chromaffin cells, possibly by affecting an intracellular trafficking step.
Keywords: Clcn3, gene disruption, catecholamine, insulin, channel, exchanger
Introduction
ClC-3 is a member of the CLC gene family encoding Cl− channels and Cl−/H+ exchangers (Jentsch, 2008). Of the nine mammalian CLC proteins, four members are plasma membrane Cl− channels, whereas the others, including ClC-3, reside predominantly in intracellular membranes (Jentsch, 2007). ClC-4 and ClC-5, previously classified as Cl− channels (Friedrich et al., 1999), are now known to be Cl−/H+ exchangers (Picollo and Pusch, 2005; Scheel et al., 2005; Zdebik et al., 2008), like the bacterial ecClC-1 (Accardi and Miller, 2004). The high degree of sequence identity of ClC-3 to ClC-4 and ClC-5 and their almost identical current properties (Friedrich et al., 1999; Li et al., 2002; Picollo and Pusch, 2005; Matsuda et al., 2008) strongly suggest that ClC-3 is an antiporter also (Jentsch, 2007, 2008).
Intracellular CLC proteins are thought to facilitate endosomal/lysosomal acidification by shunting currents of proton pumps (Jentsch, 2007). The disruption of vesicular CLCs has diverse effects including impaired renal endocytosis and kidney stones with a loss of ClC-5 (Lloyd et al., 1996; Piwon et al., 2000; Wang et al., 2000), lysosomal storage disease with a loss of ClC-6 (Poët et al., 2006), and osteopetrosis associated with lysosomal storage disease with a loss of either ClC-7 (Kornak et al., 2001; Kasper et al., 2005) or its β-subunit Ostm1 (Lange et al., 2006).
Disruption of ClC-3, which is located on endosomes and synaptic vesicles (SVs), leads to a severe neurodegeneration resulting in an absence of the hippocampus (Stobrawa et al., 2001). This neurodegeneration is not associated with the massive intraneuronal deposits of lysosomal storage material found in mice lacking ClC-6 (Poët et al., 2006), ClC-7 (Kasper et al., 2005), or Ostm1 (Lange et al., 2006). Although CNS degeneration is the salient feature of ClC-3 knock-out (KO) mice (Stobrawa et al., 2001; Dickerson et al., 2002; Yoshikawa et al., 2002), ClC-3 is expressed in many other tissues (Kawasaki et al., 1994; Borsani et al., 1995; Stobrawa et al., 2001). Unfortunately, the lack of reliable antibodies has hampered a thorough expression analysis.
Several incompatible functions were ascribed to ClC-3. It was suggested to mediate swelling-activated Cl− currents (Duan et al., 1997) or (different) Ca2+-activated Cl− currents (Huang et al., 2001; Wang et al., 2006) in plasma membranes. Clcn3−/− mice lacked neither current (Stobrawa et al., 2001; Arreola et al., 2002; Gong et al., 2004). ClC-3 was also proposed to have roles in neutrophil and smooth muscle reactive oxygen species generation (Moreland et al., 2006; Miller et al., 2007) and in β cell insulin secretion (Barg et al., 2001).
We have generated new ClC-3 antibodies to investigate its subcellular distribution in a range of tissues in a KO-controlled manner and find that ClC-3 is highly expressed in neurosecretory cells of the adrenal medulla, endocrine pancreas and pituitary. In both chromaffin cells and pancreatic β cells, ClC-3 was found on endosomes and synaptic-like microvesicles (SLMVs), but could not be detected on large dense-core vesicles (LDCVs). Surprisingly, chromaffin cell secretion was impaired in Clcn3−/− mice. These results suggest that ClC-3 influences LDCV exocytosis of chromaffin cells indirectly.
Materials and Methods
Mice.
The generation of the ClC-3 KO mice has been described previously (Stobrawa et al., 2001). For the present study, animals of a mixed SVJ129–C57BL/6 background were used because they exhibit a reduced lethality compared with a C57BL/6 backcrossed strain. Littermates were taken as controls.
Antibodies.
New antibodies were generated against six different epitopes of the mouse ClC-3 protein, but only sera 1035 and 1036 against a mixture of two peptides (C3/03A, SSTHLLDLLDEPIPGC; C3/03B, KDRERHRRINSKKKEC), which represent parts of the ClC-3 cytoplasmic N terminus, proved useful. Their specificity was confirmed by comparing Western blots of wild-type (WT) and ClC-3 KO tissue (supplemental Fig. S1A, available at www.jneurosci.org as supplemental material). Affinity purification was performed against peptide A or peptide B independently. Only sera affinity-purified with peptide A (which is present in ClC-3 from mice, men, and cattle) gave strong signals in Western blots and recognized ClC-3 in immunohistochemistry. These antibodies proved superior in immunohistochemistry to the 3A4 antibody that we had generated against a different N-terminal ClC-3 epitope (Stobrawa et al., 2001), and which we used in Western blot experiments (supplemental Figs. S1, S3, available at www.jneurosci.org as supplemental material). The successful peptide C3/03A differs in 6 and 10 of 15 aa from the corresponding sequences of the related ClC-5 and ClC-4 proteins, respectively. Accordingly, the antibody did not show noticeable cross-reactivity to either protein.
Other antibodies used in this study are rabbit anti-ClC-3 3E3 generated against a C-terminal peptide (Stobrawa et al., 2001), rabbit anti-ClC-4 12.61 (directed against an epitope between the CBS domains; T. J. Jentsch and S. Schaffer, unpublished data), rabbit anti-ClC-5 5A1 and 5E1 (Günther et al., 1998), rabbit anti-ClC-6 6N2 (Poët et al., 2006), rabbit anti-ClC-7 7N4B (Kornak et al., 2001; Kasper et al., 2005), mouse anti-villin (Acris), mouse anti-synaptophysin SVP-38 (Sigma), guinea pig anti-insulin (Euro-Diagnostika), mouse anti-glucagon (Sigma), rabbit anti-somatostatin (Progen), rabbit anti-pancreatic polypeptide (Progen), rabbit anti-secretogranin I and II (kind gift from W. Huttner, Max-Planck-Institut für Molekulare Zellbiologie und Genetik, Dresden, Germany), rabbit anti-actin (Sigma), rabbit anti-cathepsin D (Oncogene), mouse anti-carboxypeptidase E (Research Diagnostics), rabbit anti-rab4 (Santa Cruz Biotechnology), mouse anti-transferrin receptor (Zymed), rat anti-HA 3F10 (Roche), and mouse anti-myc 9E10 (Santa Cruz Biotechnology). All mouse and rat antibodies were monoclonal.
Immunohistochemistry on sections.
Mice were perfused transcardially with 4% paraformaldehyde (PFA) in PBS for 5 min. Paraffin sections were cooked in citrate buffer for antigen retrieval and blocked in 3% NGS, 2% BSA, and 0.1% Triton X-100 in PBS. The first antibody was applied in 2% BSA, 0.1% Triton X-100 in PBS, and the second antibody in 0.1% Triton X-100 in PBS. Antibody dilutions were 1:100 (villin), 1:200 (ClC-5 5E1, synaptophysin), 1:300 (ClC-3 1036), 1:400 (pancreatic polypeptide), 1:500 (ClC-7), 1:800 (somatostatin), 1:2000 (insulin, glucagon, secretogranin II), and 1:1500 for the Alexa-conjugated secondary antibodies (Invitrogen). Nuclei were stained with TO-PRO-3 (Invitrogen). Sections were examined by confocal microscopy (Leica TCS).
Isolation of chromaffin cells and pancreatic islets.
Chromaffin cells were isolated from adrenal glands of 6- to 8-week-old mice. The adrenal medulla was dissected in cold Locke's buffer (in mm: 154 NaCl, 5.6 KCl, 3.6 NaHCO3, 5.6 glucose, and 5.0 HEPES, pH 7.4) and incubated with 3 mg/ml collagenase type A (Roche) in Locke's buffer in a shaking bath at 37°C. The collagenase was diluted further in cold Locke's buffer, and cells were pelleted and resuspended in DMEM supplemented with 1% penicillin/streptomycin (Invitrogen) and 10% FCS (JRH Biosciences) and then filtered through nylon mesh. Cells were pelleted again, resuspended in supplemented DMEM, plated on poly-l-lysine coated glass coverslips, and incubated at 37°C with 5% CO2. Cells were maintained in primary culture for 2–4 d before experiments.
To prepare pancreatic islets, adult mice were killed by cervical dislocation, the pancreas was injected with collagenase solution [0.67 U collagenase P (Roche)/ml Hanks' solution), excised and incubated at 37°C for 17 min. Incubation was stopped by adding cold Hanks' solution containing 1 mg/ml BSA. Islets were dissociated from the exocrine tissue by vigorous shaking and were picked from the suspension under visual control of a binocular. To dissociate islets into single cells, they were incubated with Ca2+-free solution (in mm: 138 NaCl, 5.6 KCl, 1.2 MgCl2, 5 HEPES, 3 glucose, 1 EGTA, and 0.1% BSA, pH 7.4) for 10 min at 37°C. The islets were then triturated by pipetting.
Expression and detection of ClC-3 in INS-1E cells and chromaffin cells.
To express ClC-3 in insulinoma (INS-1E) cells and chromaffin cells, the Semliki Forest virus (SFV) system was used (Owe-Larsson et al., 1999). ClC-3 containing a C-terminal hemagglutinin (HA) or myc epitope was cloned into pSFV1 (Invitrogen). INS-1E cells or primary chromaffin cells (24 h after preparation) were incubated for 12–24 h with activated recombinant virus. Cells were fixed in 4% PFA in PBS and blocked in 5% normal donkey serum, 0.1% Triton X-100 in PBS. The first antibody was applied in 0.1% Triton X-100 in PBS overnight at 4°C. Antibody dilutions were 1:500 (HA), 1:2000 (insulin, secretogranin II), and 1:20 (myc). After washing, cells were incubated with Alexa-conjugated secondary antibodies (Invitrogen). Samples were examined by confocal microscopy (Leica TCS).
Generation of cell and tissue lysates for Western blotting.
Dissected tissues or pelleted cells were homogenized in PBS containing 1% NP-40 and protease inhibitors. After 30 min on ice, homogenates were centrifuged 5 min at 14,000 rpm at 4°C. Supernatants were complemented with loading buffer and 4% β-mercaptoethanol, heated to 55°C for 5 min and subjected to SDS-PAGE and Western blotting.
Subcellular fractionation of β cells.
INS-1E or Rinm5F cells from three 140 mm cell culture dishes were scraped into PBS; primary islet cells (which are ∼80% β cells) were isolated from 12 adult WT animals and pooled. Cells were pelleted by centrifugation, resuspended in 1.5 ml of homogenization buffer [5 mm HEPES, 0.5 mm EGTA, 1× Complete protease inhibitor (Roche), pH 7.4] and homogenized by nitrogen cavitation (150 psi, 30 min, 4°C). The homogenate was centrifuged (10 min, 3000 × g, 4°C), and the supernatant was loaded onto the top of a continuous sucrose density gradient (0.45–2 m sucrose in homogenization buffer). After centrifugation (30,000 rpm, 18 h, 4°C) in an SW41 rotor (Beckman), 750 μl fractions were collected from the top of the gradient. The sucrose content of each fraction was determined by measuring its refractive index. Protein content was analyzed using the BCA protein assay kit (Pierce). Insulin content was determined using an Ultrasensitive Mouse Insulin ELISA (Crystal Chem). β-Hexosaminidase activity was measured by incubating 10 μl of the fractions with 100 μl of substrate solution (10 mm para-nitrophenyl-2-acetamido-2-deoxy-β-d-glucopyranoside, 0.1 m sodium citrate, pH 4.6, 0.2% BSA) for 2 h at 37°C. After addition of 1 ml of 0.2 m glycine, pH 10.8, samples were measured in a photometer at 405 nm. For Western blot analysis of the fractions, antibodies against ClC-3 (3A4, 3E3, 1:500), ClC-5 (5A1, 1:500), ClC-6 (1:500), ClC-7 (1:500), carboxypeptidase E (1:500), synaptophysin (1:500), transferrin receptor (1:500), rab4 (1:200), and cathepsin D (1:40) were used.
Glycerol velocity gradients.
Glycerol velocity gradients were performed as described (Cameron et al., 1991). Briefly, INS-1E cell supernatants were prepared as described above for sucrose gradients [except that the homogenization buffer was (in mm) 150 NaCl, 10 HEPES, 1 EGTA, 0.1 MgCl2, and 1× Complete protease inhibitor (Roche), pH 7.4] and loaded onto a 5–25% continuous glycerol gradient with a 50% sucrose cushion. After centrifugation (48,000 rpm, 1 h, 4°C) in a SW40 rotor (Beckman), 1 ml fractions were collected from the top of the gradient and analyzed by Western blotting as described for sucrose gradients.
Subcellular fractionation of adrenal medullary tissue.
Medullary tissue was dissected from fresh bovine adrenal glands and homogenized in 0.3 m sucrose in 10 mm Tris, pH 7.4. The homogenate was centrifuged twice for 10 min at 800 × g. The resulting supernatant was centrifuged at 20,000 × g for 20 min. The pellet was resuspended in the homogenization buffer and loaded onto a 16-step gradient. Sixteen times 2 ml of 1.9 to 0.4 m sucrose in 0.1 m sucrose steps was layered onto 3.5 ml of 2 m sucrose in 10 mm Tris, pH 7.4. After 16 h at 100,000 g at 4°C in an SW28 rotor, 20 2 ml fractions were taken from top to bottom. An aliquot of each fraction was used to determine β-hexosaminidase activity. The remainder was subjected to TCA precipitation. Equal amounts of protein per fraction were separated by SDS-PAGE and analyzed by Western blotting.
Capacitance measurements with depolarization protocol.
Recordings were made in the whole-cell patch-clamp configuration. Electrodes had input resistances of 3–5 MΩ. Recordings were performed with an EPC-9 amplifier (HEKA) and Pulse software (version 8.53; HEKA). For capacitance recordings, the pipette solution contained (in mm) 50 CsCl, 75 Cs2SO4, 10 NaCl, 3 MgSO4, and 10 HEPES, pH 7.3. The external solution for these recordings consisted of (in mm) 20 tetraethylammonium (TEA)-Cl, 118 NaCl, 5 KCl, 5 CaCl2, 0.5 MgCl2, 5 HEPES, and 3 glucose, pH 7.4. Whole-cell capacitance and series resistance were compensated before experiments. Exocytosis was monitored as changes in cell capacitance, using the sine plus DC mode of the lock-in amplifier (40 mV peak-to-peak amplitude wave at 1 kHz) included in the Pulse software suite (Pulse Software). Secretion was elicited by trains of ten 500 ms depolarizations (1 Hz stimulation frequency) from −70–0 mV. During all patch-clamp experiments, cells were continuously superfused with the extracellular medium at a rate of ∼2 ml/min. All measurements were performed at 32–35°C.
Capacitance measurements with caged calcium release.
Outputs of a UV flash lamp (Rapp OptoElektronik) and of a monochromator (Polychrome IV; TILL Photonics) were coupled into the epifluorescence port of an inverted Axiovert 200 microscope equipped with a 100× Fluar objective (Zeiss). Cells were patched at room temperature in the whole-cell mode, and their interior was equilibrated with the pipette solution containing (in mm) 110 cesium glutamate, 8 NaCl, 2 MgATP, 0.3 Na2-GTP, 20 HEPES, 5 nitrophenyl-EGTA, 3.5 CaCl2, 0.3 furaptra, and 0.2 fura-2, adjusted to pH 7.2 with CsOH (300–310 mOsm). The external bathing solution contained (in mm) 20 TEA-Cl, 118 NaCl, 5 KCl, 5 CaCl2, 0.5 MgCl2, 5 HEPES, and 3 glucose, pH 7.4 (310–320 mOsm). Ca2+ was released from Ca2+-bound nitrophenyl-EGTA by a flash of 300 V. As control, [Ca2+]i was measured by intermittently exciting fura-2 and furaptra (Invitrogen) at 350 and 380 nm (Xu et al., 1997; Voets, 2000). Cellular fluorescence at 510 nm was measured using a photodiode. The [Ca2+]i liberated from Ca2+-bound nitrophenyl-EGTA by UV flash ranged between 5 and 20 μm and did not differ between WT and KO cells. The mean of the recorded capacitance values before UV flash was subtracted from the capacitance recorded at each time point to determine the capacitance increase ΔC. The ΔC values were averaged over time and represented as mean ± SEM. All measurements were performed at 32–35°C.
Amperometry.
Catecholamine release from single chromaffin cells was measured using amperometry (Chow et al., 1992). A carbon-fiber electrode (ProCFE; Dagan) was placed on a chromaffin cell and +800 mV was applied to the electrode under voltage-clamp conditions. Current caused by catecholamine oxidation was recorded using an Axopatch 200A amplifier and pClamp 8.0 software (Molecular Devices), sampled at 10 kHz and low-pass filtered at 1 kHz. For quantitative analysis, secretory spikes were analyzed (Mini Analysis, version 6.0.1; Synaptosoft) for a period of 60 s from the start of stimulation. The standard bath Krebs solution contained (in mm) 140 NaCl, 5 KCl, 2 CaCl2, 1 MgCl2, 5 d-glucose, and 10 HEPES, pH 7.4. High-K+-containing solution was the same as control bath solution except that 50 mm K+ replaced an equimolar amount of NaCl. All solutions were applied to cells using a gravity perfusion system, the outlet of which was placed within 500 μm from the recorded cell. All experiments were performed at 32–35°C. For foot analysis, data were pooled from all recorded cells because many recordings contained a low number of foot signals so that an adequate median value could not be obtained for each cell. Foot onset was defined when the signal exceeded the peak-to-peak noise of a 5 ms time segment, whereas the end of the foot was defined by the inflection point between the foot and the main event. This threshold value was determined by taking the second derivative of the trace. Recordings of both WT and KO cells used the same carbon fibers to eliminate potential effects of interfiber variability. Foot signals were analyzed only when they had amplitudes four times greater than the root mean squared noise value of the baseline and which lasted for longer than 1 ms.
Ca2+ measurements.
Chromaffin cells were loaded with the Ca2+ sensitive dye fura-2 AM (15 μm) and 0.02% Pluronic F-127 (Invitrogen) for 30 min at 37°C in serum-free DMEM and then washed in Krebs solution for 15 min. Fura-2 excitation was excited using a multiple wavelength monochromator (Polychrome IV; TILL Photonics). The emitted light was bandpass filtered at a wavelength of 510 nm. Images were obtained using a 40× water-immersion objective fitted to a CCD camera (Imago) on an upright microscope (Olympus BXWI50) and stored for later analysis using TILLvisION software (version 4.0; TILL Photonics). Fluorescence intensities from individual cells were measured at a rate of 1 Hz. [Ca2+]i was expressed as the ratio of fura-2 fluorescence intensity at 340 nm divided by that at 380 nm. The [Ca2+]i during the control period was subtracted from the [Ca2+]i during the peak response to stimulation to give Δ340/380.
Hormone measurements.
Serum and islet insulin levels were measured with an Ultrasensitive Mouse Insulin ELISA Kit (Crystal Chem). Serum leptin levels were determined using a mouse leptin ELISA Kit (Crystal Chem). Epinephrine and norepinephrine in mouse serum and urine were detected using a Cat Combit ELISA Kit (IBL). Adrenal gland catecholamine content was determined using a direct fluorometric assay as described by Lelkes et al. (1985).
Data analysis.
Data are reported as mean values ± SEM of the indicated number of experiments. Statistical significance was evaluated using Student's t test.
Results
ClC-3 is expressed in vesicular structures in various tissues
We generated antibodies in rabbits against a mixture of two peptides representing amino acids 9–23 (peptide A) and 50–64 (peptide B) of the cytoplasmic N terminus of mouse ClC-3. After affinity purification against peptide B, the serum recognized a major broad band of the correct size in Western blots of membranes from WT, but not ClC-3 KO kidneys (supplemental Fig. S1A, available at www.jneurosci.org as supplemental material). The rather broad width of this band is typical and has been ascribed to the glycosylation of ClC-3 (Schmieder et al., 2001). The absence of a band in ClC-3 KO kidney samples suggests that cross-reactivity to ClC-5, which is prominently expressed in kidney (Günther et al., 1998), is negligible.
This new antibody was used in immunocytochemistry to investigate the expression of ClC-3 in various tissues, always using sections from ClC-3 KO mice (Stobrawa et al., 2001), to control for the specificity of staining (supplemental Fig. S1B–G, available at www.jneurosci.org as supplemental material). In the kidney, KO-controlled staining was observed intracellularly in the apical part of proximal tubular cells (Fig. 1A–D). Costaining with the brush border protein villin revealed that ClC-3 expression was not detected in the plasma membrane, but in an intracellular region apposed to it (Fig. 1B). In epithelia of the epididymis, an intracellular vesicular staining was observed as well (Fig. 1E,F). Similar to the staining of proximal tubules, it was most intense at the apical cell pole. In hepatocytes, we observed an intracellular, granular staining that was often concentrated close to nuclei (Fig. 1G,H).
Figure 1.
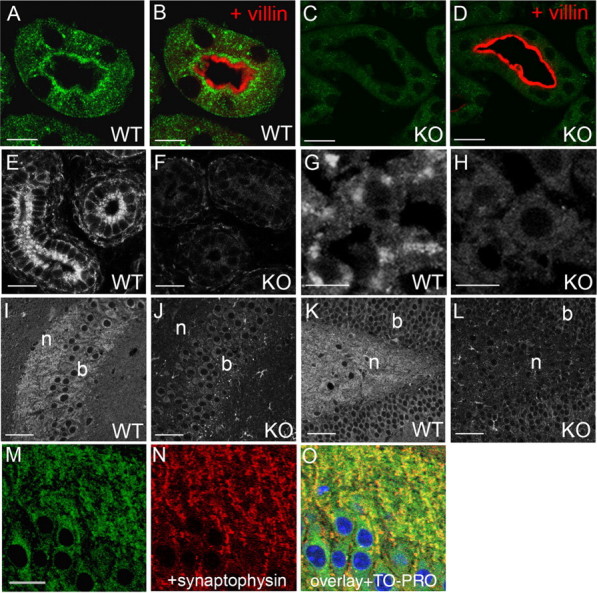
Intracellular vesicular staining for ClC-3 in diverse organs. In the kidney, ClC-3 is prominently expressed in the apical region of proximal tubular (PT) cells as indicated by green staining. A–D, Counterstaining for the brush-border protein villin (red; B, D) shows that ClC-3 resides in vesicles below the plasma membrane. These structures were not stained in PT cells from ClC-3 KO mice (C, D) demonstrating the specificity of the ClC-3 antibody. E, F, ClC-3 staining of apical vesicles is also seen in epididymal epithelial cells of 2-week-old WT mice (E), but not in KO mice (F). G, H, In liver, granular staining for ClC-3 appears close to nuclei (G) and is absent in KO controls (H). I, K, In brain, there is strong expression of ClC-3 in cell bodies (b) and neurites (n) of the CA3 region of the hippocampus (I) and of the dentate gyrus (K). J, L, Staining is absent in the respective KO controls. M–O, ClC-3 and synaptophysin partially colocalize in the neuropil surrounding the CA3 neurons. TO-PRO-3 was used in O to stain nuclei. Scale bars: A–D, M–O, 10 μm; E, F, 15 μm; G, H, 7.5 μm; I–L, 25 μm.
In the brain (Fig. 1I–O), ClC-3 staining was broadly observed in neuronal cell bodies and neuropil. Because the presence of ClC-3 is crucial for the maintenance of an intact hippocampus, we analyzed its subcellular expression pattern especially in the hippocampal region. In the CA3 region (Fig. 1I), the neuropil of the stratum oriens was stained as heavily as the neuronal cell bodies. The hilus of the dentate gyrus, which contains mossy fiber terminals, was also strongly stained (Fig. 1K). The vesicular staining of neuronal cell bodies is compatible with the known localization of ClC-3 to endosomes, whereas the staining of the neuropil conforms to its presence on synaptic vesicles. Indeed, ClC-3 partially colocalizes with the synaptic vesicle marker synaptophysin and shows robust staining of the surrounding neuropil, as demonstrated for the CA3 region of the hippocampus in Figure 1M–O. In the retina, which degenerates early in ClC-3 KO mice, ClC-3 was mainly detected in the synapse-rich inner and outer plexiform layers (supplemental Fig. S2A, available at www.jneurosci.org as supplemental material), in accord with our previous results with a different antibody (Stobrawa et al., 2001).
Because ClC-3 had been suggested to have a role in exocytosis (Barg et al., 2001), we investigated the expression of ClC-3 in various secretory cell types (Fig. 2). All areas of the neuronal posterior lobe of the pituitary stained for ClC-3 in an intense dot-like staining pattern (Fig. 2A). In the anterior lobe of the pituitary, only a small subset of cells showed prominent intracellular staining (Fig. 2B). Likewise, there was only a subpopulation of cells stained in the thyroid gland (Fig. 2C,D). Adrenal glands showed intense, KO-controlled staining for ClC-3 within the medulla (Fig. 2E). Staining of the cortex was less intense and was predominantly observed in the aldosterone-producing zona glomerulosa (Fig. 2F). Endocrine pancreatic islets of Langerhans were intensely stained in a fine vesicular pattern that covered the entire cytoplasm (Fig. 2G). In exocrine epithelial cells of the pancreas, the ClC-3 antibody again stained vesicular structures (Fig. 2H).
Figure 2.
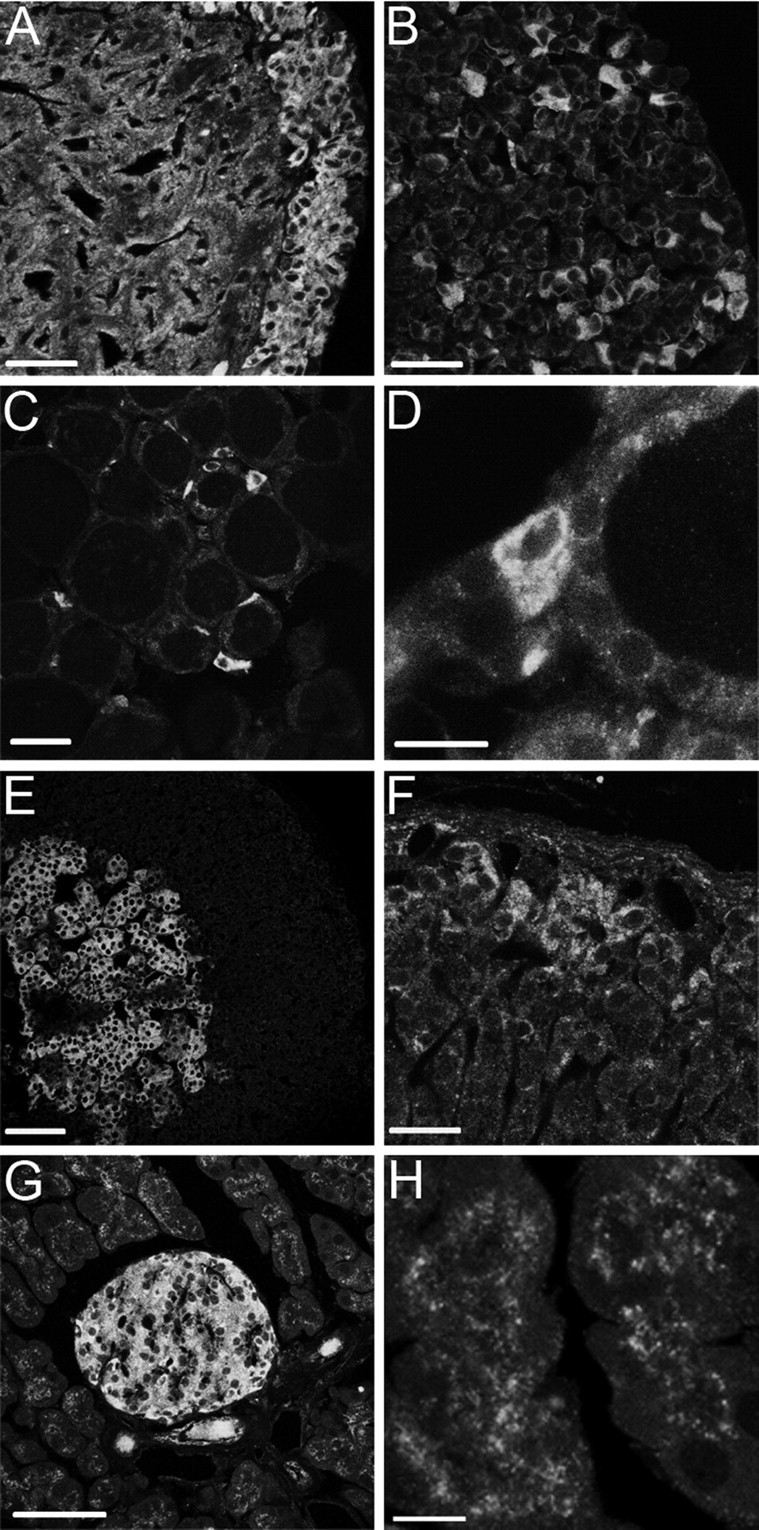
Strong expression of ClC-3 in numerous secretory tissues. A, B, ClC-3 is expressed throughout the posterior pituitary (A) but is found in only a subset of cells of the anterior pituitary (B). C, D, Also, within the thyroid, only a subset of cells (magnified in D) show prominent vesicular ClC-3 staining. E, F, In the adrenal gland, the medullary chromaffin cells exhibit strong staining (E), whereas there is only weak staining of the adrenal cortex with the exception of the zona glomerulosa (F). G, H, In the pancreas, the endocrine islets of Langerhans (G) as well as the exocrine tissue (H) stain for ClC-3, with particularly intense staining in islets. Scale bars: A, B, F, 25 μm; C, G, 50 μm; D, 10 μm; E, 100 μm; H, 7.5 μm.
Distinct cell types within islets secrete different hormones. Insulin-secreting β cells constitute the bulk of islet cells (60–80%), with glucagon-secreting α cells being the second largest cell population (∼20%). The remaining somatostatin-producing δ cells as well as the pancreatic polypeptide secreting PP cells constitute ∼5% each. ClC-3 is expressed in all secretory cell types of pancreatic islets (supplemental Fig. S2B, available at www.jneurosci.org as supplemental material). No difference in the staining intensity between these different neuroendocrine cells was noted.
Capacitance measurements indicate reduced exocytosis of ClC-3 KO chromaffin cells
The prominent expression of ClC-3 in several secretory cell types prompted us to investigate whether the disruption of ClC-3 (Stobrawa et al., 2001) might influence their secretory capacity. We chose isolated chromaffin cells as an easily amenable and well established model system for exocytosis (Borges et al., 2008), which we monitored by capacitance measurements. Using voltage clamp in the standard whole-cell configuration, exocytosis was elicited by trains of ten 500 ms pulses that depolarized the cells from −70 to 0 mV (Fig. 3A). In WT chromaffin cells, exocytosis proceeded throughout the train. The capacitance increase per pulse decreased from 214 ± 32 fF in response to the first depolarization to a final value of 53 ± 13 fF/pulse. Such a decrease is expected because the limited pool of readily releasable granules is rapidly depleted during repetitive stimulation and is more slowly refilled. The total capacitance increase of WT cells averaged 1030 ± 78 fF. In chromaffin cells lacking ClC-3, exocytosis also proceeded throughout the pulse train but capacitance increases per pulse were markedly lower (Fig. 3A,B). The first pulse increased capacitance on average by 136 ± 25 fF (p < 0.05 compared with WT). The total increase after 10 pulses amounted to 566 ± 77 fF (p < 0.05 compared with WT), nearly one-half of the amount observed in WT cells (Fig. 3B). The initial surface area of the cells was comparable. The decreased response to the first pulse suggests that the blunted exocytosis of ClC-3 KO cells cannot be ascribed exclusively to an impairment of the refilling of the readily releasable pool, but indicates a reduction of this pool itself. Depolarization-induced exocytosis involves increases of intracellular Ca2+ that result from the opening of voltage-gated Ca2+ channels. To measure Ca2+-induced exocytosis directly, we strongly raised [Ca2+]i by flash photolysis of caged Ca2+, which was introduced into the cell through the patch pipette (Fig. 3C,D). In WT chromaffin cells, this procedure led to an average capacitance increase of 389 ± 114 fF compared with 101 ± 42 fF in KO cells (p < 0.05), ∼25% of this value (Fig. 3D).
Figure 3.

Reduced exocytosis in ClC-3 KO chromaffin cells as revealed by capacitance measurements. A, B, Isolated chromaffin cells were subjected to a series of depolarizing pulses to 0 mV from a holding potential of −70 mV (500 ms pulse duration at 1 Hz), and the membrane capacitance was measured after each pulse. A, Sample traces of capacitance changes in stimulated WT and KO cells. B, Mean capacitance changes induced by individual voltage pulses. The observed reduction in exocytosis of KO cells is highly significant (p < 0.005). C, D, Secretion was triggered by the photolytic release of caged Ca2+. C, Averaged raw traces of stimulated WT and KO cells. D, Mean capacitance changes induced by caged Ca2+ release. ClC-3 KO cells displayed a significantly reduced secretory response (p < 0.05). The arrows in C and D point to the onset of Ca2+ release. Data represent average values ± SEM.
Amperometry reveals details of LDCV exocytosis in ClC-3 KO chromaffin cells
The exocytosis of catecholamine-containing vesicles can also be monitored by amperometry (Chow et al., 1992). The oxidative current that is flowing through a nearby carbon-fiber microelectrode reflects the secreted LDCV content, but also depends on the distance from the secretion site. Because of the high time resolution of this method, not only can single exocytotic events be recorded as current spikes, but kinetic parameters can be determined as well. ClC-3 KO cells that were stimulated to exocytose by increasing [K+]o to 50 mm displayed a significantly reduced spike number per cell, current amplitude, and charge per spike and total charge (i.e., charge per spike multiplied by spike number) per cell compared with WT cells (Fig. 4A,B, Table 1). In addition, there were significantly less spikes displaying a foot signal, which arises from a slow leakage of catecholamines through the fusion pore before full dilation of the pore and complete exocytosis (Chow et al., 1992). The probability of detecting a foot signal is positively correlated with the quantal size of a vesicle (Amatore et al., 2005). The properties of the spike foot in regards to its height, duration and area were significantly reduced in KO cells (Table 1). However, there was no change in the kinetic parameters of the full amperometric spike such as rise time, decay time, or half-width (Table 1).
Figure 4.

Reduced LDCV exocytosis in ClC-3 KO chromaffin cells measured by amperometry. Amperometric measurements were performed as a read-out of catecholamine exocytosis. Isolated cells were stimulated by application of 50 mm K+ containing Krebs solution. A, B, Sample recordings of a WT and KO cell. Current spikes occurring within 60 s of stimulation were analyzed to illustrate spike number per cell. Spike numbers, amplitudes, and other spike parameters were significantly different between WT and KO cells (Table 1). C–E, Assessment of the depolarization-induced Ca2+ response of WT and KO chromaffin cells. C and D show average Ca2+-imaging experiments performed with WT and KO cells, respectively. The bar under the curves indicates superfusion with high [K+]. E, Averaged relative change in intracellular Ca2+ concentration in response to high [K+]o. There was no significant difference in the Ca2+ response of WT and KO cells (n = 20). Error bars indicate SEM.
Table 1.
Effects of ClC-3 on chromaffin cells amperometric spike parameters
| Spike no. per cell | Amplitude (pA) | Charge (pC) | Total charge per cell (pC) | Rise time (ms) | Decay time (ms) | Half-width (ms) | Foot frequency (%) | Foot area (fC) | Foot duration (ms) | Foot height (pA) | |
|---|---|---|---|---|---|---|---|---|---|---|---|
| WT (n = 15) | 74 ± 11 | 37.7 ± 4.2 | 303 ± 37 | 34.7 ± 7.5 | 0.79 ± 0.1 | 4.8 ± 0.5 | 4.8 ± 0.5 | 38.9 ± 4.6 | 46 ± 3.1 | 5.1 ± 0.3 | 22.1 ± 0.9 |
| KO (n = 15) | 49 ± 8* | 23.8 ± 2.8** | 162 ± 27** | 11.2 ± 2.9** | 0.73 ± 0.14 | 4.4 ± 0.7 | 4.4 ± 0.7 | 24.1 ± 4.4* | 30 ± 2.9** | 3.9 ± 0.3** | 18.5 ± 1.3* |
Data are shown as mean ± SEM of the cell median for each parameter. Numbers in parentheses in the left column are number of cells used to calculate the number of exocytotic events.
*p < 0.05,
**p < 0.01, differences between WT and KO.
We next determined whether the different exocytotic responses of WT and ClC-3 KO chromaffin cells might be caused by different levels of [Ca2+]i elicited by high-[K+]o-stimulated depolarization. [Ca2+]i of chromaffin cells was monitored by measuring the fluorescence of fura-2 while depolarizing them with 50 or 100 mm [K+]o. The relative basal [Ca2+]i was not changed in ClC-3 KO cells, and after stimulation with high K+ solution, [Ca2+]i rose to an equal extent in WT and KO cells (Fig. 4C–E). Hence, the impaired secretory response of ClC-3 KO cells cannot be attributed to abnormalities of Ca2+ handling, but must be caused by a defect in a later step in the series of events leading to granule release.
Hormone concentrations in mice
The reduced release of catecholamines from ClC-3 KO chromaffin cells, as indicated by amperometry, might be correlated with a changed catecholamine content of adrenal glands. However, direct measurements of catecholamine contents of WT and ClC-3 KO adrenal glands revealed no significant difference (Table 2). Because ClC-3 is prominently expressed in pancreatic β cells (Fig. 2G, supplemental Fig. S2Ba, available at www.jneurosci.org as supplemental material) and because ClC-3 has been suggested to be important for insulin secretion (Barg et al., 2001), we also determined the insulin contents of isolated islets (Table 2). Again, no difference between the genotypes was noted.
Table 2.
Hormones in WT and ClC-3 KO tissues and serum samples
| WT ± SEM | n | KO ± SEM | n | p | |
|---|---|---|---|---|---|
| Catecholamines μg/mg adrenal gland | 4.83 ± 0.43 | 24 | 4.93 ± 0.36 | 21 | >0.05 |
| Insulin ng/islet | 47.54 ± 8.33 | 4 | 40.48 ± 5.98 | 4 | >0.05 |
| Epinephrine pg/ml serum | 145.0 ± 20.5 | 5 | 186.4 ± 18.7 | 5 | >0.05 |
| Epinephrine ng/ml urine | 19.28 ± 3.55 | 15 | 34.98 ± 9 0.94 | 15 | >0.05 |
| Norepinephrine pg/ml serum | 1290 ± 273 | 5 | 1528 ± 336 | 5 | >0.05 |
| Norepinephrine pg/ml urine | 91.76 ± 9.72 | 15 | 113.17 ± 11.72 | 15 | >0.05 |
| Insulin ng/ml serum | 1.46 ± 0.17 | 20 | 0.99 ± 0.10 | 19 | <0.05 |
| Leptin ng/ml serum | 1.81 ± 0.22 | 20 | 2.88 ± 0.38 | 19 | <0.05 |
There was no significant difference between the genotypes in the insulin content of islets or the catecholamine content of adrenal glands, and serum and urine concentrations of catecholamines. However, insulin levels were decreased in KO mice, whereas serum leptin levels were increased.
Because impaired secretion could lead to an altered steady-state concentration of the affected hormones, we measured them using ELISAs. Epinephrine and norepinephrine concentrations in serum and urine samples of ClC-3 KO and WT mice showed no significant differences either (Table 2). In contrast, serum insulin levels were significantly lower in KO animals (Table 2). However, ClC-3 KO mice weigh less than littermate controls (Stobrawa et al., 2001), and insulin is regulated in a complex manner to suit metabolic demands. Another key hormone involved in metabolism is leptin. It negatively impinges on insulin secretion by β cells (Seufert, 2004; Morioka et al., 2007). Leptin concentrations were significantly increased in KO animals (Table 2). The observed decrease in serum insulin might therefore be caused by changed leptin levels that may reflect the compromised health state of ClC-3 KO mice.
Subcellular localization of ClC-3 in neuroendocrine cells
In view of the secretory defects of ClC-3 KO chromaffin cells and the strong expression of ClC-3 in neuroendocrine cells, we asked whether ClC-3 is not only expressed on endosomes and synaptic vesicles (Stobrawa et al., 2001), but also on secretory LDCVs. In chromaffin cells, this vesicle class stores and secretes the catecholamines epinephrine and norepinephrine. In pancreatic β cells, LDCVs store and secrete insulin. Both types of neuroendocrine cells also contain SLMVs, which store acetylcholine in chromaffin cells and GABA in pancreatic β cells. LDCVs and SLMVs follow different biosynthetic pathways with LDCVs originating from the trans-Golgi network (TGN) and SLMVs from endosomal membranes (Thomas-Reetz and De Camilli, 1994).
Isolated chromaffin cells were infected with Semliki Forest virus-encoding HA-tagged ClC-3 and costained with an antibody against secretogranin II, a marker of LDCVs. Confocal microscopy revealed a lack of significant colocalization of ClC-3 with secretogranin II (Fig. 5A). These results were confirmed by subcellular fractionation. To obtain sufficient material, we used bovine adrenal gland medulla that was fractionated by density gradient centrifugation on a sucrose gradient (Fig. 5B). The fractions were analyzed by Western blotting using carboxypeptidase E and secretogranin I and II as markers for LDCVs, and synaptophysin as a marker for SLMVs. In chromaffin cells, synaptophysin is not limited to SLMVs (like in β cells) (see below), but is also found on LDCVs (Fournier et al., 1989). In the resulting biphasic distribution of synaptophysin across the gradient, the synaptophysin peak in fractions 7–11 represents SLMVs. The second peak in the more dense fractions 16–19 corresponds to LDCVs, as revealed by the presence of other LDCV markers. The prominent β-hexosaminidase activity within these LDCV-containing fractions indicates lysosomal contamination. The ClC-3 signal copurifies clearly with the first synaptophysin peak, whereas there is hardly any signal in the denser fractions. Hence, ClC-3 expression could be found in a chromaffin cell fraction containing SLMVs (and endosomes) (data not shown), but was not found on LDCVs.
Figure 5.
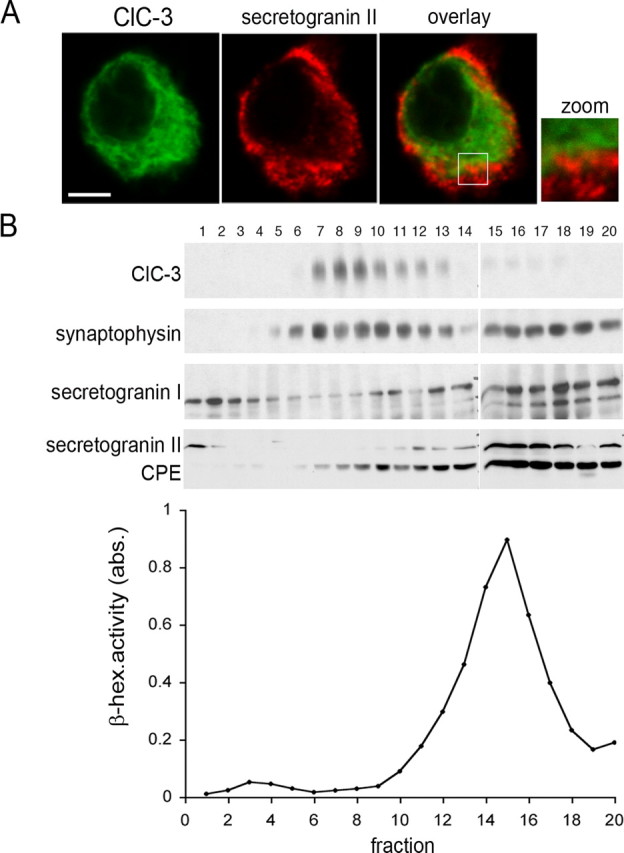
Subcellular localization of ClC-3 in chromaffin cells. A, Immunocytochemistry of isolated chromaffin cells obtained at embryonic day 17 that were transfected with HA-tagged ClC-3 and costained for the HA-tag and the LDCV marker secretogranin II. There is hardly any overlap between ClC-3 and LDCVs. Scale bar, 2.5 μm. B, Subcellular fractionation of vesicle preparation from bovine adrenal medulla on a sucrose step gradient that was centrifuged for 16 h at 100,000 × g. Twenty fractions were collected from top to bottom, TCA precipitated, and analyzed by Western blotting. Synaptophysin-specific antibodies were used to detect SLMVs and LDCVs. LDCVs were additionally detected by antibodies against secretogranin I and II and against carboxypeptidase E (CPE). β-Hexosaminidase enzymatic activity was assayed as marker for lysosomes. ClC-3 was detected using the antibody 3A4. ClC-3 peaks in the less dense fractions 7–9 that contain the first peak of synaptophysin signal, whereas the different LDCV markers show highest intensity in the denser fractions 15–20.
The prominent expression of ClC-3 in pancreatic β cells (supplemental Fig. S2Ba, available at www.jneurosci.org as supplemental material) and its proposed role in insulin exocytosis (Barg et al., 2001) motivated us to additionally investigate the subcellular localization of ClC-3 in β cells. Previous work using a different ClC-3 antibody in immunocytochemistry (that lacked KO controls) suggested the presence of ClC-3 on insulin-containing LDCVs (Barg et al., 2001). Because antibodies against either insulin or ClC-3 stain almost the entire cross-section of β cells (supplemental Fig. S2Ba, available at www.jneurosci.org as supplemental material), immunofluorescence might erroneously suggest a colocalization of both proteins. At high magnification, costaining α cells for glucagon and ClC-3 (Fig. 6Ea–Ec), or β cells for insulin and ClC-3 (Fig. 6Ed–Ef), showed a broad overlap of diffuse staining. Importantly, many ClC-3-positive puncta failed to show equivalent staining for glucagon or insulin, and vice versa (Fig. 6Ec,Ef,Ei). The β cell lines Rinm5F and INS-1E have less insulin-containing LDCVs per cell and are therefore better suited for colocalization studies. Unfortunately, staining cultured cells with our ClC-3 antibody resulted in a poor signal-to-noise ratio. We therefore transfected myc-tagged ClC-3 into INS-1E cells and costained with insulin. No significant colocalization was detected (Fig. 6F).
Figure 6.
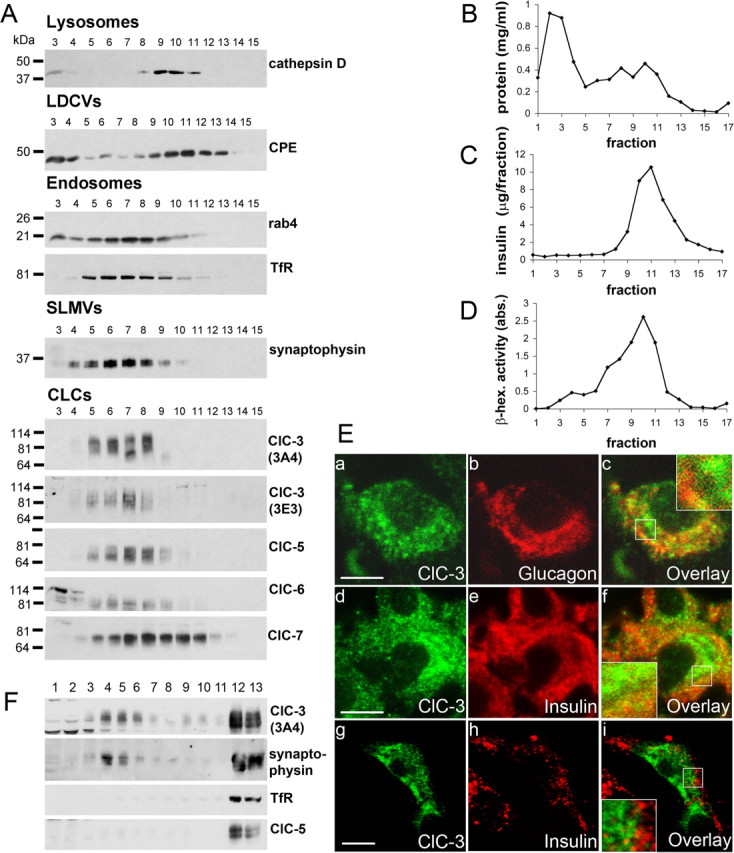
Presence of ClC-3 on SLMVs and endosomes of insulin-secreting INS-1E cells. A–D, Subcellular fractionation of INS-1E homogenates. Seventeen fractions (starting from the top) were collected after sucrose gradient centrifugation. A, They were analyzed by Western blotting with antibodies directed against cathepsin D (lysosomal marker), carboxypeptidase E (CPE; LDCV marker), rab4 and transferrin receptor (endosomal markers), synaptophysin (SLMV marker), and ClC-3, ClC-5, ClC-6, ClC-7. B, C, Protein content (B) and insulin concentration (as additional marker for LDCVs; C) of individual fractions. D, β-Hexosaminidase activity was measured as marker for lysosomes. LDCVs and lysosomes peak in a heavier fractions (9–13) than endosomes and SLMVs (fractions 5–9). ClC-3, ClC-5, and ClC-6 were present in factions containing endosomes and SLMVs. Only the lysosomal ClC-7 was found also in heavier fractions. Fractions 1–4 correspond to the “load” of the gradient and contain soluble proteins, including proteins leaked out of disrupted vesicles. E, Immunocytochemistry reveals that ClC-3 does not colocalize significantly with glucagon- or insulin-containing LDCVs. Ea–Ec, Pancreatic α cell costained for ClC-3 and glucagon. Ed–Ef, Pancreatic β cell costained for ClC-3 and insulin, both in native islet. Eg–Ei, Cultured INS-1E cells overexpressing myc-tagged ClC-3 show that ClC-3 and insulin clearly do not colocalize in these cells. Scale bars: Ea–Ef, 5 μm; Eg–Ei, 10 μm. Ec, Ef, Ei, Insets, Higher magnification of boxed areas. F, To separate endosomes and SLMVs, INS-1E supernatants were subjected to velocity centrifugation on a 5–25% glycerol gradient with a 50% sucrose cushion. Fraction 1 corresponds to the top of the gradient. Equal volumes of each fraction were analyzed by Western blotting with antibodies against transferrin receptor, ClC-5 (endosomal markers), synaptophysin (SLMV marker in addition to its presence on recycling endosomes), and ClC-3. In contrast to transferrin receptor and ClC-5, ClC-3 is not only present on endosomes, but also on distinct synaptophysin-positive membranes, which most likely represent SLMVs.
Although immunocytochemistry showed that insulin and ClC-3 are not strictly colocalized in β cells, these experiments could neither exclude nor confirm a partial coresidence in the same vesicles. We therefore turned to subcellular fractionation of β cell lines to separate LDCVs from SLMVs and endosomes. Western blot analysis (supplemental Fig. S3Aa, available at www.jneurosci.org as supplemental material) indicated that both INS-1E and Rinm5F β cell lines expressed, to different extents, the vesicular Cl− transporters ClC-3, ClC-4, ClC-5, ClC-6 and ClC-7, as well as carboxypeptidase E and synaptophysin (marker proteins for LDCVs and SLMVs, respectively). Homogenates of INS-1E cells were centrifuged on continuous sucrose gradients. The resulting fractions were probed in Western blots for vesicular CLCs and marker proteins (Fig. 6), and analyzed for protein and insulin contents and the activity of the lysosomal enzyme β-hexosaminidase (Fig. 6B–D). LDCVs were detected by their insulin contents and the presence of the LDCV marker carboxypeptidase E in fractions 9–14, with a peak at fraction 10–11. These LDCV fractions were heavily contaminated by lysosomes, as indicated by the presence of β-hexosaminidase and cathepsin D (Fig. 6A,D). Probing for synaptophysin showed that fractions 4–9 (peak: 6–7) contained SLMVs. Endosomal markers [rab4 and transferrin receptor (TfR)] peaked in the same fractions. Thus, SLMVs and endosomes (fractions 4–9) were separated from LDCVs (fractions 9–14). ClC-3 was detected by two different, KO-controlled antibodies (3A4 and 3E3) directed against the N and C termini of ClC-3, respectively (Stobrawa et al., 2001). Both antibodies detected ClC-3 in fractions 5–8, which contain endosomes and SLMVs. Almost no ClC-3 was detected in fractions 10–12 that contain the bulk of LDCVs. These results agree with the published localization of ClC-3 to endosomes and synaptic vesicles (Stobrawa et al., 2001; Salazar et al., 2004; Hara-Chikuma et al., 2005b), but do not support the presence of ClC-3 on insulin granules as suggested by others (Barg et al., 2001). ClC-7 was the only vesicular CLC that could be detected in significant amounts in fractions containing LDCVs. However, this can be explained by ClC-7 being in lysosomes (Kornak et al., 2001; Kasper et al., 2005), which contaminated these fractions. Consistent with their known localization on endosomes (Günther et al., 1998; Piwon et al., 2000; Poët et al., 2006), ClC-5 and ClC-6 copurified with endosomal markers (Fig. 6A). These fractions also contained ClC-7 (Kornak et al., 2001; Kasper et al., 2005).
We reproduced these findings in another insulin-secreting cell line (Rinm5F) (supplemental Fig. S3Ab,Ac, available at www.jneurosci.org as supplemental material) and with the limited amount of material that is available from mouse pancreatic islets (supplemental Fig. S3B, available at www.jneurosci.org as supplemental material). ClC-3 was again detected in fractions containing endosomes and SLMVs, but was virtually undetectable in fractions enriched for insulin and carboxypeptidase E.
The above experiments detected ClC-3 in fractions containing both endosomes and SLMVs. Nonequilibrium centrifugation of INS-1E homogenates on a glycerol gradient was used to separate these two similarly dense vesicle populations (Fig. 6F). Both ClC-3 and ClC-5 were present in fractions enriched for the endosomal marker TfR, whereas ClC-3, but not ClC-5, was detected in fractions 4–6 that contain SLMVs while being devoid of endosomes, as indicated by the presence of synaptophysin and the absence of TfR, respectively. We conclude that ClC-3 is present on both endosomes and synaptic-like microvesicles in both types of neuroendocrine cells, but is not detectable on LDCVs.
Discussion
The subcellular localization and physiological function of ClC-3 has been controversial. Several authors, including ourselves, found ClC-3 on endosomes and synaptic vesicles (Stobrawa et al., 2001; Li et al., 2002; Salazar et al., 2004; Hara-Chikuma et al., 2005b; Suzuki et al., 2006; Weylandt et al., 2007; Zhao et al., 2007), but others described ClC-3 as a plasma membrane channel (Kawasaki et al., 1994; Duan et al., 1997; Huang et al., 2001; Isnard-Bagnis et al., 2003; Wang et al., 2006). ClC-3 was also reported to localize to insulin-containing LDCVs of pancreatic β cells (Barg et al., 2001). Many of those studies were performed with transfected cells or lacked KO controls.
Using KO controlled immunocytochemistry, we show that ClC-3 is predominantly (if not exclusively) a vesicular protein in all tissues examined. ClC-3 expression is particularly high in neuroendocrine cells, where it is found on endosomes and SLMVs. Although ClC-3 was not detectable on LDCVs, the exocytosis of these vesicles was decreased in chromaffin cells.
In epithelial cells of the proximal tubule and the epididymis, ClC-3 expression appeared confined to vesicles of the apical cell pole. This resembles the presence of ClC-5 on apical endosomes of renal proximal tubular (Günther et al., 1998; Sakamoto et al., 1999; Piwon et al., 2000) and intestinal epithelial cells (Vandewalle et al., 2001), and in apical vesicles of acid-secreting cells of the distal renal tubule (Günther et al., 1998; Sakamoto et al., 1999) and epididymis (Isnard-Bagnis et al., 2003). Our KO-controlled staining does not support the reported plasma membrane localization of ClC-3 in epididymal epithelia (Isnard-Bagnis et al., 2003).
Neuronal cell bodies showed punctate, intracellular ClC-3 staining, consistent with an endosomal localization as in other cells. Neuropil was labeled intensely, with ClC-3 immunoreactivity partially overlapping with synaptophysin, in accord with ClC-3 being on SVs (Stobrawa et al., 2001; Salazar et al., 2004). Subcellular fractionation of neurosecretory cells showed that ClC-3 is not only on endosomes and SVs, but also on SLMVs, which share many properties with neuronal SVs (Thomas-Reetz and De Camilli, 1994). Our results agree with the localization of ClC-3 to SLMVs of PC12 cells (Salazar et al., 2004). The prominent staining for ClC-3 in neurosecretory cells may be owed to the distribution of SLMVs over their entire cell body, whereas neuronal synaptic vesicles are confined to tiny presynaptic boutons.
Apart from SLMVs, secretory cells contain LDCVs that store hormones like insulin or catecholamines and originate from the TGN (Thomas-Reetz and De Camilli, 1994). ClC-3 could not be detected on LDCVs in either chromaffin cells or pancreatic β cells. For β cells, our findings contrast previous work reporting prominent ClC-3 expression on insulin granules (Barg et al., 2001). However, the antibody used in that study also stained KO tissue in our hands. Furthermore, the dense staining of β cells for both ClC-3 and insulin precludes comparative staining of single vesicles and the dense package of LDCVs between a large number of much smaller SLMVs renders the interpretation of immunogold labeling difficult. The reported inhibition of β-cell exocytosis by SITS (Barg et al., 2001) is also difficult to interpret. Although no data are available on ClC-3, the related compound DIDS poorly inhibited the highly related Cl−/H+ exchanger ClC-5 when applied from either the outside (Steinmeyer et al., 1995) or inside (our unpublished results). Furthermore, these nonspecific inhibitors do not even target only anion transporters (Vega et al., 1988; Jentsch et al., 1989).
In apparent contrast to a role of ClC-3 in insulin exocytosis, Dickerson et al. (2002) did not find abnormalities in glucose tolerance tests in their Clcn3−/− mice that would have hinted at an insulin secretion defect. However, in vivo studies of insulin secretion in Clcn3−/− mice should be interpreted with caution. These mice not only have severe neurodegeneration, but are systemically sick and display marked growth retardation and changed hormonal status (Stobrawa et al., 2001; Dickerson et al., 2002). In addition to decreased insulin levels, KO mice had increased serum leptin concentrations. Leptin negatively regulates insulin secretion by various mechanisms (Seufert, 2004; Morioka et al., 2007), potentially explaining the decreased resting insulin concentrations in our Clcn3−/− mice. This hypothesis is supported by our observation that both leptin and insulin concentrations were similar to controls in β-cell-specific ClC-3 KO mice (our unpublished data).
We chose chromaffin cells as a well-established model for regulated exocytosis (Borges et al., 2008) to examine consequences of Clcn3 disruption on exocytosis. Like pancreatic β cells, chromaffin cells contain two secretory vesicle populations, i.e., LDCVs and much smaller SLMVs. To our surprise, both capacitance and amperometry experiments indicated that loss of ClC-3 significantly impaired chromaffin cell exocytosis. It is unlikely that this impairment reflects decreased exocytosis of SLMVs, which, in contrast to LDCVs, express detectable levels of ClC-3. SLMV exocytosis would only moderately increase membrane capacitance because of their small size. Indeed, amperometry directly showed a decreased secretion of catecholamines, the hormone stored in LDCVs (SLMVs contain acetylcholine in chromaffin cells). The reduced capacitance increase observed even at the first pulse indicates a reduction in docked vesicles that are ready to fuse, i.e., smaller readily releasable pool. The decreased frequency of spikes observed in amperometry points to a reduced fusion frequency, whereas the reduction in peak size suggests a reduced catecholamine content of individual LDCVs (Pothos et al., 2002). On the systemic level, the impaired secretory capacity of ClC-3 KO chromaffin cells we observed after strong stimulation in vitro did not compromise the ability of the KO animals to maintain normal catecholamine levels in vivo.
There are several alternative explanations for the effect of ClC-3 on LDCV exocytosis. One could speculate that minor amounts of ClC-3, which are below our detection limit, are expressed on LDCVs. Similar to its proposed role in endosomes and SVs, ClC-3 could contribute to their luminal acidification by providing a shunt conductance for the proton pump. Luminal acidification is not only important for the loading of vesicles, which may be affected in Clcn3−/− mice as suggested by amperometry, but also for exocytosis itself (Taupenot et al., 2005; Camacho et al., 2006). However, in pituitary AtT20 secretory cells, no effect of chloride on secretory granule acidification was found (Wu et al., 2001).
In view of our inability to detect ClC-3 on LDCVs of chromaffin and β cells, although it is so strongly expressed on their endosomes and SLMVs, and considering the differences in biogenesis of SLMVs and LDCVs (Thomas-Reetz and De Camilli, 1994), we rather prefer the hypothesis that the lack of ClC-3 primarily affects other trafficking and sorting events in these cells. By analogy to ClC-5, a very close relative of ClC-3, the loss of ClC-3 in endosomes may underlie the effects observed here. ClC-5 ablation results in defective endosomal acidification (Günther et al., 2003; Hara-Chikuma et al., 2005a) accompanied by a severe reduction in endocytosis (Piwon et al., 2000; Wang et al., 2000) and impaired membrane protein recycling. For instance, the abundance and plasma membrane localization of the endocytotic receptor megalin is decreased in proximal tubules lacking ClC-5 (Piwon et al., 2000; Christensen et al., 2003). A similar endosomal acidification defect might perturb endocytosis and recycling in Clcn3−/− chromaffin cells. Endocytosis and exocytosis are tightly interwoven. LDCV membrane proteins are recycled after exocytosis rather than being synthesized anew every time, and this recycling probably involves an endosomal intermediate (Vo et al., 2004). Both SLMVs and LDCVs are retrieved as vesicles with a diameter of 70 nm in Ins1 cells (MacDonald et al., 2005), and rapid endocytosis follows exocytosis in chromaffin cells (Perez Bay et al., 2007). Thus, as endocytosis ensures the necessary abundance and localization of membrane proteins, defects in endocytosis and recycling entail exocytosis defects. A defect in the endocytotic fission protein dynamin, for instance, has been reported to impair exocytosis of synaptic vesicles (Kawasaki et al., 2000). If an important protein of the exocytotic fusion machinery had reduced plasma membrane localization because of defective recycling, it might become rate limiting and reduce exocytosis already at the first pulse. Future studies will need to address the impact of ClC-3 on chromaffin cell endocytosis.
The lack of ClC-3 affects the acidification of both synaptic vesicles (Stobrawa et al., 2001) and endosomes (Hara-Chikuma et al., 2005b), similar to the impaired acidification of renal cortical endosomes observed after ClC-5 disruption (Günther et al., 2003). Although ClC-3 is expressed in apical vesicles of proximal tubules, no proteinuria was observed in ClC-3 KO mouse, quite in contrast to mice lacking endosomal ClC-5 (Piwon et al., 2000). In the proximal tubule, however, the lack of ClC-3 might be compensated for by the prominent expression of ClC-5. In this respect, it is interesting to note that we found significant levels of ClC-5 in endosomal fractions of β cells, and of ClC-4 in chromaffin cells. Thus, one may speculate that deleting ClC-3 together with ClC-4 or ClC-5 might lead to a more severe secretory phenotype if it depends on endosomal trafficking. Given the severe phenotypes of such double KOs (our unpublished observation), a test of this hypothesis will require tissue- or cell-specific KOs.
Footnotes
This work was supported in part by Deutsche Forschungsgemeinschaft Grant SFB444 (T.J.J.). We thank Barbara Merz and Nicole Krönke for technical assistance with immunohistochemistry and mice breeding, Ellen Orthey for help with islet isolations, and Lena Wartosch for performing the experiment shown in Figure 1A–D. We thank Jens Rettig (Homburg) for his invitation to learn chromaffin cell cultures and flash photolysis in his laboratory, Erik Renström and Patrik Rorsman for advice on obtaining pancreatic islets and β cells, IBL Hamburg for their assistance with the Cat Combi ELISA, and Wieland Huttner for the secretogranin antibodies.
References
- Accardi A, Miller C. Secondary active transport mediated by a prokaryotic homologue of ClC Cl− channels. Nature. 2004;427:803–807. doi: 10.1038/nature02314. [DOI] [PubMed] [Google Scholar]
- Amatore C, Arbault S, Bonifas I, Bouret Y, Erard M, Ewing AG, Sombers LA. Correlation between vesicle quantal size and fusion pore release in chromaffin cell exocytosis. Biophys J. 2005;88:4411–4420. doi: 10.1529/biophysj.104.053736. [DOI] [PMC free article] [PubMed] [Google Scholar]
- Arreola J, Begenisch T, Nehrke K, Nguyen HV, Park K, Richardson L, Yang B, Schutte BC, Lamb FS, Melvin JE. Secretion and cell volume regulation by salivary acinar cells from mice lacking expression of the Clcn3 Cl− channel gene. J Physiol 545. 2002;1:207–216. doi: 10.1113/jphysiol.2002.021980. [DOI] [PMC free article] [PubMed] [Google Scholar]
- Barg S, Huang P, Eliasson L, Nelson DJ, Obermüller S, Rorsman P, Thévenod F, Renström E. Priming of insulin granules for exocytosis by granular Cl− uptake and acidification. J Cell Sci. 2001;114:2145–2154. doi: 10.1242/jcs.114.11.2145. [DOI] [PubMed] [Google Scholar]
- Borges R, Camacho M, Gillis KD. Measuring secretion in chromaffin cells using electrophysiological and electrochemical methods. Acta Physiol (Oxf) 2008;192:173–184. doi: 10.1111/j.1748-1716.2007.01814.x. [DOI] [PubMed] [Google Scholar]
- Borsani G, Rugarli EI, Taglialatela M, Wong C, Ballabio A. Characterization of a human and murine gene (CLCN3) sharing similarities to voltage-gated chloride channels and to a yeast integral membrane protein. Genomics. 1995;27:131–141. doi: 10.1006/geno.1995.1015. [DOI] [PubMed] [Google Scholar]
- Camacho M, Machado JD, Montesinos MS, Criado M, Borges R. Intragranular pH rapidly modulates exocytosis in adrenal chromaffin cells. J Neurochem. 2006;96:324–334. doi: 10.1111/j.1471-4159.2005.03526.x. [DOI] [PubMed] [Google Scholar]
- Cameron PL, Südhof TC, Jahn R, De Camilli P. Colocalization of synaptophysin with transferrin receptors: implications for synaptic vesicle biogenesis. J Cell Biol. 1991;115:151–164. doi: 10.1083/jcb.115.1.151. [DOI] [PMC free article] [PubMed] [Google Scholar]
- Chow RH, von Rüden L, Neher E. Delay in vesicle fusion revealed by electrochemical monitoring of single secretory events in adrenal chromaffin cells. Nature. 1992;356:60–63. doi: 10.1038/356060a0. [DOI] [PubMed] [Google Scholar]
- Christensen EI, Devuyst O, Dom G, Nielsen R, Van der Smissen P, Verroust P, Leruth M, Guggino WB, Courtoy PJ. Loss of chloride channel ClC-5 impairs endocytosis by defective trafficking of megalin and cubilin in kidney proximal tubules. Proc Natl Acad Sci U S A. 2003;100:8472–8477. doi: 10.1073/pnas.1432873100. [DOI] [PMC free article] [PubMed] [Google Scholar]
- Dickerson LW, Bonthius DJ, Schutte BC, Yang B, Barna TJ, Bailey MC, Nehrke K, Williamson RA, Lamb FS. Altered GABAergic function accompanies hippocampal degeneration in mice lacking ClC-3 voltage-gated chloride channels. Brain Res. 2002;958:227–250. doi: 10.1016/s0006-8993(02)03519-9. [DOI] [PubMed] [Google Scholar]
- Duan D, Winter C, Cowley S, Hume JR, Horowitz B. Molecular identification of a volume-regulated chloride channel. Nature. 1997;390:417–421. doi: 10.1038/37151. [DOI] [PubMed] [Google Scholar]
- Fournier S, Novas ML, Trifaró JM. Subcellular distribution of 65,000 calmodulin-binding protein (p65) and synaptophysin (p38) in adrenal medulla. J Neurochem. 1989;53:1043–1049. doi: 10.1111/j.1471-4159.1989.tb07393.x. [DOI] [PubMed] [Google Scholar]
- Friedrich T, Breiderhoff T, Jentsch TJ. Mutational analysis demonstrates that ClC-4 and ClC-5 directly mediate plasma membrane currents. J Biol Chem. 1999;274:896–902. doi: 10.1074/jbc.274.2.896. [DOI] [PubMed] [Google Scholar]
- Gong W, Xu H, Shimizu T, Morishima S, Tanabe S, Tachibe T, Uchida S, Sasaki S, Okada Y. ClC-3-independent, PKC-dependent activity of volume-sensitive Cl channel in mouse ventricular cardiomyocytes. Cell Physiol Biochem. 2004;14:213–224. doi: 10.1159/000080330. [DOI] [PubMed] [Google Scholar]
- Günther W, Lüchow A, Cluzeaud F, Vandewalle A, Jentsch TJ. ClC-5, the chloride channel mutated in Dent's disease, colocalizes with the proton pump in endocytotically active kidney cells. Proc Natl Acad Sci U S A. 1998;95:8075–8080. doi: 10.1073/pnas.95.14.8075. [DOI] [PMC free article] [PubMed] [Google Scholar]
- Günther W, Piwon N, Jentsch TJ. The ClC-5 chloride channel knock-out mouse - an animal model for Dent's disease. Pflügers Arch. 2003;445:456–462. doi: 10.1007/s00424-002-0950-6. [DOI] [PubMed] [Google Scholar]
- Hara-Chikuma M, Wang Y, Guggino SE, Guggino WB, Verkman AS. Impaired acidification in early endosomes of ClC-5 deficient proximal tubule. Biochem Biophys Res Commun. 2005a;329:941–946. doi: 10.1016/j.bbrc.2005.02.060. [DOI] [PubMed] [Google Scholar]
- Hara-Chikuma M, Yang B, Sonawane ND, Sasaki S, Uchida S, Verkman AS. ClC-3 chloride channels facilitate endosomal acidification and chloride accumulation. J Biol Chem. 2005b;280:1241–1247. doi: 10.1074/jbc.M407030200. [DOI] [PubMed] [Google Scholar]
- Huang P, Liu J, Di A, Robinson NC, Musch MW, Kaetzel MA, Nelson DJ. Regulation of human ClC-3 channels by multifunctional Ca2+/calmodulin dependent protein kinase. J Biol Chem. 2001;276:20093–20100. doi: 10.1074/jbc.M009376200. [DOI] [PubMed] [Google Scholar]
- Isnard-Bagnis C, Da Silva N, Beaulieu V, Yu AS, Brown D, Breton S. Detection of ClC-3 and ClC-5 in epididymal epithelium: immunofluorescence and RT-PCR after LCM. Am J Physiol Cell Physiol. 2003;284:C220–C232. doi: 10.1152/ajpcell.00374.2001. [DOI] [PubMed] [Google Scholar]
- Jentsch TJ. Chloride and the endosomal-lysosomal pathway: emerging roles of CLC chloride transporters. J Physiol. 2007;578:633–640. doi: 10.1113/jphysiol.2006.124719. [DOI] [PMC free article] [PubMed] [Google Scholar]
- Jentsch TJ. CLC chloride channels and transporters: from genes to protein structure, pathology and physiology. Crit Rev Biochem Mol Biol. 2008;43:3–36. doi: 10.1080/10409230701829110. [DOI] [PubMed] [Google Scholar]
- Jentsch TJ, Garcia AM, Lodish HF. Primary structure of a novel 4-acetamido-4′-isothiocyanostilbene-2,2′-disulphonic acid (SITS)-binding membrane protein highly expressed in Torpedo californica electroplax. Biochem J. 1989;261:155–166. doi: 10.1042/bj2610155. [DOI] [PMC free article] [PubMed] [Google Scholar]
- Kasper D, Planells-Cases R, Fuhrmann JC, Scheel O, Zeitz O, Ruether K, Schmitt A, Poët M, Steinfeld R, Schweizer M, Kornak U, Jentsch TJ. Loss of the chloride channel ClC-7 leads to lysosomal storage disease and neurodegeneration. EMBO J. 2005;24:1079–1091. doi: 10.1038/sj.emboj.7600576. [DOI] [PMC free article] [PubMed] [Google Scholar]
- Kawasaki F, Hazen M, Ordway RW. Fast synaptic fatigue in shibire mutants reveals a rapid requirement for dynamin in synaptic vesicle membrane trafficking. Nat Neurosci. 2000;3:859–860. doi: 10.1038/78753. [DOI] [PubMed] [Google Scholar]
- Kawasaki M, Uchida S, Monkawa T, Miyawaki A, Mikoshiba K, Marumo F, Sasaki S. Cloning and expression of a protein kinase C-regulated chloride channel abundantly expressed in rat brain neuronal cells. Neuron. 1994;12:597–604. doi: 10.1016/0896-6273(94)90215-1. [DOI] [PubMed] [Google Scholar]
- Kornak U, Kasper D, Bösl MR, Kaiser E, Schweizer M, Schulz A, Friedrich W, Delling G, Jentsch TJ. Loss of the ClC-7 chloride channel leads to osteopetrosis in mice and man. Cell. 2001;104:205–215. doi: 10.1016/s0092-8674(01)00206-9. [DOI] [PubMed] [Google Scholar]
- Lange PF, Wartosch L, Jentsch TJ, Fuhrmann JC. ClC-7 requires Ostm1 as a β-subunit to support bone resorption and lysosomal function. Nature. 2006;440:220–223. doi: 10.1038/nature04535. [DOI] [PubMed] [Google Scholar]
- Lelkes PI, Friedman JE, Rosenheck K. Direct fluorometric assay of catecholamine secretion from isolated bovine adrenal chromaffin cells. J Neurosci Methods. 1985;13:249–255. doi: 10.1016/0165-0270(85)90073-1. [DOI] [PubMed] [Google Scholar]
- Li X, Wang T, Zhao Z, Weinman SA. The ClC-3 chloride channel promotes acidification of lysosomes in CHO-K1 and Huh-7 cells. Am J Physiol Cell Physiol. 2002;282:C1483–C1491. doi: 10.1152/ajpcell.00504.2001. [DOI] [PubMed] [Google Scholar]
- Lloyd SE, Pearce SH, Fisher SE, Steinmeyer K, Schwappach B, Scheinman SJ, Harding B, Bolino A, Devoto M, Goodyer P, Rigden SP, Wrong O, Jentsch TJ, Craig IW, Thakker RV. A common molecular basis for three inherited kidney stone diseases. Nature. 1996;379:445–449. doi: 10.1038/379445a0. [DOI] [PubMed] [Google Scholar]
- MacDonald PE, Eliasson L, Rorsman P. Calcium increases endocytotic vesicle size and accelerates membrane fission in insulin-secreting INS-1 cells. J Cell Sci. 2005;118:5911–5920. doi: 10.1242/jcs.02685. [DOI] [PubMed] [Google Scholar]
- Matsuda JJ, Filali MS, Volk KA, Collins MM, Moreland JG, Lamb FS. Overexpression of ClC-3 in HEK293T cells yields novel currents that are pH-dependent. Am J Physiol Cell Physiol. 2008;294:C251–C262. doi: 10.1152/ajpcell.00338.2007. [DOI] [PubMed] [Google Scholar]
- Miller FJ, Jr, Filali M, Huss GJ, Stanic B, Chamseddine A, Barna TJ, Lamb FS. Cytokine activation of nuclear factor κB in vascular smooth muscle cells requires signaling endosomes containing Nox1 and ClC-3. Circ Res. 2007;101:663–671. doi: 10.1161/CIRCRESAHA.107.151076. [DOI] [PubMed] [Google Scholar]
- Moreland JG, Davis AP, Bailey G, Nauseef WM, Lamb FS. Anion channels, including ClC-3, are required for normal neutrophil oxidative function, phagocytosis, and transendothelial migration. J Biol Chem. 2006;281:12277–12288. doi: 10.1074/jbc.M511030200. [DOI] [PubMed] [Google Scholar]
- Morioka T, Asilmaz E, Hu J, Dishinger JF, Kurpad AJ, Elias CF, Li H, Elmquist JK, Kennedy RT, Kulkarni RN. Disruption of leptin receptor expression in the pancreas directly affects beta cell growth and function in mice. J Clin Invest. 2007;117:2860–2868. doi: 10.1172/JCI30910. [DOI] [PMC free article] [PubMed] [Google Scholar]
- Owe-Larsson B, Berglund M, Kristensson K, Garoff H, Larhammar D, Brodin L, Löw P. Perturbation of the synaptic release machinery in hippocampal neurons by overexpression of SNAP-25 with the Semliki Forest virus vector. Eur J Neurosci. 1999;11:1981–1987. doi: 10.1046/j.1460-9568.1999.00614.x. [DOI] [PubMed] [Google Scholar]
- Perez Bay AE, Ibañez LI, Marengo FD. Rapid recovery of releasable vesicles and formation of nonreleasable endosomes follow intense exocytosis in chromaffin cells. Am J Physiol Cell Physiol. 2007;293:C1509–C1522. doi: 10.1152/ajpcell.00632.2006. [DOI] [PubMed] [Google Scholar]
- Picollo A, Pusch M. Chloride/proton antiporter activity of mammalian CLC proteins ClC-4 and ClC-5. Nature. 2005;436:420–423. doi: 10.1038/nature03720. [DOI] [PubMed] [Google Scholar]
- Piwon N, Günther W, Schwake M, Bösl MR, Jentsch TJ. ClC-5 Cl−-channel disruption impairs endocytosis in a mouse model for Dent's disease. Nature. 2000;408:369–373. doi: 10.1038/35042597. [DOI] [PubMed] [Google Scholar]
- Poët M, Kornak U, Schweizer M, Zdebik AA, Scheel O, Hoelter S, Wurst W, Schmitt A, Fuhrmann JC, Planells-Cases R, Mole SE, Hübner CA, Jentsch TJ. Lysosomal storage disease upon disruption of the neuronal chloride transport protein ClC-6. Proc Natl Acad Sci U S A. 2006;103:13854–13859. doi: 10.1073/pnas.0606137103. [DOI] [PMC free article] [PubMed] [Google Scholar]
- Pothos EN, Mosharov E, Liu KP, Setlik W, Haburcak M, Baldini G, Gershon MD, Tamir H, Sulzer D. Stimulation-dependent regulation of the pH, volume and quantal size of bovine and rodent secretory vesicles. J Physiol. 2002;542:453–476. doi: 10.1113/jphysiol.2002.018630. [DOI] [PMC free article] [PubMed] [Google Scholar]
- Sakamoto H, Sado Y, Naito I, Kwon TH, Inoue S, Endo K, Kawasaki M, Uchida S, Nielsen S, Sasaki S, Marumo F. Cellular and subcellular immunolocalization of ClC-5 channel in mouse kidney: colocalization with H+-ATPase. Am J Physiol. 1999;277:F957–F965. doi: 10.1152/ajprenal.1999.277.6.F957. [DOI] [PubMed] [Google Scholar]
- Salazar G, Love R, Styers ML, Werner E, Peden A, Rodriguez S, Gearing M, Wainer BH, Faundez V. AP-3-dependent mechanisms control the targeting of a chloride channel (ClC-3) in neuronal and non-neuronal cells. J Biol Chem. 2004;279:25430–25439. doi: 10.1074/jbc.M402331200. [DOI] [PubMed] [Google Scholar]
- Scheel O, Zdebik AA, Lourdel S, Jentsch TJ. Voltage-dependent electrogenic chloride proton exchange by endosomal CLC proteins. Nature. 2005;436:424–427. doi: 10.1038/nature03860. [DOI] [PubMed] [Google Scholar]
- Schmieder S, Lindenthal S, Ehrenfeld J. Tissue-specific N-glycosylation of the CIC-3 chloride channel. Biochem Biophys Res Commun. 2001;286:635–640. doi: 10.1006/bbrc.2001.5407. [DOI] [PubMed] [Google Scholar]
- Seufert J. Leptin effects on pancreatic β-cell gene expression and function. Diabetes. 2004;53(Suppl 1):S152–S158. doi: 10.2337/diabetes.53.2007.s152. [DOI] [PubMed] [Google Scholar]
- Steinmeyer K, Schwappach B, Bens M, Vandewalle A, Jentsch TJ. Cloning and functional expression of rat CLC-5, a chloride channel related to kidney disease. J Biol Chem. 1995;270:31172–31177. doi: 10.1074/jbc.270.52.31172. [DOI] [PubMed] [Google Scholar]
- Stobrawa SM, Breiderhoff T, Takamori S, Engel D, Schweizer M, Zdebik AA, Bösl MR, Ruether K, Jahn H, Draguhn A, Jahn R, Jentsch TJ. Disruption of ClC-3, a chloride channel expressed on synaptic vesicles, leads to a loss of the hippocampus. Neuron. 2001;29:185–196. doi: 10.1016/s0896-6273(01)00189-1. [DOI] [PubMed] [Google Scholar]
- Suzuki T, Rai T, Hayama A, Sohara E, Suda S, Itoh T, Sasaki S, Uchida S. Intracellular localization of ClC chloride channels and their ability to form hetero-oligomers. J Cell Physiol. 2006;206:792–798. doi: 10.1002/jcp.20516. [DOI] [PubMed] [Google Scholar]
- Taupenot L, Harper KL, O'Connor DT. Role of H+-ATPase-mediated acidification in sorting and release of the regulated secretory protein chromogranin A: evidence for a vesiculogenic function. J Biol Chem. 2005;280:3885–3897. doi: 10.1074/jbc.M408197200. [DOI] [PubMed] [Google Scholar]
- Thomas-Reetz AC, De Camilli P. A role for synaptic vesicles in non-neuronal cells: clues from pancreatic β-cells and from chromaffin cells. FASEB J. 1994;8:209–216. doi: 10.1096/fasebj.8.2.7907072. [DOI] [PubMed] [Google Scholar]
- Vandewalle A, Cluzeaud F, Peng KC, Bens M, Lüchow A, Günther W, Jentsch TJ. Tissue distribution and subcellular localization of the ClC-5 chloride channel in rat intestinal cells. Am J Physiol Cell Physiol. 2001;280:C373–C381. doi: 10.1152/ajpcell.2001.280.2.C373. [DOI] [PubMed] [Google Scholar]
- Vega FV, Cabero JL, Mårdh S. Inhibition of H,K-ATPase and Na,K-ATPase by DIDS, a disulphonic stilbene derivative. Acta Physiol Scand. 1988;134:543–547. doi: 10.1111/j.1748-1716.1998.tb08529.x. [DOI] [PubMed] [Google Scholar]
- Vo YP, Hutton JC, Angleson JK. Recycling of the dense-core vesicle membrane protein phogrin in Min6 β-cells. Biochem Biophys Res Commun. 2004;324:1004–1010. doi: 10.1016/j.bbrc.2004.09.147. [DOI] [PubMed] [Google Scholar]
- Voets T. Dissection of three Ca2+-dependent steps leading to secretion in chromaffin cells from mouse adrenal slices. Neuron. 2000;28:537–545. doi: 10.1016/s0896-6273(00)00131-8. [DOI] [PubMed] [Google Scholar]
- Wang SS, Devuyst O, Courtoy PJ, Wang XT, Wang H, Wang Y, Thakker RV, Guggino S, Guggino WB. Mice lacking renal chloride channel, CLC-5, are a model for Dent's disease, a nephrolithiasis disorder associated with defective receptor-mediated endocytosis. Hum Mol Genet. 2000;9:2937–2945. doi: 10.1093/hmg/9.20.2937. [DOI] [PubMed] [Google Scholar]
- Wang XQ, Deriy LV, Foss S, Huang P, Lamb FS, Kaetzel MA, Bindokas V, Marks JD, Nelson DJ. CLC-3 channels modulate excitatory synaptic transmission in hippocampal neurons. Neuron. 2006;52:321–333. doi: 10.1016/j.neuron.2006.08.035. [DOI] [PubMed] [Google Scholar]
- Weylandt KH, Nebrig M, Jansen-Rosseck N, Amey JS, Carmena D, Wiedenmann B, Higgins CF, Sardini A. ClC-3 expression enhances etoposide resistance by increasing acidification of the late endocytic compartment. Mol Cancer Ther. 2007;6:979–986. doi: 10.1158/1535-7163.MCT-06-0475. [DOI] [PubMed] [Google Scholar]
- Wu MM, Grabe M, Adams S, Tsien RY, Moore HP, Machen TE. Mechanisms of pH regulation in the regulated secretory pathway. J Biol Chem. 2001;276:33027–33035. doi: 10.1074/jbc.M103917200. [DOI] [PubMed] [Google Scholar]
- Xu T, Naraghi M, Kang H, Neher E. Kinetic studies of Ca2+ binding and Ca2+ clearance in the cytosol of adrenal chromaffin cells. Biophys J. 1997;73:532–545. doi: 10.1016/S0006-3495(97)78091-3. [DOI] [PMC free article] [PubMed] [Google Scholar]
- Yoshikawa M, Uchida S, Ezaki J, Rai T, Hayama A, Kobayashi K, Kida Y, Noda M, Koike M, Uchiyama Y, Marumo F, Kominami E, Sasaki S. CLC-3 deficiency leads to phenotypes similar to human neuronal ceroid lipofuscinosis. Genes Cells. 2002;7:597–605. doi: 10.1046/j.1365-2443.2002.00539.x. [DOI] [PubMed] [Google Scholar]
- Zdebik AA, Zifarelli G, Bergsdorf EY, Soliani P, Scheel O, Jentsch TJ, Pusch M. Determinants of anion-proton coupling in mammalian endosomal CLC proteins. J Biol Chem. 2008;283:4219–4227. doi: 10.1074/jbc.M708368200. [DOI] [PubMed] [Google Scholar]
- Zhao Z, Li X, Hao J, Winston JH, Weinman SA. The ClC-3 chloride transport protein traffics through the plasma membrane via interaction of an N-terminal dileucine cluster with clathrin. J Biol Chem. 2007;282:29022–29031. doi: 10.1074/jbc.M703506200. [DOI] [PubMed] [Google Scholar]