

Abstract
Medium spiny neurons (MSNs) provide the principal output for the dorsal striatum. Those that express dopamine D2 receptors (D2+) project to the globus pallidus external and are thought to inhibit movement, whereas those that express dopamine D1 receptors (D1+) project to the substantia nigra pars reticulata and are thought to facilitate movement. Whole-cell and outside-out patch recordings in slices from bacterial artificial chromosome transgenic mice examined the role of GABAA receptor-mediated currents in dopamine receptor D1+ striatonigral and D2+ striatopallidal MSNs. Although inhibitory synaptic currents were similar between the two neuronal populations, D2+ MSNs showed greater GABAA receptor-mediated tonic currents. TTX application abolished the tonic current to a similar extent as GABAA antagonists, suggesting a synaptic origin of the ambient GABA. Low GABA concentrations produced larger whole-cell responses and longer GABA channel openings in D2+ than in D1+ MSNs. Recordings from MSNs in α1−/− mice and pharmacological analysis of tonic currents suggested greater expression of α5-containing GABAA receptors in D2+ than in D1+ MSNs. As a number of disorders such as Parkinson's disease, Huntington's chorea, and tardive dyskinesia arise from an imbalance between these two pathways, the GABAA receptors responsible for tonic currents in D2+ MSNs may be a potential target for therapeutic intervention.
Keywords: GABAA receptors, tonic inhibition, striatum, medium spiny neurons, patch-clamp, chloride channel
Introduction
The dorsal striatum (caudate/putamen in primates) is a major nucleus of the basal ganglia and plays a role in motor behavior and habit learning (Graybiel, 2005). Striatal cells receive convergent glutamatergic afferents from the cortex and thalamus, dopaminergic afferents from the substantia nigra pars compacta (SNpc) (Graybiel, 2005), and are intrinsically innervated by striatal GABAergic and cholinergic interneurons (Tepper et al., 2004). Ninety-five percent of striatal cells are GABAergic projections called medium spiny neurons. They are indistinguishable in somatic size and basic physiological properties (Venance and Glowinski, 2003) and belong to one of two pathways. Striatopallidal medium spiny neurons (MSNs) of the “indirect pathway” expresses dopamine D2 receptors (D2+) and inhibit movement, whereas striatonigral MSNs of the “direct pathway” express dopamine D1 receptors (D1+), and facilitate movement (Gerfen et al., 1990). Parkinson's disease, a debilitating neurodegenerative disorder characterized by impaired initiation of movement, is caused by a loss of dopaminergic cells in the SNpc (Alexi et al., 2000), leading to increased cell excitability and inhibitory output of the striatopallidal MSNs (Filion and Tremblay, 1991; Raz et al., 2000). This effect has been linked to changes in GABAergic control of MSN action potential firing (Mallet et al., 2006).
GABA is the main inhibitory neurotransmitter in the CNS. GABAA receptors are pentamers comprising distinct subunits (α1–α6, β1–β3, γ1–γ3, δ, ε, θ1–θ3, π, and ρ1–ρ3) and form a ligand-gated ion pore that is permeable to Cl− and HCO3− (MacDonald and Olsen, 1994). The specific subunit composition of the receptors determines the channel kinetics, pharmacological sensitivity (MacDonald and Olsen, 1994; Vicini and Ortinski, 2004), and subcellular localization (Fritschy and Brunig, 2004; Lüscher and Keller, 2004). Synaptic GABAA receptors have a relatively low affinity for GABA (Macdonald and Olsen, 1994; Stell and Mody, 2002). They mediate phasic inhibition in which quantal release of GABA from a presynaptic neuron induces a distinct high-amplitude, rapidly decaying, generally hyperpolarizing event in the postsynaptic neuron (Koos et al., 2004) and play an important role in temporally regulating spike timing (Pouille and Scanziani, 2001; Tepper et al., 2004).
However, low concentrations of GABA can also generate tonic inhibitory currents at high-affinity extrasynaptic GABAA receptors. These currents usually have lower amplitudes and longer decay times than synaptic receptors and show little or no desensitization (Farrant and Nusser, 2005). The biophysical properties of tonic receptors provide a cell with a powerful persistent inhibition that allows for regulation of network excitability and information processing (Semyanov et al., 2003; Scimemi et al., 2005).
In this study, we provide evidence that MSNs contain GABAA receptors that can mediate inhibitory tonic currents. We demonstrate that the D2+ MSNs show larger tonic inhibitory currents and a higher sensitivity to low concentrations of GABA than the D1+ MSNs, which is likely attributable to greater expression of α5-subunit-containing GABAA receptors in D2+ MSNs. Furthermore, we show that these tonic currents play an important role in regulating MSN excitability and thus may be a potential target to pharmacologically regulate the imbalance in striatal output underlying the symptoms of Parkinson's disease.
Materials and Methods
Animals.
Bacterial artificial chromosome (BAC) D2 enhanced green fluorescent protein (EGFP) and BAC D1 EGFP mice (Gong et al., 2003) (provided by David Lovinger National Institute on Alcoholism and Alcohol Abuse, Bethesda, MD) were crossed with C57BL/6 mice. α1-subunit-deficient mice were described by Vicini et al. (2001) and genotyped with PCR as described by Ortinski et al. (2004). Slices were prepared from postnatal day 16–25 male and female mice.
When BAC D2 EGFP mice were used, MSNs were classified as being either dopamine D2 receptor positive or negative by their expression of EGFP. Because previous studies have demonstrated that MSNs express either dopamine D1 or D2 receptors (Gerfen et al., 1990; Day et al., 2006), all MSNs negative for EGFP in the BAC D2 EGFP mice were presumed to be D1+ and will hereafter be referred to as such. To verify that the results obtained were not attributable to EGFP expression or the specific mouse model, some experiments were repeated in the BAC D1 EGFP mice. In these experiments, D1+ MSNs were identified by EGFP expression, and those that were negative for EGFP were presumed to be D2+. Because there were no differences observed between the two strains of mice, data were pooled and all MSNs are defined as either D1+ or D2+.
Slice preparation.
Mice were killed by decapitation in agreement with the guidelines of the American Veterinary Medical Association Panel on Euthanasia and the Georgetown University Animal Care and Use Committee. The whole brain was removed and placed in an ice-cold slicing solution containing the following (in mm): 85.0 NaCl, 2.5 KCl, 1.0 CaCl2, 4.0 MgCl2, 1.0 NaH2PO4, 25.0 NaHCO3, 25.0 glucose, and 75.0 sucrose. Corticostriatal coronal slices, 250 μm, were prepared using a Vibratome 3000 Plus Sectioning System (Vibratome, St. Louis, MO) and were incubated in the slicing solution at 32°C for 30 min. Slices then recovered for 30 min at 32°C in artificial CSF (aCSF) containing the following (in mm): 124.0 NaCl, 4.5 KCl, 1.2 NaH2PO4, 26.0 NaHCO3, 2.0 CaCl2, 1.0 MgCl2, and 10.0 d-glucose (all from Sigma, St. Louis, MO). During experiments, slices were submerged and continuously perfused (2–3 ml/min) with aCSF at room temperature 22–24°C or 31°C when indicated. Slice temperature was maintained with an inline heater (TC-324B; Warner Instruments, Hamden, CT) and continuously monitored with a submerged miniature thermistor probe situated within the recording chamber adjacent to the slice. All solutions were maintained at pH 7.4 by continuous bubbling with 95% O2/5% CO2.
Slices were visualized under an upright microscope (E600FN; Nikon, Tokyo, Japan) equipped with Nomarski optics and an electrically insulated 60× water immersion objective with a long working distance (2 mm) and high numerical aperture (1.0). Recording electrodes were pulled on a vertical pipette puller from borosilicate glass capillaries (Wiretrol II; Drummond, Broomall, PA) and filled with KCl-based internal recording solution (KCl internal) containing the following (in mm): 145 KCl, 10 HEPES, 5 ATP.Mg, 0.2 GTP-Na, and 10 EGTA, adjusted to pH 7.2 with KOH. Alternatively, for K-gluconate-based internal solutions (K-gluconate internal), KCl was replaced with equimolar K-gluconate. In CsCl-based internal solutions (CsCl internal), KCl was replaced with equimolar CsCl, and, in this case, pH was adjusted with CsOH.
Whole-cell recordings.
Voltage-clamp recordings were performed using whole-cell configuration of the patch-clamp technique at a pipette voltage of −60 mV using the Axopatch 200B amplifier (Molecular Device, Sunnyvale, CA). Access resistance was monitored throughout the recordings, and experiments with >20% change were discarded. When potassium-based internal solutions were used, depolarizing current injections were given in current-clamp configuration, and only cells that showed the typical response for MSNs (see Results) were used in the analysis. Before each series of current step injection protocols, cells were brought back to −65 mV when K-gluconate internal was used and −70 mV when KCl internal was used. Responses to two repeated series of current injections were averaged for all firing frequency and input resistance data.
Stock solutions of bicuculline methobromide (BIC), 1-[2-([(diphenylmethylene) imino]oxy)ethyl]-1,2,5,6-tetrahydro-3-pyridine-carboxylic acid hydrochloride (NO711), SR95531 [gabazine (GBZ)], strychnine, tetrodotoxin (TTX), 4,5,6,7-tetrahydroisoxazolo{5,4-c}pyridine-3-ol (THIP), and GABA (all from Sigma) and sodium-2,3-dihydro-6-nitro-7-sulfamoyl-benzo[f]quinoxaline (NBQX) (Tocris Bioscience, Ellisville, MO), were prepared in water. Zolpidem and L655,708 (Tocris Bioscience) were dissolved in dimethylsulfoxide (<0.0001% final concentration). All stock solutions were then diluted to the desired concentration in the aCSF and were applied locally through a Y tube (Murase et al., 1989) modified for optimal solution exchange in brain slices (Hevers and Luddens, 2002) except when noted.
Currents were filtered at 2 kHz with a low-pass Bessel filter and digitized at 5–10 kHz (for whole cells) and 20 kHz (for single channels) using a personal computer equipped with Digidata 1322A data acquisition board and pClamp9 software (both from Molecular Devices). Off-line data analysis, curve fitting, and figure preparation were performed with Clampfit 9 software (Molecular Devices). Spontaneous and miniature IPSCs (sIPSCs and mIPSCs) were identified using a semiautomated threshold based mini detection software [Mini Analysis; Synaptosoft, Fort Lee, NJ (www.synaptosoft.com)] and were visually confirmed. Event detection threshold was set at five times the root mean square level of baseline noise. IPSC averages were based on >60 events in each cell studied, and the decay kinetics were determined using single-exponential curve fitting and reported as weighted time constants (tau) as in the study by Vicini et al. (2001). NBQX was not included in sIPSC measurements so as not to perturb the network activity. However, AMPA-mediated mEPSCs, although infrequent, could easily be identified by the rapid decay kinetics (<2 ms) as in the study by Ortinski et al. (2004) and were excluded from the analysis. mIPSCs were isolated by application of TTX (0.5 μm), NBQX (5 μm), and strychnine (0.5 μm). All detected events were used for event frequency analysis, but superimposing events were eliminated for the amplitude, rise time, and decay kinetic analysis. For tonic current measurements, an all-points histogram was plotted for a 10 s period immediately preceding drug application. A Gaussian was fitted to the side of the distribution not skewed by synaptic events, and the peak was used to determine the mean baseline holding current required to maintain the voltage of the cell at −60 mV. Tonic currents blocked or induced by various pharmacological agents are represented as absolute magnitude and were determined by repeating the fitting procedure for the 10 s immediately after drug application and calculating the Δ for the peak of the Gaussians.
Dose–response curves were fitted using Origin (Microcal, Northampton, MA) with the logistic function Ipeak = Imin + (Imax − Imin/1 + ([Drug]slope/EC50)), where Imin and Imax are minimal and maximal evoked currents, [Drug] is GABA or THIP concentration, and slope is slope of the curve. Capacitance of MSNs in slice cannot be accurately measured as a result of their extensive dendritic arborization. Therefore, whole-cell currents induced by application of THIP are normalized to the whole-cell current evoked by a saturating dose of GABA in the same cell.
Excised patch recordings.
Recordings of single-channel activity were performed in excised outside-out patches held at −60, −80, or −100 mV. Because it was rare to find patches with single channels, kinetic analyses were performed on stretches with few superimposed channel openings as in the study by Barberis et al. (2007). Events for single-channel dwell time analyses were collected using half-amplitude threshold detection method built into Clampfit 9 software (Molecular Devices), and >1000 events were collected for all conditions. Superimposed openings were excluded. Logarithmic open interval distributions were binned and fitted with a sum of three logarithmic exponential probability density functions using the maximum likelihood method after taking the square root of the bin counts to improve statistical scatter of the data (Sigworth and Sine, 1987). Mean unitary current was determined from the fits of amplitude distributions of openings lasting >0.5 ms with Gaussian components. Single-channel slope conductance was estimated from the linear fit of the I–V relationship at three distinct holding potentials. Only the openings to the main conductance level were considered for the I–V fit. Statistical comparisons were done using a two-tailed Student's t test assuming homogeneity of variances of the samples as verified by an F test.
Resting membrane potential (RMP) was determined from an estimate of the reversal potential for K+ (EK) with a series of command voltage ramps given in cell-attached configuration as in the study of Verheugen et al. (1999). Briefly, cell-attached gigaohm seals were made with pipettes that contained 145 mm K+. The cell was then subjected to a series of five repeated ramps from −100 to +200 mV. Because the intracellular solution contained an isotonic concentration of K+, the equilibrium potential for K+ was ∼0 mV. K+ currents were measured, and the holding potential at which the K+ currents reversed gave a direct measurement of the resting membrane potential of the cell.
In some experiments, the glutamatergic afferents were stimulated by square-wave 50 μs electric pulses delivered by a bipolar stimulating electrode placed within the white matter at the corticostriatal border as in the study by Ade and Lovinger (2007) at a frequency of 0.2 Hz. Action potential firing was recorded from single cells in loose cell-attached configuration. The stimulus intensity (100–300 μA) was set to evoke action potentials in the recorded cell approximated 50% of the time during baseline conditions. Firing frequency for each condition was based on >50 stimuli.
Statistical significance for all analyses was determined using a two-tailed Student's t test (unpaired when comparing two populations of cells and paired when comparing conditions in the same cell population). All data values in the text and in the figures are expressed as mean ± SEM unless otherwise indicated. For all figures, *p < 0.05, **p < 0.005, and ***p < 0.0005.
Immunofluorescence.
Animals were anesthetized with isofluorane and perfused transcardially with 1× PBS followed by 4% paraformaldehyde in 1× PBS (100 ml). The whole brains were then immersed in the same fixative solution at 4°C for 1–3 h and then transferred to 30% sucrose in PBS and left at 4°C until the slicing procedure. Fifty-micrometer-thick coronal and longitudinal slices were cut in PBS using a Lancer Vibratome Series 1000 Sectioning System, and subsequent immunofluorescent processing was performed on the free-floating sections. Briefly, slices were incubated in primary antibody overnight in blocking solution (5% bovine serum albumin in 1× TBS with 0.05% Triton X-100) at 4°C. Slices were subsequently rinsed three times for 20 min in 1× TBS at room temperature and were then incubated in fluorescent secondary antibody probes in the same blocking solution at 4°C for 2 h. Slices were then subjected to the same rinsing procedure and were mounted in Vectashield Mounting Medium (Vector Laboratories, Burlingame, CA). All incubation and rinsing steps were performed with gentle agitation.
Antibodies raised in guinea pig against the α5 subunit (1:3000 final concentration) and the α2 subunit (1:5000 final concentration), kind gifts from Dr. Jean Marc Fritschy (University of Zurich, Zurich, Switzerland), were used as primary antibodies. Indocarbocyanine-conjugated secondary antibodies were from Jackson ImmunoResearch (West Grove, PA) and were used at 1:1000 final concentration.
Images were captured with confocal laser scanning microscopy (Fluoview-FV300 Laser Scanning Confocal System; Olympus Optical, Tokyo, Japan) with a 100× Plan-Acromat objective (numerical aperture 1.4) and sequential acquisition of separate color channels. Stacks of eight consecutive sections (512 × 512) spaced by 0.3 μm were analyzed with MetaMorph (Universal Imaging, Downingtown, PA) and pseudocolored for presentation with Adobe Photoshop CS2 (Adobe Systems, San Jose, CA). To quantify changes in fluorescence intensity, we measured the number of clusters and their average pixel intensity of several region of interest defined from the location of MSNs as seen in matching Nomarski images (supplemental Fig. S2, available at www.jneurosci.org as supplemental material). Individual clusters were identified by threshold segmentation. No staining was observed in areas in which including the white matter or in control sections in which the primary antibody was omitted. Quantification analysis was performed in at least 30 cells per group from three separate sections in two mice, and data are expressed as mean ± SEM. p values represent the results of two-tailed unpaired Student's t tests.
Results
To compare inhibitory currents in striatopallidal and striatonigral MSNs, recordings were routinely performed in acute corticostriatal slices prepared from BAC transgenic mice in which EGFP expression is driven by the promoter for the dopamine D2 receptor (Fig. 1A,B). Striatal cells were identified as being either dopamine D2 receptor positive (D2+) or negative (presumed D1+; see Materials and Methods) by the expression of EGFP.
Figure 1.
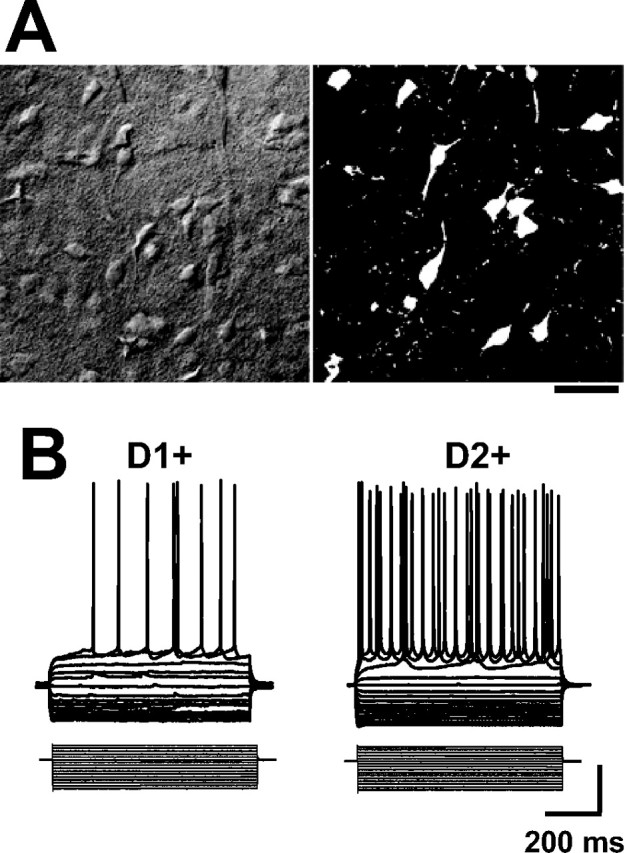
Characteristics of D1+ and D2+ medium spiny neurons. A, Examples of differential interference contrast (left) and fluorescence (right) confocal micrographs of a corticostriatal slice prepared from a BAC D2 EGFP mouse. EGFP expression was used to classify MSNs as D1+ or D2+. Scale bar, 20 μm. B, Examples of current-clamp recordings with K-gluconate internal, demonstrating responses to a series of hyperpolarizing and depolarizing current injections (20 pA steps) from RMPs of −65 mV in a D1+ and D2+ MSN. Calibration: 20 mV, 100 pA.
During whole-cell recordings, striatal cells were subjected to a series of hyperpolarizing and depolarizing current injections (Fig. 1B), and MSNs were identified by their characteristic repetitive and non-adapting firing pattern, which lacks an afterhyperpolarization (Kita et al., 1984; Kawaguchi et al., 1989). We found that all EGFP-positive striatal cells recorded from in slices from BAC D2 EGFP mice demonstrated characteristics typical of MSNs (n > 100). On the surface, these results would appear to contradict a recent report that the cholinergic interneurons in the striatum express dopamine D2 receptors and thus should be EGFP positive in this strain of mice (Wang et al., 2006). However, the somatic size of these interneurons is approximately two to three times larger than the typical MSN (Kawaguchi et al., 1995) and thus could easily be avoided for the purpose of this study.
In contrast, ∼3–5% of striatal cells negative for EGFP demonstrated firing patterns suggestive of an interneuron phenotype and were thus excluded from the analysis. These findings agree with both a previous report (Le Moine et al., 1991) and with unpublished data from our laboratory in which immunolabeling for striatal GABAergic interneuron markers did not overlap with EGFP expression in slices from these mice. Because action potential firing patterns could not be studied when CsCl internal was used, a small amount of data analysis on inhibitory currents in D1+ MSNs may have been derived from GABAergic interneurons when using this internal solution.
Tonic GABAA receptor-mediated currents
When potassium-based isotonic chloride internal solution (KCl internal) was used for voltage-clamp recordings, application of the GABAA receptor antagonist BIC, in addition to blocking sIPSCs, consistently induced an outward current in D2+ MSNs (18.9 ± 0.3 pA, n = 40) (Fig. 2), revealing an endogenous GABAA receptor-mediated tonic current. This effect could also be observed in D1+ MSNs, although the magnitude was significantly smaller (1.7 ± 0.8 pA, n = 23), and often it was completely absent (Fig. 2A–C). The remaining sEPSCs could be blocked by the subsequent application of the AMPA/kainate receptor antagonist NBQX (Fig. 2A,B). Because BIC has also been shown to block nicotinic acetylcholine receptors (Rossi et al., 2003) and Ca2+-gated K+ channels (Johnson and Seutin, 1997), we confirmed that the tonic current was indeed mediated by GABAA receptors by repeating these experiments with a more specific GABAA receptor antagonist, gabazine (10 μm, KCl internal), which blocked significantly more tonic current in D2+ MSNs (16.0 ± 1.2 pA, n = 8) than in D1+ MSNs (3.0 ± 1.7 pA, n = 5) (p < 0.01). Subsequent BIC application caused no additional effects (data not shown), nor did the values obtained with GBZ significantly differ from those previous experiments performed with BIC, suggesting that the blockade of tonic current by BIC was a result of antagonizing the GABAA receptor rather than modulation of non-GABAA receptor-mediated conductances. The difference in GABA tonic currents (determined by application of either BIC or GBZ with KCl internal solution) was seen at higher temperatures (31°C) as well (D1+ MSNs, 1.6 ± 1.3 pA, n = 5; D2+ MSNs, 30.4 ± 5.5 pA, n = 5; p < 0.0005).
Figure 2.
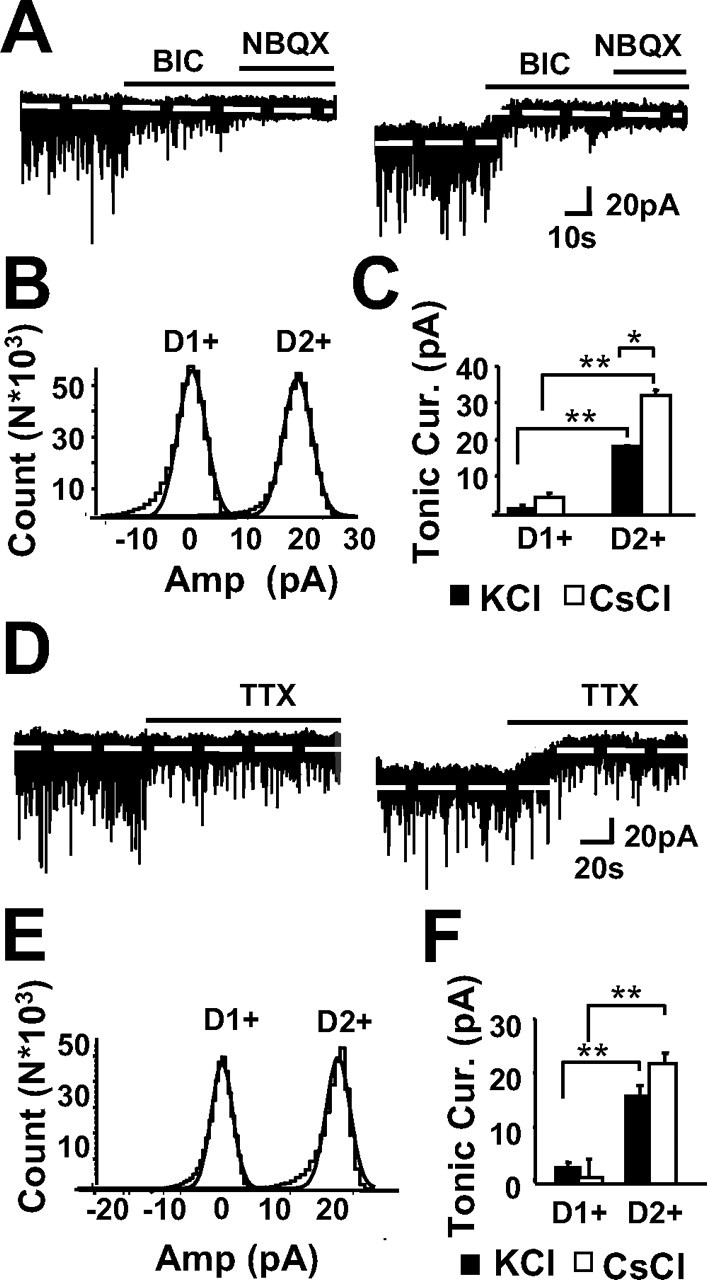
D2+ MSNs demonstrate larger GABAA receptor-mediated tonic currents than D1+ MSNs. A, Representative traces from a D1+ MSN (left) and a D2+ MSN (right) demonstrate that BIC (25 μm) blocked sIPSCs in both cell types but only revealed an endogenous GABA-mediated tonic current in the D2+ MSN. The remaining sEPSCs in both cell types were blocked by NBQX (5 μm) with no effects on the tonic current. B, The mean of the baseline current during BIC application from the representative traces in A were adjusted to 0, and the amplitude distributions were drawn from segments immediately preceding BIC application. The non-skewed sides of the amplitude histograms were fit with a Gaussian, the peak of which was used to determine the absolute magnitude of tonic current blocked by BIC. C, Summary of tonic currents blocked by BIC (25 μm) with KCl internal (black bars; n = 23 and 44) and with CsCl internal (white bars; n = 7 and 9) in D1+ and D2+ MSNs, respectively. D, Representative traces from a D1+ MSN (left) and a D2+ MSN (right) demonstrate that blockade of voltage-gated Na+ channels with TTX (0.5 μm) reduces the frequency and amplitude of postsynaptic events in both cell types but only alters the amount of holding current required to maintain the holding voltage at −60 mV in the D2+ MSN. E, Amplitude distributions representing the tonic current abolished by TTX, drawn from segments in D as described above for BIC (B). F, Summary of tonic current blocked by TTX (0.5 μm) from recordings with KCl internal (black bars; n = 11 and 32) and with CsCl internal (white bars; n = 6 and 7) in D1+ and D2+ MSNs, respectively.
Although these initial experiments suggested that D2+ MSNs exhibit more GABAA receptor-mediated tonic current, interpretations were limited to those currents that could be detected by the somatically located recording electrode. It has been suggested that dendritic excitatory synaptic currents in MSNs likely go undetected in whole-cell recordings when potassium-based internal solutions are used because of leak K+ currents between the synapse and the soma (Day et al., 2006). Although low input resistance of the membrane distorts fast synaptic events more than steady- state currents, the magnitude of constant currents at more distal dendritic regions may be attenuated by low input resistance of the dendritic plasma membrane (Spruston et al., 1993). Because the input resistance of the MSN dendritic arborization is unknown and cannot be measured in the slice preparation, we could not rule out the possibility that D1+ MSNs are influenced by GABA tonic currents at more distal regions of the dendritic arborization. To address this issue, we used a cesium-based internal solution (CsCl internal) to block K+ channels. Under these recording conditions, we detected only a weak BIC-sensitive tonic current in D1+ MSNs (1.6 ± 0.3 pA, n = 7), whereas the tonic current detected in D2+ MSNs with CsCl internal was significantly greater than the tonic current detected with KCl internal (32.6 ± 1.6 pA, n = 9) (Fig. 2C), suggesting that,in D2+ MSNs, GABA onic currents are found in both the soma/perisomatic region as well as the dendrites.
Synaptic spillover from action potential-dependent vesicular release of neurotransmitter is thought to be a primary source for the ambient GABA responsible for activating extrasynaptic tonic GABAA receptors (Brickley et al., 1996; Wall and Usowicz, 1997; Bright et al., 2007). In agreement with these findings, application of a sodium channel blocker mimicked the results obtained by BIC application (Fig. 2D–F). TTX (0.5 μm) blocked 16.4 ± 2.8 pA (n = 32) in D2+ MSNs and 2.9 ± 0.9 pA (n = 11) of tonic current in D1+ MSNs with KCl internal and 22.4 ± 1.9 pA (n = 6) in D2+ MSNs and 1.0 ± 3.1 pA (n = 7) in D1+ MSNs with CsCl internal (Fig. 2E–H). Overall, TTX blocked 91 ± 6% (n = 7) of the BIC-sensitive tonic current in the D2+ MSNs as assessed by subsequent application of BIC. Interestingly, perfusion of NBQX (5 μm) before BIC also decreased BIC-sensitive tonic current in D2+ MSNs by 42 ± 8%, (n = 4), but there were no effects on the tonic current when NBQX was applied after BIC (Fig. 2A). These results suggest that NBQX decreases GABA tonic currents by affecting striatal circuitry, consistent with the previously described role for glutamatergic synaptic input in driving the activity of striatal interneurons (Mallet et al., 2005).
Our data suggest that synaptic spillover is the primary source for the ambient GABA responsible for inducing tonic currents in MSNs. However, the activity of the GABA transporters strongly regulates the amount of neurotransmitter that is allowed to spill out of the synaptic cleft and activate extrasynaptic receptors (Mody and Pearce, 2004; Farrant and Nusser, 2005). Indeed, studies on tonic inhibition in other brain regions have demonstrated that the ambient GABA levels are highly regulated by the activity of the GABA transporter GAT-1 (Mody and Pearce, 2004; Richerson, 2004; Ortinski et al., 2006; Park et al., 2006). Furthermore, it has been demonstrated that activity of GAT-1 is regulated by cytosolic Na+ gradients (Richerson 2004; Wu et al., 2006). Thus, the effects of TTX could partially be mediated by disruption of GAT-1 activity. Although GAT-1 expression is mostly limited to GABAergic interneurons in the striatum (Augood et al., 1995), the smaller tonic currents seen in the D1+ MSNs could potentially be explained by a more efficacious GABA transport system on the synaptic inputs to D1+ MSNs leading to lower local ambient GABA concentrations. If this was indeed the case, inhibiting GAT-1 should induce significantly larger GABA tonic currents in the D1+ MSNs. However, application of the GAT-1 inhibitor NO711 (5 μm) increased the BIC-sensitive tonic current in both types of MSNs (supplemental Fig. S1A,B, available at www.jneurosci.org as supplemental material). Furthermore, D2+ MSNs still showed significantly more GABA tonic current after NO711 application (24.8 ± 4.1 pA, n = 4) than the D1+ MSNs (8.8 ± 4.3 pA, n = 4) (supplemental Fig. S1C, available at www.jneurosci.org as supplemental material). In four D2+ MSNs recorded with CsCl internal solution, GABA tonic current after NO711 application was 27.8 ± 3.6 pA.
In agreement with recent findings in the hippocampus (Glykys and Mody, 2007), our results suggest that synaptic activity in the striatum plays a crucial role in setting the tonic currents in D2+ MSNs. Thus, it was possible that the D2+ MSNs received more synaptic innervation than the D1+ MSNs or that the probability of release or quantal content from the inhibitory synaptic inputs to the two cell types differed. Therefore, we compared the amplitude, frequency, rise time, and tau of the synaptic currents in the D2+ and D1+ MSNs (Fig. 3) using both KCl and CsCl internal solutions. Indeed, CsCl internal significantly enhanced our detection of mIPSCs in both cell types (Fig. 3I) and sIPSCs in the D2+ MSNs (Fig. 3C) and demonstrated significantly larger mIPSC amplitude in the D1+ MSNs (Fig. 3H) when compared with those results obtained with KCl internal. Yet importantly, D1+ and D2+ MSNs did not significantly differ from each other in any of the IPSC parameters measured.
Figure 3.

GABAA receptor-mediated sIPSCs and mISPCs do not differ between D1+ and D2+ MSNs. A, Representative traces showing sIPSCs in a D1+ MSN (top) and a D2+ MSN (bottom). Calibration: 1 s, 25 pA. Summary of the mean amplitude (B), frequency of events (C), tau values (D), and rise time (E) for sIPSCs in D1+ and D2+ MSNs. sIPSC values were measured using KCl internal (black bars; n = 6 and 12) and with CsCl internal (white bars; n = 8 and 10) from D1+ and D2+ MSNs, respectively. G, Representative traces demonstrate mIPSCs in a D1+ MSN (top) and a D2+ MSN (bottom). Calibration: 1 s, 25 pA. Summary of the mean amplitude (H), frequency of events (I), tau values (J), and rise time (K) for mIPSCs in D1+ and D2+ MSNs. mIPSCs values were measured from the same cells represented in B–D using KCl internal (black bars) and CsCl internal (white bars) by subsequent application of TTX (500 nm), NBQX (5 μm), and strychnine (500 nm). Cumulative probability plots for the average mIPSC (F), amplitude, and interevent interval (L) from D1+ MSNs (dashed black line; n = 9) and D2+ MSNs (solid gray line; n = 10) recorded with CsCl internal.
D2+ MSNs are more sensitive to GABA than D1+ MSNs
Altogether, the two MSN subtypes appeared to have similar inhibitory synaptic input and local ambient GABA concentrations. Therefore, we investigated whether the larger tonic current in the D2+ MSNs resulted from greater surface expression of GABAA receptors or a difference in the properties of these receptors, either of which could render them more sensitive to low concentrations of GABA. For this purpose, we compared whole-cell currents in the two cell types induced by increasing concentrations of GABA (Fig. 4) in the presence of NBQX (5 μm) and strychnine (0.5 μm) to block AMPA and glycine receptor currents (Jonas et al., 1998), respectively, and TTX (0.5 μm) to reduce endogenous levels of ambient GABA from synaptic release (Fig. 2D–F) and found that they exhibited similar maximal currents in response to saturating doses of GABA (Fig. 4B). Although anatomical constraints slow down agonist application and limit interpretations of agonist dose–response curves in brain slices, these results suggest that the two MSNs subtypes are similar in the total surface expression of GABAA receptors. However, D2+ MSNs demonstrated a remarkably greater sensitivity to low doses of GABA than the D1+ MSNs (Fig. 4B,C), which further supports the hypothesis that differences in functional properties of the GABAA receptors underlies the differences in GABA tonic current magnitude in MSNs.
Figure 4.

Greater sensitivity to exogenously applied GABA in D2+ than in D1+ MSNs. Representative traces (A) and summary dose–response data (B) of the whole-cell currents elicited by increasing doses of GABA applied in the presence of TTX (0.5 μm), NBQX (5 μm), and strychnine (0.5 μm) in D1+ and D2+ MSNs. The EC50 for GABA was 107.3 ± 0.5 and 18.2 ± 1.9 μm and the Hill coefficient was 1.04 ± 0.05 and 1.75 ± 0.18 for D1+ and D2+ MSNs, respectively. All recordings were performed with KCl internal solution, and data were derived from at least sixteen cells in each group. Data on whole-cell currents induced by 0.5 μm and 5 μm GABA (C) for D1+ MSNs (white bar) and D2+ MSNs (black bar) are illustrated for clarity. D, A summary of whole-cell currents elicited by 0.5 μm and 5 μm THIP in D1+ MSNs (white bars) and D2+ MSNs (black bars). E, Dose–response data of whole-cell recordings of THIP elicited currents normalized to currents elicited by a saturating dose of GABA (2 mm; GABAsat) in each cell. For both D and E, recordings were performed in the presence of TTX (0.5 μm), NBQX (5 μm), and strychnine (0.5 μm), and data were derived from at least six MSNs in each group.
Extrasynaptic GABAA receptors in MSNs
Subunit composition of the GABAA receptor has been shown to significantly affect channel conductance, open probability, and ligand affinity (Macdonald and Olsen, 1994). It also determines subcellular localization-based subunit-specific interaction with scaffolding proteins and whether the receptor can be affected by posttranslational modifications such as phosphorylation (Fritschy and Brunig, 2004; Lüscher and Keller, 2004). Subunit composition also appears to be specific to both the brain subregion and cellular subtype of the neurons on which they are located. For example, extrasynaptic GABAA receptors containing the δ subunit have been shown to mediate tonic inhibition in cerebellar granule cells (for review, see Farrant and Nusser, 2005), dentate gyrus granule cells (Wei et al., 2003), hippocampal interneurons (Semyanov et al., 2003; Glykys et al., 2007), and thalamocortical projection neurons (Belelli et al., 2005; Cope et al., 2005; Jia et al., 2005; Bright et al., 2007). Although immunohistochemical studies of GABAA receptor subunit expression have been limited to the rat, these studies have demonstrated diffuse expression patterns of the δ subunit in the striatum (Pirker et al., 2000; Schwarzer et al., 2001). Therefore, greater tonic current in the D2+ MSNs could potentially result from greater expression of δ-subunit-containing GABAA receptors, in which case, they should show a higher sensitivity to the GABAA receptor agonist THIP (Brown et al., 2002) than the D1+ MSNs. THIP is a nonspecific partial agonist at most GABAA receptors at high concentrations, but at low concentrations, it is somewhat selective and possesses super-agonist properties at GABAA receptors lacking the γ2 subunit (Storustovu and Ebert, 2006), a large portion of which are thought to contain the δ subunit. As illustrated in Figure 4E, the responses to high THIP concentrations normalized to the response to a saturating dose of GABA (2 mm) were larger in D2+ than in D1+ MSNs. These results mimic those seen with intermediate doses of GABA and were expected because of the loss of receptor selectivity at high concentrations. However, the two MSN subtypes were similar in their sensitivity to low doses of THIP (Fig. 4D,E), suggesting that D1+ and D2+ MSNs express a similar portion of δ-subunit-containing GABAA receptors. However, interpretations from these experiments are limited because it has been shown that the functional selectivity of THIP depends on the absence of the γ2 subunit (Storustovu and Ebert, 2006). Therefore, responsiveness to low doses of THIP could not discriminate between αβδ- and αβ-containing GABAA receptors (Ebert et al., 1997). Because αβ receptors have been identified recently in vivo in rat hippocampal pyramidal neurons (Mortensen and Smart, 2006), we investigated the possibility that αβ receptors mediate the tonic current in D2+ MSNs by recording single channel currents in excised patches, because GABAA receptors, which solely comprise α and β subunits, have been shown to have lower conductance levels than those receptors that contain a γ or δ subunit (Verdoorn et al., 1990; Fisher and Macdonald, 1997).
Single GABA channel currents in MSNs
GABA was applied at increasing concentrations, and activated channel currents in patches were excised from both types of MSNs (Fig. 5). Because the patches usually contained multiple channels, we restricted our analysis to recording segments that demonstrated a unitary conductance and skipped segments with multiple openings. The presence of multiple channels prevented us from assessing the closed intervals and burst durations, but we could measure both the current amplitude and open time for those channels present in the patch. In both types of MSNs, channel current amplitudes with low main conductance states (<20 pS) made up <10% of the total channel openings, suggesting that, if αβ channels are present, they make up only a small portion of the total GABAA receptors. As seen in Figure 5B, amplitude histograms of openings at the main conductance state elicited by 500 nm GABA in patches from a D1+ and D2+ MSN held at −80 mV were fitted by single Gaussians with similar peak amplitudes. The summary values for the slope conductance of the main state determined from three separate holding voltages in each patch from nine D1+ and eight D2+ MSNs are reported in Figure 5D, showing that this channel property did not differ between the two MSN subtypes. As shown in Figure 5C, the open time of channel currents elicited by 500 nm GABA in patches from the D2+ and D1+ MSN revealed two kinetic components. The fast open time constant and slow open time constant derived from the fitting of the open time distributions did not differ between MSNs (Fig. 5F). However, at low concentrations of GABA (100 and 500 nm), the percentage contribution of the longer component to the mean open time was remarkably larger in patches from D2+ than D1+ MSNs. Although the percentage contribution of the fast component remained stable across all concentrations of GABA in the D2+ MSNs, the percentage contribution of the fast component to the fit was reduced at higher GABA concentrations in the D1+ MSNs (Fig. 5G), indicating that there is a concentration dependence for the mean channel open time in patches from D1+ but not D2+ MSNs. Similar to the responses seen in the whole-cell currents (Fig. 4B), mean channel open times did not significantly differ between the two cell types in response to saturating doses of GABA (2 mm) but were significantly different at lower GABA concentrations (Fig. 5E).
Figure 5.
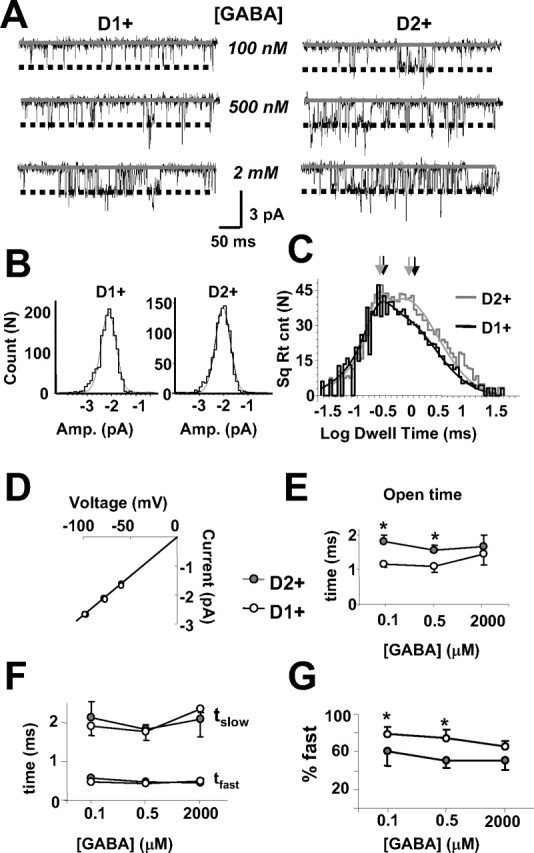
GABA channel currents in excised patches from D1+ and D2+ MSNs. A, Representative examples of currents elicited by three concentrations of GABA (100 nm, 500 nm, and 2 mm) in patches excised from a D1+ and a D2+ MSN and held at −80 mV. Dashed lines illustrate the main conductance level derived from channel current histograms shown in B. Histograms were fit with a Gaussian, and the peak of the curve defined the main conductance level. The main opening levels for the channel currents elicited by 500 nm GABA in the patches represented in A were 2.18 ± 0.09 pA for the D1+ MSN and 2.19 ± 0.08 pA for the D2+ MSN. C, Overlapping open time distributions with a multiple Gaussian fit on a logarithmic scale for the patches illustrated in A elicited by 500 nm GABA. Time constants of the distributions indicated by arrows were 0.41 ms (fast) and 1.9 ms (slow) (81% fast component) and 0.39 ms (fast) and 1.85 ms (slow) (59% fast component) for the D1+ and the D2+ MSN, respectively. D, Current to voltage relationship for the main open state of GABA-elicited currents in patches excised from D1+ (n = 9) and D2+ (n = 8) MSNs. The slope conductance from the linear fits illustrated was 27.9 ± 0.4 and 27.5 ± 0.4 pS for the D1+ and the D2+ MSNs, respectively. E, Summary of mean open times for the channel openings at the main conductance for three GABA concentrations. F, Summary of the open time distributions for the two main open time constants as in C at each concentration tested. G, Summary of the percentage contribution of the fast open time to the fit constant at the three concentrations of GABA.
Contribution of the α1 subunit in tonic and phasic inhibition in MSNs
A novel GABAA receptor containing α1 and δ subunits has been discovered recently in hippocampal interneurons (Glykys et al., 2007). Because THIP sensitivity of α1βδ receptors has yet to be reported, we could not rely on the data from the THIP dose–response curves to assess the presence of such a receptor. Therefore, we investigated the role of the α1 subunit in tonic and phasic GABA currents in MSNs by recording from slices prepared from α1−/− mice. Although we were unable to determine whether the MSNs were D1+ or D2+, there was a large variability in the magnitude of tonic currents seen within MSNs with this genotype (Fig. 6A,C), as would be expected because data were likely derived from both MSN subtypes. For comparison, Figure 6C also reports tonic current in an equally proportioned sample of D1+ and D2+ MSNs recorded from the BAC EGFP mice. These data suggest that the deletion of α1 subunit fails to affect tonic GABA currents in striatal MSNs, a notion that was further supported by our finding that 100 nm zolpidem (a benzodiazepine agonist selective for α1 subunit at low doses) failed to show consistent effects on tonic currents in either cell type. Conversely, as has been shown in hippocampal neurons (Goldstein et al., 2002), the tau values for the synaptic events in MSNs from α1 −/− mice were significantly longer than that seen in age-matched BAC EGFP mice (Fig. 6B,D). Furthermore, 100 nm zolpidem prolonged sIPSCs in both D1+ (119 ± 8% of control, n = 5, p < 0.05) and D2+ MSNs (126 ± 8% of control, n = 5, p < 0.05), demonstrating that α1-subunit-containing GABAA receptors do contribute to GABA-mediated postsynaptic currents in striatal MSNs.
Figure 6.
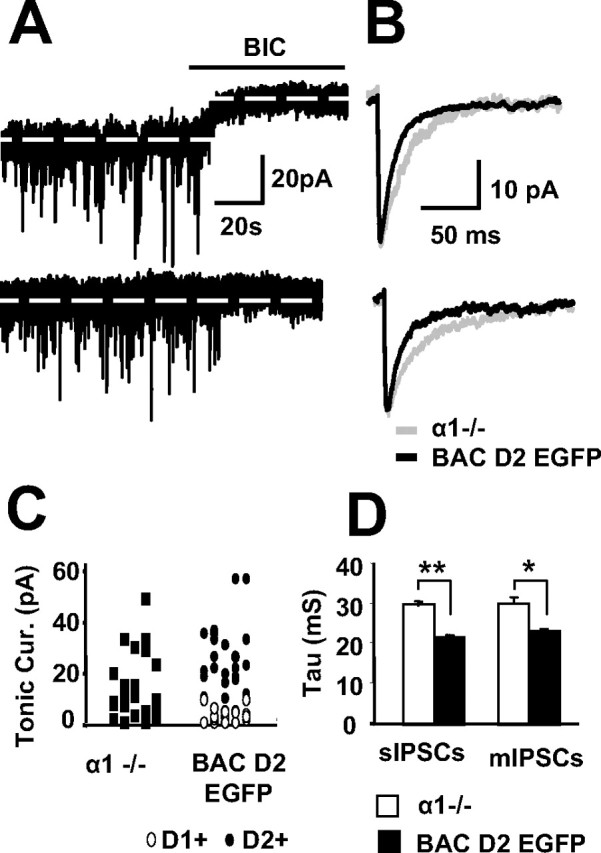
The role of the α1 subunit in MSN tonic and phasic inhibition. A, Representative traces demonstrate the occurrence of sIPSCs and the response to BIC in two examples of MSNs in striatal slices derived from a postnatal day 19 α1−/− mouse. B, Overlaying representative traces of sIPSCs (top) and mIPSCs (bottom) from MSNs in α1−/− (gray) and BAC D2 EGFP (black) mice. C, Comparison of the distributions of BIC-sensitive tonic currents in 21 MSNs from α1−/− mice and a sample of 15 D1+ and 15 D2+ MSNs from BAC D2 EGFP mice illustrates a similar scatter. D, Summary of mean tau values for sIPSCs and mIPSCs in MSNs from 12 α1−/− (white bars) and a pool of six D1+ and six D2+ MSNs from age-matched BAC D2 EGFP mice (black bars).
Tonic GABA conductances in MSNs are mediated by receptors containing the α5 subunit
Although our data support previously reported findings that MSNs express the δ subunit (Pirker et al., 2000; Schwarzer et al., 2001), it argues against the hypothesis that differential δ subunit expression between the two MSN subtypes underlies the difference seen in tonic inhibition. Therefore, we sought to investigate whether tonic GABA currents in MSNs is mediated by α5-subunit-containing GABAA receptors as has been shown in hippocampal pyramidal neurons (Caraiscos et al., 2004; Scimemi et al., 2005) and somatosensory cortex layer V pyramidal cells (Yamada et al., 2007). Indeed, L655,708, an inverse agonist with high selectivity for GABAA receptors containing the α5 subunit (Quirk et al., 1996) at concentrations ranging from 50 nm to 10 μm, reduced tonic GABA currents in the D2+ MSNs (Fig. 7). Because D1+ MSNs show little tonic GABA currents under normal recording conditions, we bath applied 1 μm GABA, which enhanced both tonic and phasic charge transfer, and measured the effects of subsequent application of L655,708 in both MSN populations (Fig. 7C). Under these conditions, the inverse agonist still blocked a significantly larger percentage of the GABA tonic current in D2+ than in D1+ MSNs (Fig. 7D). Additionally, we measured the effects of L655,708 on IPSC amplitude and decay time in MSNs because it has been shown to reduce both of these measures of phasic inhibition in cortical pyramidal cells (Ing and Poulter, 2007). Although low concentrations of L655,708 (50 nm) did not significantly affect sIPSC charge in either cell type, a higher concentration of the inverse agonist (10 μm) significantly decreased both the sIPSC amplitude and decay time in D2+ but not D1+ MSNs.
Figure 7.
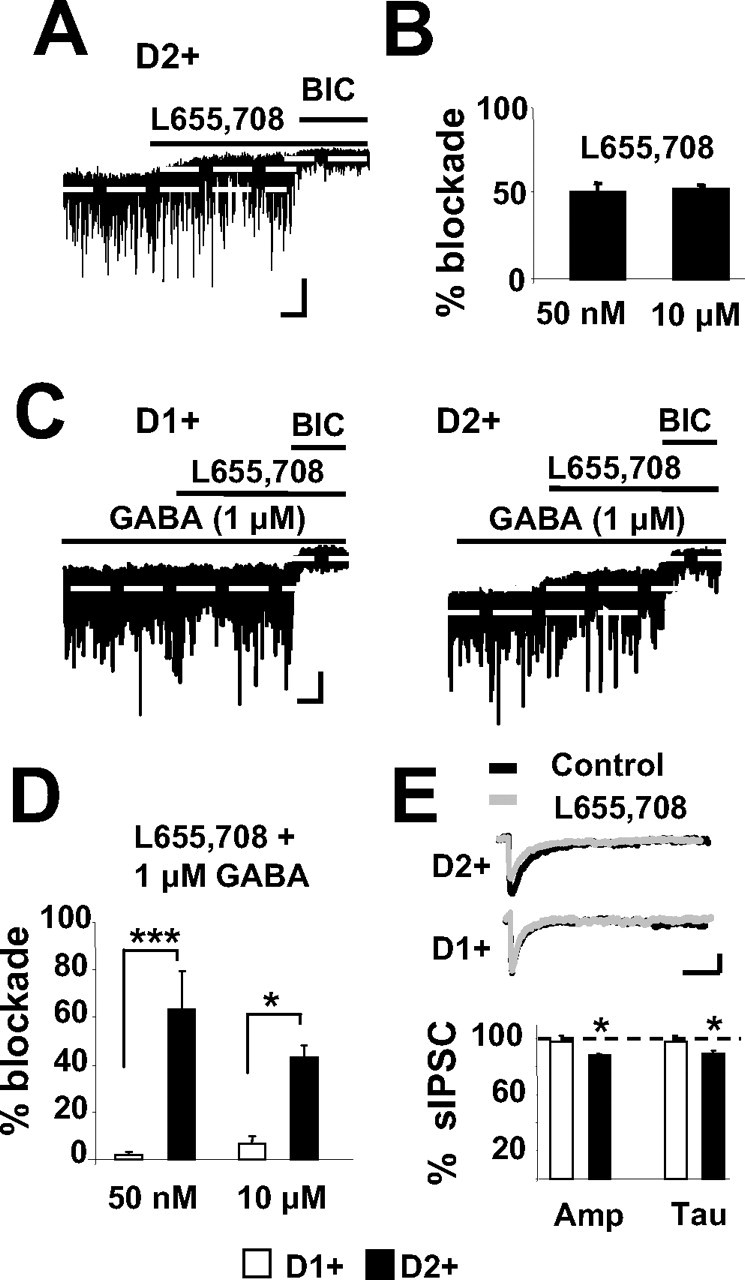
L655,703 antagonizes GABAA receptor-mediated tonic currents in D2+ MSNs. A, Representative trace showing the effects of L655,703 (10 μm) on sIPSCs and on BIC-sensitive tonic current in a D2+ MSN. Calibration: 20 ms, 30 pA. B, Summary of tonic current blocked by L655,703 (50 nm, n = 4; 10 μm, n = 8) in D2+ MSNs. C, Representative traces showing the effects of L655,703 (10 μm) on sIPSCs and BIC-sensitive tonic currents elicited by bath application of 1 μm GABA in a D1+ MSN and a D2+ MSN. Calibration: 20 ms, 30 pA. D, Summary of the percentage blockade by L655,708 of the BIC-sensitive tonic current elicited by bath application of 1 μm GABA in D1+ MSNs (100 nm, n = 3; 10 μm, n = 5) and in D2+ MSNs (50 nm, n = 2; 10 μm, n = 4). E, Representative traces showing overlapping sIPSCs recorded in a D1+ MSN (top) and a D2+ MSN (middle) in the presence (gray trace) and the absence (black trace) of 10 μm L655,703, as well as the summary of the changes in sIPSC amplitude (Amp) and decay time (Tau) produced by 10 μm L655,703 in six D1+ and seven D2+ MSNs (bottom) represented as percentage of baseline values. Calibration: 20 ms, 30 pA.
To complement the electrophysiological results, expression of α5 was determined with immunofluorescent labeling using antibodies against the α5 subunit as described by Fritschy and Mohler (1995). The results revealed that both D1+ and D2+ MSNs were immunopositive for the α5 subunit (supplemental Fig. S2, available at www.jneurosci.org as supplemental material). However, quantification of the relative cluster distribution and fluorescence intensity showed that D2+ MSNs have significantly greater level of immunofluorescence than D1+ MSNs. The number of clusters normalized to the cell area was 17.8 ± 2.3 for 42 D1+ MSNs and 25.4 ± 1.8 for 50 D2+ MSNs, (p < 0.01). However, no difference was seen in average fluorescence intensity. Because we saw no difference in synaptic inhibitory currents and the α2 subunits are the predominate subunit expressed on both D1+ and D2+ MSNs in the striatum (Pirker et al., 2000), we repeated the immunostaining procedure with an antibody against the α2 subunit. As expected, results showed no difference in α2 clusters normalized to cell area between D1+ and D2+ MSNs (28.6 ± 4.7 for 30 D1+ MSNs and 24.3 ± 2.6 for 32 D2+ MSNs). Together, the data from the pharmacological and immunofluorescence studies suggest that the two populations differ in α5-subunit- but not α2-subunit-containing GABAA receptor expression.
Physiological role of tonic current in MSNs
The observation of a GABA tonic current in striatopallidal but not the striatonigral MSNs raises important questions as to the physiological role for this tonic current, especially given the recent findings that striatopallidal MSNs fire at higher frequency both in vivo (Mallet et al., 2006) and in response to a depolarizing current injection in whole-cell recordings in slice (Kreitzer and Malenka, 2007). The reversal potential for Cl− (ECl) in MSNs has been shown to be approximately −76 mV (Koos et al., 2004), which is more depolarized than the average RMP reported in the slice (Shen et al., 2005; Kreitzer and Malenka, 2007), suggesting that GABA may have a depolarizing effect in the MSNs. Thus, one could expect D1+ and D2+ MSNs to differ in both input resistance and RMP as a result of the tonic GABA channel conductance in D2+ cells. However, in agreement with the study of Kreitzer and Malenka (2007), we did not see differences in either of these parameters. In a subset of seven D1+ and eight D2+ MSNs, current-clamp recordings at room temperature with K-gluconate internal showed that the input resistance was 224 ± 19 and 198 ± 21 MΩ, respectively. Furthermore, we assessed the RMP in our preparation by estimating the EK with a series of command voltage ramps given in cell-attached configuration with isotonic potassium in the pipette, a condition that leaves intracellular Cl− levels unperturbed as in the study by Verheugen et al. (1999) (see Materials and Methods) (supplemental Fig. S3A, available at www.jneurosci.org as supplemental material). Although no significant differences in RMP were found between the D1+ (−80.9 ± 1.9 mV, n = 22) and D2+ (−80.0 ± 1.9 mV, n = 15) MSNs, application of 5 μm GABA induced greater depolarization of D2+ than D1+ MSNs (supplemental Fig. S3, available at www.jneurosci.org as supplemental material). Furthermore, in D2+ MSNs, but not in D1+ MSNs, application of both L655,708 (50 nm) and GBZ (10 μm) significantly hyperpolarized the RMP (supplemental Fig. S3B, available at www.jneurosci.org as supplemental material).
To further assess the effects of endogenous GABA tonic currents on MSN excitability, we investigated the action of gabazine (10 μm) on action potential firing patterns by performing current-clamp recordings in six D1+ and six D2+ MSNs with K-gluconate internal. In agreement with a recent report (Kreitzer and Malenka, 2007), D2+ MSNs demonstrated a higher firing frequency than D1+ MSNs in response to depolarizing current injections (Fig. 8B) despite a similar input resistance (see above) and same starting membrane potential (−65 mV; see Materials and Methods). In this experimental conditions, the GABAA receptor antagonist slightly hyperpolarized both D1+ (0.16 ± 0.09 mV) and D2+ (0.48 ± 0.16 mV) MSNs, and, interestingly, it decreased the firing rate in D2+ but not D1+ MSNs (Fig. 8A,B). This decrease in firing rate is the converse of effects seen in the cerebellum and thalamus in which blockade of tonic GABA currents increases action potential firing rate in response to depolarizing current injections (Brickley et al., 1996; Cope et al., 2005).
Figure 8.

Blocking GABAA receptor currents reduces action potential firing frequency in D2+ MSNs. A, Representative example of a current-clamp recording from a D2+ MSN illustrating the responses to a series of hyperpolarizing and depolarizing current injections (20 pA steps) recorded with K-gluconate internal in the absence and the presence of 10 μm gabazine. Calibration: 15 mV, 80 pA. B, Summary of action potential firing frequency in response to increasing depolarizing current injections recorded with K-gluconate internal solution in D1+ (■) and D2+ (▲) MSNs the absence or the presence [D1+ (□) and D2+ (△)] of 10 μm gabazine. Data derive from six D1+ and seven D2+ MSNs. C, Representative example of a D2+ MSN demonstrates action potential firing evoked by stimulation of glutamatergic afferents and assessed using extracellular recording in cell-attached configuration in the absence (left) or the presence (right) of 50 nm L655,703. Calibration: 3 ms, 40 pA.
Although we found these results to be intriguing, we reasoned that depolarizing current injections at the soma in whole-cell configuration are unlikely to mimic the conditions that generate action potentials under normal physiological conditions. Therefore, we sought to verify whether tonic GABA currents would also reduce the efficacy of excitatory afferents in generating action potentials in MSNs in conditions in which internal Cl− concentrations were not disrupted. To address this issue, a bipolar stimulating electrode was placed within the white matter at the corticostriatal border and was delivered square-wave electric pulses to the glutamatergic striatal afferents as in the study by Ade and Lovinger (2007). These stimuli-evoked action potentials were recorded in loose cell-attached configuration using aCSF-filled pipettes. As seen in Figure 8C, the success rate for evoked spike generation derived from stimulating glutamatergic afferent fibers was significantly decreased by perfusion of 50 nm L655,708 in five D2+ MSNs (60 ± 20%) but not three D1+ MSNs (117 ± 4%).
Discussion
In this study, we demonstrate that D2+ MSNs display larger GABAA receptor-mediated tonic currents than the D1+ MSNs. Whole-cell and single-channel current recordings suggest that D2+ MSNs are more sensitive to low doses of GABA than D1+ MSNs. Furthermore, the findings that the two MSN populations were similar in their synaptic input and in their response to GAT-1 inhibition provide strong evidence that the differences in tonic GABA currents seen in the slice preparation are likely mediated by a difference in receptor expression or function, and the strong TTX sensitivity of MSN tonic GABA currents suggests that action potential-mediated synaptic release is the major source for ambient GABA in the striatum and that tonic GABA conductances in the MSNs are very sensitive to local changes in ambient GABA concentration in the striatum.
The higher detection rate of sIPSCs and mIPSCs in both cell types and the larger tonic currents detected in D2+ MSNs using CsCl internal rather than KCl internal is reflective of previous findings that cesium-based internal solutions showed enhanced mEPSC detection over potassium-based internal solutions (Day et al., 2006) and lends additional credence to the proposition that cesium-based internal solutions allow for current detection over larger expanses of the plasma membrane.
Interestingly, mIPSC amplitude in D1+ but not in D2+ MSNs was significantly larger with CsCl internal, suggesting that quantal size is potentially larger at distally located inhibitory synapses in D1+ MSNs. However, it may also simply indicate that D1+ MSNs have more K+ channel-mediated leak conductance, in agreement with previous reports that D1 receptor but not D2 receptor stimulation enhances subthreshold K+ channel conductances (Pacheco-Cano et al., 1996) and may explain why input resistance does not significantly differ between the two cell types despite the rather selective occurrence of tonic GABA currents in D2+ MSNs.
In this study, we used a combination of approaches in an attempt to define the GABAA receptor subtype responsible for MSN tonic GABA currents. The single-channel recordings suggest that main conductance levels for GABA channels in D1+ and D2+ MSNs are similar and that most channels contained either γ or δ subunits. Indeed, the sensitivity of MSNs to the δ-subunit-preferring agonist THIP agrees with previous reports of striatal δ subunit expression (Pirker et al., 2000). Thus, the combined sensitivity to THIP and single-channel data suggest that MSNs express δ-subunit-containing GABAA receptors. However, the two subtypes did not differ in THIP sensitivity; therefore, it is unlikely that differential expression of δ-subunit-containing receptors mediates the larger tonic currents and higher sensitivity to GABA in the D2+ cells. Although high THIP sensitivity could be also be explained by the presence of αβ receptors (Storustovu and Ebert, 2006), the rather limited occurrence of lower conductance channel openings in the single-channel recordings argue against this possibility.
Although we were unable to identify whether the MSNs in the α1−/− were striatopallidal or striatonigral, the distribution of tonic currents was similar to that seen in pooled MSNs of both subtypes from BAC D2 EGFP mice. Although it is important to note that deletion of certain α subunits may be compensated for by an upregulation of other α subunits (for review, see Vicini and Ortinski, 2004), changes in K+ conductances (Brickley et al., 2001), or reduced GABA uptake (Ortinski et al., 2006), our data from the α1−/− in conjunction with the lack of potentiation of tonic current by zolpidem in the D2+ MSNs (in the BAC D2 EGFP mice) suggests that the α1-subunit-containing GABAA receptors do not mediate tonic GABA currents in MSNs. However, the findings of the longer IPSC tau in the α1−/− and the prolongation of the sIPSC tau by zolpidem in BAC D2 EGFP mice suggest that some synaptic currents in MSNs are mediated by α1-subunit-containing GABAA receptors.
Because α5-subunit-containing GABAA receptors mediate tonic inhibition in other brain regions (Caraiscos et al., 2004; Scimemi et al., 2005; Yamada et al., 2007) and this subunit is expressed in the striatum (Pirker et al., 2000; Schwarzer et al., 2001), we studied the action of a selective inverse agonist of these receptors. Although micromolar concentrations of L655,708 have been used in the majority of brain slice physiology studies (Caraiscos et al., 2004; Scimemi et al., 2005; Yamada et al., 2007), pharmacological analysis of recombinant GABAA receptors (Quirk et al., 1996) would suggest that nanomolar concentrations should be as efficacious. Indeed, we found that 50 nm L655,708 was as efficacious in antagonizing tonic currents in D2+ MSNs as the higher concentrations (10 μm). However, tonic currents in D1+ MSNs induced by adding exogenous GABA as in the study by Scimemi et al. (2005) were not significantly reduced by either 50 nm or 10 μm L655,708, suggesting that D1+ MSNs only have a small or negligible expression of α5-subunit-containing receptors. However, our immunofluorescence results argue that α5-subunit-containing receptors are found in both MSN subtypes, although slightly more abundant in D2+ ones. Clearly, additional studies are necessary to determine whether differential surface expression or posttranslational regulation underlies the discrepancy.
L655,708 reduced sIPSC charge in the D2+ but not the D1+ MSNs, although the effect was limited to the higher concentrations of the drug (10 μm). If this is indeed a specific effect of blocking α5-subunit-containing receptors, it may relate to pharmacological differences in efficacy when GABA is released at high concentrations as it is at the synapse compared with the low ambient concentrations that activate tonic receptors. Alternatively, the effects at 10 μm L655,708 may be mediated by receptors that do not contain the α5 subunit. If synaptic receptors are indeed different between D1+ and D2+ MSN, why did we not observe differences in properties of sIPSCs? It is possible that a compensatory expression of other subunit isoforms in the D1+ MSNs may allow for similar synaptic decay kinetics.
Among the GABAA receptor subunits found in striatal MSNs, of particular interest are β1 and β3 subunits (Flores-Hernandez et al., 2000; Pirker et al., 2000; Schwarzer et al., 2001) because they are potential targets for protein kinase A (PKA) phosphorylation. PKA is differentially regulated by the dopamine D1 and dopamine D2 receptor classes, and the effects of the phosphorylation are dependent on the β subunit involved. Therefore, it will be interesting to determine how β subunits regulate GABA sensitivity in MSNs in future studies once selective blockers of the β subunits become available. In parallel, it will be essential to determine the effects of dopamine depletion on expression and function of striatal GABAA receptors because previous reports have suggested that dopamine depletion induces postsynaptic changes in GABA sensitivity that exacerbate the imbalance of striatal output (Mallet et al., 2006).
Our study confirmed previous findings (Kreitzer and Malenka, 2007) that, in the slice, D2+ MSNs fire action potentials in response to depolarizing current injection at higher frequency than D1+ MSNs. However, in contrast to what is seen in the cerebellum and thalamus (Brickley et al., 1996; Cope et al., 2005), gabazine application actually shifted the spike rate versus injected current relationship for D2+ MSNs to the right to values seen in D1+ MSNs (Fig. 8B), a finding that also seems to contradict the findings of similar RMP and input resistance for the two MSN subtypes (our data and Kreitzer and Malenka, 2007). RMP assessed by measuring EK in a cell- attached patch showed values more negative than the IPSC reversal potential reported by others (Koos et al., 2004). Indeed, our recordings verified that GABA mildly depolarizes MSNs in slice, as has been shown both in vivo (Mercuri et al., 1991) and in organotypic corticostriatal culture preparations (Blackwell et al., 2003). Thus, the gabazine-induced reduction in excitability may be explained by the relative gap between MSN RMP and the GABA current reversal potential or potentially by the associated changes in K+ channel conductances and calls for further modeling of the complex interactions of GABA tonic conductances with the other ionic currents found in MSNs (Wolf et al., 2005). However, the possibility exists that gabazine may affect MSN excitability indirectly by modulating the activity of neighboring cholinergic or GABAergic interneurons or by nonspecific actions at receptors in the MSNs.
The presence of tonic GABA currents has important consequences for synaptic excitation of MSNs. Synaptically evoked MSN firing was significantly reduced in D2+ MSNs when tonic conductance was blocked by L655,708 (Fig. 8C,D). Future studies will have to verify that this effect is mediated by reduction of tonic GABAergic conductances in MSNs. It remains to be assessed how this regulation of synaptic efficacy by tonic GABA currents in striatopallidal MSNs will affect motor behavior and whether the increased spontaneous locomotor activity in a strain of α5 subunit mutant mice (Hauser et al., 2005) is mediated by a reduction in striatopallidal activity.
Together, our results suggest that D2+ MSNs have higher expression of tonic GABAA receptors containing the α5 subunit than D1+ MSNs. Because tonic inhibitory currents provide a powerful mechanism to regulate cell excitability, the α5 subunit may serve as a novel therapeutic target for the ameliorating motor disturbances associated with Parkinson's disease.
Footnotes
This work was supported by National Institutes of Health Grant R01 MH64797. We thank Dr. David Lovinger at the National Institute on Alcoholism and Alcohol Abuse for providing the BAC D2 and D1 EGFP mice, Dr. Gregg Homanics at University of Pittsburgh for providing the α1−/− mice, and Dr. Jean Marc Fritschy at the University of Zurich for providing the antibodies.
References
- Ade KK, Lovinger DM. Anandamide regulates postnatal development of long-term synaptic plasticity in the rat dorsolateral striatum. J Neurosci. 2007;27:2403–2409. doi: 10.1523/JNEUROSCI.2916-06.2007. [DOI] [PMC free article] [PubMed] [Google Scholar]
- Alexi T, Borlongan CV, Faull RL, Williams CE, Clark RG, Gluckman PD, Hughes PE. Neuroprotective strategies for basal ganglia degeneration: Parkinson's and Huntington's diseases. Prog Neurobiol. 2000;60:409–470. doi: 10.1016/s0301-0082(99)00032-5. [DOI] [PubMed] [Google Scholar]
- Augood SJ, Herbison AE, Emson PC. Localization of GAT-1 GABA transporter mRNA in rat striatum: cellular coexpression with GAD67 mRNA, GAD67 immunoreactivity, and parvalbumin mRNA. J Neurosci. 1995;15:865–874. doi: 10.1523/JNEUROSCI.15-01-00865.1995. [DOI] [PMC free article] [PubMed] [Google Scholar]
- Barberis A, Mozrzymas JW, Ortinski PI, Vicini S. Desensitization and binding properties determine distinct alpha1beta2gamma2 and alpha3beta2gamma2 GABA(A) receptor channel kinetic behavior. Eur J Neurosci. 2007;25:2726–2740. doi: 10.1111/j.1460-9568.2007.05530.x. [DOI] [PMC free article] [PubMed] [Google Scholar]
- Belelli D, Peden DR, Rosahl TW, Wafford KA, Lambert JJ. Extrasynaptic GABAA receptors of thalamocortical neurons: a molecular target for hypnotics. J Neurosci. 2005;25:11513–11520. doi: 10.1523/JNEUROSCI.2679-05.2005. [DOI] [PMC free article] [PubMed] [Google Scholar]
- Blackwell KT, Czubayko U, Plenz D. Quantitative estimate of synaptic inputs to striatal neurons during up and down states in vitro. J Neurosci. 2003;23:9123–9132. doi: 10.1523/JNEUROSCI.23-27-09123.2003. [DOI] [PMC free article] [PubMed] [Google Scholar]
- Brickley SG, Cull-Candy SG, Farrant M. Development of a tonic form of synaptic inhibition in rat cerebellar granule cells resulting from persistent activation of GABAA receptors. J Physiol (Lond) 1996;497:753–759. doi: 10.1113/jphysiol.1996.sp021806. [DOI] [PMC free article] [PubMed] [Google Scholar]
- Brickley SG, Revilla V, Cull-Candy SG, Wisden W, Farrant M. Adaptive regulation of neuronal excitability by a voltage-independent potassium conductance. Nature. 2001;409:88–92. doi: 10.1038/35051086. [DOI] [PubMed] [Google Scholar]
- Bright DP, Aller MI, Brickley SG. Synaptic release generates a tonic GABAA receptor-mediated conductance that modulates burst precision in thalamic relay neurons. J Neurosci. 2007;27:2560–2569. doi: 10.1523/JNEUROSCI.5100-06.2007. [DOI] [PMC free article] [PubMed] [Google Scholar]
- Brown N, Kerby J, Bonnert TP, Whiting PJ, Wafford KA. Pharmacological characterization of a novel cell line expressing human α4β3δ GABAA receptors. Br J Pharmacol. 2002;136:965–974. doi: 10.1038/sj.bjp.0704795. [DOI] [PMC free article] [PubMed] [Google Scholar]
- Caraiscos VB, Elliot EM, You-Ten KE, Cheng VY, Belelli D, Newell JG, Jackson MF, Lambert JJ, Rosahl TW, Wafford KA, MacDonald JF, Orser BA. Tonic inhibition in mouse hippocampal CA1 pyramidal neurons is mediated by alpha5 subunit-containing gamma-aminobutyric acid type A receptors. Proc Natl Acad Sci USA. 2004;101:3662–3667. doi: 10.1073/pnas.0307231101. [DOI] [PMC free article] [PubMed] [Google Scholar]
- Cope DW, Hughes SW, Crunelli V. GABAA receptor-mediated tonic inhibition in thalamic neurons. J Neurosci. 2005;25:11553–11563. doi: 10.1523/JNEUROSCI.3362-05.2005. [DOI] [PMC free article] [PubMed] [Google Scholar]
- Day M, Wang Z, Ding J, An X, Ingham C, Shering A, Wokosin D, Ilijic E, Sun Z, Sampson A, Mugnaini E, Deutch A, Sesack S, Arbuthnott G, Surmeier DJ. Selective elimination of glutamatergic synapses on striatopallidal neurons in Parkinson's disease models. Nat Neurosci. 2006;9:251–259. doi: 10.1038/nn1632. [DOI] [PubMed] [Google Scholar]
- Ebert B, Thompson SA, Saounatsou K, McKernan R, Krogsgaard-Larsen P, Wafford KA. Differences in agonist/antagonist binding affinity and receptor transduction using recombinant human gamma-aminobutyric acid type A receptors. Mol Pharmacol. 1997;52:1150–1156. [PubMed] [Google Scholar]
- Farrant M, Nusser Z. Variations on an inhibitory theme: phasic and tonic activation of GABAA receptors. Nat Rev Neurosci. 2005;6:215–229. doi: 10.1038/nrn1625. [DOI] [PubMed] [Google Scholar]
- Filion M, Tremblay L. Abnormal spontaneous activity of the globus pallidus neurons in monkeys with MPTP-induced Parkinsonism. Brain Res. 1991;547:142–151. [PubMed] [Google Scholar]
- Fisher JL, Macdonald RL. Single channel properties of recombinant GABAA receptors containing γ 2 or δ subtypes expressed with α1 and β3 subtypes in mouse L929 cells. J Physiol (Lond) 1997;505:283–297. doi: 10.1111/j.1469-7793.1997.283bb.x. [DOI] [PMC free article] [PubMed] [Google Scholar]
- Flores-Hernandez J, Hernandez S, Snyder GL, Yan Z, Fienberg A, Moss JM, Greengard P, Surmeier JD. D1 dopamine receptor activation reduces GABAA receptor currents in neostriatal neurons through a PKA/DARPP-32/PP1 signaling cascade. J Physiol (Lond) 2000;83:2996–3004. doi: 10.1152/jn.2000.83.5.2996. [DOI] [PubMed] [Google Scholar]
- Fritschy JM, Brunig I. Formation and plasticity of GABAergic synapses: physiological mechanisms and pathophysiological implications. Pharmacol Ther. 2004;98:299–323. doi: 10.1016/s0163-7258(03)00037-8. [DOI] [PubMed] [Google Scholar]
- Fritschy JM, Mohler H. GABAA-receptor heterogeneity in the adult rat brain: differential regional and cellular distribution of seven major subunits. J Comp Neurol. 1995;359:154–194. doi: 10.1002/cne.903590111. [DOI] [PubMed] [Google Scholar]
- Gerfen CR, Engber TM, Mahan LC, Susel Z, Chase TN, Monsma FJ, Jr, Sibley DR. D1 and D2 dopamine receptor-regulated gene expression of striatonigral and striatopallidal neurons. Science. 1990;250:1429–1432. doi: 10.1126/science.2147780. [DOI] [PubMed] [Google Scholar]
- Glykys J, Mody I. The main source of ambient GABA responsible for tonic inhibition in the mouse hippocampus. J Physiol (Lond) 2007;582:1163–1178. doi: 10.1113/jphysiol.2007.134460. [DOI] [PMC free article] [PubMed] [Google Scholar]
- Glykys J, Peng Z, Chandra D, Homanics G, Houser C, Mody I. A new naturally occurring GABAA receptor subunit partnership with high sensitivity to ethanol. Nat Neurosci. 2007;10:40–48. doi: 10.1038/nn1813. [DOI] [PubMed] [Google Scholar]
- Goldstein PA, Elsen FP, Ying SW, Ferguson C, Homanics GE, Harrison NL. Prolongation of hippocampal miniature inhibitory postsynaptic currents in mice lacking the GABAA receptor α1 subunit. J Neurophysiol. 2002;88:3208–3217. doi: 10.1152/jn.00885.2001. [DOI] [PubMed] [Google Scholar]
- Gong S, Zheng C, Doughty ML, Losos K, Didkovsky N, Schambra UB, Nowak NJ, Joyner A, Leblanc G, Hatten ME, Heintz N. A gene expression atlas of the central nervous system based on bacterial artificial chromosomes. Nature. 2003;425:917–925. doi: 10.1038/nature02033. [DOI] [PubMed] [Google Scholar]
- Graybiel AM. The basal ganglia: learning new tricks and loving it. Curr Opin Neurobiol. 2005;15:638–644. doi: 10.1016/j.conb.2005.10.006. [DOI] [PubMed] [Google Scholar]
- Hauser J, Rudolph U, Keist R, Möhler H, Feldon J, Yee BK. Hippocampal α5 subunit-containing GABAA receptors modulate the expression of prepulse inhibition. Mol Psychiatry. 2005;10:201–207. doi: 10.1038/sj.mp.4001554. [DOI] [PubMed] [Google Scholar]
- Hevers W, Luddens H. Pharmacological heterogeneity of gamma-aminobutyric acid receptors during development suggests distinct classes of rat cerebellar granule cells in situ. Neuropharmacology. 2002;42:34–47. doi: 10.1016/s0028-3908(01)00158-7. [DOI] [PubMed] [Google Scholar]
- Ing T, Poulter MO. Diversity of GABAA receptor synaptic currents on individual pyramidal cortical neurons. Eur J Neurosci. 2007;25:723–734. doi: 10.1111/j.1460-9568.2007.05331.x. [DOI] [PubMed] [Google Scholar]
- Jia F, Pignataro L, Schofield CM, Yue M, Harrison NL, Goldstein PA. An extrasynaptic GABAA receptor mediates tonic inhibition in thalamic VB neurons. J Neurophysiol. 2005;94:4491–4501. doi: 10.1152/jn.00421.2005. [DOI] [PubMed] [Google Scholar]
- Johnson SW, Seutin V. Bicuculline methiodide potentiates NMDA-dependent burst firing in rat dopamine neurons by blocking apamin-sensitive Ca2+ activated K+ currents. Neurosci Lett. 1997;231:13–16. doi: 10.1016/s0304-3940(97)00508-9. [DOI] [PubMed] [Google Scholar]
- Jonas P, Bischofberger J, Sandküler J. Corelease of two fast neurotransmitters at a central synapse. Science. 1998;281:419–424. doi: 10.1126/science.281.5375.419. [DOI] [PubMed] [Google Scholar]
- Kawaguchi Y, Wilson CJ, Emson PC. Intracellular recording of identified neostriatal patch and matrix spiny cells in a slice preparation preserving cortical inputs. J Neurophysiol. 1989;62:1052–1068. doi: 10.1152/jn.1989.62.5.1052. [DOI] [PubMed] [Google Scholar]
- Kawaguchi Y, Wilson CJ, Augood SJ, Emson PC. Striatal interneurons: chemical physiological and morphological characterization. Trends Neurosci. 1995;18:527–535. doi: 10.1016/0166-2236(95)98374-8. [DOI] [PubMed] [Google Scholar]
- Kita T, Kita H, Kitai ST. Passive electrical membrane properties of rat neostriatal neurons in an in vitro slice preparation. Brain Res. 1984;300:129–139. doi: 10.1016/0006-8993(84)91347-7. [DOI] [PubMed] [Google Scholar]
- Koos T, Tepper JM, Wilson CJ. Comparison of IPSCs evoked by spiny and fast-spiking neurons in the neostriatum. J Neurosci. 2004;24:7916–7922. doi: 10.1523/JNEUROSCI.2163-04.2004. [DOI] [PMC free article] [PubMed] [Google Scholar]
- Kreitzer AC, Malenka RC. Endocannabinoid-mediated rescue of striatal LTD and motor deficits in Parkinson's disease models. Nature. 2007;445:643–647. doi: 10.1038/nature05506. [DOI] [PubMed] [Google Scholar]
- Le Moine C, Normand E, Bloch B. Phenotypical characterization of the rat striatal neurons expressing the D1 dopamine receptor gene. Proc Natl Acad Sci USA. 1991;88:4205–4209. doi: 10.1073/pnas.88.10.4205. [DOI] [PMC free article] [PubMed] [Google Scholar]
- Lüscher B, Keller CA. Regulation of GABAA receptor trafficking, channel activity, and functional plasticity of inhibitory synapses. Pharmacol Ther. 2004;102:195–221. doi: 10.1016/j.pharmthera.2004.04.003. [DOI] [PubMed] [Google Scholar]
- Macdonald RL, Olsen RW. GABAA receptor trafficking, channel activity, and functional plasticity of inhibitory synapses. Annu Rev Neurosci. 1994;17:569–602. doi: 10.1146/annurev.ne.17.030194.003033. [DOI] [PubMed] [Google Scholar]
- Mallet N, Le Moine C, Charpier S, Gonon F. Feedforward inhibition of projection neurons by fast-spiking GABA interneurons in the rat striatum in vivo. J Neurosci. 2005;25:3857–3869. doi: 10.1523/JNEUROSCI.5027-04.2005. [DOI] [PMC free article] [PubMed] [Google Scholar]
- Mallet N, Ballion B, Le Moine C, Gonon F. Cortical inputs and GABA interneurons imbalance projection neurons in the striatum of parkinsonian rats. J Neurosci. 2006;26:3875–3884. doi: 10.1523/JNEUROSCI.4439-05.2006. [DOI] [PMC free article] [PubMed] [Google Scholar]
- Mercuri NB, Calabresi P, Stefani A, Stratta F, Bernardi G. GABA depolarizes neurons in the rat striatum: an in vivo study. Synapse. 1991;8:38–40. doi: 10.1002/syn.890080106. [DOI] [PubMed] [Google Scholar]
- Mody I, Pearce RA. Diversity of inhibitory neurotransmission through GABAA receptors. Trends Neurosci. 2004;27:569–575. doi: 10.1016/j.tins.2004.07.002. [DOI] [PubMed] [Google Scholar]
- Mortensen M, Smart TG. Extrasynaptic αβ subunit GABAA receptors on rat hippocampal pyramidal neurons. J Physiol (Lond) 2006;577:841–856. doi: 10.1113/jphysiol.2006.117952. [DOI] [PMC free article] [PubMed] [Google Scholar]
- Murase K, Ryu PD, Randic M. Excitatory and inhibitory amino acids and peptide-induced responses in acutely isolated rat spinal dorsal horn neurons. Neurosci Lett. 1989;103:56–63. doi: 10.1016/0304-3940(89)90485-0. [DOI] [PubMed] [Google Scholar]
- Ortinski PI, Lu C, Takagaki K, Fu Z, Vicini S. Regulation of inhibitory postsynaptic currents in cultured cerebellar neurons by GABAA receptor α subunits. J Neurophysiol. 2004;92:1718–1727. doi: 10.1152/jn.00243.2004. [DOI] [PubMed] [Google Scholar]
- Ortinski PI, Turner JR, Barberis A, Motamedi G, Yasuda RP, Wolfe BB, Kellar KJ, Vicini S. Deletion of the GABAA receptor α1 subunit increases tonic GABAA receptor current: a role for GABA uptake transporters. J Neurosci. 2006;26:9323–9331. doi: 10.1523/JNEUROSCI.2610-06.2006. [DOI] [PMC free article] [PubMed] [Google Scholar]
- Pacheco-Cano MT, Bargas J, Hernandez-Lopez S, Tapia D, Galarraga E. Inhibitory action of dopamine involves a subthreshold Cs+-sensitive conductance in neostriatal neurons. Exp Brain Res. 1996;110:205–211. doi: 10.1007/BF00228552. [DOI] [PubMed] [Google Scholar]
- Park JB, Skalska S, Stern JE. Characterization of a novel tonic gamma-aminobutyric acidA receptor-mediated inhibition in magnocellular neurosecretory neurons and its modulation by glia. Endocrinology. 2006;147:3746–3760. doi: 10.1210/en.2006-0218. [DOI] [PubMed] [Google Scholar]
- Pirker S, Schwarzer C, Wieselthaler A, Sieghart W, Sperk G. GABAA receptors: immunocytochemical distribution of 13 subunits in the adult rat brain. Neuroscience. 2000;101:815–850. doi: 10.1016/s0306-4522(00)00442-5. [DOI] [PubMed] [Google Scholar]
- Pouille F, Scanziani M. Enforcement of temporal fidelity in pyramidal cells by somatic feed-forward inhibition. Science. 2001;293:1159–1163. doi: 10.1126/science.1060342. [DOI] [PubMed] [Google Scholar]
- Quirk K, Blurton P, Fletcher S, Leeson P, Tang F, Mellilo D, Ragan CI, McKernan RM. [3H]L-655,708, a novel ligand selective for the benzodiazepine site of GABAA receptors which contain the α5 subunit. Neuropharmacology. 1996;35:1331–1335. doi: 10.1016/s0028-3908(96)00061-5. [DOI] [PubMed] [Google Scholar]
- Raz A, Vaadia E, Bergman H. Firing patterns and correlations of spontaneous discharge of pallidal neurons in the normal and the tremulous 1-methyl-4-phenyl-1,2,3,6-tetrahydropyridine vervet model of parkinsonism. J Neurosci. 2000;20:8559–8571. doi: 10.1523/JNEUROSCI.20-22-08559.2000. [DOI] [PMC free article] [PubMed] [Google Scholar]
- Richerson GB. Looking for GABA in all the wrong places: the relevance of extrasynaptic GABAA receptors to epilepsy. Epilepsy Curr. 2004;4:239–242. doi: 10.1111/j.1535-7597.2004.46008.x. [DOI] [PMC free article] [PubMed] [Google Scholar]
- Rossi DJ, Hamann M, Attwell D. Multiple modes of GABAergic inhibition of rat cerebellar granule cells. J Physiol (Lond) 2003;548:97–110. doi: 10.1113/jphysiol.2002.036459. [DOI] [PMC free article] [PubMed] [Google Scholar]
- Schwarzer C, Berresheim U, Pirker S, Wieselthaler A, Fuchs K, Sieghart W, Sperk G. Distribution of the major gamma-aminobutyric acidA receptor subunits in the basal ganglia and associated limbic brain areas of the adult rat. J Comp Neurol. 2001;443:526–549. doi: 10.1002/cne.1158. [DOI] [PubMed] [Google Scholar]
- Scimemi A, Semyanov A, Sperk G, Kullman D, Walker M. Multiple and plastic receptors mediate tonic GABAA receptor currents in the hippocampus. J Neurosci. 2005;15:10016–10024. doi: 10.1523/JNEUROSCI.2520-05.2005. [DOI] [PMC free article] [PubMed] [Google Scholar]
- Semyanov A, Walker MC, Kullmann DM. GABA uptake regulates cortical excitability via cell type-specific tonic inhibition. Nat Neurosci. 2003;6:484–490. doi: 10.1038/nn1043. [DOI] [PubMed] [Google Scholar]
- Shen W, Hamilton SE, Nathanson NM, Surmeier DJ. Cholinergic suppression of KCNQ channel currents enhances excitability of striatal medium spiny neurons. J Neurosci. 2005;25:7449–7458. doi: 10.1523/JNEUROSCI.1381-05.2005. [DOI] [PMC free article] [PubMed] [Google Scholar]
- Sigworth FJ, Sine SM. Data transformations for improved display and fitting of single-channel dwell time histograms. Biophys J. 1987;52:1047–1054. doi: 10.1016/S0006-3495(87)83298-8. [DOI] [PMC free article] [PubMed] [Google Scholar]
- Spruston N, Jaffe DB, Williams SH, Johnston D. Voltage- and space-clamp errors associated with the measurement of electrotonically remote synaptic events. J Neurophysiol. 1993;70:781–802. doi: 10.1152/jn.1993.70.2.781. [DOI] [PubMed] [Google Scholar]
- Stell BM, Mody I. Receptors with different affinities mediate phasic and tonic GABAA conductances in hippocampal neurons. J Neurosci. 2002;22:1–5. doi: 10.1523/JNEUROSCI.22-10-j0003.2002. RC223. [DOI] [PMC free article] [PubMed] [Google Scholar]
- Storustovu SI, Ebert B. Pharmacological characterization of agonists at δ-containing GABAA receptors: functional selectivity for extrasynaptic receptors is dependent on the absence of γ2. J Pharmacol Exp Ther. 2006;316:1351–1359. doi: 10.1124/jpet.105.092403. [DOI] [PubMed] [Google Scholar]
- Tepper JM, Koos T, Wilson CJ. GABAergic microcircuits in the neostriatum. Trends Neurosci. 2004;27:662–669. doi: 10.1016/j.tins.2004.08.007. [DOI] [PubMed] [Google Scholar]
- Venance L, Glowinski J. Heterogeneity of spike frequency adaptation among medium spiny neurones from the rat striatum. Neuroscience. 2003;122:77–92. doi: 10.1016/s0306-4522(03)00553-0. [DOI] [PubMed] [Google Scholar]
- Verheugen JA, Fricker D, Miles R. Noninvasive measurements of the membrane potential and GABAergic action in hippocampal interneurons. J Neurosci. 1999;19:2546–2555. doi: 10.1523/JNEUROSCI.19-07-02546.1999. [DOI] [PMC free article] [PubMed] [Google Scholar]
- Verdoorn TA, Draguhn A, Ymer S, Seeburg PH, Sakmann B. Functional properties of recombinant rat GABAA receptors depend upon subunit composition. Neuron. 1990;4:919–928. doi: 10.1016/0896-6273(90)90145-6. [DOI] [PubMed] [Google Scholar]
- Vicini S, Ortinski PI. Genetic manipulations of GABAA receptor in mice make inhibition exciting. J Pharmacol Exp Ther. 2004;103:109–120. doi: 10.1016/j.pharmthera.2004.06.001. [DOI] [PubMed] [Google Scholar]
- Vicini S, Ferguson C, Prybylowski K, Kralic J, Morrow AL, Homanics GE. GABAA receptor α1 subunit deletion prevents developmental changes of inhibitory synaptic currents in cerebellar neurons. J Neurosci. 2001;21:3009–3016. doi: 10.1523/JNEUROSCI.21-09-03009.2001. [DOI] [PMC free article] [PubMed] [Google Scholar]
- Wall MJ, Usowicz MM. Development of action potential-dependent and independent spontaneous GABAA receptor-mediated currents in granule cells of postnatal rat cerebellum. Eur J Neurosci. 1997;9:533–548. doi: 10.1111/j.1460-9568.1997.tb01630.x. [DOI] [PubMed] [Google Scholar]
- Wang ZL, Day M, Ronesi J, Yin HH, Ding J, Tkatch T, Lovinger DM, Surmeier DJ. Dopaminergic control of corticostriatal long-term synaptic depression in medium spiny neurons is mediated by cholinergic interneurons. Neuron. 2006;50:443–452. doi: 10.1016/j.neuron.2006.04.010. [DOI] [PubMed] [Google Scholar]
- Wei W, Zhang N, Peng Z, Houser CR, Mody I. Perisynaptic localization of δ subunit containing GABAA receptors and their activation by GABA spillover in the mouse dentate gyrus. J Neurosci. 2003;23:10650–10661. doi: 10.1523/JNEUROSCI.23-33-10650.2003. [DOI] [PMC free article] [PubMed] [Google Scholar]
- Wolf JA, Moyer JT, Lazarewicz MT, Contreras D, Benoit-Marand M, O'Donnell P, Finkel LH. NMDA/AMPA ratio impacts state transitions and entrainment to oscillations in a computational model of the nucleus accumbens medium spiny projection neuron. J Neurosci. 2005;25:9080–9095. doi: 10.1523/JNEUROSCI.2220-05.2005. [DOI] [PMC free article] [PubMed] [Google Scholar]
- Wu Y, Wang W, Richerson GB. The transmembrane sodium gradient influences ambient GABA concentration by altering the equilibrium of GABA transporters. J Neurophysiol. 2006;96:2425–2436. doi: 10.1152/jn.00545.2006. [DOI] [PubMed] [Google Scholar]
- Yamada J, Furkawa T, Ueno S, Ymamoto S, Fukada A. Molecular basis for the GABAA receptor-mediated tonic inhibition in rat somatosensory cortex. Cereb Cortex. 2007;17:1782–1787. doi: 10.1093/cercor/bhl087. [DOI] [PubMed] [Google Scholar]