

Abstract
Long-term potentiation (LTP) of excitatory synapses on GABAergic neurons in layer II/III of visual cortical slices was examined in GAD67-GFP knock-in mice by whole-cell recordings of EPSPs evoked by layer IV stimulation. Theta burst stimulation (TBS) paired with postsynaptic depolarization induced LTP in 14 of 19 fast-spiking GABAergic (FS-GABA) neurons, whereas only in 6 of 17 non-FS GABAergic neurons. The mean magnitude of LTP in the former cell group was larger than that in the latter. The paired-pulse stimulation protocol and coefficient of variation analysis indicated that LTP of excitatory synapses on FS-GABA neurons may be postsynaptic in origin. Filling postsynaptic cells with a Ca2+-chelator blocked the induction of LTP, suggesting an involvement of postsynaptic Ca2+ rise. The developmental analysis of LTP indicated that almost the same magnitude of LTP was induced after postnatal day 17 to the young adulthood, suggesting no age dependence after eye opening. This form of LTP was dependent neither on NMDA receptors nor voltage-gated Ca2+ channels (L and T types). An antagonist for type 5 metabotropic glutamate receptors (mGluR5) blocked this form of LTP, whereas an antagonist for mGluR1 was not effective. An agonist for mGluR1/5 induced potentiation of EPSPs of FS-GABA neurons in concentration- and use-dependent manners. This potentiation and TBS-induced LTP occluded each other. Further pharmacological analyses suggested that this form of LTP at FS-GABA neurons is induced through an activation of mGluR5, which triggers Ca2+ release from internal stores via activations of phospholipase C and inositol triphosphate.
Keywords: LTP, GABAergic neuron, fast-spiking neuron, metabotropic glutamate receptor, visual cortex, transgenic mouse
Introduction
Experience-dependent modification of visual cortical function is based on combined plasticity of excitatory and inhibitory circuits in the cortex. Long-term potentiation (LTP) is a form of synaptic plasticity, which may be involved in such modification of cortical neuronal circuits (Tsumoto, 1992; Bear, 2003; Hensch, 2005). Most of the previous studies focused on LTP of excitatory synapses on pyramidal neurons in layer II/III or V of the cortex. Recently LTP of GABAergic inhibitory synapses in the cortex also attracted an interest (Komatsu and Iwakiri, 1993; Holmgren and Zilberter, 2001; Maffei et al., 2006). There is another locus of plasticity in the inhibitory circuits, i.e., excitatory synapses on GABAergic neurons. Within our knowledge, there was no systematic study on LTP of this type of synapses in the visual cortex.
Regarding mechanisms underlying LTP of excitatory synapses on pyramidal neurons, its induction is known to depend on an increase in postsynaptic Ca2+ concentration, through NMDA receptor (NMDAR) channels (Artola and Singer, 1987; Kimura et al., 1989; Bear et al., 1992; Kirkwood et al., 1993) or voltage-gated Ca2+ channels (Grover and Teyler, 1990; Komatsu and Iwakiri, 1992; Liu et al., 2004), or on a release of Ca2+ from inositol triphosphate (IP3)-sensitive stores via an activation of metabotropic glutamate receptors (mGluRs) (Huemmeke et al., 2002; Wang and Daw, 2003). Mechanisms of LTP of excitatory synapses on GABAergic neurons are not well known; however, because this form of LTP eluded previous studies, as mentioned above.
The possibility to record excitatory synaptic responses from GABAergic neurons in the visual cortex is low, because the proportion of GABAergic neurons is only 15–25% of all neurons in the rodent neocortex and their soma sizes are generally smaller than those of excitatory neurons (Meinecke and Peters, 1987; Ren et al., 1992; Gonchar and Burkhalter, 1997; Kawaguchi and Kubota, 1997). To overcome this problem we used transgenic mice, in which expression of green fluorescence protein (GFP) is regulated by glutamate decarboxylase 67 (GAD67) gene promoter (GAD67-GFP knock-in mice) (Tamamaki et al., 2003). In cortical slices prepared from these transgenic mice, we can easily identify GABAergic neurons under a fluorescence microscope.
GABAergic neurons are classified functionally into at least two subgroups, fast-spiking (FS) and non-FS neurons, which may correspond approximately to basket cells and non-basket cells morphologically, and parvalbumin (PV)-positive cells and non-PV cells neurochemically (Kawaguchi and Kubota, 1997; Markram et al., 2004). Therefore, excitatory synapses on GABAergic neurons might have different types of LTP, depending on subgroups of postsynaptic GABAergic neurons, and mechanisms underlying LTP might differ.
In the present study, we examined whether LTP is induced at excitatory synapses on each subgroup of cortical GABAergic neurons, and if induced what mechanisms are involved in this form of synaptic plasticity. We found that robust LTP was induced at excitatory synapses on the FS type of GABAergic neurons, whereas no or marginal LTP was seen at excitatory synapses on the non-FS type of GABAergic neurons, and LTP at the former synapses was induced through an activation of type 5 mGluRs.
Materials and Methods
Slice preparation.
Wild-type (WT) and GAD67-GFP knock-in mice, aged from postnatal day 16 (P16)–P19, except the experiments in which age dependence of LTP was tested from P12–P43, were anesthetized with isoflurane (Abbott, Abbott Park, IL) and then decapitated. The brains were rapidly removed and placed in the cold oxygenated artificial CSF (ACSF). Coronal slices of the visual cortex (300 μm thick) were obtained using a tissue slicer (Vibratome 3000; Vibratome, St. Louis, MO). All experimental procedures were performed in accordance with the guidelines of the Animal Experimental Committee of RIKEN Brain Science Institute. Slices were placed in an incubating chamber of oxygenated ACSF at 31°C for at least 1 h before recording. The recording temperature was 29–31°C. The ACSF had the following composition (in mm): 124 NaCl, 3 KCl, 2 CaCl2, 1 MgCl2, 1.25 NaH2PO4, 26 NaHCO3, and 10 glucose at pH 7.4. The ACSF was bubbled continuously with 95% O2-5% CO2. The flow rate of the ACSF was ∼2.5 ml/min.
Whole-cell recordings.
Whole-cell recordings were made from pyramidal and GABAergic neurons in layer II/III of the visual cortex under infrared differential interference contrast optics. GABAergic neurons in cortical slices of GAD67-GFP knock-in mice were visualized with an epifluorescence microscope (BX51WI; Olympus, Tokyo, Japan). We identified fast-spiking and non-fast-spiking GABAergic neurons by injecting depolarizing currents of 50–400 pA for 500 ms, as described in Results. In most of the experiments, EPSPs evoked by test stimulation of layer IV at 0.05 Hz were recorded in the current-clamp mode. In part of the experiments EPSCs were recorded in the voltage-clamp mode at −70 mV. EPSPs or EPSCs were recorded with a multiclamp amplifier (700B; Molecular Devices, Palo Alto, CA), filtered at 2–5 kHz and digitized at 10 kHz, and fed into a Pentium 4 personal computer with a digitizer computer interface (PCI-MIO-16E-4; National Instruments, Austin, TX). The analysis was made using Igor 4.01 program.
Recording electrodes were pulled from borosilicate glass capillary with filaments (0.86 mm inner diameter, 1.5 mm outer diameter). The resistance of these electrodes with the following internal solution was 5–7 MΩ. The composition of the internal solution was as follows (in mm): 130 K-gluconate, 10 KCl, 10 HEPES, 0.2 EGTA, 4 MgATP, 0.5 Na3GTP, and 10 Na-phosphocreatine, and adjusted to pH 7.2 with KOH. The osmolarity of the solution was 275–290 mOsm. The series resistance of the recording system in the voltage-clamp mode was measured at the beginning of the recording, using 10 mV test pulse, and checked when the recordings were switched to the voltage clamp mode. The measured values were usually 14–25 MΩ. The input resistance of neurons was continuously monitored throughout the recording by injecting hyperpolarizing test currents (−20 pA for 100 ms). The measured values were mostly 120–180 MΩ (Tables 1, 2), and usually very stable during recordings, as seen in supplemental Figure 3B (available at www.jneurosci.org as supplemental material). If these values changed >20%, the recordings were stopped and the data were discarded. To identify the morphology of recorded neurons, neurons were filled with biocytin (0.2%) through recording pipettes in part of the experiments. In the experiments in which postsynaptic Ca2+ was chelated, 1,2-bis-(2-aminophenoxy)ethane-N,N,N′,N′-tetraacetic acid (BAPTA) was added at the concentration of 10 mm to the internal solution of recording electrodes. Similarly, given drugs and dimethyl sulfoxide (DMSO) (0.1% in ACSF) as vehicle were added to the internal solution.
Table 1.
Properties of FS-GABA neurons of GAD67-GFP knock-in and wild-type mice (mean ± SD): membrane properties
| Resting potential (mV) | Max. firing rate (Hz) | Input resistance (MΩ) | |
|---|---|---|---|
| GAD67-GFP (n = 19) | −67.8 ± 2.6 | 91.0 ± 17.2 | 153.3 ± 38.8 |
| Wild-type (n = 9) | −70.3 ± 3.2 | 108.0 ± 23.7 | 133.3 ± 37.5 |
Table 2.
Properties of FS-GABA neurons of GAD67-GFP knock-in and wild-type mice (mean ± SD): spontaneous EPSP properties
| Amplitude (pA) | Frequency (Hz) | Rise time (ms) 10–90% | Decay time (ms) Peak to 63% | |
|---|---|---|---|---|
| GAD67-GFP (n = 6) | 20.2 ± 10.0 | 13.8 ± 4.0 | 1.1 ± 0.2 | 3.1 ± 0.3 |
| Wild-type (n = 5) | 20.7 ± 4.5 | 13.4 ± 3.4 | 1.2 ± 0.2 | 3.4 ± 1.5 |
LTP induction.
EPSPs of GABAergic and pyramidal neurons in layer II/III of visual cortical slices were elicited by test stimulation at 0.05 Hz through a concentric bipolar stimulating electrode (125 μm diameter; FHC, Bowdoin, ME) positioned in layer IV of the cortex. The intensity of test stimulation was set at 50% for the maximal responses (30–80 μA for pulses of 0.1 ms duration). After recording baseline responses for 10 min, theta burst stimulation (TBS) paired with postsynaptic depolarization at 0 mV for 30 s was applied to layer IV. TBS consisted of three trains at 0.1 Hz, each train of 10 bursts at 5 Hz, and each burst of four pulses at 100 Hz. The intensity and width of each pulse were the same as those of test pulse. Thereafter, responses to test stimulation at 0.05 Hz were recorded again for at least 30 min.
Analysis of coefficient of variation of EPSPs and paired-pulse ratio.
The coefficient of variation (CV) of the peak amplitudes of EPSPs was determined within the stationary period. The stationary periods were 5–10 min before TBS and 15–35 min after TBS, when the peak amplitude of EPSPs was stable. The value of CV−2 was corrected for the variance of the background noise, using the relation σ2 = σ2 (measured) − σ2 (noise) (Faber and Korn 1991). To measure the background noise we used 2 ms of traces before stimulus. Then, we calculated the normalized CV and mean to the respective value (CV = σ/m, where σ is the SD and m is the mean). To assess a possible change after TBS, we used separate block of 15–30 (mostly 30) traces for baseline value before TBS and 30–60 (mostly 60) traces 15–35 min after TBS.
The paired-pulse ratio was determined as the peak amplitude of averaged traces (10–25 sweeps) of the second EPSPs to that of the first EPSPs.
Drugs.
Drugs were applied either through the perfusion medium or the internal solution of recording pipettes. When drugs were applied through the internal solution, control recordings using the internal solution alone or the vehicle (DMSO solution) alone were made in slices from the same mice as used for test recordings. In case of the bath application, interleaved control recordings were made in slices without drug from the same animals. As selective antagonists for respective type of glutamate receptors, we used the following drugs: dl-2-amino-5-phosphonovaleric acid (APV; Sigma, St. Louis, MO) at 100 μm for NMDAR, 6-cyano-7-nitroquinoxaline-2,3-dione (CNQX, Sigma) at 20 μm for AMPA receptor (AMPAR), (s)-(+)-α-amino-4-carboxy-2-methylbenzeneacetic acid (LY367385; Tocris Bioscience, Bristol, UK) at 100 μm for mGluR1, and 2-methyl-6-(phenylethynyl)pyridine hydrochloride (MPEP; Tocris Bioscience) at 10 μm for mGluR5. As a selective agonist for group I mGluRs (mGluR1/5), we used (S)-3,5-dihydroxyphenylglycine (DHPG; Tocris Bioscience) at 100 μm. As blockers for voltage-gated Ca2+ channels, we used the following substances: 1,4-dihydro-2,6-dimethyl-4-(3-nitrophenyl)-3,5-pyridinedicarboxylic acid 2-methyloxyethyl 1-methyl ester (nimodipine; Tocris Bioscience) at 10 μm for L-type channels and NiCl2 at 100 μm for T-type channels. Because there is a possibility that Ni2+ at this concentration might not selectively block T-type channels, we also used Ro40-5967/(1S,2S)-2-[2-[[3-(1H-benzimidazol-2yl)propyl]methyl-amino]-6-fluoro-1,2,3,4-tetrahydro-1-(1-methylethyl)-2-naphthalenyl methoxyaceto-acetate dihydrochloride (mibefradil dihydrochloride; Tocris Bioscience) at 100 μm as another blocker for T-type channels. To block signaling pathways after the activation of mGluRs, we used 1-[6-[[(17β)-3-methoxyester-1,3,5(10)-trien-17-yl]amino]-hexyl]-1H-pyrole-2,5-dione (U-73122) at 10 μm, as a phospholipase C (PLC) inhibitor, cyclopiazonic acid (CPA; Sigma) at 5 μm as a Ca2+ pump blocker to deplete Ca2+ in intracellular Ca2+ stores, and 2-aminoethyl diphenyl borate (2-APB; Sigma) at 3 μm or heparin (Sigma) at 10 U/ml, as an inhibitor for IP3 receptors. In case of the application of nimodipine, CPA, LY367385, and 2-APB, DMSO (0.1%) was used as vehicle.
Analysis of morphology of recorded neurons.
After electrophysiological recordings, slices containing biocytin-loaded neurons were processed in a way similar to that described previously (Jiang et al., 2004). Briefly, slices were fixed by immersion in 10% paraformaldehyde (Sigma) and 10% sucrose (w/v) in 0.1 m PBS overnight at 4°C. Then the slices were washed in 0.1 m PBS five to seven times each for 10 min and then incubated in PBS containing 0.2% Triton X-100 (Sigma) overnight. Subsequently, the slices were incubated in avidind–rhodamine (Pierce, Rockford, IL; diluted 1:400 in the Triton X-100-containing PBS) for 24 h, and finally washed in 0.1 m PBS five to seven times each for 10 min. For imaging labeled neurons, slices were placed on a chamber containing 0.1 m PBS and observed with two-photon laser scanning microscopy (Radiance 2000MP; Bio-Rad, Hertfordshire, UK) (Sohya et al., 2007). Excitation light was focused using a 40× water-immersion objective (0.8 numerical aperture; Nikon, Tokyo, Japan). Excitation wavelength was in the range of 790–810 nm. The z-stack image was acquired with optical slices of 0.75 μm in each step.
Statistical analysis.
In the present study, values are given as mean ± SEM, unless otherwise mentioned. For statistical analysis, values before and after TBS obtained from the same cell and values between two groups of cells were compared with paired and unpaired t test, respectively, when the values showed the normal distribution. The statistical evaluation of normal distribution was made using the Kolmogorov–Smirnov test. In case the distribution of values was not normal, a nonparametric test (Mann–Whitney U test) was used.
Results
Properties of cortical GABAergic neurons of GAD67-GFP knock-in mice
In slices prepared from the visual cortex of GAD67-GFP knock-in type of transgenic (TG) mice, GFP-positive neurons were scattered in the cortex under a fluorescence microscope, as reported previously (Jiang et al., 2004). It was demonstrated that almost all of these GFP-positive neurons are GABAergic (Tamamaki et al., 2003).
As mentioned in the Introduction, GABAergic neurons are classified into various groups on the basis of morphological, electrophysiological and neurochemical properties. In the present study we simply classified GABAergic neurons into FS and non-FS neurons, based on electrophysiological properties, as reported previously (Kawaguchi and Kubota, 1997; Markram et al., 2004). As exemplified in Figure 1B, 19 of the 36 GFP-positive cells to which depolarization pulses were applied generated fast-rising and -decaying spikes at regular intervals without clear accommodation. These cells are called FS-GABA neurons. Morphologically these cells were basket cells (Fig. 1A), and immunohistochemically PV positive, as reported previously (Kawaguchi and Kubota, 1997; Markram et al., 2004). Twenty-seven of the 29 immunohistochemically stained FS-GABA neurons were positive to anti-PV antibody (supplemental Fig. 1, available at www.jneurosci.org as supplemental material). The other group of GFP-positive neurons did not generate action potentials at such a regular interval, but showed a marked afterhyperpolarization (Fig. 1F), which is one of characteristic properties of GABAergic neurons (Markram et al., 2004). Thus, these neurons are called non-FS-GABA neurons. Morphologically these cells were bitufted or bipolar cells (Fig. 1E), as reported previously (Kawaguchi and Kubota, 1997; Markram et al., 2004).
Figure 1.

Fast-spiking and non-fast-spiking GABAergic neurons and LTP of excitatory synapses on the former type of neurons. A, E, Biocytin images of fast-spiking and non-fast-spiking GABAergic neurons, respectively, in layer II/III of the visual cortex of GAD67-GFP knock-in mice. Scale bar, 50 μm. B, F, Representative train of action potentials of fast-spiking and non-fast-spiking GABAergic neurons, respectively, evoked by the current injection of 200 pA for 500 ms. Rectangular areas are shown at an expanded time scale in the right. C, G, Time courses of EPSP slopes of fast-spiking and non-fast-spiking GABAergic neurons, respectively. Insets, superimposed traces of EPSPs before (a) and 20–25 min after the application of TBS (b). Each trace is an average of 15 consecutive EPSPs. The part of initial onset and peak of EPSPs is shown in the right at the expanded time scale. D, H, Time courses of the mean EPSP slopes of 19 fast-spiking and 17 non-fast-spiking neurons. The slope was normalized to the value before TBS. Vertical bars indicate mean ± SEMs.
Then, we checked whether GFP-positive, FS-GABA neurons in the visual cortex of TG mice have membrane properties different from those of FS-GABA neurons in the visual cortex of WT mice. As will be described below, we focused our analysis on excitatory synapses to FS-GABA neurons in the present study. Thus, we measured the resting membrane potential and input resistance and then the frequency and amplitude of spontaneous EPSCs and their rising and decaying times of 25 GFP-positive, FS-GABA cells in slices of TG mice and 14 FS-GABA cells in slices of WT mice. These 14 cells were judged as FS-GABA neurons, based on the criteria described above. As summarized in Tables 1 and 2, we did not find any significant difference in these properties between FS-GABA neurons of the TG and WT mice (p > 0.1, unpaired t test). Therefore, it seems reasonable to conclude that membrane properties of FS-GABA neurons in the visual cortex of GAD67-GFP knock-in mice are not different from those of WT mice.
Robust LTP was induced at excitatory synapses on FS-GABA neurons, but not at non-FS-GABA neurons
In GFP-positive neurons, test stimulation of layer IV at 0.05 Hz elicited synaptic potentials with a rapid decay (Fig. 1C, traces). Such a rapid decay was also reported in unitary EPSPs at hippocampal interneuron synapses (Geiger et al., 1997). The onset latency of these synaptic potentials was measured from the center of the stimulus artifacts to the onset of averaged potentials (Alle et al., 2001). The mean onset latencies for the 19 FS-GABA neurons were 1.77 ± 0.08 ms. Such a short latency and a very small fluctuation of the latency (usually within 0.1 ms) indicated that the synaptic potentials were elicited monosynaptically. These potentials were almost completely blocked by simultaneous application of CNQX and APV, antagonists for glutamate receptors of the AMPA and NMDA types, respectively. In our previous study, it was also confirmed that these responses were still evoked in the presence of picrotoxin, a GABAA antagonist (Jiang et al., 2004). These results altogether indicated that the potentials evoked by test stimulation of layer IV were EPSPs mediated by glutamate. If a sign of run down of EPSPs or a marked change in input and/or series resistances of the recording system were detected, the recordings were stopped and the data obtained were discarded. In almost all cases which will be reported below, thus, GFP-positive cells did not show any significant run-down of EPSPs. The mean ratio of EPSP slope 40 min after the initiation of recording to the initial 10 min value for seven cells in which the measurement was made was 1.01 ± 0.05.
After recordings of baseline responses for at least 10 min, we applied TBS, which was paired with postsynaptic depolarization to 0 mV for 30 s, in the voltage-clamp mode. We found that such paired TBS induced persistent potentiation (> 20 min) of EPSPs in most of the FS-GABA neurons (Fig. 1C). Such a persistent potentiation of EPSPs was defined as LTP when the initial, rising slope of EPSPs 20–25 min after TBS was significantly (p < 0.05, paired t test) larger than that of the baseline value. Then, we found that the proportion of FS-GABA neurons which showed LTP was higher than that of non-FS-GABA neurons: significant LTP was induced in 14 of 19 FS cells, whereas it was induced only in 6 of 17 non-FS cells in TG mice (Fig. 2, left two columns). This difference in the probability of LTP induction between the two groups of cells was evaluated with the Mann–Whitney U test, and was confirmed to be significant at p < 0.05. In WT also, significant LTP was induced in seven of nine FS cells, whereas it was induced only in 3 of 10 non-FS cells (Fig. 2, right two columns). The difference between these two probabilities was again significant (p < 0.05, Mann–Whitney U test).
Figure 2.

Potentiation of EPSP is larger at FS-GABA neurons than non-FS-GABA neurons in GAD67-GFP knock-in and wild-type mice. The EPSP slope 20–25 min after TBS was normalized to that before TBS for each cell. Horizontal and vertical bars indicate mean ± SEMs. Asterisks indicate a statistically significant difference at ***p < 0.001 and *p < 0.05 (unpaired t test).
The immunoreactivity to antibody against PV was tested in the small number of cells after prolonged (> 40 min) recordings, because the immunoreactivity was often weakened or lost from the soma of recorded cells after whole-cell patch-clamp recording for such a long time. In TG mice, three of the four FS-GABA neurons that were PV positive showed significant LTP.
In Figure 1, D and H, it was also evident that the magnitude of changes in EPSPs was significantly different between FS-GABA and non-FS-GABA neurons. In the 19 FS neurons of TG mice the mean ratio of the EPSP slope 20–25 min after paired TBS was 1.65 ± 0.10 to the baseline value, whereas it was 1.20 ± 0.06 in the 17 non-FS neurons (Fig. 2, left two columns). The difference between these two values was statistically significant (p < 0.001, unpaired t test). Such a difference in the magnitude of the change in EPSPs was seen also in WT mice. The mean ratio of the EPSP slope after TBS to the baseline value was 1.57 ± 0.14 (n = 9) in FS cells whereas it was 1.12 ± 0.03 (n = 10) in non-FS cells (Fig. 2, right two columns). The difference was again significant (p < 0.05, unpaired t test). Because significant LTP was induced reliably in FS-GABA neurons but not so in non-FS-GABA neurons, the further analysis of mechanisms underlying LTP was made mostly in the former group of GABAergic neurons. Also we found that the magnitude and time course of LTP of FS-GABA neurons were similar to those seen in pyramidal neurons (supplemental Fig. 2, available at www.jneurosci.org as supplemental material).
Then, we tested whether TBS without postsynaptic depolarization could induce LTP of EPSPs in FS-GABA neurons in TG mice. For this the membrane potential of 17 GFP-positive FS cells was clamped at −70 mV during TBS of layer IV. We found that TBS without postsynaptic depolarization did not induce long-lasting enhancement of EPSPs in most cases (supplemental Fig. 3A, available at www.jneurosci.org as supplemental material). Significant LTP was induced only in 6 of the 17 cells by TBS without postsynaptic depolarization. The mean ratio of the EPSP slope 20–25 min after TBS to the baseline value was 1.22 ± 0.12 in these 17 cells. This value was significantly (p < 0.05, unpaired t test) smaller than that (1.62 ± 0.12) of the 12 control cells, in which TBS was associated with postsynaptic depolarization. Next, we tested another possibility that postsynaptic depolarization per se might induce potentiation of EPSPs in FS-GABA neurons in TG mice. To test this possibility, the membrane potential of GFP-positive FS cells was depolarized to 0 mV for 1.5 min without TBS stimulation of layer IV. Such a postsynaptic depolarization alone did not induce any potentiation of EPSPs in these cells. The mean ratio of the EPSP slope 20 min after depolarization to the baseline value was 1.06 ± 0.01 (n = 8).
LTP of excitatory synapses on FS-GABA neurons is not age dependent after eye opening
To examine whether there are developmental changes in the inducibility of LTP or the magnitude of LTP of excitatory synapses on FS-GABA neurons, we plotted changes in the initial slope of EPSPs 20–25 min after TBS versus the age of the animals (Fig. 3). As seen in this figure, several FS-GABA neurons did not show significant LTP at P12–P15 (just before or at the day of eye opening), and then robust LTP was induced in almost all of FS-GABA neurons at P17–P21. The difference in the mean value between P12 and P13 and P15 and P16 was significant (p < 0.05, unpaired t test). After P17 the magnitude of LTP, on average, remained at the nearly same level without obvious decay with age. These results indicate that LTP of excitatory synapses on FS-GABA neurons is not age dependent, at least during the period from P17 to P43.
Figure 3.

LTP of excitatory synapses on FS-GABA neurons is not age dependent after eye opening. The ratio of the EPSP slope 20–25 min after TBS to that before TBS is plotted for each cell at the postnatal age indicated on abscissa. Error bars indicate means ± SEMs of each age group. The values are 1.17 ± 0.24 (n = 7) at P12–P13, 1.54 ± 0.17 (n = 7) at P14, 1.77 ± 0.13 (n = 14) at P15–P16, 1.92 ± 0.16 (n = 6) at P17–P18, 2.08 ± 0.12 (n = 8) at P19–P22, 1.85 ± 0.17 (n = 6) at P27–P30, 1.84 ± 0.25 (n = 6) at P35, 1.78 ± 0.19 (n = 6) at P39–P41, and 1.69 ± 0.16 (n = 5) at P43.
Expression of LTP of excitatory synapses on FS-GABA neurons is mainly postsynaptic in origin
To determine whether LTP of excitatory synapses on FS-GABA neurons is expressed presynaptically or postsynaptically, we initially analyzed the paired-pulse ratio (PPR) of EPSPs. In a FS-GABA neuron shown in the top of Figure 4A, both EPSPs evoked by paired pulse stimulation at an interval of 100 ms were enhanced in parallel after TBS so that PPR was not obviously changed. Although a few cells showed an increase and another few cells showed a decrease in PPR, the mean PPRs of the 11 cells tested were not significantly changed after the induction of LTP (Fig. 4A). The mean PPR before TBS was 0.81 ± 0.04 and that after the induction of LTP was 0.75 ± 0.04. These two values were not significantly different (p > 0.1, paired t test). This result suggests that LTP may not be ascribable to changes in presynaptic sites (Zucker, 1989).
Figure 4.
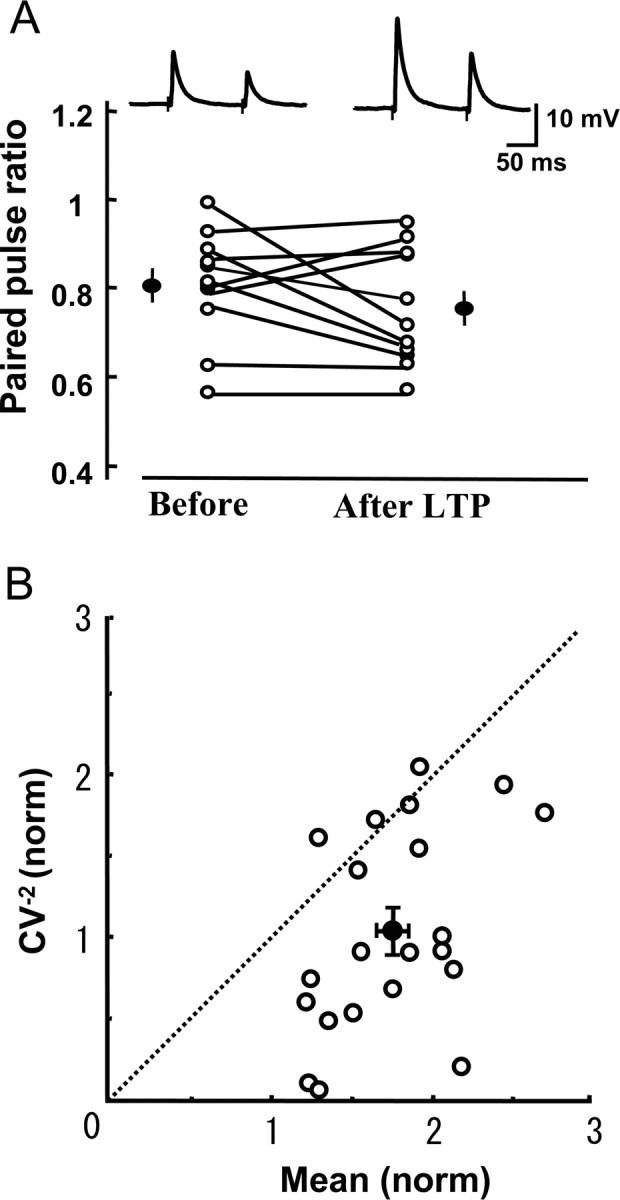
LTP of excitatory synapses on FS-GABA neurons is mainly postsynaptic in origin. A, Top, examples of EPSPs evoked by paired-pulse stimuli at an interval of 100 ms before and after the induction of LTP of excitatory synapses on a FS-GABA neuron. Averages of 15 consecutive sweeps. In the bottom graph, the values of paired-pulse ratio before and after the induction of LTP are connected for each of 11 cells. Filled circles and vertical bars indicate means ± SEMs. B, CV analysis of changes in EPSPs after the induction of LTP. Twenty-one FS-GABA neurons were selected for this analysis, because they showed significant LTP. Filled circle and vertical and horizontal bars indicate mean ± SEMs, which were 1.02 ± 0.14 for the normalized value of CV−2 and 1.71 ± 0.08 for the normalized mean value.
To further address the presynaptic and postsynaptic issue, we next made the CV analysis (Faber and Korn, 1991; Sjöström et al., 2003). On the basis of a binomial model of synaptic transmission, functional changes in presynaptic sites are expected to be accompanied by a change in the CV of synaptic responses: the values of CV−2 that are plotted against the change in efficacy could be on the diagonal line, if the release probability is very low. However, if changes are located purely in postsynaptic sites, the values should be located on the horizontal line of 1.0. As shown in Figure 4B, the values of 17 of the 21 FS-GABA neurons that showed significant LTP were located below the diagonal line. Only four cells were located above or on the diagonal line. Also, it is to be noted that the mean value of the normalized CV−2 for the 21 neurons was very close to 1.0. These results altogether suggest that LTP of excitatory synapses on most FS-GABA neurons is expressed postsynaptically, although we cannot exclude the presynaptic or mixed presynaptic and postsynaptic changes in a fraction of FS-GABA neurons.
LTP of excitatory synapses on FS-GABA neurons is postsynaptic Ca2+ dependent
Then, we addressed the question of whether the induction of LTP of excitatory synapses on FS-GABA neurons is dependent on an increase in Ca2+ in postsynaptic sites, as reported in excitatory synapses on pyramidal cells. To answer this question, postsynaptic FS-GABA neurons were filled with a Ca2+ chelator, BAPTA, through recording pipettes. The concentration of BAPTA in the pipettes was 10 mm and recordings were not initiated until at least 5 min after rupture of cell membrane to allow BAPTA to spread in the neurons. An example of EPSPs obtained from a BAPTA-filled FS-GABA neuron is shown in Figure 5(top right). In this neuron TBS paired with postsynaptic depolarization did not obviously enhance EPSPs. However, the same parameter of TBS induced robust LTP of EPSPs in a control FS-GABA neuron (Fig. 5, top left). Group data obtained from 8 BAPTA-filled FS-GABA neurons are shown together with those of 11 control FS-GABA neurons (Fig. 5, bottom graph). The mean slope of EPSPs 20–25 min after TBS in the 8 BAPTA-filled neurons was 1.06 ± 0.06, whereas it was 1.47 ± 0.09 in the 11 control neurons. The difference between these two values was statistically significant (p < 0.001, unpaired t test). These results indicate that an elevation of Ca2+ in postsynaptic FS-GABA neurons is necessary to induce LTP of excitatory synapses on these neurons.
Figure 5.

Blockade of the induction of LTP by postsynaptic filling with BAPTA. Top, superposed traces of EPSPs before (a) and 20–25 min after TBS (b). Left, EPSPs recorded from a control FS-GABA neuron. Right, EPSPs recorded from a FS-GABA neuron, which was filled with BAPTA. The concentration of BAPTA in recording pipettes was 10 mm. Each trace is an average of 15 consecutive EPSPs. The part of initial onset and peak of EPSPs is shown in the upper, right at the expanded time scale. Bottom, time course of the mean EPSP slopes of 11 control cells and eight BAPTA-filled cells. The value was normalized to that before TBS. Other conventions are the same as those in Figure 1D.
LTP of excitatory synapses on FS-GABA neurons is NMDAR independent
In excitatory synapses on pyramidal cells in the visual cortex, it is well known that an increase in postsynaptic Ca2+ through activated NMDAR channels is necessary to induce LTP (Artola and Singer, 1987; Kimura et al., 1989). As mentioned above, the postsynaptic Ca2+ elevation may be necessary for the induction of LTP at excitatory synapses on FS-GABA neurons. Thus, we examined whether the activation of NMDAR is also necessary for the induction of LTP of excitatory synapses on FS-GABA neurons, using an antagonist for NMDAR, APV. As shown in Figure 6A, APV did not significantly reduce the magnitude of LTP of excitatory synapses on FS-GABA neurons. The mean ratio of EPSP slope 20–25 min after TBS to that before TBS was 1.37 ± 0.09 (n = 14) with APV whereas it was 1.50 ± 0.11 (n = 11) without APV. The difference between these two values was not significant (p > 0.1, unpaired t test). This result indicated that LTP of excitatory synapses on FS-GABA neurons may be NMDAR independent.
Figure 6.

LTP of EPSPs of FS-GABA neurons is not dependent on the activation of NMDAR, whereas that of pyramidal neurons is dependent. A, Time courses of the mean EPSP slopes of 11 control FS-GABA neurons and 14 FS-GABA neurons to which APV (100 μm) was applied. The slope value was normalized to the pre-TBS value. Other conventions are the same as Figure 1D. B, Time courses of the mean EPSP slopes of 8 control pyramidal cells and another eight pyramidal cells to which APV (100 μm) was applied. Other conventions are the same as those in A.
To test the possibility that APV might not effectively block NMDAR in the present preparations, we recorded EPSPs from pyramidal cells and applied TBS paired with postsynaptic depolarization with the same parameters as that for FS-GABA neurons. As shown in Figure 6B, LTP was not induced in pyramidal cells when APV was applied. The mean ratio of EPSP slope 20–25 min after TBS to that before TBS was 1.53 ± 0.09 (n = 8) without APV whereas it was 1.02 ± 0.05 (n = 8) with APV. The difference between these two values was significant (p < 0.001, unpaired t test).
LTP of excitatory synapses on FS-GABA neurons is not dependent on voltage-gated Ca2+ channels of L and T types
As mentioned in the Introduction, there are some reports suggesting that different types of voltage-gated Ca2+ channels are involved in the induction and maintenance of NMDAR-independent LTP of excitatory synapses on pyramidal cells in the visual cortex. This raises the following questions: are voltage-gated Ca2+ channels involved in LTP of excitatory synapses on FS-GABA neurons? If so, what types of channels are involved? To address these questions, we applied nimodipine at 10 μm as a blocker for the L type of channels (Castillo et al., 1994; Kapur et al., 1998), and NiCl2 at 100 μm as a blocker for the T type of channels (Fox et al., 1987; Komatsu and Iwakiri, 1992). Because this concentration of Ni2+ might not selectively block the T type of channels, we also used mibefradil dihydrochloride at 100 μm (Martin et al., 2000; Cui et al., 2004) as another blocker for T type channels. We did not systematically examine blockers for the N and P/Q types of Ca2+ channels, because these channels are reported to operate primarily in presynaptic sites (Wu and Saggau, 1994; Qian and Noebels, 2001) and, thus, the application of blockers for these channels are expected to block synaptic transmission itself.
Initially we observed that an application of nimodipine slightly depressed EPSPs in all of the cells tested. The application of NiCl2 and mibefradil also depressed EPSPs in a half of the cells tested. In such a case the intensity of test stimulation was increased so that the amplitude and slope of EPSPs were adjusted to attain the initial values (supplemental Fig. 3B, available at www.jneurosci.org as supplemental material). Then we applied TBS paired with postsynaptic depolarization. As shown in Figure 7A, the application of nimodipine did not significantly reduce the magnitude of LTP of excitatory synapses on FS-GABA neurons. The mean ratios of EPSP slopes 20–25 min after TBS to those before TBS were 1.50 ± 0.10 in the control (n = 7) and 1.58 ± 0.16 with nimodipine (n = 11). The difference between these two values was not significant (p > 0.1, unpaired t test). Also, neither NiCl2 nor mibefradil significantly reduced the magnitude of LTP of excitatory synapses on FS-GABA neurons (Fig. 7A). The mean ratios of EPSP slopes 20–25 min after TBS to those before TBS were 1.56 ± 0.22 in the control for NiCl2 (n = 6), 1.58 ± 0.12 with NiCl2 (n = 9), 1.56 ± 0.17 in the control for mibefradil (n = 8), and 1.51 ± 0.15 with mibefradil (n = 9). In either test the difference was statistically insignificant (p > 0.1, unpaired t test). These results indicate that LTP of excitatory synapses on FS-GABA neurons may not be dependent on the activation of the L- and T-types of voltage-gated Ca2+ channels.
Figure 7.

LTP of excitatory synapses on FS-GABA neurons is dependent on mGluR5, but not on voltage-gated Ca2+ channels of L- and T-types. A, Blockers for the L- and T-types of voltage-gated Ca2+ channels did not affect LTP of excitatory synapses on FS-GABA neurons. Each column shows the mean EPSP slope of control neurons (open columns) and neurons to which indicated blockers were applied (hatched columns). The number of cells for each group is shown at the top. The value 20–25 min after TBS was normalized to the pre-TBS value. The concentrations of nimodipine, NiCl2 and mibefradil were 10, 100 and 100 μm, respectively. B, An antagonist for mGluR5 (MPEP) (10 μm) blocked LTP, whereas an antagonist for mGluR1 (LY367385) (100 μm) did not block LTP of excitatory synapses on FS-GABA neurons. Significant difference, ***p < 0.001 (unpaired t test).
LTP of excitatory synapses on FS-GABA neurons is mGluR5 dependent, but not mGluR1 dependent
The results that neither NMDAR nor L and T types of Ca2+ channels were involved in LTP of excitatory synapses on FS-GABA neurons suggest that mGluRs may play a role in this type of LTP. In fact, a bath application of a selective antagonist for the type 5 of mGluRs, MPEP at 10 μm (Blaabjerg et al., 2001), blocked LTP of excitatory synapses on FS-GABA neurons (Fig. 7B, left two columns). The mean ratios of EPSP slope 20–25 min after TBS to those before TBS were 1.05 ± 0.05 with MPEP (n = 13) and 1.58 ± 0.10 with vehicle alone (n = 10). The difference between these two values was statistically significant (p < 0.001, unpaired t test). However, a selective antagonist for the type 1 of mGluRs, LY367385 at 100 μm (Wang and Daw, 2003) did not significantly block LTP of excitatory synapses on FS-GABA neurons (Fig. 7B, right two columns). The mean ratios of EPSP slopes were 1.53 ± 0.06 with LY367385 (n = 10) and 1.49 ± 0.12 with DMSO alone (n = 9). The difference between these two values was not significant (p > 0.1, unpaired t test). These results indicate that LTP of excitatory synapses on FS-GABA neurons may be mGluR5 dependent, but not mGluR1 dependent.
An agonist for mGluR1/5 induces potentiation of EPSPs of FS-GABA neurons in a concentration-dependent manner
Then we tested whether an activation of mGluR5 potentiates EPSPs of FS-GABA neurons in an LTP-like manner. For this we used DHPG, a potent agonist for group I mGluRs (both mGluR1 and mGluR5) (Ito et al., 1992). As shown in Figure 8A, DHPG at 100 μm markedly enhanced EPSPs and this enhancement remained 35 min after washout of DHPG. The mean ratio of EPSP slope 20–25 min after washout to that before the DHPG application was 1.73 ± 0.16 (n = 7). Such an enhancing action of DHPG on EPSPs of FS-GABA neurons was concentration dependent (Fig. 8B). DHPG was not effective at the concentration of 25 μm, and became weakly effective at 50 μm and fully effective at 100 μm. In the subsequent experiments, therefore, we used DHPG at 100 μm. Then we applied DHPG together with LY367385, because there is the possibility that DHPG activates mGluR1 as well as mGluR5. We found that the additional application of this selective antagonist for mGluR1 did not significantly affect the enhancing action of DHPG (supplemental Fig. 3C, available at www.jneurosci.org as supplemental material). This suggests that the enhancement of EPSPs of FS-GABA neurons by DHPG is mainly induced through its action on mGluR5 in the mouse visual cortex.
Figure 8.

An agonist for mGluR1/5 induces LTP-like potentiation of EPSPs of FS-GABA neurons in a concentration-dependent manner. A, Time courses of EPSP slope of 7 FS-GABA and 8 pyramidal neurons after application of DHPG. At the top are shown superimposed traces of EPSPs of a FS-GABA neuron (left) and a pyramidal neuron (right) at the time point indicated in the bottom graph with the same letter. Each trace is an average of 15 consecutive EPSPs. The part of initial onset and peak of EPSPs is shown in the top right at the expanded time scale. B, four open columns indicate the mean EPSP slope 20–25 min after washout of DHPG in FS-GABA cells for each DHPG concentration, and a filled column at the right indicates the mean EPSP slope 20–25 min after washout of DHPG in pyramidal cells. The value after washout of DHPG was normalized to the preapplication value. The number of cells for each group is shown at the top of each column.
In contrast to FS-GABA neurons, EPSPs of pyramidal cells were not sensitive to DHPG (Fig. 8A). The application of DHPG did not detectably change EPSPs of pyramidal cells, and the mean ratio of the EPSP slope of eight pyramidal cells 20–25 min after washout to that before the DHPG application was 1.02 ± 0.06 (Fig. 8B, rightmost column). This result confirmed the previous observations that mGluRs are not directly involved in LTP of EPSPs of pyramidal cells in the visual cortex.
Activation of mGluRs with synaptic inputs may be sufficient to induce LTP of EPSPs of FS-GABA neurons
To answer the question of whether an activation of mGluRs with synaptic inputs is sufficient to induce LTP of excitatory synapses on FS-GABA neurons, we performed the occlusion test. As shown in Figure 9A, DHPG (100 μm), which was applied 20 min after the induction of LTP by TBS, did not further enhance EPSPs. There was no significant (p > 0.1, unpaired t test) difference between the two groups 10 min after washout of DHPG (in TBS only, 1.79 ± 0.11, n = 14, and in TBS plus DHPG, 1.69 ± 0.14, n = 8). Also, TBS which was applied 15 min after washout of DHPG did not induce LTP (Fig. 9B). Again there was no significant difference (p > 0.1, unpaired t test) between the two groups 10 min after TBS application (in DHPG only, 1.70 ± 0.24, n = 7, and in DHPG plus TBS, 1.77 ± 0.08, n = 9). These results indicate that TBS-induced LTP and DHPG-induced potentiation of EPSPs occluded each other, and the activation of mGluRs may be sufficient for the induction of LTP of excitatory synapses on FS-GABA neurons.
Figure 9.

Activation of mGluR1/5 and TBS occludes each other. A, Time courses of EPSP slopes of 14 FS-GABA neurons to which TBS alone was given and 8 FS-GABA neurons to which DHPG (100 μm) was applied 20 min after TBS. Other conventions are the same as those in Figure 1D. B, Time courses of EPSP slopes of 7 FS-GABA neurons to which DHPG (100 μm) alone was given and nine FS-GABA neurons to which TBS was applied 15 min after washout of DHPG. Other conventions are the same as those in Figure 1D. C, Time courses of EPSP slopes of eight FS-GABA neurons to which DHPG (100 μm) was applied while test stimulation at 0.05 Hz was continued and seven FS-GABA neurons to which DHPG was applied without any test stimulation. Other conventions are the same as those in Figure 1D.
Then, we addressed another question of whether the enhancing effect of DHPG is synaptic input dependent. To address this question, test stimulation was not given during the application of DHPG (Fig. 9C). FS-GABA neurons in the control group received baseline stimulation at 0.05 Hz during the application of DHPG. As shown in Figure 9C, the EPSP slopes after DHPG application were not potentiated when baseline stimulation was stopped, whereas they were clearly enhanced when baseline stimulation was given continuously. The mean ratios of EPSP slope 20 min after washout of DHPG was 1.03 ± 0.15 (n = 7) without baseline stimulation and 1.60 ± 0.14 (n = 8) with baseline stimulation during the DHPG application. The difference between these two values was significant (p < 0.01, unpaired t test).
Involvement of the PLC-IP3 system in LTP of excitatory synapses on FS-GABA neurons
We then addressed the question of what intracellular signaling pathways are involved in mGluR5-mediated LTP of excitatory synapses on FS-GABA neurons in the visual cortex. To address this question we initially applied an inhibitor for PLC, U-73122 at 10 μm (Choi et al., 2005). We found that this inhibitor blocked LTP of EPSPs of FS-GABA neurons, but not that of pyramidal cells (Fig. 10, left four columns). The mean ratios of EPSP slope 20–25 min after TBS to those before TBS were 1.01 ± 0.15 with U-73122 (n = 7) and 1.48 ± 0.10 without U-73122 (n = 9) in FS-GABA neurons. The difference between these two values was significant (p < 0.05, unpaired t test). In pyramidal cells, however, this inhibitor was not effective. The values with and without U-73122 were 1.61 ± 0.16 (n = 7) and 1.66 ± 0.21 (n = 7), respectively. The difference was not significant (p > 0.1, unpaired t test).
Figure 10.

Involvement of the system of PLC, IP3, and Ca2+ release from internal stores in LTP of excitatory synapses on FS-GABA neurons. Inhibitors for PLC (U-73122), for IP3 (2-APB and heparin), and for Ca2+ release from internal stores (CPA) blocked LTP of excitatory synapses on FS-GABA neurons, but the inhibitor for PLC failed to block LTP of excitatory synapses on pyramidal cells. The concentrations of U-73122, 2-APB, heparin and CPA were 10 μm, 3 μm, 10 U/ml, and 5 μm, respectively. Each column shows the mean EPSP slope of control neurons (open columns) and neurons to which indicated inhibitors were applied (hatched columns). The number of cells for each group is shown at the top. The value 20–25 min after TBS was normalized to the pre-TBS value. Significant difference, *p < 0.05 and **p < 0.01 (unpaired t test).
Then we used IP3 inhibitors, 2-APB (Maruyama et al., 1997) and heparin (Nilsson et al., 1988), to address the question of whether IP3 produced by the activation of PLC is involved in LTP of excitatory synapses on FS-GABA neurons. For this we loaded these inhibitors into postsynaptic neurons through recording pipettes, and found that both inhibitors blocked LTP. In case of 2-APB, DMSO was added to the internal solution as vehicle. As shown in Figure 10 (fifth column from the left), DMSO had no effect on LTP. The mean ratio of EPSP slope 20–25 min after the application of TBS to the pre-TBS value was 1.48 ± 0.12 (n = 8) with DMSO, and this value was not significantly (p > 0.1, unpaired t test) different from that of control for U-73122. With 2-APB the mean ratio of EPSP slope was 0.87 ± 0.06 (n = 7), which was significantly (p < 0.01, unpaired t test) smaller than that with DMSO alone. The intracellular loading of heparin also blocked the induction of LTP. The mean ratio of EPSP slope after TBS application to the pre-TBS value with heparin was 0.95 ± 0.11 (n = 7), which was significantly (p < 0.01, unpaired t test) smaller than that with the vehicle alone (1.48 ± 0.10). Finally, we applied CPA, an inhibitor of Ca2+ release from internal stores (Garaschuk et al., 1997). The bath application of CPA at 5 μm blocked LTP of EPSPs of FS-GABA neurons, but the application of the vehicle alone had no effect. The mean ratios of EPSP slope after TBS to those before TBS were 1.05 ± 0.09 with CPA (n = 9) and 1.52 ± 0.11 with vehicle (n = 9). The difference between these two values was significant (p < 0.01, unpaired t test). These results indicate that mGluR5-dependent LTP is induced through the pathway of PLC, IP3, and Ca2+ release from internal stores.
Discussion
The main findings in the present study are as follows: (1) LTP of excitatory synapses on FS-GABA neurons in layer II/III of the visual cortex was induced by TBS of layer IV in most cases, whereas significant LTP was not induced at most excitatory synapses on non-FS-GABA neurons. (2) LTP of excitatory synapses on FS-GABA neurons was not age dependent after eye opening. (3) This form of LTP was neither dependent on NMDARs nor on voltage-gated Ca2+ channels of L and T types, which are involved in the other form of LTP of excitatory synapses on pyramidal neurons in the cortex. 4. LTP at FS-GABA neurons was induced mainly through mGluR5, which triggers a Ca2+ release from internal stores via the activation of PLC and IP3.
Types of GABAergic neurons and LTP at fast-spiking cells
In layer II/III of the rat visual cortex it was reported that subtypes of inhibitory interneurons receive excitatory afferent inputs from different sources: FS basket cells receive strong excitatory inputs from layer IV, whereas non-FS inhibitory interneurons receive their strongest inputs from deep layers or laterally from within layer II/III (Dantzker and Callaway, 2000). In the somatosensory cortex it was also reported that there is a difference in sources of excitatory inputs between the FS and non-FS types of inhibitory interneurons (Beierlein et al., 2003). Thus, the difference in the probability for TBS of layer IV to induce LTP between the FS- and non-FS-GABA neurons in the present study may be accounted for by the difference in sources of excitatory inputs between the two types of GABAergic neurons in layer II/III of the mouse visual cortex. The relatively low probability for non-FS-GABA neurons to show significant LTP may be ascribable to the low modifiability of excitatory synapses on this type of GABAergic neurons.
It was suggested that different subgroups of GABAergic neurons play a specialized functional role in cortical neuronal circuits. For example, FS basket cells, which have axons spreading horizontally within layer II/III of the cortex and terminating predominantly on the somata and proximal dendrites of pyramidal neurons effectively inhibit these neighboring pyramidal neurons in layer II/III when activated from layer IV (Kisvarday et al., 1985; Somogyi et al., 1996; Tamas and Somogyi, 1998; Gibson et al., 1999; Dantzker and Callaway, 2000). In contrast, non-FS inhibitory interneurons in layer II/III of the cortex predominantly target other inhibitory interneurons in the same layer (Meskenaite, 1997; Gonchar and Burkhalter, 1999) and they may play a role in blockade of inhibitory circuits. In particular, it is suggested that PV-positive, FS basket cell control synchronized outputs of cortical principal cells because of the specific innervation pattern on pyramidal cell bodies (Cobb et al., 1995; Kawaguchi and Kubota, 1997) or the interconnectivity between those GABAergic neurons through electrical and chemical synapses (Galarreta and Hestrin, 2002). Thus, LTP of excitatory synapses on FS-GABA neurons and subsequent potentiation of activity of these cells may play a role in enhancement or maintenance of synchronized activity of cortical pyramidal neurons (Kawaguchi, 2001; Freund, 2003), although inhibitory synapses between GABAergic neurons may also contribute to such synchronization.
Associative induction and expression site of LTP
It was reported previously that LTP of excitatory synapses on interneurons in the stratum oriens/alveus of the rat hippocampus was not induced by high-frequency stimulation (HFS) paired with postsynaptic depolarization, but induced by unpaired HFS (Lamsa et al., 2007). It was reported, however, that LTP at excitatory synapses on basket cells in the dentate gyrus (Alle et al., 2001) and on interneurons in the stratum oriens/alveus or radiatum of the rat hippocampus (Perez et al., 2001; Topolnik et al., 2006) was induced by paired HFS. The present results in the mouse visual cortex seem consistent with the latter three reports. The inconsistency with the former report may be caused by the difference in the brain regions or types of GABAergic neurons.
Regarding expression sites of LTP of excitatory synapses on inhibitory interneurons, the previous studies in the hippocampus reported the presynaptic expression of LTP (Alle et al., 2001; Perez et al., 2001; Topolnik et al., 2006), although another study reported no change in the paired-pulse ratio of EPSPs of stratum radiatum interneurons, implicating the postsynaptic expression (Lamsa et al., 2005). The present study suggests, for the first time in the visual cortex, that LTP of excitatory synapses on FS-GABA neurons in layer II/III of the cortex may be mainly postsynaptic in origin. The difference from the above-mentioned three reports in the hippocampus may be ascribable to the regional difference.
Distribution of mGluR5 in visual cortex
The present results suggest that LTP of excitatory synapses on FS-GABA neurons is induced mostly through the activation of postsynaptic mGluR5. Previous immunohistochemical studies indeed reported that the intense expression of mGluR5 was seen in telencephalic regions including the visual cortex of the rat (Shigemoto et al., 1993; Romano et al., 1995). In a study using the in situ hybridization technique, it was reported that mGluR5 signals were intensely labeled in some GABAergic neurons such as PV-positive cells in the neocortex (Kerner et al., 1997). This is consistent with the present results that mGluR5-mediated LTP was induced primarily in FS-GABA neurons, which were mostly PV positive.
However, we cannot exclude the possibility that voltage-gated Ca2+ channels other than L and T types, such as N and/or P/Q types, are involved, because blockers for these channels abolish synaptic transmission itself and thus could not be tested in the present study. It was reported that the P/Q types of voltage-gated Ca2+ channels were expressed in the somatodendritic region of cultured cortical GABAergic neurons (Timmermann et al., 2002). Thus, it seems possible to take the necessity of postsynaptic depolarization associated with TBS as suggesting that these types of voltage-gated Ca2+ channels may be involved in part in LTP of EPSPs of FS-GABA neurons.
mGluR5-mediated type of LTP
The contribution of NMDA receptors to LTP of excitatory synapses on pyramidal cells in the visual cortex is controversial. In recordings of cortical field potentials, which mostly reflect summed EPSPs of many pyramidal neurons, and of single-cell EPSPs of layer II/III neurons, it was reported that neocortical LTP was dependent on the activation of NMDA receptors (Artola and Singer, 1987, Kimura et al., 1989, Kirkwood et al., 1993, Wang and Daw, 2003), whereas it was also reported that NMDAR-independent form of LTP was induced by repetitive stimulation of the white matter at 2 Hz for 15 min in kitten and rat visual cortex (Komatsu et al., 1991; Ohmura et al., 2003; Yoshimura et al., 2003; Liu et al., 2004). Regarding excitatory synapses on GABAergic neurons, however, there was no systematic study on LTP in visual cortex.
The present finding that the selective antagonist for mGluR5, MPEP, blocked the induction of LTP of excitatory synapses on FS-GABA neurons suggests that this form of LTP in layer II/III of the mouse visual cortex is induced through an activation of mGluR5. Also we found that a potent agonist for mGluR1/5, DHPG, enhanced EPSPs probably through an activation of mGluR5, and this enhancement of EPSPs and TBS-induced LTP occluded each other. Together it seems reasonable to conclude that LTP of excitatory synapses on FS-GABA neurons in layer II/III of the mouse visual cortex is mediated mainly through an activation of mGluR5. In the rat hippocampus, Topolnik et al. (2006) reported that the activation of mGluR1/5 and subsequent Ca2+ signaling pathways play a role in LTP of excitatory synapses at interneurons. In the mouse visual cortex, we further identified that mGluR5, not mGluR1, plays a role in the activation of Ca2+ signaling pathways such as PLC, IP3 and Ca2+ release from internal stores.
Age independence of LTP of excitatory synapses on FS-GABA neurons
The present data showed that LTP of excitatory synapses on FS-GABA neurons was not age dependent after eye opening. In visual cortical slices of rats it was reported that LTP of layer II/III field potentials evoked by layer IV stimulation was induced after the critical period to the adulthood with no significant changes, although responses evoked by white matter stimulation were age dependent (Kirkwood et al., 1995). Subsequently, however, it was reported that LTP of layer IV stimulation-evoked EPSPs of layer II/III pyramidal cells in the rat visual cortex was age dependent and thus not induced in the adult (Yoshimura et al., 2003). More recently it was reported that LTP in the rat visual cortex had laminar-specific critical periods: LTP of excitatory synaptic responses of layer II/III to stimulation of layer IV appeared relatively late during postnatal development; its magnitude peaked by P21 and robust LTP still remained at 6 weeks of postnatal age (Jiang et al., 2007). The present results also showed that LTP of excitatory synapses on FS-GABA neurons in layer II/III of the visual cortex remained at almost the same level after the age of eye opening to P43, suggesting that this form of LTP may be involved in information processing or experience-dependent modification of neuronal circuits in both immature and mature visual cortices.
Footnotes
This work was supported in part by a Grant-in-Aid for Scientific Research from the Japan Society for the Promotion of Science to T.T.
References
- Alle H, Jonas P, Geiger JR. PTP and LTP at a hippocampal mossy fiber-interneuron synapse. Proc Natl Acad Sci USA. 2001;98:14708–14713. doi: 10.1073/pnas.251610898. [DOI] [PMC free article] [PubMed] [Google Scholar]
- Artola A, Singer W. Long-term potentiation and NMDA receptors in rat visual cortex. Nature. 1987;330:649–652. doi: 10.1038/330649a0. [DOI] [PubMed] [Google Scholar]
- Bear MF. Bidirectional synaptic plasticity: from theory to reality. Philos Trans R Soc Lond B Biol Sci. 2003;358:649–655. doi: 10.1098/rstb.2002.1255. [DOI] [PMC free article] [PubMed] [Google Scholar]
- Bear MF, Press WA, Connors BW. Long-term potentiation in slices of kitten visual cortex and the effects of NMDA receptor blockade. J Neurophysiol. 1992;67:841–851. doi: 10.1152/jn.1992.67.4.841. [DOI] [PubMed] [Google Scholar]
- Beierlein M, Gibson JR, Connors BW. Two dynamically distinct inhibitory networks in layer 4 of the neocortex. J Neurophysiol. 2003;90:2987–3000. doi: 10.1152/jn.00283.2003. [DOI] [PubMed] [Google Scholar]
- Blaabjerg M, Kristensen BW, Bonde C, Zimmer J. The metabotropic glutamate receptor agonist 1S,3R-ACPD stimulates and modulates NMDA receptor mediated excitotoxixity in organotypic hippocampal slice cultures. Brain Res. 2001;898:91–104. doi: 10.1016/s0006-8993(01)02148-5. [DOI] [PubMed] [Google Scholar]
- Castillo PE, Weisskopf MG, Nicoll RA. The role of Ca2+ channels in hippocampal mossy fiber synaptic transmission and long-term potentiation. Neuron. 1994;12:261–269. doi: 10.1016/0896-6273(94)90269-0. [DOI] [PubMed] [Google Scholar]
- Choi SY, Chang J, Jiang B, Seol GH, Min SS, Han JS, Shin HS, Gallagher M, Kirkwood A. Multiple receptors coupled to phospholipase C gate long-term depression in visual cortex. J Neurosci. 2005;25:11433–11443. doi: 10.1523/JNEUROSCI.4084-05.2005. [DOI] [PMC free article] [PubMed] [Google Scholar]
- Cobb SR, Buhl EH, Halasy K, Paulsen O, Somogyi P. Synchronization of neuronal activity in hippocampus by individual GABAergic interneurons. Nature. 1995;378:75–78. doi: 10.1038/378075a0. [DOI] [PubMed] [Google Scholar]
- Cui G, Okamoto T, Morikawa H. Spontaneous opening of T-type Ca2+ channels contributes to the irregular firing of dopamine neurons in neonatal rats. J Neurosci. 2004;24:11079–11087. doi: 10.1523/JNEUROSCI.2713-04.2004. [DOI] [PMC free article] [PubMed] [Google Scholar]
- Dantzker JL, Callaway EM. Laminar sources of synaptic input to cortical inhibitory interneurons and pyramidal neurons. Nat Neurosci. 2000;3:701–707. doi: 10.1038/76656. [DOI] [PubMed] [Google Scholar]
- Faber DS, Korn H. Applicability of the coefficient of variation method for analyzing synaptic plasticity. Biophys J. 1991;60:1288–1294. doi: 10.1016/S0006-3495(91)82162-2. [DOI] [PMC free article] [PubMed] [Google Scholar]
- Fox AP, Nowycky MC, Tsien RW. Kinetics and pharmacological properties distinguishing three types of calcium currents in chick sensory neurons. J Physiol (Lond) 1987;394:149–172. doi: 10.1113/jphysiol.1987.sp016864. [DOI] [PMC free article] [PubMed] [Google Scholar]
- Freund TF. Interneuron diversity series: rhythm and mood in perisomatic inhibition. Trends Neurosci. 2003;26:489–495. doi: 10.1016/S0166-2236(03)00227-3. [DOI] [PubMed] [Google Scholar]
- Garaschuk O, Yaari Y, Konnerth A. Release and sequestration of calcium by ryanodine-sensitive stores in rat hippocampal neurons. J Physiol (Lond) 1997;502:13–30. doi: 10.1111/j.1469-7793.1997.013bl.x. [DOI] [PMC free article] [PubMed] [Google Scholar]
- Galarreta M, Hestrin S. Electrical and chemical synapses among parvalbumin fast-spiking GABAergic interneurons in adult mouse neocortex. Proc Natl Acad Sci USA. 2002;99:12438–12443. doi: 10.1073/pnas.192159599. [DOI] [PMC free article] [PubMed] [Google Scholar]
- Geiger JRP, Lubke J, Roth A, Frotscher M, Jonas P. Submillisecond AMPA receptor-mediated signaling at a principal neuron-interneuron synapse. Neuron. 1997;18:1009–1023. doi: 10.1016/s0896-6273(00)80339-6. [DOI] [PubMed] [Google Scholar]
- Gibson JR, Beierlein M, Connors BW. Two networks of electrically coupled inhibitory neurons in neocortex. Nature. 1999;402:75–79. doi: 10.1038/47035. [DOI] [PubMed] [Google Scholar]
- Gonchar Y, Burkhalter A. Three distinct families of GABAergic neurons in rat visual cortex. Cereb Cortex. 1997;7:347–358. doi: 10.1093/cercor/7.4.347. [DOI] [PubMed] [Google Scholar]
- Gonchar Y, Burkhalter A. Connectivity of GABAergic calretinin-immunoreactive neurons in rat primary visual cortex. Cereb Cortex. 1999;9:683–696. doi: 10.1093/cercor/9.7.683. [DOI] [PubMed] [Google Scholar]
- Grover LM, Teyler TJ. Two components of long-term potentiation induced by different patterns of afferent activation. Nature. 1990;347:477–479. doi: 10.1038/347477a0. [DOI] [PubMed] [Google Scholar]
- Hensch TK. Critical period plasticity in local cortical circuits. Nat Rev Neurosci. 2005;6:877–888. doi: 10.1038/nrn1787. [DOI] [PubMed] [Google Scholar]
- Holmgren CD, Zilberter Y. Coincident spiking activity induces long-term changes in inhibition of neocortical pyramidal cells. J Neurosci. 2001;21:8270–8277. doi: 10.1523/JNEUROSCI.21-20-08270.2001. [DOI] [PMC free article] [PubMed] [Google Scholar]
- Huemmeke M, Eysel UT, Mittmann T. Metabotropic glutamate receptors mediate expression of LTP in slices of rat visual cortex. Eur J Neurosci. 2002;15:1641–1645. doi: 10.1046/j.1460-9568.2002.02002.x. [DOI] [PubMed] [Google Scholar]
- Ito I, Kohda A, Tanabe S, Hirose E, Hayashi M, Mitsunaga S, Sugiyama H. 3,5-Dihydroxyphenylglycine: a potent agonist of metabotropic glutamate receptors. NeuroReport. 1992;3:1013–1016. [PubMed] [Google Scholar]
- Jiang B, Kitamura A, Yasuda H, Sohya K, Maruyama A, Yanagawa Y, Obata K, Tsumoto T. Brain-derived neurotrophic factor acutely depresses excitatory synaptic transmission to GABAergic neurons in visual cortical slices. Eur J Neurosci. 2004;20:709–718. doi: 10.1111/j.1460-9568.2004.03523.x. [DOI] [PubMed] [Google Scholar]
- Jiang B, Trevino M, Kirkwood A. Sequential development of long-term potentiation and depression in different layers of the mouse visual cortex. J Neurosci. 2007;27:9648–9652. doi: 10.1523/JNEUROSCI.2655-07.2007. [DOI] [PMC free article] [PubMed] [Google Scholar]
- Kapur A, Yeckel MF, Gray R, Johnston D. L-type calcium channels are required for one form of hippocampal mossy fiber LTP. J Neurophysiol. 1998;79:2181–2190. doi: 10.1152/jn.1998.79.4.2181. [DOI] [PMC free article] [PubMed] [Google Scholar]
- Kawaguchi Y. Distinct firing patterns of neuronal subtypes in cortical synchronized activities. J Neurosci. 2001;21:7261–7272. doi: 10.1523/JNEUROSCI.21-18-07261.2001. [DOI] [PMC free article] [PubMed] [Google Scholar]
- Kawaguchi Y, Kubota Y. GABAergic cell subtypes and their synaptic connections in rat frontal cortex. Cereb Cortex. 1997;7:476–486. doi: 10.1093/cercor/7.6.476. [DOI] [PubMed] [Google Scholar]
- Kerner JA, Standaert DG, Penney JB, Jr, Young AB, Landwehrmeyer GB. Expression of group one metabotropic glutamate receptor subunit mRNAs in neurochemically identified neurons in the rat neostriatum, neocortex, and hippocampus. Mol Brain Res. 1997;48:259–269. doi: 10.1016/s0169-328x(97)00102-2. [DOI] [PubMed] [Google Scholar]
- Kimura F, Nishigori A, Shirokawa T, Tsumoto T. Long-term potentiation and N-methyl-D-aspartate receptors in the visual cortex of young rats. J Physiol (Lond) 1989;414:125–144. doi: 10.1113/jphysiol.1989.sp017680. [DOI] [PMC free article] [PubMed] [Google Scholar]
- Kirkwood A, Dudek SM, Gold JT, Aizenman CD, Bear MF. Common forms of synaptic plasticity in the hippocampus and neocortex in vitro. Science. 1993;260:1518–1521. doi: 10.1126/science.8502997. [DOI] [PubMed] [Google Scholar]
- Kirkwood A, Lee HK, Bear MF. Co-regulation of long-term potentiation and experience-dependent synaptic plasticity in visual cortex by age and experience. Nature. 1995;375:328–331. doi: 10.1038/375328a0. [DOI] [PubMed] [Google Scholar]
- Kisvarday ZF, Martin KA, Whitteridge D, Somogyi P. Synaptic connections of intracellularly filled clutch cells: a type of small basket cell in the visual cortex of the cat. J Comp Neurol. 1985;241:111–137. doi: 10.1002/cne.902410202. [DOI] [PubMed] [Google Scholar]
- Komatsu Y, Iwakiri C. Low-threshold Ca2+ channels mediate induction of long-term potentiation in kitten visual cortex. J Neurophysiol. 1992;67:401–410. doi: 10.1152/jn.1992.67.2.401. [DOI] [PubMed] [Google Scholar]
- Komatsu Y, Iwakiri C. Long term modification of inhibitory synaptic transmission in developing visual cortex. Neuroreport. 1993;4:907–910. doi: 10.1097/00001756-199307000-00017. [DOI] [PubMed] [Google Scholar]
- Komatsu Y, Nakajima S, Toyama K. Induction of long-term potentiation without participation of N-methyl-d-aspartate receptors in kitten visual cortex. J Neurophysiol. 1991;65:20–32. doi: 10.1152/jn.1991.65.1.20. [DOI] [PubMed] [Google Scholar]
- Lamsa K, Heeroma JH, Kullmann DM. Hebbian LTP in feed-forward inhibitory interneurons and the temporal fidelity of input discrimination. Nat Neurosci. 2005;8:916–924. doi: 10.1038/nn1486. [DOI] [PubMed] [Google Scholar]
- Lamsa KP, Heeroma JH, Somogyi P, Rusakov DA, Kullmann DM. Anti-Hebbian long-term potentiation in the hippocampal feedback inhibitory circuit. Science. 2007;315:1262–1266. doi: 10.1126/science.1137450. [DOI] [PMC free article] [PubMed] [Google Scholar]
- Liu HN, Kurotani T, Ren M, Yamada K, Yoshimura Y, Komatsu Y. Presynaptic activity and Ca2+ entry are required for the maintenance of NMDA receptor-independent LTP at visual cortical excitatory synapses. J Neurophysiol. 2004;92:1077–1087. doi: 10.1152/jn.00602.2003. [DOI] [PubMed] [Google Scholar]
- Maffei A, Nataraj K, Nelson SB, Turrigiano GG. Potentiation of cortical inhibition by visual deprivation. Nature. 2006;443:81–84. doi: 10.1038/nature05079. [DOI] [PubMed] [Google Scholar]
- Markram H, Toledo-Rodrigues M, Wang Y, Gupta A, Silberberg G, Wu C. Interneurons of the neocortical inhibitory system. Nat Rev Neurosci. 2004;5:793–807. doi: 10.1038/nrn1519. [DOI] [PubMed] [Google Scholar]
- Martin RL, Lee J-H, Cribbs LL, Perez-Reyes E, Hanck DA. Mibefradil block of cloned T-type calcium channels. J Pharmcol Exp Med. 2000;295:302–308. [PubMed] [Google Scholar]
- Maruyama T, Kanaji T, Nakade S, Kanno T, Mikoshiba K. 2APB, 2-aminoethoxy diphenyl borate, a membrane permeable modulator of Ins (1,4,5) P3-induced Ca2+ release. J Biochem. 1997;122:498–505. doi: 10.1093/oxfordjournals.jbchem.a021780. [DOI] [PubMed] [Google Scholar]
- Meinecke DL, Peters A. GABA immunoreactive neurons in rat visual cortex. J Comp Neurol. 1987;261:388–404. doi: 10.1002/cne.902610305. [DOI] [PubMed] [Google Scholar]
- Meskenaite V. Calretinin-immunoreactive local circuit neurons in area 17 of the cynomolgus monkey, Macaca fascicularis. J Comp Neurol. 1997;379:113–132. [PubMed] [Google Scholar]
- Nilsson T, Zwiller J, Boynton AL, Berggren PO. Heparin inhibits IP3-induced Ca2+ release in permeabilized pancreatic beta-cells. FEBS Lett. 1988;229:211–214. doi: 10.1016/0014-5793(88)80829-9. [DOI] [PubMed] [Google Scholar]
- Ohmura T, Ming R, Yoshimura Y, Komatsu Y. Age and experience dependence of N-methyl-d-aspartate receptor-independent long-term potentiation in rat visual cortex. Neurosci Lett. 2003;341:95–98. doi: 10.1016/s0304-3940(03)00170-8. [DOI] [PubMed] [Google Scholar]
- Perez Y, Morin F, Lacaille JC. A Hebbian form of long-term potentiation dependent on mGluR1a in hippocampal inhibitory interneurons. Proc Natl Acad Sci USA. 2001;98:9401–9406. doi: 10.1073/pnas.161493498. [DOI] [PMC free article] [PubMed] [Google Scholar]
- Qian J, Noebels JL. Presynaptic Ca2+ channels and neurotransmitter release at the terminal of a mouse cortical neuron. J Neurosci. 2001;21:3721–3728. doi: 10.1523/JNEUROSCI.21-11-03721.2001. [DOI] [PMC free article] [PubMed] [Google Scholar]
- Ren JQ, Aika Y, Heizmann CW, Kosaka T. Quantitative analysis of neurons and glial cells in the rat somatosensory cortex, with special reference to GABAergic neurons and parvalbumin-containing neurons. Exp Brain Res. 1992;92:1–14. doi: 10.1007/BF00230378. [DOI] [PubMed] [Google Scholar]
- Romano C, Sesma MA, McDonald CT, O'Malley K, van den Pol AN, Olney JW. Distribution of metabotropic glutamate receptor mGluR5 immunoreactivty in the rat brain. J Comp Neurol. 1995;355:455–469. doi: 10.1002/cne.903550310. [DOI] [PubMed] [Google Scholar]
- Shigemoto R, Nomura S, Ohishi H, Sugihara H, Nakanishi S, Mizuno N. Immnunohistochemical localization of a metabotropic glutamate receptor, mGluR5, in the rat brain. Neurosci Lett. 1993;163:53–57. doi: 10.1016/0304-3940(93)90227-c. [DOI] [PubMed] [Google Scholar]
- Sjöström PJ, Turrigiano GG, Nelson SB. Neocortical LTD via coincident activation of presynaptic NMDA and cannabinoid receptors. Neuron. 2003;39:641–654. doi: 10.1016/s0896-6273(03)00476-8. [DOI] [PubMed] [Google Scholar]
- Sohya K, Kameyama K, Yanagawa Y, Obta K, Tsumoto T. GABAergic neurons are less selective to stimulus orientation than excitatory neurons in layer II/III of visual cortex, as revealed by in vivo functional Ca2+ imaging in transgenic mice. J Neurosci. 2007;27:2145–2149. doi: 10.1523/JNEUROSCI.4641-06.2007. [DOI] [PMC free article] [PubMed] [Google Scholar]
- Somogyi P, Kisvarday ZF, Martin KA, Whitteridge D. Synaptic connections of morphologically identified and physiologically characterized large basket cells in the striate cortex of cat. Neurosci. 1996;10:261–294. doi: 10.1016/0306-4522(83)90133-1. [DOI] [PubMed] [Google Scholar]
- Tamamaki N, Yanagawa Y, Tomioka R, Miyazaki J, Obata K, Kaneko T. Green fluorescent protein expression and colocalization with calretinin, parvalbumin, and somatostatin in the GAD67-GFP knock-in mouse. J Comp Neurol. 2003;467:60–79. doi: 10.1002/cne.10905. [DOI] [PubMed] [Google Scholar]
- Tamas G, Somogyi PEH. Differentially interconnected networks of GABAergic interneurons in the visual cortex of the cat. J Neurosci. 1998;18:4255–4270. doi: 10.1523/JNEUROSCI.18-11-04255.1998. [DOI] [PMC free article] [PubMed] [Google Scholar]
- Timmermann DB, Westenbroek RE, Schousboe A, Catteral WA. Distribution of high-voltage-activated calcium channels in cultured γ-aminobutyric acidergic neurons from mouse cerebral cortex. J Neurosci Res. 2002;67:48–61. doi: 10.1002/jnr.10074. [DOI] [PubMed] [Google Scholar]
- Topolnik L, Azzi M, Morin F, Kougioumoutzakis A, Lacaille JC. mGluR1/5 subtype-specific calcium signalling and induction of long-term potentiation in rat hippocampal oriens/alveus interneurones. J Physiol (Lond) 2006;575:115–131. doi: 10.1113/jphysiol.2006.112896. [DOI] [PMC free article] [PubMed] [Google Scholar]
- Tsumoto T. Long-term potentiation and long-term depression in the neocortex. Prog Neurobiol. 1992;39:209–228. doi: 10.1016/0301-0082(92)90011-3. [DOI] [PubMed] [Google Scholar]
- Wang XF, Daw NW. Long term potentiation varies with layer in rat visual cortex. Brain Res. 2003;989:26–34. doi: 10.1016/s0006-8993(03)03321-3. [DOI] [PubMed] [Google Scholar]
- Wu LG, Saggau P. Pharmacological identification of two types of presynaptic voltage-dependent calcium channels at CA3-CA1 synapses of the hippocampus. J Neurosci. 1994;14:5613–5622. doi: 10.1523/JNEUROSCI.14-09-05613.1994. [DOI] [PMC free article] [PubMed] [Google Scholar]
- Yoshimura Y, Ohmura T, Komatsu Y. Two forms of synaptic plasticity with distinct dependence on age, experience, and NMDA receptor subtype in rat visual cortex. J Neurosci. 2003;23:6557–6566. doi: 10.1523/JNEUROSCI.23-16-06557.2003. [DOI] [PMC free article] [PubMed] [Google Scholar]
- Zucker RS. Short-term synaptic plasticity. Annu Rev Neurosci. 1989;12:13–31. doi: 10.1146/annurev.ne.12.030189.000305. [DOI] [PubMed] [Google Scholar]