

Abstract
Many response characteristics of neurons sensitive to visual motion depend on stimulus history and change during prolonged stimulation. Although the changes are usually regarded as adaptive, their functional significance is still not fully understood. With experimenter-defined stimuli, previous research on motion adaptation has mainly focused on enhancing the detection of changes in the stimulus domain, on preventing output saturation and on energy efficient coding. Here we will analyze in the blowfly visual system the functional significance of motion adaptation under the complex stimulus conditions encountered in the three-dimensional world. Identified motion sensitive neurons are confronted with seminatural optic flow as is seen by semi-free-flying animals as well as targeted modifications of it. Motion adaptation is shown to enhance object-induced neural responses in a three-dimensional environment although the overall neuronal response amplitude decreases during prolonged motion stimulation.
Keywords: motion adaptation, neural activity, blowfly, vision, optic flow, spatial discontinuity
Introduction
When an animal moves, nearby objects are displaced on the retina faster than more distant ones in the background. Many animals, including humans (Lappe et al., 1999; Warren et al., 2001) and other mammals (Legg and Lambert, 1990), birds (Wylie and Frost, 1999), and insects (Srinivasan et al., 1990; Kimmerle et al., 1996; Kern et al., 1997; Land and Collett, 1997; Kral, 2003), use the resulting motion discontinuities to segregate objects from their background and to estimate their distances. This segregation is possible only during translational self-motion, as during pure rotation the retinal velocities are independent of the distance between objects and observer and, thus, information on spatial discontinuities cannot be retrieved.
Several insect groups pursue active vision strategies to separate rotational and translational components of retinal image motion. They structure by their own behavior the optic flow on their eyes, thereby facilitating processing of spatial information by the nervous system (e.g., Zeil, 1993a,b; Collett and Zeil, 1996; Srinivasan and Zhang, 2000). Blowflies shift their gaze by saccadic rotations of body and head, keeping their gaze virtually constant during translational locomotion between saccades (Schilstra and van Hateren, 1999; van Hateren and Schilstra, 1999) (Fig. 1E). This gaze strategy appears to be used by a class of directionally selective motion sensitive output neurons, the horizontal system cells (HS-cells) (Hausen, 1982a,b; Krapp et al., 2001). These cells were concluded to extract information about the spatial layout of the environment during the intersaccadic intervals (Boeddeker et al., 2005; Kern et al., 2005, 2006; Karmeier et al., 2006).
Figure 1.

Fly's view and neural responses. A, The original-sized arena with a black object (part of the head from behind). B, Reconstructed optic flow at the instant of time depicted in A. Blue and red arrows represent the velocity vectors at different points in visual space (shown as a cylindrical projection) induced by the background and the object, respectively. C, D, Same as A and B, but for the large arena. Because the head is not in the center of the arena and slightly pitched upward, the fly's visual field does not cover the same area in A and C. E, Time-varying yaw velocity during the flight. Between rightward saccades are intersaccadic intervals with near-zero yaw velocities. F, G, Average responses of 10 left HS-cells during the flight in the original (F) and large arena (G), respectively. Red and blue curves indicate the responses to the behaviorally generated image displacements with and without object, respectively. Black arrows indicate the moment depicted in A and C. The gray areas in F and G correspond to the time interval (30 ms) of strong HS-cells responses during the passage of the object through the receptive field.
Motion sensitive cells of blowflies change their response characteristics during maintained motion stimulation. So far, research on motion adaptation has concentrated mainly on enhancing the detection of velocity changes, on preventing output saturation and on energy efficient coding (e.g., Maddess and Laughlin, 1985; Harris et al., 2000; Fairhall et al., 2001; Heitwerth et al., 2005; Neri and Laughlin, 2005). From these studies with relatively simple experimenter-designed visual stimuli it is hard to infer the perceptual or behavioral significance of motion adaptation under the complex stimulus conditions encountered in the real world. Therefore, we analyze motion adaptation with seminatural visual stimuli and address the following questions: Does the sensitivity of HS-cells for spatial discontinuities, i.e., for nearby objects, change with motion adaptation? Does object motion contribute to motion adaptation?
Materials and Methods
Stimulation.
An almost circular section of a semi-free-flight trajectory was chosen from a large data set obtained from blowflies flying in a cubic arena (edge length 0.4 m; walls covered with herbage photographs). This arena was placed in a Helmholtz coil; the position and orientation of the head were monitored by magnetic coils mounted on it (van Hateren and Schilstra, 1999). The semi-free-flight sequences recorded in this way do not differ in their saccadic structure from free-flight maneuvers monitored with high-speed cameras under outdoor conditions (Boeddeker et al., 2005). The selected flight section was closed to a 717 ms loop by interpolating the head position and gaze direction in a seminatural way (Heitwerth et al., 2005). With gaze direction and the visual interior of the cage known, the visual stimulus could be reconstructed and presented in a panoramic display instrument, FliMax (Lindemann et al., 2003). Because of the looped trajectory, image sequences with repetitive structure (sequence of loops) could be displayed continually to the blowfly. Ten of these loops made up one trial. To introduce spatial discontinuities, a homogeneously black vertical cylinder (diameter: 0.01 m; height: 0.4 m) was inserted into the virtual flight arena close to the flight trajectory, and the corresponding modified image sequence was reconstructed (Fig. 1A). To create spatial discontinuities of a different extent the edge length of the virtual flight arena was increased to 2.17 m (large arena) or decreased to 0.16 m (small arena). The wall pattern was scaled accordingly, but the distance between object and fly remained unchanged. Mirrored versions of the reconstructed image sequences were also presented. To assess the contributions of contrast and relative motion to the object responses, in control experiments an area on the original arena wall was blackened (“wall object”). This area corresponded in the analyzed intersaccadic interval to the azimuthally retinal size and position of the object in the other experiments. Different stimuli were presented in pseudo-random order. Between two stimuli, all light-emitting diodes of FliMax were set to the mean luminance for 20 s to allow the fly's visual system to return to its preadaptation state.
Electrophysiological experiments.
One- to three-day-old female blowflies (Calliphora vicina) were dissected as described by Dürr and Egelhaaf (1999). Temperatures during experiments amounted to 24–34°C. Responses were recorded intracellularly with glass electrodes from the axon of HS-cells in the right optic lobe. The resistance of the electrodes, filled with 1 m KCl, was 20–50 MΩ. Ringer solution (Kurtz et al., 2000) was used to prevent desiccation of the brain. Recordings were sampled at 4 kHz. The response of the left HS-cells was approximated by presenting a mirrored version of the reconstructed image sequences to HS-cells in the right half of the visual system.
Data analysis.
Data analysis with Matlab 7.0.1 (The MathWorks) is based on 14 HS-cells in the right half of the visual system (6 HSN, 7 HSE, and 1 HSS). All cells tested with the mirrored image sequence simulating recordings from the left HS-cells will be termed “left HS-cells.” Five of the HS-cells (4 HSN and 1 HSE) were tested, in addition with the original image sequence; they will be termed “right HS-cells.” The data were averaged across different HS-cell types, because for any of them object detection and the functional consequences of motion adaptation did not differ in any obvious way. Responses to the control stimuli were recorded only from HSE-cells, because the wall object, because of its larger distance to the fly, had a smaller vertical angular extent than the nearby object and covered only the receptive field of HSE. The object was present in the receptive field of the left and the right HS-cells in different intersaccadic intervals. All response values represent a depolarization relative to the resting potential of the cell as determined before stimulation. The mean object and background response of the left HS-cells (Fig. 2A1–D1) were averaged during a 30 ms time window in the respective intersaccadic intervals (indicated in Fig. 3C,D, left gray areas). Shorter and longer (15 and 50 ms) time windows led to qualitatively the same results. To check how much the object influences motion adaptation, the responses were averaged over 30 ms in the subsequent intersaccadic interval while the object was no longer present in the cell's receptive field (Fig. 3C, right gray area) or absent during the entire flight (Fig. 3D, right gray area). The SDs were calculated across all the cells' mean responses. Each cell was recorded for 2–10 trials.
Figure 2.
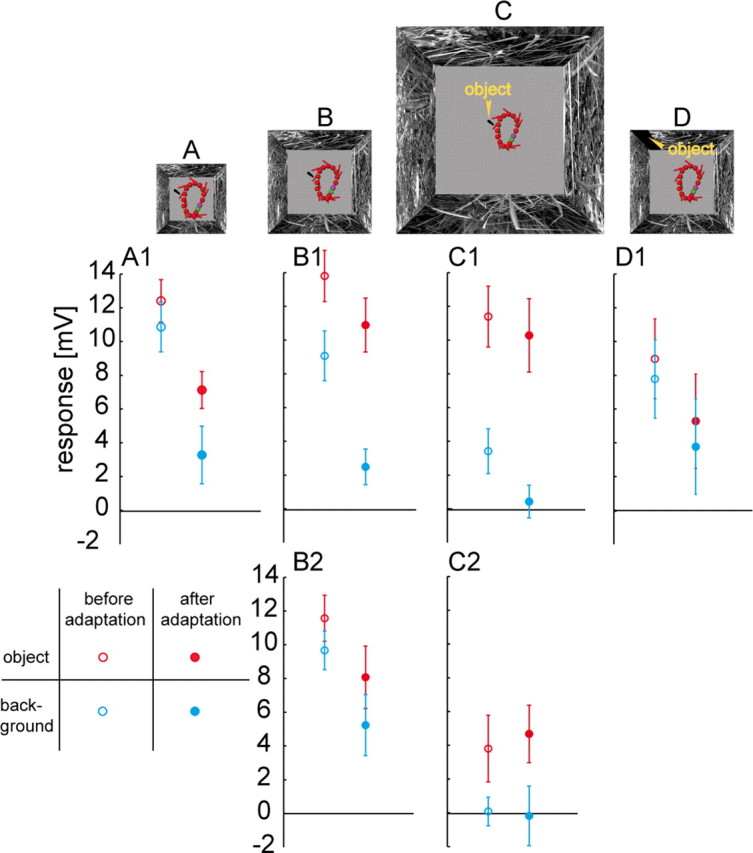
Mean responses (±SD) to object and background before and after adaptation. A–D, The same flight trajectory (top view) in small, original, large, and control arena. The position of the fly's head and its orientation are shown every 45 ms (red symbols). The location of the black object is given by the yellow markers. To enhance the visibility of the black object in the plot, lighter color of the floors in all arenas are used. A1–D1, Responses within the 30 ms intervals marked in Figure 1, F and G, averaged of 5, 10, and 10 left HS-cells and 4 left HSE-cells, respectively. Data before and after motion adaptation are gathered during the first and the eighth loop. B2, C2, Mean responses of 5 right HS-cells, calculated in a 30 ms time interval. The time interval corresponds to the presence of the object in the receptive field of the right HS-cells in the “object” condition.
Figure 3.
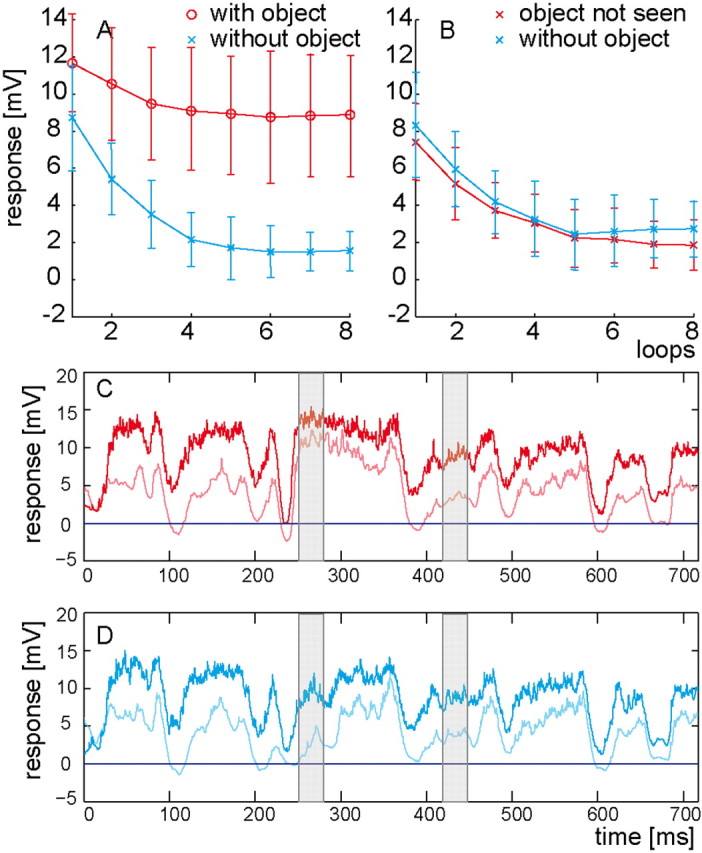
Time course of adaptation. A, Mean responses (±SD) in the intersaccadic interval with the object present (red; left gray area in C) and mean background responses (±SD) in the corresponding time interval of the “without object” condition (blue; left gray area in D). B, Mean responses (± SD) were determined either within the time interval where the object is not seen but is passed by the HS-cells' receptive field in the intersaccadic interval preceding the analyzed one (red; right gray area in C) or within the corresponding time interval of the “without object” condition (blue; right gray area in D). C, D, Time-dependent responses (averaged from 10 left HS-cells) in the original arena before (bold; first loop) and after (light; eighth loop) motion adaptation. C, Responses to stimuli obtained in the arena with object. D, Responses to stimuli obtained in the arena without object.
The time constants τ with which the object and background responses decrease during adaptation were analyzed with DataFit Version 8.2.79 (Oakdale Engineering) by fitting an exponential function of the form y = a + b × exp(−t/τ) to the data.
Results
Object-induced activity of HS-cells
The seminatural flight trajectory consisted of five saccades which led to wide-field motion in the null direction of the right HS-cells and intervals of virtually rotation-free straight flight (Fig. 1E). In its mirrored version all saccades led to motion in the preferred direction. Inserting an object close to the flight trajectory allowed us to assess the impact of a spatial discontinuity on the responses of HS-cells. An example of the corresponding relative motion cues is shown in Figure 1B for a moment of the flight in an experimental arena when the fly passes the cylindrical object (Fig. 1A). The retinal velocities induced by the nearby object are much larger than those induced by the background (Fig. 1B). Hence, the optic flow experienced when approaching an object is characterized by conspicuous discontinuities in the optic flow field, which are absent without object. Such discontinuities increase when the background is more distant (Fig. 1C,D) and decrease when it is closer (data not shown). The time-dependent graded membrane potential fluctuations, averaged from 10 HS-cells reveal a stronger depolarization when an object is present in the cell's receptive field during the intersaccadic interval (Fig. 1F, red in gray area) than when it is absent (blue). On average, this increase was 52% of the response amplitude obtained without object (Fig. 2B1, left). This increase in object-induced depolarization is not only visible on average, but in 98% of the individual responses (98 trials, 10 cells). The response increment is the larger the more distant the background and, thus, the larger the object-induced motion discontinuities (Fig. 1, compare B,F and D,G; Fig. 2). The depolarization induced by the wall-object was only 15% larger than the corresponding background response (Fig. 2D1, left). Hence, relative motion between object and background contributes considerably to the object-induced responses of HS-cells during the intersaccadic interval. Accordingly, HS-cells provide information about the spatial layout of the environment.
Adaptation increases sensitivity of HS-cells for spatial discontinuities
On the basis of our looped flight, a continuous sequence of seminatural optic flow with a repetitive structure was generated and presented to the fly. As a consequence of adaptation of the left HS-cells by prolonged optic flow stimulation the intersaccadic background responses decreased much more (Fig. 2, blue data points) than the intersaccadic object responses (Fig. 2, red data points). Hence, the response increment induced by a nearby object increased with motion adaptation. Already after the third loop, 100% of individual object responses are larger than the corresponding background responses (98 trials, 10 cells). The object-induced response increment depends on the strength of the motion discontinuities, as tested by increasing or decreasing the distance between background and object while maintaining the position of the object relative to the flight trajectory. Without any relative motion, the intersaccadic responses decreased similarly with and without object (Fig. 2D1). In the large flight arena (Fig. 2C), the unadapted intersaccadic background response is already relatively close to the resting potential of the cell, because the background optic flow is very weak (Fig. 1D). Nonetheless, the adaptation-induced decrease in the background response is larger than that of the corresponding object response (Fig. 2C1). One hundred percent of the individual object responses are larger than the corresponding background responses regardless of the adaptation level (98 trials, 10 cells). The strongest adaptation occurs in the small flight arena (Fig. 2A1), i.e., when the background is closest to fly and object. Then the object induces only very small motion discontinuities on the eyes. Nonetheless, an object-induced increment of depolarization is still visible (Fig. 2A1). The object-induced responses are now larger than the corresponding background responses in 79% of the trials (66 trials, 5 cells). Again, the object-induced response increment increases with motion adaptation, with 94% of individual object responses being larger than background responses after the fourth loop (66 trials, 5 cells). Similar results were obtained for the right HS-cells, although here all saccadic turns led to wide-field yaw rotation of the retinal image in the null-direction of the HS-cells (Fig. 2B2,C2). The larger the spatial discontinuities, the more pronounced is the object-induced intersaccadic response increment and the better the detectability of the object with motion adaptation.
Time constants of motion adaptation
In accordance with previous studies on the time course of motion adaptation to constant velocity stimulation (Maddess and Laughlin, 1985), the intersaccadic background response amplitude decreases over time to a steady-state level (Fig. 3A, blue line). The time constant of this decrease, as determined by an exponential fit to the average responses of each HS-cell during repetitive loops, amounts to, τ = 1.1 ± 0.3 s (10 cells) for the intersaccadic background responses and to τ = 0.8 ± 0.5 s (10 cells) for the corresponding object responses (Fig. 3A, red line). During motion adaptation the background response decreases by ∼80%, whereas the object response declines by only ∼25%.
Contribution of object motion to motion adaptation
When the object is seen by the eye in the previous intersaccadic interval, but not visible to the HS-cell in the analyzed intersaccadic interval, the decrease in the background responses is very similar to that when there was no object in any of the previous intersaccadic intervals (Fig. 3B). Hence, object motion is not the main source of motion adaptation. Only a minor contribution of object motion to motion adaptation is suggested, because all values obtained with the object in the previous intersaccadic interval are smaller by <0.9 mV than those data points collected when there was no object at all. This conclusion is corroborated by another finding: when the object is absent during the initial eight loops and only inserted in the ninth loop, the object response (10.4 ± 1.7 mV) is very close to the level of the object response (11.6 ± 1.8 mV) when the object is present during the first loop (unadapted state), and insignificantly larger than the object response in the eighth loop (8.9 ± 2.0 mV, adapted state). Thereby, the object makes only a minor contribution to adaptation compared with the impact of the background.
Comparing the time-dependent neuronal responses in the nonadapted and the adapted state (Fig. 3C,D) indicates that the reduction of the depolarization level during motion adaptation is primarily an overall shift of the responses to a more hyperpolarized level and only to a lesser extent a reduction in the modulation amplitude of the responses. Such a membrane potential shift has also been observed previously with simple experimenter-designed constant-velocity stimuli (Harris et al., 2000; Kurtz et al., 2000). However, a change in response gain that was also found by Harris et al. (2000) and concluded to be independent of the direction of motion is not obvious in our data.
Discussion
The functional significance of motion adaptation in the blowfly visual motion pathway has been assessed in various previous studies (Maddess and Laughlin, 1985; Brenner et al., 2000; Harris et al., 2000; Fairhall et al., 2001; Borst et al., 2005; Heitwerth et al., 2005). With experimenter-designed motion stimuli an increase in relative sensitivity to velocity increments or decrements superimposed on a constant velocity stimulus could be shown to accompany a decrease in absolute response amplitude (Maddess and Laughlin, 1985). In accordance with our results, the detectability of temporal discontinuities is improved as a consequence of motion adaptation, although the overall response amplitude decreased. Our results extend the adaptation benefit to three-dimensional complex environments.
Adaptation benefits are addressed in other studies as well. For instance, adaptive rescaling has been concluded to maximize the temporal information transmission by a fly motion sensitive neuron (Brenner et al., 2000) or to capture some of the statistical properties of a time-varying motion stimulus (Fairhall et al., 2001). Part of these results could be explained by modeling as being emergent properties of the motion detection system without any adaptive changes of system's parameters (Borst et al., 2005). It is not clear, so far, how these interpretations of the functional significance of motion adaptation based on experimenter-defined motion stimuli relate to our conclusion that adaptation enhances object detectability in a three-dimensional world.
Adaptation in motion sensitive neurons of vertebrates has been concluded to be beneficial in various ways. For instance, motion adaptation is proposed to re-center tuning of motion sensitive neurons around the prevailing stimulus conditions to improve the discriminability of novel stimuli (Kohn, 2007). This can be accomplished by suppressing responses to frequent or persistent stimuli, leaving those to novel stimuli largely unchanged (Dragoi et al., 2002; Sharpee et al., 2006). Similar phenomena were observed in electrosensation of electric fish (Grau and Bastian, 1986; Reches and Gutfreund, 2008). This kind of novelty detection is similar to our finding that motion adaptation improves the detectability of an object suddenly turning up, whereas the sustained background motion responses decrease. Novelty detection can be also viewed as an extension of a general predictive coding (Srinivasan et al., 1982) strategy of sensory systems, which improves efficiency by encoding the environment as differences of stimulus strengths in space or time (Barlow, 1961). Earlier studies interpreted motion adaptation mainly in terms of signal coding without recourse to its immediate perceptual (Dragoi et al., 2000; Maravall et al., 2007) or behavioral significance (Hosoya et al., 2005; Sharpee et al., 2006). Natural scenes have been already used in a recent study on motion adaptation (Sharpee et al., 2006). However, in contrast to our approach, where we reconstructed retinal image sequences as seen by semi-free-flying flies, the dynamics of the stimulus sequences used in the study of Sharpee et al. were obtained with a manually moved camera. These stimulus sequences presumably differ considerably from those image sequences experienced by behaving animals.
Footnotes
This work was supported by the Deutsche Forschungsgemeinschaft. We thank R. Kurtz, J. Grewe, C. Spalthoff, and S. Roy for critically reading this manuscript and J. Heitwerth and J. P. Lindemann for stimulus reconstruction.
References
- Barlow HB. Possible principles underlying the transformation of sensory messages. In: Rosenblith WA, editor. Sensory communication. Cambridge, MA: MIT; 1961. pp. 217–234. [Google Scholar]
- Boeddeker N, Lindemann JP, Egelhaaf M, Zeil J. Responses of blowfly motion-sensitive neurons to reconstructed optic flow along outdoor flight paths. J Comp Physiol A Neuroethol Sens Neural Behav Physiol. 2005;191:1143–1155. doi: 10.1007/s00359-005-0038-9. [DOI] [PubMed] [Google Scholar]
- Borst A, Flanagin VL, Sompolinsky H. Adaptation without parameter change: dynamic gain control in motion detection. Proc Natl Acad Sci U S A. 2005;102:6172–6176. doi: 10.1073/pnas.0500491102. [DOI] [PMC free article] [PubMed] [Google Scholar]
- Brenner N, Bialek W, de Ruyter van Steveninck R. Adaptive rescaling maximizes information transmission. Neuron. 2000;26:695–702. doi: 10.1016/s0896-6273(00)81205-2. [DOI] [PubMed] [Google Scholar]
- Collett TS, Zeil J. Flights of learning. Curr Dir Psychol Sci. 1996;5:149–155. [Google Scholar]
- Dragoi V, Sharma J, Sur M. Adaptation-induced plasticity of orientation tuning in adult visual cortex. Neuron. 2000;28:287–298. doi: 10.1016/s0896-6273(00)00103-3. [DOI] [PubMed] [Google Scholar]
- Dragoi V, Sharma J, Miller EK, Sur M. Dynamics of neuronal sensitivity in visual cortex and local feature discrimination. Nat Neurosci. 2002;5:883–891. doi: 10.1038/nn900. [DOI] [PubMed] [Google Scholar]
- Dürr V, Egelhaaf M. In vivo calcium accumulation in presynaptic and postsynaptic dendrites of visual interneurons. J Neurophysiol. 1999;82:3327–3338. doi: 10.1152/jn.1999.82.6.3327. [DOI] [PubMed] [Google Scholar]
- Fairhall AL, Lewen GD, Bialek W, de Ruyter Van Steveninck RR. Efficiency and ambiguity in an adaptive neural code. Nature. 2001;412:787–792. doi: 10.1038/35090500. [DOI] [PubMed] [Google Scholar]
- Grau HJ, Bastian J. Neural correlates of novelty detection in pulse-type weakly electric fish. J Comp Physiol [A] 1986;159:191–200. doi: 10.1007/BF00612302. [DOI] [PubMed] [Google Scholar]
- Harris RA, O'Carroll DC, Laughlin SB. Contrast gain reduction in fly motion adaptation. Neuron. 2000;28:595–606. doi: 10.1016/s0896-6273(00)00136-7. [DOI] [PubMed] [Google Scholar]
- Hausen K. Motion sensitive interneurons in the optomotor system of the fly. I. The horizontal cells: structure and signals. Biol Cybern. 1982a;45:143–156. [Google Scholar]
- Hausen K. Motion sensitive interneurons in the optomotor system of the fly. II. The horizontal cells: receptive field organization and response characteristics. Biol Cybern. 1982b;46:67–79. [Google Scholar]
- Heitwerth J, Kern R, van Hateren JH, Egelhaaf M. Motion adaptation leads to parsimonious encoding of natural optic flow by blowfly motion vision system. J Neurophysiol. 2005;94:1761–1769. doi: 10.1152/jn.00308.2005. [DOI] [PubMed] [Google Scholar]
- Hosoya T, Baccus SA, Meister M. Dynamic predictive coding by the retina. Nature. 2005;436:71–77. doi: 10.1038/nature03689. [DOI] [PubMed] [Google Scholar]
- Karmeier K, van Hateren JH, Kern R, Egelhaaf M. Encoding of naturalistic optic flow by a population of blowfly motion-sensitive neurons. J Neurophysiol. 2006;96:1602–1614. doi: 10.1152/jn.00023.2006. [DOI] [PubMed] [Google Scholar]
- Kern R, Egelhaaf M, Srinivasan MV. Edge detection by landing honeybees: behavioural analysis and model simulations of the underlying mechanism. Vision Res. 1997;37:2103–2117. doi: 10.1016/s0042-6989(97)00013-8. [DOI] [PubMed] [Google Scholar]
- Kern R, van Hateren JH, Michaelis C, Lindemann JP, Egelhaaf M. Function of a fly motion-sensitive neuron matches eye movements during free flight. PLoS Biol. 2005;3:e171. doi: 10.1371/journal.pbio.0030171. [DOI] [PMC free article] [PubMed] [Google Scholar]
- Kern R, van Hateren JH, Egelhaaf M. Representation of behaviourally relevant information by blowfly motion-sensitive visual interneurons requires precise compensatory head movements. J Exp Biol. 2006;209:1251–1260. doi: 10.1242/jeb.02127. [DOI] [PubMed] [Google Scholar]
- Kimmerle B, Egelhaaf M, Srinivasan MV. Object detection by relative motion in freely flying flies. Naturwissenschaften. 1996;83:380–381. [Google Scholar]
- Kohn A. Visual adaptation: physiology, mechanisms, and functional benefits. J Neurophysiol. 2007;97:3155–3164. doi: 10.1152/jn.00086.2007. [DOI] [PubMed] [Google Scholar]
- Kral K. Behavioural-analytical studies of the role of head movements in depth perception in insects, birds and mammals. Behav Processes. 2003;64:1–12. doi: 10.1016/s0376-6357(03)00054-8. [DOI] [PubMed] [Google Scholar]
- Krapp HG, Hengstenberg R, Egelhaaf M. Binocular input organization of optic flow processing interneurons in the fly visual system. J Neurophysiol. 2001;85:724–734. doi: 10.1152/jn.2001.85.2.724. [DOI] [PubMed] [Google Scholar]
- Kurtz R, Dürr V, Egelhaaf M. Dendritic calcium accumulation associated with direction selective adaptation in visual motion sensitive neurons in vivo. J Neurophysiol. 2000;84:1914–1923. doi: 10.1152/jn.2000.84.4.1914. [DOI] [PubMed] [Google Scholar]
- Land MF, Collett TS. A survey of active vision in invertebrates. In: Srinivasan MV, Venkatesh S, editors. From living eyes to seeing machines. Oxford: Oxford UP; 1997. pp. 16–36. [Google Scholar]
- Lappe M, Bremmer F, van den Berg AV. Perception of self-motion from optic flow. Trends Cogn Sci. 1999;3:329–336. doi: 10.1016/s1364-6613(99)01364-9. [DOI] [PubMed] [Google Scholar]
- Legg CR, Lambert S. Distance estimation in the hooded rat: experimental evidence for the role of motion cues. Behav Brain Res. 1990;41:11–20. doi: 10.1016/0166-4328(90)90049-k. [DOI] [PubMed] [Google Scholar]
- Lindemann JP, Kern R, Michaelis C, Meyer P, van Hateren JH, Egelhaaf M. FliMax, a novel stimulus device for panoramic and highspeed presentation of behaviourally generated optic flow. Vision Res. 2003;43:779–791. doi: 10.1016/s0042-6989(03)00039-7. [DOI] [PubMed] [Google Scholar]
- Maddess T, Laughlin SB. Adaptation of the motion-sensitive neuron H1 is generated locally and governed by contrast frequency. Proc R Soc Lond B Biol Sci. 1985;225:251–275. [Google Scholar]
- Maravall M, Petersen RS, Fairhall AL, Arabzadeh E, Diamond ME. Shifts in coding properties and maintenance of information transmission during adaptation in barrel cortex. PLoS Biology. 2007;5:e19. doi: 10.1371/journal.pbio.0050019. [DOI] [PMC free article] [PubMed] [Google Scholar]
- Neri P, Laughlin SB. Global versus local adaptation in fly motion-sensitive neurons. Proc Biol Sci. 2005;272:2243–2249. doi: 10.1098/rspb.2005.3191. [DOI] [PMC free article] [PubMed] [Google Scholar]
- Reches A, Gutfreund Y. Stimulus-specific adaptations in the gaze control system of the barn owl. J Neurosci. 2008;28:1523–1533. doi: 10.1523/JNEUROSCI.3785-07.2008. [DOI] [PMC free article] [PubMed] [Google Scholar]
- Schilstra C, van Hateren JH. Blowfly flight and optic flow. I. Thorax kinematics and flight dynamics. J Exp Biol. 1999;202:1481–1490. doi: 10.1242/jeb.202.11.1481. [DOI] [PubMed] [Google Scholar]
- Sharpee TO, Sugihara H, Kurgansky AV, Rebrik SP, Stryker MP, Miller KD. Adaptive filtering enhances information transmission in visual cortex. Nature. 2006;439:936–942. doi: 10.1038/nature04519. [DOI] [PMC free article] [PubMed] [Google Scholar]
- Srinivasan MV, Zhang SW. Visual navigation in flying insects. Int Rev Neurobiol. 2000;44:67–92. doi: 10.1016/s0074-7742(08)60738-2. [DOI] [PubMed] [Google Scholar]
- Srinivasan MV, Laughlin SB, Dubs A. Predictive coding: a fresh view of inhibition in the retina. Proc R Soc Lond B. 1982;216:427–459. doi: 10.1098/rspb.1982.0085. [DOI] [PubMed] [Google Scholar]
- Srinivasan MV, Lehrer M, Horridge GA. Visual figure-ground discrimination in the honeybee: the role of motion parallax at boundaries. Proc R Soc Lond B. 1990;238:331–350. [Google Scholar]
- van Hateren JH, Schilstra C. Blowfly flight and optic flow. II. Head movements during flight. J Exp Biol. 1999;202:1491–1500. doi: 10.1242/jeb.202.11.1491. [DOI] [PubMed] [Google Scholar]
- Warren WH, Jr, Kay BA, Zosh WD, Duchon AP, Sahuc S. Optic flow is used to control human walking. Nat Neurosci. 2001;4:213–216. doi: 10.1038/84054. [DOI] [PubMed] [Google Scholar]
- Wylie DRW, Frost BJ. Responses of neurons in the nucleus of the basal optic root to translational and rotational flowfields. J Neurophysiol. 1999;81:267–276. doi: 10.1152/jn.1999.81.1.267. [DOI] [PubMed] [Google Scholar]
- Zeil J. Orientation flights of solitary wasps (Cerceris, Sphecidae, Hymenoptera). I. Description of flights. J Comp Physiol A Neuroethol Sens Neural Behav Physiol. 1993a;172:189–205. [Google Scholar]
- Zeil J. Orientation flights of solitary wasps (Cerceris; Sphecidae; Hymenoptera). II. Similarities between orientation and return flights and the use of motion parallax. J Comp Physiol A Neuroethol Sens Neural Behav Physiol. 1993b;172:207–222. [Google Scholar]