Abstract
Background
Glucocorticoids (GCs)-induced glaucoma is a common adverse effect of prolonged GCs use. To better understand the effects of GCs on aqueous humor (AH) outflow, we analyzed the dataset GSE37474 using bioinformatics analysis to identify gene changes and pathways in the anterior segment of the human eye induced by dexamethasone (DEX).
Material/Methods
The GSE37474 dataset downloaded from the Gene Expression Omnibus (GEO) database was examined in this study. GEO2R was utilized to analyze data and identify differentially expressed genes (DEGs). Gene Ontology (GO) enrichment and the Kyoto Encyclopedia of Genes and Genomes (KEGG) pathway were constructed using the DAVID database followed by construction of a protein–protein interaction (PPI) network performed using Cytoscape software. Finally, modules and hub genes were screened out using MCODE and cytoHubba plugin, respectively.
Results
A set of 252 DEGs were screened. Among the DEGs, 143 genes were upregulated and 109 were downregulated. GO analysis indicated that some of the DEGs participated in extracellular matrix (ECM) organization and cholesterol homeostasis. Additionally, KEGG pathways were predominantly enriched in tyrosine metabolism and ECM-receptor interaction. From the PPI network, 2 modules were identified, and 10 hub genes were screened out, including CCL2, FOS, IGF1, PTGS2, CCL5, EDN1, IL11, F3, PMCH, and BDKRB1. The 2 module genes primarily participate in the TNF signaling pathway, cytokine-cytokine receptor interaction, and the Jak-STAT signaling pathway.
Conclusions
The present study identified some significant DEGs, hub genes, pathways, and modules in the human anterior segment induced by DEX. These results demonstrate that DEX changes the expression of certain genes and pathways to resist aqueous humor outflow, which could be new targets for developing novel and more effective approaches of diagnosis and therapy for GCs-induced glaucoma.
MeSH Keywords: Dexamethasone, Gene Expression Profiling, Glaucoma
Background
Glucocorticoids (GCs) are a class of steroid hormones involved in many essential biological processes. Due to their profound anti-inflammatory and immunosuppressive properties, these hormones are utilized in a variety of disease treatments [1]. GCs mediate expression of targeted genes through binding to glucocorticoid receptors (GRs) to induce pharmacodynamic actions [2]. Dexamethasone (DEX), a representative GC, is widely used around the world. However, prolonged use of GCs may lead to adverse effects such as glaucoma, resulting in manifestations of glaucomatous optic neuropathy and irreversible visual impairment. This pathogenesis shares similarities with primary open-angle glaucoma (POAG) [3]. GCs can rearrange the structure of the anterior segment, and GRs have been identified on the surface of trabecular meshwork (TM) cells [4]. Treatment with GCs changes the microstructure of the TM, resisting the outflow of aqueous humor (AH) and resulting in elevated intraocular pressure (IOP) [5–7]. The precise pathogenesis of GCs-induced glaucoma (GIG) has not been thoroughly elucidated to date, and researchers are attempting to learn more about this disease.
A previous study suggested that the actin cytoskeleton could be rearranged into cross-linked actin networks (CLANs) in cultured anterior segments and cultured TM cells treated with DEX, disrupting the balance of normal fluid flow [8]. Many factors mediate this alternation. Integrins can form complexes with various molecules, and these supra-molecular complexes establish bidirectional signaling between the extracellular and intracellular environment. This process regulates changes in the actin cytoskeleton [9]. Enhanced β3 integrin signaling was proposed to play a role in DEX-induced CLAN formation [10]. Members of the Ras homolog (Rho) family of small guanosine triphosphatases (GTPases) also regulate organization of the actin cytoskeleton [11]. Ras homolog family member A (RhoA) is increased in GC-treated trabecular meshwork (TM)-1 cells [12]. In addition, cell division cycle 42 (Cdc42), another member of the Rho family GTPases, is also overexpressed in DEX-treated TM-1 cells [13]. Recently, several new mechanisms have been proposed. Overexpression of a-smooth muscle actin (aSMA) and activation of the mitogen-activated protein kinase (MAPK) pathway stiffens the extracellular matrix (ECM) in DEX-treated TM cells [14].
It is widely accepted that vision can be impaired in response to elevated IOP, and gradual elevation of IOP makes diagnosing DEX-induced glaucoma difficult. Therefore, it is urgent to study the pathogenesis of DEX-induced glaucoma to formulate proper diagnostic, therapeutic, and preventive tactics. Bioinformatics analysis of microarray data can identify differentially expressed genes (DEGs) between disease and control groups to identify important genes and pathways involved in the disease process. In this study, the expression profile GSE37474 was analyzed using bioinformatics. There are no relevant publications on this database, and, to the best of our knowledge, this database has not previously been analyzed.
Material and Methods
Gene expression data
The gene expression profile GSE37474 was obtained from the public Gene Expression Omnibus database (GEO, https://www.ncbi.nlm.nih.gov/geo/). GSE37474 was utilized on the basis of the GPL570 platform (Affymetrix Human Genome U113 Plus 2.0 Array; Agilent Technologies, Santa Clara, CA, USA). GSE37474 contains 5 experimental samples and 5 control samples, and all samples were obtained from 5 paired donor eyes. For each paired sample, the anterior segment of one eye was cultured containing DEX, while the ipsilateral anterior segment was cultured in the absence of DEX.
Identification of differentially expressed genes
GEO2R (http://www.ncbi.nlm.nih.gov/geo/geo2r/), an R programming language-based online tool, was employed to screen DEGs by comparing samples from the GEO series [15]. We used GEO2R to identify DEGs in DEX-treated tissues and control tissues. P<0.05 and log fold change (FC) ≥1 were used as threshold criteria for DEGs. A heatmap was constructed using HemI1.0 software, and a volcano plot was constructed using R software.
Functional enrichment analysis
Gene Ontology (GO) analysis and Kyoto Encyclopedia of Genes and Genomes (KEGG) pathway analysis were performed to determine the functions of DEGs using the Database for Annotation, Visualization and Integrated Discovery (DAVID) (https://david.ncifcrf.gov/). GO terms included molecular functions, cellular components, and biological processes of genomic products [16]. KEGG analyzes pathways of important gene products [17]. DAVID is a bioinformatics database for analyzing the functional interpretation of lists of proteins and genes [18]. The cutoff value was set to P<0.05.
Protein–protein interaction network construction and module screening
The Search Tool for the Retrieval of Interacting Genes (STRING) database (http://string-db.org/) is an analysis tool that predicts comprehensive interactions of lists of genes at the protein level [19]. In our study, a PPI network of DEGs was analyzed by STRING and presented using Cytoscape software. Then, 10 hub genes were identified by the cytoHubba plugin. Molecular Complex Detection (MCODE) analysis of the PPI network was performed using Cytoscape, and MCODE scores >3 and number of nodes >4 were set as cutoff criteria.
Results
Identification of DEGs
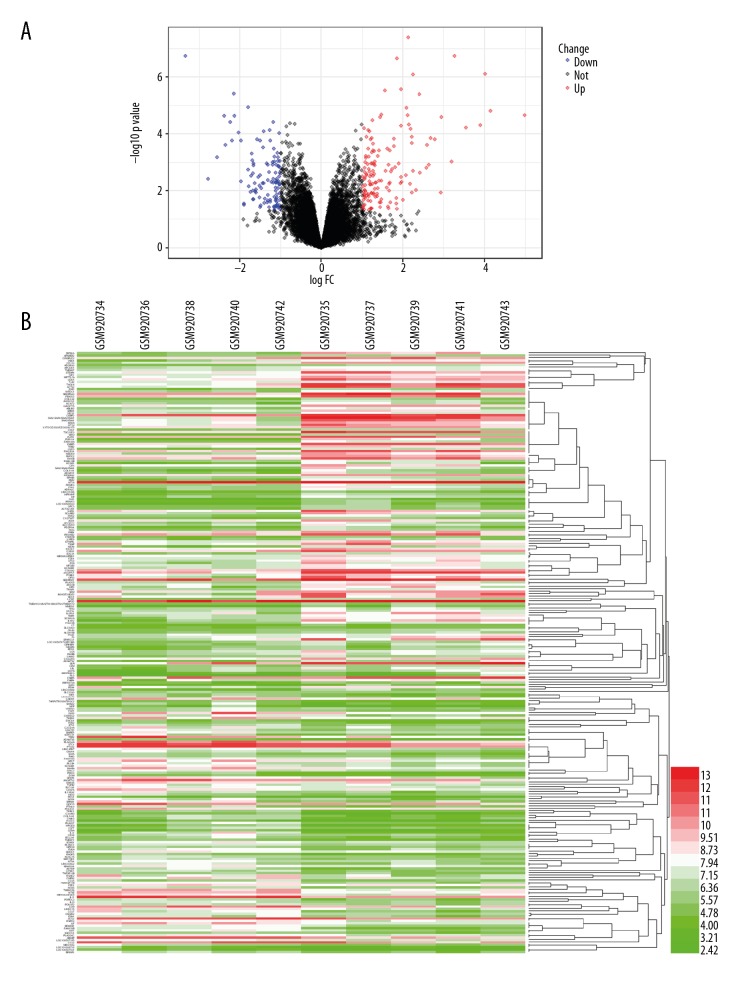
We identified 252 DEGs in the GSE37474 dataset using the GEO2R tool. Of these DEGs, 143 genes were upregulated and 109 genes were downregulated. The top 5 upregulated and downregulated DEGs are shown in Table 1. The volcano plot and heatmap for DEGs are illustrated in Figure 1A and 1B, respectively.
Table 1.
The top 5 upregulated and downregulated DEGs obtained from GSE37474 dataset.
| Gene symbol | log FC | P value | |
|---|---|---|---|
| Upregulated | SAA2-SAA4///SAA2///SAA1 | 4.9916146 | 2.23E-05 |
| IL1R2 | 4.147068 | 1.57E-05 | |
| ZBTB16 | 4.0130764 | 7.79E-07 | |
| P2RY14 | 3.903948 | 4.84E-05 | |
| SAA2///SAA1 | 3.5531796 | 6.20E-05 | |
| Downregulated | TFPI2 | −2.354117 | 2.40E-04 |
| TNFRSF11B | −2.371862 | 2.36E-05 | |
| CCL7 | −2.551654 | 6.70E-04 | |
| IL24 | −2.770583 | 3.72E-03 | |
| FAM150B | −3.3337 | 1.83E-07 |
Figure 1.
Presentation of DEGs. (A) Volcano plot; (B) Heatmap.
DEG analyses via GO and KEGG
GO enrichment and KEGG pathway analyses of identified DEGs were conducted by DAVID. The analysis results of significantly enriched GO terms are shown in Table 2. In terms of molecular functions, a number of upregulated genes were involved in calcium ion binding, while many downregulated genes functioned in cytokine activity. According to cellular components, many upregulated and downregulated genes were located in the extracellular region. In addition, biological processes analysis revealed that upregulated genes primarily participated in extracellular matrix (ECM) organization and cholesterol homeostasis, while downregulated genes were mostly enriched in the inflammatory response. Furthermore, KEGG pathway results are displayed in Table 3. For upregulated genes, tyrosine metabolism and ECM-receptor interaction were involved in many gene products. For downregulated genes, cytokine-cytokine receptor interaction and inflammatory mediator regulation of TRP channels were most significant.
Table 2.
Functional enrichment analysis of DEGs.
| Expression | Category | Term | Count | P value |
|---|---|---|---|---|
| Upregulated | GOTERM_MF_DIRECT | GO: 0005509~calcium ion binding | 13 | 3.55E-03 |
| GOTERM_MF_DIRECT | GO: 0004867~serine-type endopeptidase inhibitor activity | 5 | 4.35E-03 | |
| GOTERM_MF_DIRECT | GO: 0008201~heparin binding | 6 | 4.78E-03 | |
| GOTERM_MF_DIRECT | GO: 0002020~protease binding | 5 | 5.02E-03 | |
| GOTERM_MF_DIRECT | GO: 0005215~transporter activity | 6 | 1.24E-02 | |
| GOTERM_CC_DIRECT | GO: 0005576~extracellular region | 34 | 5.43E-09 | |
| GOTERM_CC_DIRECT | GO: 0070062~extracellular exosome | 46 | 9.33E-09 | |
| GOTERM_CC_DIRECT | GO: 0005578~proteinaceous extracellular matrix | 14 | 3.61E-08 | |
| GOTERM_CC_DIRECT | GO: 0005615~extracellular space | 26 | 3.51E-06 | |
| GOTERM_CC_DIRECT | GO: 0031012~extracellular matrix | 10 | 1.93E-04 | |
| GOTERM_BP_DIRECT | GO: 0030198~extracellular matrix organization | 9 | 7.30E-05 | |
| GOTERM_BP_DIRECT | GO: 0045926~negative regulation of growth | 4 | 3.02E-04 | |
| GOTERM_BP_DIRECT | GO: 0007155~cell adhesion | 12 | 3.90E-04 | |
| GOTERM_BP_DIRECT | GO: 0042632~cholesterol homeostasis | 5 | 1.06E-03 | |
| GOTERM_BP_DIRECT | GO: 0010951~negative regulation of endopeptidase activity | 6 | 1.64E-03 | |
| Downregulated | GOTERM_MF_DIRECT | GO: 0005125~cytokine activity | 11 | 2.10E-08 |
| GOTERM_MF_DIRECT | GO: 0008083~growth factor activity | 9 | 1.70E-06 | |
| GOTERM_MF_DIRECT | GO: 0005102~receptor binding | 9 | 4.34E-04 | |
| GOTERM_MF_DIRECT | GO: 0005518~collagen binding | 4 | 3.54E-03 | |
| GOTERM_MF_DIRECT | GO: 0008201~heparin binding | 5 | 9.04E-03 | |
| GOTERM_CC_DIRECT | GO: 0005576~extracellular region | 30 | 3.24E-09 | |
| GOTERM_CC_DIRECT | GO: 0005615~extracellular space | 27 | 6.46E-09 | |
| GOTERM_CC_DIRECT | GO: 0005578~proteinaceous extracellular matrix | 7 | 3.26E-03 | |
| GOTERM_CC_DIRECT | GO: 0031012~extracellular matrix | 6 | 2.18E-02 | |
| GOTERM_BP_DIRECT | GO: 0006954~inflammatory response | 11 | 4.24E-05 | |
| GOTERM_BP_DIRECT | GO: 0007267~cell-cell signaling | 9 | 7.64E-05 | |
| GOTERM_BP_DIRECT | GO: 0014911~positive regulation of smooth muscle cell migration | 4 | 1.70E-04 | |
| GOTERM_BP_DIRECT | GO: 0070374~positive regulation of ERK1 and ERK2 cascade | 7 | 4.00E-04 | |
| GOTERM_BP_DIRECT | GO: 0030593~neutrophil chemotaxis | 5 | 4.69E-04 |
Table 3.
The significant KEGG pathway enriched by DEGs.
| Expression | Term | Count | P value | Genes |
|---|---|---|---|---|
| Upregulated | hsa00350: Tyrosine metabolism | 4 | 3.04E-03 | MAOA, AOX1, ADH1B, HPD |
| hsa04270: Vascular smooth muscle contraction | 6 | 3.08E-03 | ACTA2, MRVI1, PLA2G5, KCNMB1, PPP1R14A, MYL9 | |
| hsa00982: Drug metabolism – cytochrome P450 | 4 | 1.91E-02 | FMO2, MAOA, AOX1, ADH1B | |
| hsa04512: ECM-receptor interaction | 4 | 3.62E-02 | LAMA2, ITGB4, SDC4, COL11A1 | |
| Downregulated | hsa04060: Cytokine-cytokine receptor interaction | 8 | 5.53E-04 | LIF, TNFRSF11B, CCL2, TNFSF13B, CCL5, CCL7, TGFB2, IL11 |
| hsa05323: Rheumatoid arthritis | 5 | 2.26E-03 | CCL2, TNFSF13B, CCL5, TGFB2, IL11 | |
| hsa04750: Inflammatory mediator regulation of TRP channels | 5 | 3.34E-03 | PLA2G4A, PLCB4, IGF1, BDKRB1, PLA2G4C | |
| hsa04913: Ovarian steroidogenesis | 4 | 3.62E-03 | PLA2G4A, PTGS2, IGF1, PLA2G4C | |
| hsa05142: Chagas disease (American trypanosomiasis) | 5 | 4.14E-03 | GNA14, CCL2, PLCB4, CCL5, TGFB2 |
Screening of hub genes and analysis of modules
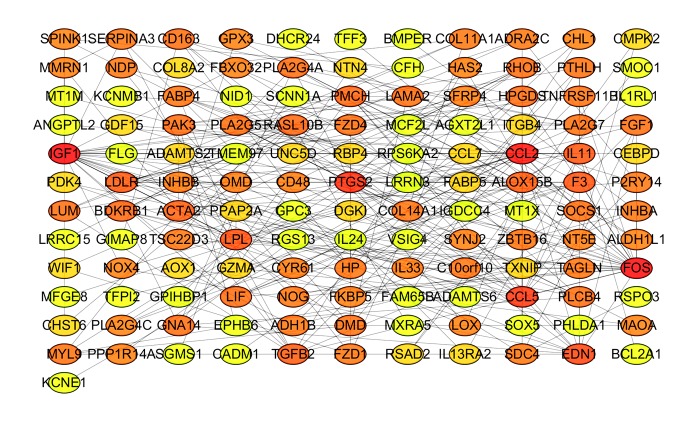
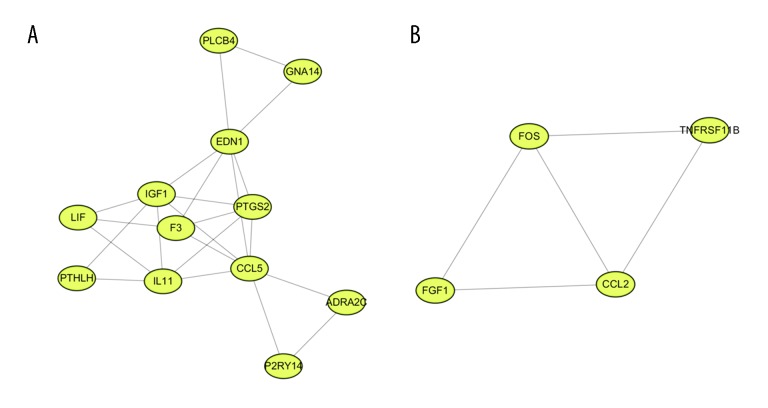
The PPI network of DEGs was constructed, with 133 nodes and 259 edges being mapped (Figure 2). The 10 hub genes were determined by CytoHubba plugin using the MCC method and included CCL2, FOS, IGF1, PTGS2, CCL5, EDN1, IL11, F3, PMCH, and BDKRB1 (Figure 3). Details for hub genes are displayed in Table 4. Hub genes consisted of 3 upregulated genes and 7 downregulated genes. MCODE analysis was performed, and 2 modules were chosen from the PPI network using Cytoscape software (Figure 4). In addition, IL11 and FOS were 2 seed genes for the chosen modules in MCODE analysis. KEGG pathway enrichment analysis revealed that module genes were primarily involved in the TNF signaling pathway, cytokine-cytokine receptor interaction, and the Jak-STAT signaling pathway (Figure 5).
Figure 2.
PPI network of DEGs.
Figure 3.
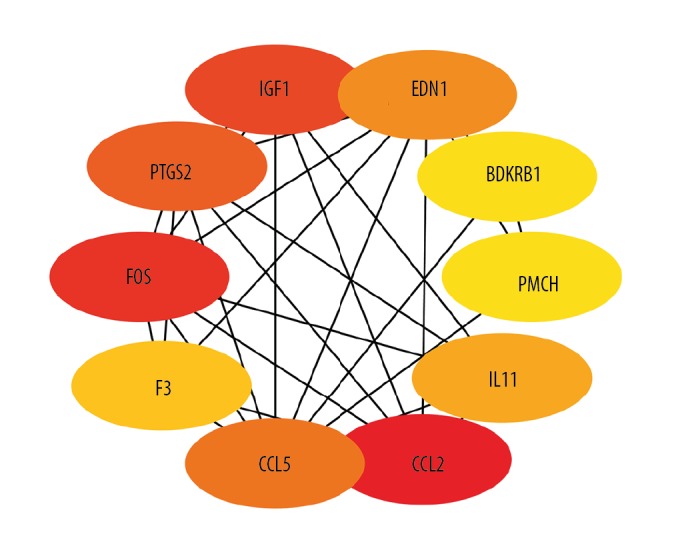
Network of the 10 hub genes. Redder color indicates higher degree.
Table 4.
The 10 hub DEGs were obtained by cytoHubba.
| Gene symbol | P Value | Log FC | Score | Degree | Regulation |
|---|---|---|---|---|---|
| CCL2 | 1.20E-02 | −1.01584 | 536 | 22 | Down |
| FOS | 5.42E-03 | 1.945081 | 507 | 24 | Up |
| IGF1 | 3.77E-05 | −2.23249 | 406 | 24 | Down |
| PTGS2 | 1.10E-03 | −1.34509 | 404 | 17 | Down |
| CCL5 | 9.07E-03 | −1.59577 | 401 | 16 | Down |
| EDN1 | 4.62E-02 | 1.048579 | 325 | 13 | Up |
| IL11 | 1.16E-05 | −1.7911 | 194 | 10 | Down |
| F3 | 7.83E-03 | 1.609335 | 158 | 10 | Up |
| PMCH | 1.70E-04 | −1.97567 | 54 | 7 | Down |
| BDKRB1 | 2.37E-05 | −2.12487 | 54 | 7 | Down |
Figure 4.
Module analysis. (A) Module 1; (B) Module 2.
Figure 5.
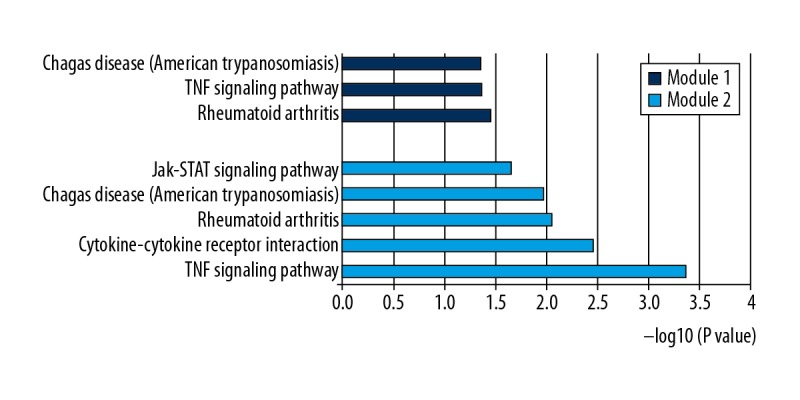
KEGG pathways of genes in the 2 modules.
Discussion
The pathogenesis of DEX-induced glaucoma has been difficult to explain. In this study, we identified 252 DEGs, 143 upregulated and 109 downregulated, in the GSE 37474 dataset. According to results from the GO analysis, DEGs were primarily located in the extracellular region. At the level of biological processes, numerous DEGs participated in ECM organization and cholesterol homeostasis. These results suggest that ECM organization is of great significance. The ECM of TM plays an important role in regulating IOP. Previous studies have demonstrated that many ECM components change within the TM in DEX-induced glaucoma [20,21]. Recently, studies have reported that stains can increase aqueous outflow, delaying the progression of open-angle glaucoma [22]. Furthermore, cholesterol-lowering medications may inhibit the production of isoprenoid intermediates in the cholesterol biosynthetic pathway, indirectly suppressing Rho GTPase signaling [22]. Based on these findings, it is tempting to speculate that cholesterol homeostasis is associated with the development of DEX-induced glaucoma. Additionally, KEGG pathway enrichment analysis indicated that tyrosine metabolism and ECM-receptor interaction were significantly enriched pathways in DEX-induced glaucoma. Tyrosine metabolism is attracting the attention of many investigators. Numerous studies have shown that protein phosphorylation can mediate cellular functions in a variety of life activities [23,24]. Vertebrate lonesome kinase (VLK) is a secretory tyrosine kinase that phosphorylates various ECM proteins [25], and DEX reportedly increases the expression of VLK in human TM cells, thereby regulating tyrosine phosphorylation (TyrP) of ECM proteins [26]. Thus, the homeostasis of AH outflow becomes disrupted. These enriched pathways may contribute to elucidating the pathogenesis of DEX-induced glaucoma and thus provide clues to the formulation of new therapeutic methods.
Serum amyloid A (SAA) genes include SAA1, SAA2, SAA3, and SAA4. SAA1 and SAA2 are stimulated by proinflammatory cytokines. Our study revealed significant differences in expression of SAA genes between DEX-treated anterior segment and the control anterior segment. This outcome is consistent with a previous study [27], leading us to speculate that these genes interfere with AH outflow. However, the physiological role of SAA genes in glaucoma remains elusive. SSA genes take part in a number of biological processes, including infection, inflammation, and tissue remolding, and the liver is an important location for SAA synthesis [28]. In addition, macrophages, smooth muscle cells, and endothelial cells are also involved in the production of SAA [29]. Acute-phase SAA (A-SAA) is encoded by SAA1/SAA2. Recombinant human A-SAA induces matrix metalloproteinase transcription [30]. Furthermore, it has been reported that recombinant SAA1 has chemoattractant properties in vivo [31]. These biological effects may elucidate the etiological role of SAA genes in DEX-induced glaucoma.
Among the 10 hub genes identified, chemokine (C-C motif) ligand 2 (CCL2) showed the highest degree. Several cells types, such as endothelial, fibroblasts, and monocytes, secrete CCL2, which is also known as monocyte chemotactic protein-1 (MCP-1) [32]. Normal trabecular meshwork endothelial (TME) cells secrete considerable quantities of MCP1 in the absence of stimulus, and levels are increased in glaucomatous human TME cells [33]. Another study demonstrated that MCP-1 increases AH outflow through altering cell-cell contact in Schlemm’s canal endothelial cells [34]. Interestingly, some previous studies have proposed that GCs modulate the expression of MCP-1. Glucocorticoid-induced leucine zipper (GILZ) is a glucocorticoid-induced protein that affects anti-inflammatory processes [35]. One study indicated that exogenous GILZ inhibits lipopolysaccharide-induced MCP-1 expression in rat retinal vascular endothelial cells through enhancing p65 dephosphorylation [36]. In another study, investigators posited that GCs downregulated expression of CCL2 in lens epithelial cells, suggesting a potential role for CCL2 in GC-induced cataracts [37]. Furthermore, this study also showed that the transcription factor c-Jun binds to the promoter regions of CCL2 to mediate its expression in the pathogenesis of GC-induced cataracts [37]. Hence, we conclude that CCL2 may participate in a variety of biological processes. The physiological role of CCL2 in GC-induced glaucoma requires further investigation. In addition to CCL2, endothelin 1 (EDN1) is another significant hub gene. EDN1 is a peptide of 21 amino acids produced by cardiac myocytes and vascular endothelial cells. Nonpigmented ciliary epithelial cells could be one possible source for EDN1 production in ocular tissues [38]. EDN1 is found in AH, and its concentration is elevated in POAG patients [39]. A previous study revealed that GCs stimulate the expression of EDN1 in renal collecting duct cells [40]. Thus, GCs may stimulate the EDN1 to modulate the AH outflow.
We extracted 2 modules from the PPI network through MCODE analysis. Among the genes presented in the modules, we are particularly interested in parathyroid hormone-like hormone (PTHLH). The TM has a characteristic flexible layer-like structure that maintains normal function. Calcification may be involved in the pathophysiological process of the TM since this tissue has been reported to contain calcification markers [41,42]. PTHLH participates in calcium and phosphate homeostasis and is downregulated by vitamin D3 [43]. PTHLH may be an inhibitor of calcification. It was previously indicated that DEX downregulated expression of PLHTH in human TM cells [27]. Thus, the pathological role of PTHLH in DEX-induced glaucoma merits further investigation.
Conclusions
DEGs and pathways associated with DEX-induced glaucoma were identified in this study using bioinformatics analyses. In this work, tyrosine metabolism, cholesterol homeostasis, and ECM organization were revealed to be important mechanisms of DEX-induced glaucoma. SAA, CCL2, EDN1, and PTHLH could be potential biomarkers of GIG, which may contribute to improving diagnostic, therapeutic, and preventive methods. Our study provides greater understanding of the gene expression profile in the anterior segment of the human eye induced by DEX. Further experiments are required to verify the present findings in the near future.
Footnotes
Source of support: Departmental sources
Conflicts of interest
None.
References
- 1.Ramamoorthy S, Cidlowski JA. Corticosteroids: Mechanisms of action in health and disease. Rheum Dis Clin North Am. 2016;42(1):15–31. doi: 10.1016/j.rdc.2015.08.002. [DOI] [PMC free article] [PubMed] [Google Scholar]
- 2.Webster JC, Cidlowski JA. Mechanisms of glucocorticoid-receptor-mediated repression of gene expression. Trends Endocrinol Metab. 1999;10(10):396–402. doi: 10.1016/s1043-2760(99)00186-1. [DOI] [PubMed] [Google Scholar]
- 3.Clark AF, Wordinger RJ. The role of steroids in outflow resistance. Exp Eye Res. 2009;88(4):752–59. doi: 10.1016/j.exer.2008.10.004. [DOI] [PubMed] [Google Scholar]
- 4.Weinreb RN, Bloom E, Baxter JD, et al. Detection of glucocorticoid receptors in cultured human trabecular cells. Invest Ophthalmol Vis Sci. 1981;21(3):403–7. [PubMed] [Google Scholar]
- 5.Johnson D, Gottanka J, Flügel C, et al. Ultrastructural changes in the trabecular meshwork of human eyes treated with corticosteroids. Arch Ophthalmol. 1997;115(3):375–83. doi: 10.1001/archopht.1997.01100150377011. [DOI] [PubMed] [Google Scholar]
- 6.Kersey JP, Broadway DC. Corticosteroid-induced glaucoma: A review of the literature. Eye (Lond) 2006;20(4):407–16. doi: 10.1038/sj.eye.6701895. [DOI] [PubMed] [Google Scholar]
- 7.Wordinger RJ, Clark AF. Effects of glucocorticoids on the trabecular meshwork: Towards a better understanding of glaucoma. Prog Retin Eye Res. 1999;18(5):629–67. doi: 10.1016/s1350-9462(98)00035-4. [DOI] [PubMed] [Google Scholar]
- 8.Filla MS, Schwinn MK, Sheibani N, et al. Distinct β1 and β3 integrin pathways converge to regulate cross-linked actin network (CLAN) formation in human trabecular meshwork (HTM) cells. Invest Ophthalmol Vis Sci. 2009;50(12):5723–31. doi: 10.1167/iovs.08-3215. [DOI] [PMC free article] [PubMed] [Google Scholar]
- 9.Brakebusch C, Fassler R. The integrin-actin connection, an eternal love affair. EMBO J. 2003;22(10):2324–33. doi: 10.1093/emboj/cdg245. [DOI] [PMC free article] [PubMed] [Google Scholar]
- 10.Filla MS, Schwinn MK, Nosie AK, et al. Dexamethasone-associated cross-linked actin network formation in human trabecular meshwork cells involves 3 integrin signaling. Invest Ophthalmol Vis Sci. 2011;52(6):2952–59. doi: 10.1167/iovs.10-6618. [DOI] [PMC free article] [PubMed] [Google Scholar]
- 11.Hall A. Rho GTPases and the actin cytoskeleton. Science. 1998;279(5350):509–14. doi: 10.1126/science.279.5350.509. [DOI] [PubMed] [Google Scholar]
- 12.Yu M, Sun J, Peng W, et al. Protein expression in human trabecular meshwork: Downregulation of RhoGDI by dexamethasone in vitro. Mol Vis. 2010;16(27):213–23. [PMC free article] [PubMed] [Google Scholar]
- 13.Qiu X, Wu K, Lin X, et al. Dexamethasone Increases Cdc42 Expression in Human TM-1 Cells. Curr Eye Res. 2015;40(3):290–99. doi: 10.3109/02713683.2014.922191. [DOI] [PubMed] [Google Scholar]
- 14.Raghunathan VK, Morgan JT, Park SA, et al. Dexamethasone stiffens trabecular meshwork, trabecular meshwork cells, and matrix. Invest Ophthalmol Vis Sci. 2015;56(8):4447–59. doi: 10.1167/iovs.15-16739. [DOI] [PMC free article] [PubMed] [Google Scholar]
- 15.Barrett T, Wilhite SE, Ledoux P, et al. NCBI GEO: Archive for functional genomics data sets – update. Nucleic Acids Res. 2013;41(Database issue):D991–95. doi: 10.1093/nar/gks1193. [DOI] [PMC free article] [PubMed] [Google Scholar]
- 16.Blake JA, Christie KR, Dolan ME, et al. Gene Ontology Consortium: Going forward. Nucleic Acids Res. 2015;43(Database issue):1049–56. doi: 10.1093/nar/gku1179. [DOI] [PMC free article] [PubMed] [Google Scholar]
- 17.Kanehisa M, Sato Y, Kawashima M, et al. KEGG as a reference resource for gene and protein annotation. Nucleic Acids Res. 2016;44(Database issue):D457–62. doi: 10.1093/nar/gkv1070. [DOI] [PMC free article] [PubMed] [Google Scholar]
- 18.Huang DW, Sherman BT, Tan Q, et al. DAVID Bioinformatics Resources: Expanded annotation database and novel algorithms to better extract biology from large gene lists. Nucleic Acids Res. 2007;35(Web Server issue):W169–75. doi: 10.1093/nar/gkm415. [DOI] [PMC free article] [PubMed] [Google Scholar]
- 19.Szklarczyk D, Franceschini A, Wyder S, et al. STRING v10: Protein–protein interaction networks, integrated over the tree of life. Nucleic Acids Res. 2015;43(Database issue):D447–52. doi: 10.1093/nar/gku1003. [DOI] [PMC free article] [PubMed] [Google Scholar]
- 20.Li G, Cui G, Dismuke WM, et al. Differential response and withdrawal profile of glucocorticoid-treated human trabecular meshwork cells. Exp Eye Res. 2017;155:38–46. doi: 10.1016/j.exer.2016.12.002. [DOI] [PMC free article] [PubMed] [Google Scholar]
- 21.Overby DR, Clark AF. Animal models of glucocorticoid-induced glaucoma. Exp Eye Res. 2015;141:15–22. doi: 10.1016/j.exer.2015.06.002. [DOI] [PMC free article] [PubMed] [Google Scholar]
- 22.Villarreal G, Jr, Chatterjee A, Oh SS, et al. Pharmacological regulation of SPARC by lovastatin in human trabecular meshwork cells. Invest Ophthalmol Vis Sci. 2014;55(3):1657–65. doi: 10.1167/iovs.13-12712. [DOI] [PMC free article] [PubMed] [Google Scholar]
- 23.Cohen P. The origins of protein phosphorylation. Nat Cell Biol. 2002;4(5):127–30. doi: 10.1038/ncb0502-e127. [DOI] [PubMed] [Google Scholar]
- 24.Fischer EH. Phosphorylase and the origin of reversible protein phosphorylation. Biol Chem. 2010;391(2–3):131–37. doi: 10.1515/bc.2010.011. [DOI] [PubMed] [Google Scholar]
- 25.Bordoli MR, Yum J, Breitkopf SB, et al. A secreted tyrosine kinase acts in the extracellular environment. Cell. 2014;158(5):1033–44. doi: 10.1016/j.cell.2014.06.048. [DOI] [PMC free article] [PubMed] [Google Scholar]
- 26.Maddala R, Skiba NP, Rao PV. Vertebrate lonesome kinase regulated extracellular matrix protein phosphorylation, cell shape and adhesion in trabecular meshwork cells. J Cell Physiol. 2017;232(9):2447–60. doi: 10.1002/jcp.25582. [DOI] [PMC free article] [PubMed] [Google Scholar]
- 27.Rozsa FW, Reed DM, Scott KM, et al. Gene expression profile of human trabecular meshwork cells in response to long-term dexamethasone exposure. Mol Vis. 2006;12(14–15):125–41. [PubMed] [Google Scholar]
- 28.Lecchi C, Dilda F, Sartorelli P, et al. Widespread expression of SAA and Hp RNA in bovine tissues after evaluation of suitable reference genes. Vet Immunol Immunopathol. 2012;145(1–2):556–62. doi: 10.1016/j.vetimm.2011.12.017. [DOI] [PubMed] [Google Scholar]
- 29.Meek RL, Urielishoval S, Benditt EP. Expression of apolipoprotein serum amyloid A mRNA in human atherosclerotic lesions and cultured vascular cells: Implications for serum amyloid A function. Proc Natl Acad Sci USA. 1994;91(8):3186–90. doi: 10.1073/pnas.91.8.3186. [DOI] [PMC free article] [PubMed] [Google Scholar]
- 30.Upragarin N, Landman WJ, Gaastra W, et al. Extrahepatic production of acute phase serum amyloid A. Histol Histopathol. 2005;20(4):1295–307. doi: 10.14670/HH-20.1295. [DOI] [PubMed] [Google Scholar]
- 31.Patel H, Fellowes R, Coade S, et al. Human serum amyloid A has cytokine-like properties. Scand J Immunol. 1998;48(4):410–18. doi: 10.1046/j.1365-3083.1998.00394.x. [DOI] [PubMed] [Google Scholar]
- 32.Gu L, Tseng SC, Rollins BJ. Monocyte chemoattractant protein-1. Chem Immunol. 1999;72:7–29. doi: 10.1159/000058723. [DOI] [PubMed] [Google Scholar]
- 33.Shifera AS, Trivedi S, Chau P, et al. Constitutive secretion of chemokines by cultured human trabecular meshwork cells. Exp Eye Res. 2010;91(1):42–47. doi: 10.1016/j.exer.2010.04.001. [DOI] [PubMed] [Google Scholar]
- 34.Tsuboi N, Inoue T, Kawai M, et al. The effect of monocyte chemoattractant protein-1/CC chemokine ligand 2 on aqueous humor outflow facility. Invest Ophthalmol Vis Sci. 2012;53(10):6702–7. doi: 10.1167/iovs.12-10376. [DOI] [PubMed] [Google Scholar]
- 35.D’Adamio F, Zollo O, Moraca R, et al. A new dexamethasone induced gene of the leucine zipper family protects t lymphocytes from TCR/CD3-activated cell death. Immunity. 1997;7(6):803–12. doi: 10.1016/s1074-7613(00)80398-2. [DOI] [PubMed] [Google Scholar]
- 36.Gu R, Lei B, Jiang C, et al. Glucocorticoid-induced leucine zipper suppresses ICAM-1 and MCP-1 expression by dephosphorylation of NF-κB p65 in retinal endothelial cells. Invest Ophthalmol Vis Sci. 2017;58(1):631–41. doi: 10.1167/iovs.16-20933. [DOI] [PubMed] [Google Scholar]
- 37.Zhou D, Zhang Y, Wang L, et al. Identification of genes and transcription factors associated with glucocorticoid response in lens epithelial cells. Mol Med Rep. 2015;11(6):4073–78. doi: 10.3892/mmr.2015.3308. [DOI] [PMC free article] [PubMed] [Google Scholar]
- 38.Prasanna G, Dibas A, Tao W, et al. Regulation of endothelin-1 in human non-pigmented ciliary epithelial cells by tumor necrosis factor-α. Exp Eye Res. 1998;66(1):9–18. doi: 10.1006/exer.1997.0407. [DOI] [PubMed] [Google Scholar]
- 39.Choritz L, Machert M, Thieme H. Correlation of endothelin-1 concentration in aqueous humor with intraocular pressure in primary open angle and pseudoexfoliation glaucoma. Invest Ophthalmol Vis Sci. 2012;53(11):7336–42. doi: 10.1167/iovs.12-10216. [DOI] [PubMed] [Google Scholar]
- 40.Stow LR, Voren GE, Gumz ML, et al. Dexamethasone stimulates endothelin-1 gene expression in renal collecting duct cells. Steroids. 2012;77(5):360–66. doi: 10.1016/j.steroids.2011.12.011. [DOI] [PMC free article] [PubMed] [Google Scholar]
- 41.Xue W, Comes N, Borra’s T. Presence of an established calcification marker in trabecular meshwork tissue of glaucoma donors. Invest Ophthalmol Vis Sci. 2007;48(7):3184–94. doi: 10.1167/iovs.06-1403. [DOI] [PMC free article] [PubMed] [Google Scholar]
- 42.Xue W, Wallin R, Olmsted-Davis EA, et al. Matrix GLA protein function in human trabecular meshwork cells: Inhibition of BMP2-induced calcification process. Invest Ophthalmol Vis Sci. 2006;47(3):997–1007. doi: 10.1167/iovs.05-1106. [DOI] [PMC free article] [PubMed] [Google Scholar]
- 43.Okazaki T, Nishimori S, Ogata E, et al. Vitamin D-dependent recruitment of DNA-PK to the chromatinized negative vitamin D response element in the PTHrP gene is required for gene repression by vitamin D. Biochem Biophys Res Commun. 2003;304(4):632–37. doi: 10.1016/s0006-291x(03)00651-x. [DOI] [PubMed] [Google Scholar]


