

Abstract
Cholinergic–glutamatergic interactions influence forms of synaptic plasticity that are thought to mediate memory and learning. We tested in vitro the induction of long-lasting synaptic enhancement at Schaffer collaterals by acetylcholine (ACh) at the apical dendrite of CA1 pyramidal neurons and in vivo by stimulation of cholinergic afferents. In vitro ACh induced a Ca2+ wave and synaptic enhancement mediated by insertion of AMPA receptors in spines. Activation of muscarinic ACh receptors (mAChRs) and Ca2+ release from inositol 1,4,5-trisphosphate (IP3)-sensitive stores were required for this synaptic enhancement that was insensitive to blockade of NMDA receptors and also triggered by IP3 uncaging. Activation of cholinergic afferents in vivo induced an analogous atropine-sensitive synaptic enhancement. We describe a novel form of synaptic enhancement (LTPIP3) that is induced in vitro and in vivo by activation of mAChRs. We conclude that Ca2+ released from postsynaptic endoplasmic reticulum stores is the critical event in the induction of this unique form of long-lasting synaptic enhancement.
Keywords: LTPIP3, endoplasmic reticulum, Ca2+ wave, AMPA trafficking, inositol, muscarinic
Introduction
Activity-dependent long-term modifications in synaptic efficacy are thought to be the cellular basis of memory and learning, but the causal mechanisms of these synaptic changes are still controversial and more diverse than previously considered. Insufficiently explored examples are the interactions between different neurotransmitter systems in synaptic plasticity. Cholinergic–glutamatergic interactions can influence forms of synaptic plasticity in the hippocampus (Aigner, 1995; Ovsepian et al., 2004) that may underlie cognitive processes (Blokland, 1995; Hasselmo, 1999; Shinoe et al., 2005), and lesions of the septohippocampal cholinergic projections produce cognitive deficits. Septohippocampal afferents release acetylcholine (ACh) and trigger the hippocampal theta rhythm (Dudar, 1977) that has been related to learning and memory (Huerta and Lisman, 1995; Hoffman et al., 2002). Protracted activation of muscarinic ACh receptors (mAChRs) may induce increases in glutamatergic synaptic efficacy (Auerbach and Segal, 1994, 1996), suggesting that cholinergic activity may be central in memory encoding (Hasselmo, 1999).
The production of inositol 1,4,5-trisphosphate (IP3) induced by mAChR activation triggers the major mechanism of Ca2+ release from endoplasmic reticulum (ER) stores in CA1 pyramidal neurons (Power and Sah, 2002). M1 and M3 mAChRs are coupled to phospholipase C (PLC) and via heterotrimeric G-protein (Gq/11) hydrolyze phosphatidylinositol 4,5-bisphosphate, producing IP3 and diacylglycerol (Abe et al., 1992). IP3 activates IP3 receptors (IP3Rs) that induce Ca2+ release from IP3-sensitive ER stores. The rise in intracellular Ca2+ may regulate a number of processes, including synaptic plasticity (Rose and Konnerth, 2001; Bardo et al., 2006), that are thought to occur in dendritic spines, as was initially advanced by Ramón y Cajal (1891).
Because a rise in postsynaptic Ca2+ can lead to synaptic enhancement (Zucker, 1999; Rose and Konnerth, 2001), we tested the synaptic effects in vitro of a brief local application (puff) of the natural transmitter ACh at the apical dendrites of CA1 pyramidal cells and of in vivo activation of septohippocampal cholinergic afferents. We report that ACh induced both a slow Ca2+ wave that propagates along the apical dendritic shaft and a long-lasting enhancement of Schaffer collateral (SC) EPSCs. Activation of M1 mAChRs and release of Ca2+ from IP3-sensitive stores are required to induce this long-lasting synaptic enhancement that we called LTPIP3. LTPIP3 is insensitive to block of NMDA receptors (NMDARs) and is paralleled by an increased expression of AMPA receptors (AMPARs) in spines. This novel IP3-dependent form of synaptic enhancement requires Ca2+ release from ER stores without the need of correlated presynaptic–postsynaptic action potentials.
Materials and Methods
Procedures of animal care, surgery, and slice preparation were in accordance with the guidelines laid down by the European Communities Council. The procedures will be described briefly because they have been extensively detailed previously (Borde et al., 1995; Fernandez de Sevilla and Buno, 2003).
Slice preparation.
Young Wistar rats (14–16 d of age) were decapitated, and the brain was removed and submerged in cold (∼4°C) artificial CSF (ACSF; in mm: 124.00 NaCl, 2.69 KCl, 1.25 KH2PO4, 2.00 Mg2SO4, 26.00 NaHCO3, 2.00 CaCl2, and 10.00 glucose). The pH was stabilized at 7.4 by bubbling the ACSF with carbogen (95% O2, 5% CO2). Picrotoxin (50 μm) was added to the ACSF to block GABAA-mediated inhibition. In these conditions, abnormal epileptiform activity was never observed in our sample. Transverse hippocampal slices (300–350 μm thick) were cut with a Vibratome (Pelco 3000; Pelco, St. Louis, MO) and incubated in the ACSF (>1 h, at room temperature, 20–22°C). Slices were transferred to a 2 ml chamber fixed to an upright microscope stage (BX51WI; Olympus, Tokyo, Japan) equipped with infrared differential interference contrast video microscopy and a 40× water-immersion objective. Slices were superfused with carbogen-bubbled ACSF (2 ml/min) and maintained at room temperature. In some cases, experiments at higher temperatures in the more physiological range of 32°C were also performed. dl-2-Amino-5-phosphonovaleric acid (APV; 50 μm), 6-cyano-7-nitroquinoxaline-2,3-dione (CNQX; 20 μm), (+)-α-methyl-4-carboxyphenylglycine (MCPG; 1 mm), atropine (0.3 μm), pirenzepine (75 nm), methoctramine (1 μm), methyllycaconitine (MLA; 0.1 μm; in some cases, higher doses of MLA, up to 125 μm, were used), thapsigargin (1 μm), and tetrodotoxin (TTX; 100 nm) were added to the ACSF as needed. Thapsigargin was dissolved in DMSO (0.01%). DMSO at the final concentrations used had no effects on synaptic responses or postsynaptic conductances (n = 3).
Recordings and analysis.
Whole-cell recordings from soma of CA1 pyramidal cells were performed with patch pipettes (4–8 MΩ) filled with an internal solution that contained (in mm) 135 K-MeSO4, 10 HEPES, 0.2 EGTA, 2 Na2-ATP, and 0.4 Na3-GTP, buffered to pH 7.2–7.3 with KOH. In some experiments, the intracellular solutions contained heparin (5 mg/ml), ruthenium red (400 μm), or 1,2-bis (o-aminophenoxy) ethane-N,N,N′,N′-tetraacetic acid (BAPTA; 50 mm). Recordings were performed in the voltage-clamp mode using a Cornerstone PC-ONE amplifier (DAGAN, Minneapolis, MN). Pipettes were placed with a hydraulic micromanipulator (Narishige, Tokyo, Japan). The holding potential (V h) was adjusted to −60 mV, and the series resistance was compensated to ∼80%. Neurons were accepted only when the seal resistance was >1 GΩ and the series resistance (10–20 MΩ) did not change >10% during the experiment. Data were high-pass filtered at 3.0 kHz and sampled at 10.0 kHz, through a Digidata 1322A (Molecular Devices, Sunnyvale, CA). The pClamp programs (Molecular Devices) were used to generate stimulus timing signals and transmembrane current pulses, and to record and analyze data. EPSCs were evoked by stimulation of SC with a nichrome bipolar electrode (60 μm diameter; tip separation, ∼100 μm) placed in the stratum radiatum ∼100–200 μm from the soma of the recorded neuron. A Grass S88 and SIU (Quincy, MA) generated the stimulation pulse protocols. Stimulation intensity was adjusted to evoke EPSC amplitudes between 30 and 60 pA. Brief, localized, ACh puffs (300 ms duration) were applied through a pipette (tip diameter, ∼5 μm) loaded with ACh (1 mm) and connected to a Picospritzer II (General Valve, Fairfield, NJ). The pipette tip was placed during the puff with a hydraulic micromanipulator (Narishige) close (∼20–50 μm) to the apical dendritic shaft ∼20 μm from the soma of the recorded CA1 pyramidal neuron and withdrawn from the tissue immediately after the puff. Chemicals were purchased from Sigma-Aldrich Química (Madrid, Spain), Tocris Bioscience (Ellisville, MO; distributed by Biogen Científica, Madrid, Spain), and Alomone Labs (Jerusalem, Israel).
Ca2+ imaging and photolysis of caged IP3.
Simultaneous electrophysiology recordings and intracellular Ca2+ imaging were obtained. The latter was performed by fluorescence microscopy with the Ca2+ indicator fluo-3 (Invitrogen, Eugene, OR). Patch pipettes were filled with the internal solution containing 50–100 μm fluo-3. Imaging experiments were performed after a 10–15 min stabilization period that allowed the equilibration of the dye in the soma and apical dendritic shaft. Cells were illuminated during 40 ms every 200 ms at 490 nm with a monochromator (Polychrome IV; TILL Photonics, Planegg, Germany), and successive images were obtained at 5 s−1 with a cooled monochrome CCD camera (Cohu 4920; San Diego, CA) attached to the Olympus microscope that was equipped with a filter cube (Chroma Technology, Rockingham, VT) optimized for fluo-3. Camera control, synchronization with electrophysiological measurements, and quantitative epifluorescence measurements were made with the ImagingWorkbench software (INDEC-BioSystems, Santa Clara, CA). Changes in fluorescence signals were expressed as the proportion (percentage) of relative change in fluorescence (ΔF/F 0), where F 0 is the prestimulus fluorescence level when the cell is at rest and ΔF is the change in fluorescence during activity. Plots of Ca2+ signal variations versus time were obtained “off-line” at specified regions of interest from stored image stacks and expressed as ΔF/F 0. Corrections were made for indicator bleaching during trials by subtracting the signal measured under the same conditions when the cell was not stimulated. The off rate of fluo-3 is fast enough to detect Ca2+ decay time constants of ∼80 ms (Markram et al., 1995), which are well below those measured in our experiments. Therefore the differences in decay time course between the Ca2+ signals reported in Results should reflect differences in Ca2+ decay rates.
Flash photolysis of caged IP3 was performed after filling pyramidal neurons with a pipette solution that contained fluo-3 and caged IP3 (Calbiochem, La Jolla, CA) at 100 μm. The cell was illuminated with a flash unit (UV Flash II; TILL Photonics) attached to the microscope through a dual port condenser, and simultaneous electrophysiological recordings and Ca2+ imaging were carried out.
An average baseline of control EPSCs was obtained by repeated stimulation at 0.3 Hz, and the magnitude of the average changes in peak EPSC amplitude induced by the various procedures tested were expressed as a proportion (percentage) of the baseline control amplitude and plotted as a function of time. Statistical estimations were performed with the maximum peak EPSC values in the course of the LTPIP3 and when the EPSC amplitude had attained a steady state (30 min after the LTPIP3 induction). The presynaptic or postsynaptic origin of the changes in EPSC amplitude was estimated using the paired-pulse ratio (PPR; R2/R1), where R1 and R2 were the average peak amplitudes of the first and second EPSCs, respectively (Fernandez de Sevilla et al., 2002). Statistical analysis was performed using the Origin 7.0 program (OriginLab, Northampton, MA).
Analysis of AMPAR trafficking.
The super-ecliptic pHluorin (SEP) coding sequence was inserted three amino acids downstream of the predicted signal peptide cleavage site of the corresponding AMPAR subunit. The red fluorescent protein (tDimer dsRed) is a fast maturing obligate dimer version of dsRed. We generated a Sindbis virus with a double promoter that drives expression of GluR-SEP and tDimer dsRed. We infected CA1 pyramidal neurons in vivo by injecting Wistar rats (12 d of age) with GluR1-SEP- and GluR2-SEP-expressing Sindbis viruses (both viruses also expressing tDimer dsRed) and allowed to express for 36–48 h. Then the animals were killed, and transverse slices were obtained as described above.
Two-photon laser-scanning microscopy high-resolution three-dimensional image stacks were collected on a custom-built instrument based on a Fluoview laser-scanning microscope (Olympus America, Melville, NY). The light source was a mode-locked Ti:sapphire laser (Mira 900F; Mira, Santa Clara, CA) running at 910 nm. We used a LUMPlanFl/IR 40× 0.80 numerical aperture objective. Each optical section was resampled three times and was captured every 0.5 μm. Two full stacks were captured (at −10 and 0 min) before LTPIP3 induction and two more stacks at 30 and 60 min after induction of LTP.
Spines were analyzed using custom software written in MatLab (The MathWorks, Natick, MA) and identified using the tDimer channel. Rectangular regions of interest were manually positioned to fully cover each spine. Individual spines were numbered and followed in a time-lapse recording. When the identity of a protrusion was unclear (for instance, two spines appear as one), the specific spine was not included in the analysis. In addition, no effort was made to analyze spines emerging below or above the dendrite, because the two-photon excitation laser-scanning microscopy resolution of these is compromised. Dendrite regions of interest were placed at the base of each spine centered on the dendrite with approximately the same area as the corresponding spine regions of interest. Total integrated fluorescence (in arbitrary units) for both green and red channels was computed for each section in a stack. Background and spillover (from the other channel) fluorescence were subtracted to generate a background- and spillover-subtracted integrated fluorescence value for each channel as a function of depth. The potential effects of Forster resonance energy transfer (FRET) between SEP and tDimer were not compensated given the highly unlikely occurrence of FRET across a membrane between no linked fluorophores. For dendrites, the mean pixel fluorescence (rather than integrated fluorescence) was taken within these boundaries to negate any effect that alterations in the size of the selected region would have. Enrichment of receptors on spines was defined as (Spine green/Spine red)/(Dendrite green/Dendrite red); this fluorescence ratio is used as a relative, not absolute, means of determining enrichment.
In vivo experiments.
Data were obtained from 18 urethane-anesthetized (1.6 g/kg, i.p.) young adult Wistar rats (between 3 and 4 months of age) of either sex, weighing 180–250 g. Animals were placed in a stereotaxic device. The body temperature was maintained at 37°C, and the end-tidal CO2 concentration was monitored. Experiments were performed in accordance with the European Communities Council Directive (86/609/EEC). Extracellular recordings were with tungsten macroelectrodes (1 MΩ) implanted in the CA1 region [anterior (A), −2.3; lateral (L), 1; vertical (V), 2.5 mm from bregma]. SC fibers were stimulated using a bipolar stainless steel stimulating electrode (0.1 mm diameter) placed in the stratum radiatum (A, −2.3; L, 4; V, 4 mm from bregma). The medial septum (A, −0.2; L, 0; V, 7 mm from bregma) was also stimulated using a similar bipolar electrode. Electrodes were placed stereotaxically according to the Paxinos and Watson (1986) atlas. Extracellular excitatory postsynaptic field potentials (fEPSPs) were recorded in the CA1 layer. fEPSPs were amplified (AC amplifier; World Precision Instruments, Sarasota, FL), bandpass filtered between 0.1 Hz and 1.0 kHz, and digitized at 3.0 kHz (CED 1401 with Spike 2 software; Cambridge Electronic Design, Cambridge, UK). A control baseline fEPSP was obtained with single-pulse stimulation (100 μA, 0.3 ms, 0.5 Hz) applied at the SCs during 4 min. fEPSP averages (n = 15) were calculated every 60 s, and the slope of the initial phase was taken as an estimation of the magnitude of the fEPSP. Data was presented as the proportion of changes (100%) relative to the mean control baseline fEPSP slope calculated throughout the initial 4 min. Recordings were accepted for analysis when baseline variability was <10%. The high-frequency stimulation (HFS) of the medial septum used to induce long-term potentiation (LTP) consisted of three 500 ms duration pulse barrages of 100 μA, 0.3 ms pulses at 100 Hz presented every 2 s delivered without SC stimulation. The stimulation frequency of 100 Hz is similar to the discharge rate exhibited by groups of medial septal neurons (Gaztelu and Buno, 1982; Zenchenko et al., 2000), suggesting that high firing rate activity could be present in physiological conditions.
Recording was maintained for 60 min after the tetanic stimulation. Similar recordings were performed in control conditions and after intraperitoneal injection of atropine sulfate (5 mg/kg). Chemicals were purchased from Sigma-Aldrich Química.
Statistical analysis.
Results are given as mean ± SEM (n = number of cells or number of experiments in extracellular recordings), and percentages are presented as percentage of controls. Statistical analyses were calculated with Student's two-tailed t tests for unpaired or paired data as required. The threshold level of significance was set at p < 0.05 (*); p < 0.01 (**), and p < 0.001 (***).
Results
ACh induces a postsynaptic Ca2+ elevation and long-lasting synaptic enhancement
A brief ACh puff (300 ms duration) applied at the apical dendritic shaft (∼20 μm from the soma) induced an EPSC inhibition (a 48.5 ± 9.5% peak amplitude reduction; p < 0.001; lasting 2.1 ± 0.8 min; n = 20), caused by mAChR-mediated blockade of N-type Ca2+ channels at SC terminals (Valentino and Dingledine, 1981; Qian and Saggau, 1997). This presynaptic inhibition was paralleled by a long-lasting inward current (Fig. 1 A) caused by the suppression of several potassium conductances mediated by postsynaptic mAChRs (Dutar and Nicoll, 1988). These initial effects of ACh were followed by a strong and sustained increase in EPSC peak amplitude or LTPIP3 (a 205.5 ± 14.0% increase; p < 0.001; same cells) (Fig. 1 A). The magnitude of the presynaptic inhibition was essentially identical to that obtained by electrical stimulation of hippocampal cholinergic afferent fibers, suggesting that the ACh puff activated a group of receptors similar to that activated by the more physiological afferent stimulation (Fernandez de Sevilla and Buno, 2003).
Figure 1.

ACh induces a Ca2+ wave and long-lasting synaptic enhancement. A, Top, Representative EPSCs (brief inward deflections) and inward current induced by ACh application. A, Middle, Representative averaged EPSCs (n = 20; as in all other cases) before (1) and during synaptic inhibition (2) and enhancement (3) induced by ACh application. A, Bottom, Time course of the EPSC amplitude (percentage) during the induction of LTPIP3 by ACh (black arrow; n = 20). B, Top, Representative CA1 pyramidal neuron loaded with fluo-3 (100 μm) and the superimposed Ca2+ signals recorded at four different sites in the dendrite (white arrows 1, 2, 3, and 4). Note that the fluorescence signal originates in the distal part of the dendrite (1) and increases as it spreads to the soma (4). Scale bar, 35 μm. B, Bottom, Averaged somatic Ca2+ signal induced by ACh and superimposed EPSCs before (Control; black trace) and after ACh (30 min after ACh as in all other figures; gray trace) showing the potentiation.
Simultaneous electrophysiology and Ca2+ imaging revealed that the ACh puff was followed at brief delays (1.9 ± 0.2 s; n = 20) by a strong increase of the intracellular Ca2+ signal (39.5 ± 5.2%; n = 20 measured at the soma) that occurred in parallel with the presynaptic inhibition and with the initial portion of the long-lasting inward current. The Ca2+ elevations induced by the ACh puffs always preceded (6.2 ± 2.6 min) the onset of the synaptic enhancement (Fig. 1 B, Control), started distally in the apical dendrite, usually at the first branch point far (∼150 μm) from the ACh application site, and rapidly propagated to the soma at a constant speed of ∼100.5 ± 20.7 μm · s−1 (n = 20) (Fig. 1 B; see supplemental video 1, available at www.jneurosci.org as supplemental material). The Ca2+ signal gradually increased in duration on its way to the soma (analyzed from similar areas of interest along the apical dendritic shaft and soma). The Ca2+ signal in the apical dendrite ∼150 μm from the soma had a ΔF/F 0 of 10.5 ± 2.1% and lasted 1.5 ± 0.2 s (n = 20), whereas the large prolonged somatic Ca2+ signal had a ΔF/F 0 of 39.5 ± 5.2% and lasted 10.2 ± 2.0 s (same cells). The mean total duration of the Ca2+ signal from its onset at the dendritic branch point to its termination at the soma was 13.8. ± 2.6 s (same cells) (Fig. 1 B).
The postsynaptic Ca2+ elevation and long-lasting synaptic enhancement require activation of M1 mAChR
Activation of mAChRs may facilitate the induction of LTP with conventional stimulation protocols, and forms of LTP may be induced by activation of mAChRs (see Introduction). We tested the effects of the wide-spectrum mAChR antagonist atropine (0.3 μm) that suppressed both the Ca2+ wave and the LTPIP3, (data not shown) and of the specific M1 mAChR antagonist pirenzepine (75 nm). Blockade of M1 mAChRs with pirenzepine suppressed the Ca2+ wave and the persistent synaptic enhancement normally produced by the ACh puff (Fig. 2 A). Therefore, EPSCs recorded before and after the ACh challenge were essentially identical (p > 0.05 in both cases; n = 8) under pirenzepine (Fig. 2 B). Both atropine and pirenzepine suppressed the initial presynaptic inhibition without modifying control synaptic responses (p > 0.05 in both cases; n = 10 and n = 8, respectively). The long-lasting inward current was also suppressed by atropine, whereas it was insensitive to pirenzepine (data not shown).
Figure 2.

The postsynaptic Ca2+ elevation and long-lasting synaptic enhancement require M1 mAChR activation. A, Averaged somatic Ca2+ signal induced by ACh and the superimposed EPSCs before (Control; black trace) and after ACh (gray trace) during superfusion with pirenzepine (75 nm), MLA (0.1 μm), and methoctramine (1 μm). B, Summary data showing the ACh effect on the somatic Ca2+ signal (white bars) and post-ACh EPSC amplitude (black bars) in control ACSF (n = 20) and when pirenzepine (n = 8; p > 0.05), MLA (n = 8; p < 0.01), and methoctramine (n = 8; p < 0.01) were added.
Superfusion with the M2 mAChR antagonist methoctramine (1 μm) or with the α-7 nicotinic receptor antagonist MLA (0.1 μm) did not modify the initial presynaptic inhibition, the long-lasting inward current, the LTPIP3, nor the Ca2+ wave induced by ACh (Fig. 2 A,B) (p > 0.05; n = 8). However, when methoctramine was coapplied with pirenzepine, the long-lasting inward current was abolished (data not shown). To completely rule out a possible role of nAChRs, we applied higher doses of MLA (up to 125 μm; n = 6), and results were the same as those obtained with the lower doses (data not shown).
The above results are consistent with the initial inhibition, the rise of the intracellular Ca2+ signal, and the LTPIP3 being exclusively caused by activation of M1 mAChRs.
Both the Ca2+ wave and the long-lasting synaptic enhancement are mediated by IP3
The induction of many forms of long-lasting enhancement (e.g., LTP at SC synapses) requires the activation of NMDARs and Ca2+ influx through NMDAR/channels (Malenka et al., 1989; Zucker, 1999). However, inhibition of NMDARs with APV (50 μm) did not modify this synaptic enhancement (p > 0.05; n = 7) (Fig. 3 A). In this situation of isolation of the AMPA component of EPSCs (EPSCAMPA), the magnitude and time course of the synaptic enhancement induced by the ACh puff were essentially identical to those in control conditions. Pirenzepine also suppressed LTPIP3 of the EPSCAMPA isolated under block of NMDARs with APV (50 μm; p > 0.05; n = 6) (data not shown). Metabotropic glutamate receptors (mGluRs) have been shown to facilitate the induction of LTP (Cohen et al., 1998) and could contribute to this synaptic enhancement. However, MCPG (1 mm), a wide-spectrum mGluR antagonist, did not suppress this synaptic enhancement (p > 0.05; n = 6) (data not shown). Therefore, this synaptic enhancement does not rely on the activation of NMDARs or mGluRs.
Figure 3.

Both the Ca2+ wave and the long-lasting synaptic enhancement are mediated by IP3. A, Summary data showing the ACh effect on the somatic Ca2+ signal (white bars) and post-ACh EPSC amplitude (black bars) in control ACSF (n = 20), BAPTA (50 mm in the pipette solution; n = 6), APV (50 μm; n = 7), ruthenium red (400 μm RuRed in the pipette solution; n = 7), and heparin (5 mg/ml in the pipette solution; n = 8). Note the close relationship between the Ca2+ signal and the EPSC potentiation. The LTPIP3 induced by ACh is only prevented when the Ca2+ signal is blocked with heparin or BAPTA. B, Top, Representative somatic Ca2+ signal induced by IP3 uncaging (100 μm) and superimposed control EPSC (black trace) and 30 min after uncaging (gray trace) during LTP. B, Bottom, Time course of the EPSC amplitude changes (percentage) during the induction of LTPIP3 by IP3 uncaging (n = 7). C, Left, Representative Ca2+ signals induced by ACh application (5 min after breaking the seal), IP3 uncaging (10 min later), and superimposed control EPSC (black trace) and 30 min after uncaging (gray trace) during LTP. C, Right, Time course of the EPSC amplitude (percentage) during the induction of LTPIP3 by ACh (black arrow; n = 6) and by IP3 uncaging (black ray). Note the occlusion between the potentiation induced by the Ach “puff” and the one induced by IP3 uncaging.
The Ca2+ signal and the subsequent LTPIP3 were insensitive to blockade of NMDARs with APV (50 μm; n = 7; p > 0.05) and to intracellular loading with ruthenium red (400 μm RuRed; n = 7; p > 0.05) that inhibits Ca2+ release from ryanodine-sensitive ER stores (Fig. 3 A). A dominant and widespread action of M1 and M3 mAChR activation is the release of Ca2+ from IP3-sensitive ER stores via activation of IP3Rs (Power and Sah, 2002). Intracellular dialysis with heparin (5 mg/ml), an antagonist of IP3Rs, suppressed both the Ca2+ signal and the LTPIP3 (Fig. 3 A) (n = 8; p > 0.05). Depletion of Ca2+ stores with extracellular thapsigargin (1 μm; n = 4; data not shown) and intracellular Ca2+ chelation by BAPTA loading (50 mm in the pipette solution) also suppressed the Ca2+ signal and the LTPIP3 (n = 6; p > 0.05) (Fig. 3 A).
Therefore, the above results imply that a rise in intracellular Ca2+ released from IP3-sensitive ER stores preceded and was required for the induction of LTPIP3. In contrast, neither a contribution from ryanodine-sensitive Ca2+ stores nor of Ca2+ influx through NMDAR/channels were essential to generate LTPIP3.
In view of the above results, we tested the effects of photolysis of caged IP3 that releases Ca2+ from IP3-sensitive ER stores via direct activation of IP3Rs without participation of synthesis of IP3. Uncaging of IP3 induced a large, brief, synchronous rise in intracellular Ca2+ that had a larger magnitude at the soma than the apical dendrite (by 33.1 ± 9.7%; p < 0.01; n = 7). The Ca2+ rise was followed by synaptic enhancement (by 160.2 ± 9.7%; p < 0.05; n = 7) with characteristics essentially identical to the one induced by ACh puffs (Fig. 3 B; see supplemental video 2, available at www.jneurosci.org as supplemental material). In contrast, IP3 uncaging did not induce an inward current (data not shown) and was not preceded by presynaptic inhibition of EPSCs (Fig. 3 B). Therefore, these results are consistent with a functional relationship between the activation of IP3-sensitive stores, the subsequent release of Ca2+, and the induction of the LTPIP3. In addition, these results suggest that neither depolarization nor the initial presynaptic inhibition are required for the induction of LTPIP3.
We also analyzed the possible occlusion between the LTPIP3 induced by the ACh puff and that generated by the uncaging of IP3. We loaded cells with the caged IP3 and recorded a control stable baseline EPSC during the first 5 min after breaking the seal. An ACh puff was then delivered to induce the LTPIP3, and 10 min later, when the EPSC amplitude had increased (205.2 ± 15.6% of controls; p < 0.001; n = 6), we flashed the loaded cell to uncage the IP3. The IP3 uncaging did not modify the LTPIP3 induced by the ACh puff (215.2 ± 17.6% of controls; p > 0.05; n = 6) (Fig. 3 C). These results imply an occlusion between both methods of LTP induction, suggesting that they share common postsynaptic mechanisms where activation of IP3Rs is required.
Finally, to determine whether the LTPIP3 was present at more physiological temperatures, we repeated the above analysis at 32°C. ACh induced similar postsynaptic Ca2+ elevations and long-lasting enhancements of synaptic transmission that were blocked by pirenzepine at the higher temperature of 32°C. In addition, IP3 uncaging also induced the LTPIP3 at 32°C (see supplemental Fig. 1, available at www.jneurosci.org as supplemental material), suggesting that similar mechanisms could be present in the natural condition.
LTPIP3 is paralleled by an increased expression of AMPARs in dendritic spines
Changes in postsynaptic responsiveness to presynaptically released glutamate might be mediated by a change in AMPAR number at the postsynaptic membrane (Malinow and Malenka, 2002). To determine whether AMPARs are inserted during the cholinergically induced LTPIP3, we analyzed the effect of ACh on the content of recombinant AMPAR at the surface of spines of CA1 pyramidal neurons (Fig. 4). We expressed GluR1 or GluR2 tagged with the SEP, a pH-sensitive form of green fluorescence protein that marks surface AMPA receptors (Ashby et al., 2004; Kopec et al., 2006) using a Sindbis virus. CA1 pyramidal neurons infected with Sindbis virus-expressing GluR1-SEP subunit and t-dimer red protein were visualized before (control) and 30 min after ACh application (post-ACh) using the two-photon microscope (Fig. 4 A). ACh induced an increase in the spine green fluorescence signal (133.9 ± 8.0%; p < 0.001; n = 145 spines, 8 cells) without significant changes in the spine red signal (112.2 ± 8.2%; p > 0.05; same cells) nor in the red and green dendritic fluorescence signal (p > 0.05), indicating an increase of new GluR1 AMPARs at the spine surface without changes in the spine volume (Fig. 4 B). Moreover, in similar experiments using the GluR2-SEP subunit, ACh induced an increase of GluR2 AMPARs at the spine surface (spine green fluorescence signal, 128.6 ± 5.12%; p < 0.01; n = 75 spines, 6 cells) (Fig. 4 B) without significant changes in the spine or dendrite red signal, nor in the dendrite green signal (p > 0.05; same cells). Therefore, ACh induced the insertion of both GluR1 and GluR2 AMPARs at the spine surface of CA1 pyramidal neurons.
Figure 4.

ACh causes insertion of AMPARs in dendritic spines. A, Images of representative spines, expressing GluR1-SEP (top), GluR2-SEP (bottom), and t-dimer red protein, before (Control) and after ACh. Scale bar, 1 μm. Note the increase in the yellow signal 30 min after application of ACh in both GluR1- and GluR2-expressing spines without changes in spine volume. B, Summary data showing the ACh effect on the content of GluR1 (black circles; n = 145 spines, 8 cells; p < 0.001) and GluR2 (white circles; n = 75 spines, 6 cells; p < 0.01) on the spines.
Together the above results suggest that the LTPIP3 induced by the ACh puff was caused by an increase in the number of AMPARs expressed at the spines of CA1 pyramidal neurons.
Absence of presynaptic contribution to the LTPIP3
We analyzed whether LTPIP3 had a presynaptic component (Castillo et al., 2002) analyzing the changes in PPRs that are a sign of modifications in the release probability of the presynaptic terminal (Zucker, 1999; Fernandez de Sevilla et al., 2002; Oertner et al., 2002). Control PPRs were characterized by paired-pulse facilitation in which the second EPSC (R2) was larger than the first (R1), indicating that the group of stimulated synapses had on the average a low release probability. There were no modifications of the PPR with LTPIP3 (p > 0.05; n = 15) (Fig. 5 A), consistent with the lack of a presynaptic contribution. However, during the initial presynaptic inhibition, there was a transient increase in the PPR (data not shown) reflecting the decrease in the release probability as a result of the activation of presynaptic mAChRs (Fernandez de Sevilla et al., 2002; Cabezas and Buno, 2006).
Figure 5.

Absence of presynaptic contribution to the LTPIP3. A, Left, Superimposed representative EPSCs evoked by paired pulse stimulation before (control; black trace) and after ACh (gray trace) and the EPSCs scaled to show the lack of modification in the PPR. A, Right, Summary data (n = 15) showing the PPR (R2/R1; as a percentage of control). B, Top, Representative averaged extracellular responses before (1), 3 min after ACh (2), and ∼30 min after ACh (3). Note the absence of modification of the fiber volley. B, Bottom, Time course of the fEPSP slope (black circles) and fiber volley amplitude (white circles) during the initial inhibition and subsequent LTPIP3 after the ACh puff (black arrow; n = 15).
A possible increase in the excitability of the SC axons, leading to an increased number of SC axons recruited by a stimulating electrode, could account for the increased synaptic transmission induced by the ACh puff. To test this possibility, we recorded extracellularly the fiber volley and the fEPSP evoked by SC stimulation before, during, and 30 min after the ACh puff applied close to the recording electrode (∼250 μm) at the stratum pyramidal–radiatum border (Fig. 5 B, Control, during ACh, and Post-ACh, respectively). The fEPSP slope was initially reduced (47.5 ± 7.4%; p < 0.001; n = 15) and later potentiated (207.3 ± 11.9%; p < 0.001; n = 15) by the ACh puff; in contrast, the fiber volley, which records the number of presynaptic fibers activated, remained unaltered throughout the experiment (p > 0.5; n = 15) (Fig. 5 B).
Together these results suggest that LTPIP3 is exclusively mediated through postsynaptic mechanisms. LTPIP3 persisted up to 4 h, a duration that is similar to the LTP induced by classical HFS of SCs (Malenka and Bear, 2004) (see supplemental Fig. 1, available at www.jneurosci.org as supplemental material).
LTPIP3 does not require correlated AP activity
A property that typifies the induction of the classical LTP, the “Hebbian principle” (LTPH), is the need for correlated presynaptic and postsynaptic action potential (AP) activity. Therefore, to identify whether this rule was applicable to this form of LTP, we inhibited voltage-gated Na+ channels with TTX (100 nm), which blocks both presynaptic and postsynaptic APs and prevents evoked and spontaneous synaptic activity (Fig. 6 A,B). When SC EPSCs and postsynaptic APs (tested with brief depolarizing pulses) had disappeared, we applied the ACh puff. The typical long-lasting inward current (Fig. 6 A) and Ca2+ signal were evoked by the ACh puff (data not shown). After TTX washout, the EPSC gradually recovered, and ∼25 min later, a strong LTPIP3 was induced (by 201.3 ± 8.5%; p < 0.001; n = 10). A similar superfusion of TTX in control conditions in the absence of the ACh challenge did not modify EPSCs after a washout (data not shown; p > 0.05; n = 6). These results indicate that inhibition of voltage-gated Na+ channels and of presynaptic and postsynaptic AP activity did not contribute to LTPIP3.
Figure 6.
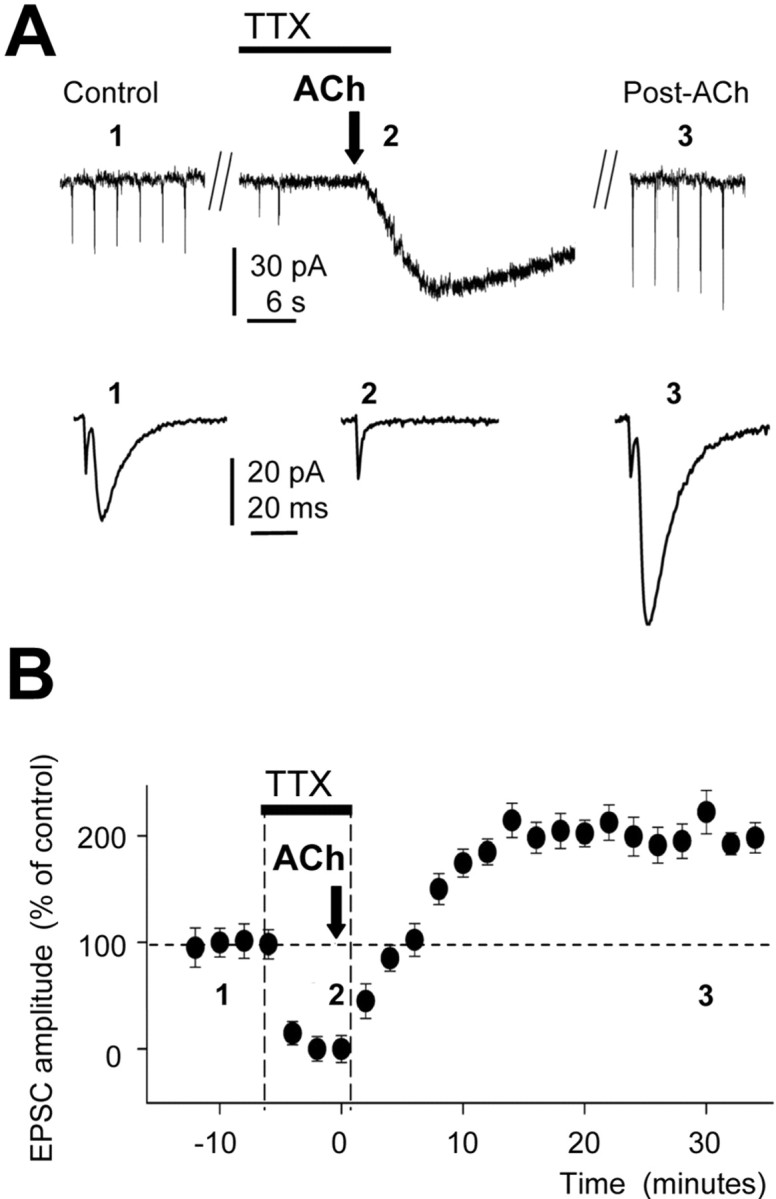
LTPIP3 does not require presynaptic and postsynaptic action potentials. A, Top, Representative recording showing the EPSCs in control (1), their absence after blockade of sodium channels with TTX (100 nm), and the slow inward current evoked by ACh application (2). Note the sustained EPSC potentiation recorded after 30 min of TTX washout (3; Post-ACh). A, Bottom, EPSCs recorded at 1, 2, and 3. B, Time course of the EPSC amplitude (percentage) during TTX, the induction of LTPIP3 by ACh (black arrow; n = 10), and washout in control solution.
LTPIP3 and LTPH can be superimposed
The possible interactions between LTPIP3 and the classical homosynaptic LTPH induced by HFS could have important functional implication. With extracellular recordings of fEPSPs that preserve the intracellular mechanisms required to induce the LTP otherwise dialyzed during prolonged whole-cell recordings, we induced LTPH by stimulating a group of SCs with 30 barrages (50 Hz, 1 s) at 0.5 Hz. When LTPH had stabilized ∼25 min later (at 209.1 ± 25.1% of control values; p < 0.001; n = 6), we applied an ACh puff as described above (Fig. 7 B, filled circles). The ACh puff first evoked the initial presynaptic inhibition of the fEPSPs, but of much longer duration (∼10 min) than that observed in the absence of a previous LTPH. The inhibition was followed by an LTPIP3 that reached values of 490.1 ± 25.8% of controls (p < 0.001; n = 6). The first LTP induction protocol enhanced fEPSP slopes by ∼200%, and the second augmented fEPSPs an extra ∼200%, the LTP reaching a final value of ∼400%. Although in these experiments LTPH was not saturated, we can conclude that within the amplitudes analyzed both types of LTP tended to add linearly. We checked that the presynaptic fiber volley remained unchanged throughout the recording and when fEPSPs were inhibited with CNQX (20 μm). Finally, we applied 100 nm TTX that completely blocked the presynaptic fiber volley (Fig. 7 B, open circles).
Figure 7.

LTPIP3 and LTPH can be superimposed. A, Representative extracellular recordings in control (1), after HFS of SCs (2), after an ACh puff (3), and during LTPIP3 (4). The effects of blockade of EPSCAMPA with 20 μm CNQX (5) and of voltage-gated Na+ conductances by 100 nm TTX (6) are also shown. B, Time course of the fEPSP slope and fiber volley amplitude (filled and open circles, respectively) in control (1), during the LTPH (2) induced by HFS and the LTPIP3 (4) induced by an ACh puff, and during CNQX (5) and TTX (6; n = 6).
Therefore, the classical homosynaptic LTPH and LTPIP3 can be superimposed. LTPIP3 may serve to ensure an increased synaptic efficacy not requiring activation of glutamatergic synapses and therefore not restricted to the activated synapses but localized close to the site at which mAChRs were activated. In contrast, LTPH requires the activation of glutamatergic synapses and is restricted to the activated synapses. Therefore, the two regulatory mechanisms may coexist and perform different functions in the same neurons.
An atropine-sensitive long-lasting synaptic enhancement can be induced in vivo by stimulation of the medial septum
We tested the effects of tetanic stimulation of medial septum cholinergic neurons on CA1 fEPSPs evoked by SC stimulation. The averaged fEPSP recorded in control conditions showed stable onset slopes throughout SC stimulation at 0.5 Hz during 70 min (Fig. 8 C). Tetanic stimulation of the medial septum with three 500-ms-duration pulse barrages of 100 μA, 0.3 ms pulses at 100 Hz presented every 2 s increased the SC fEPSP slope (Fig. 8 B). The facilitation of the fEPSP slope was maximal 5 min after tetanic stimulation and was stable (210 ± 19.9% of controls; p < 0.01; n = 6) for the remainder of the experiment that lasted up to 60 min (Fig. 8 C), a result consistent with the properties of an LTP (Malenka and Bear, 2004). To determine whether the LTP induced by the tetanic stimulation of the medial septum was mediated via activation of mAChRs, atropine was applied (5 mg/kg, i.p.) 10 min before the medial septum stimulation. In these conditions a modest facilitation of the SC fEPSP slope of 130.5 ± 11.2% was evoked (Fig. 8 C) (p < 0.05; n = 6). The reported brief and transient reduction of synaptic efficacy that followed septal stimuli during in vivo experiments (Rovira et al., 1983) was not observed in our study, most likely because this depression lasts <20 s, and its amplitude is at most 20% of the control fEPSP amplitude. Therefore, although possibly present in our experiments, the inhibition remained undetected because we averaged 1 min epochs, which possibly include the onset of LTP, thus canceling out the inhibition. Another possible explanation for the absence of transient depression in our experiments may arise from the slightly different septal stimulation protocols used by Rovira et al. (1983) (15 trains at 1/s of 10 pulses at 100 Hz) and by our group (3 trains at 1/2 s of 50 pulses at 100 Hz).
Figure 8.

An atropine-sensitive long-lasting synaptic enhancement induced in vivo by stimulation of the medial septum. A, Schematic diagram of the experimental setup showing a stimulating electrode placed in the septum (Septum St), another stimulating electrode placed in the CA3 region (SC St), and the recording electrode placed in the CA1 region (Recording). B, Top, Representative extracellular recordings in control (black trace) and after stimulation of the medial septum (gray trace). B, Bottom, Same as top, but under atropine (5 mg/kg). C, Time course of the fEPSP slope (percentage) in control (white circles), when septum is stimulated (black circles), and when septum is stimulated under atropine (gray triangles; n = 6).
Discussion
We describe novel mechanisms that mediate a long-lasting synaptic enhancement or LTPIP3 that is triggered both by a brief ACh puff applied at the apical dendrite and by stimulation of cholinergic septohippocampal afferents. LTPIP3 is expressed postsynaptically and requires the activation of M1 mAChRs, production of IP3, and release of Ca2+ from IP3-sensitive stores by the activation of IP3Rs. LTPIP3 does not need activation of NMDARs, does not comply with the “Hebbian” principle, and can be induced in vivo by tetanic stimulation of the medial septum.
A potentiation of SC EPSPs induced by carbachol (CCh) has been described by Auerbach and Segal (1994, 1996). In contrast with our results, the potentiation described by those authors was mediated via activation of M2 mAChRs and mainly caused by an enhancement of an NMDA component. The discrepancy between our results and those of Auerbach and Segal (1994, 1996) could reside in the prolonged presence of CCh in their case that may have stimulated both intracellular and circuit mechanisms not activated by the transient localized pulses of ACh used by us. Another possible cause is that muscarinic innervation of CA1 pyramidal cells changes markedly during development (Amenta et al., 1995), and the rats used by Auerbach and Segal were much older (>7 weeks and up to 36 months) than our sample (14–16 d). A specific potentiation of the NMDA component induced by ACh and mediated by M2 mAChRs and IP3 production has also been reported (Markram and Segal, 1990). This potentiation is also different from the LTPIP3 reported here because it is short-lived and required activation of NMDARs. Higher CCh concentrations than those used by Auerbach and Segal (1994, 1996) may induce long-term depression (LTD) in the rat visual cortex and hippocampus in vitro via activation of M1 mAChRs (Kirkwood et al., 1999; Scheiderer et al., 2006). However, in contrast to the LTPIP3, this LTD requires activation of NMDARs and correlated presynaptic and postsynaptic activity.
We show that the LTPIP3 is closely linked to the genesis of Ca2+ waves in the apical dendrites of CA1 pyramidal cells and that BAPTA loading, intracellular heparin, and thapsigargin, which inhibit Ca2+ waves and the increase of the intracellular Ca2+ concentration, suppress LTPIP3. In contrast, inhibition of Ca2+ release from ryanodine-sensitive ER stores with ruthenium red and inhibition of Ca2+ influx by inhibiting NMDARs with APV did not interfere with the Ca2+ signals, nor with LTPIP3. Moreover, LTPIP3 does not require membrane depolarization or Ca2+ influx through voltage-gated Ca2+ channels because both are absent in the LTPIP3 induced by IP3 uncaging. Therefore, the intracellular Ca2+ elevations required to induce this form of LTP were via Ca2+ release from IP3-sensitive ER stores.
The ER itself is thought to extend to all parts of the dendritic arbor and spines in Purkinje and CA1 pyramidal neurons (Spacek and Harris, 1997). These localizations agree with the sites that express IP3Rs in those cells (Sharp et al., 1993). ACh puffs triggered dendrosomatic Ca2+ waves with a delay, whereas IP3 uncaging produced a rapid synchronous Ca2+ elevation at the apical dendritic shaft and soma. The limiting factor in the delay between the ACh puff and the Ca2+ rise could be the time required for the production of IP3, whereas the activation of mAChRs and IP3Rs and the subsequent Ca2+ release contribute less to the delay. In addition, the differences between puffs and uncaging could indicate that Ca2+ waves induced by ACh puffs are not determined by the distribution of IP3R over the ER nor by the localization of membrane mAChRs (Bardo et al., 2006). The site of origin of the Ca2+ waves far from the ACh application site could be caused by the positive interaction between IP3 and Ca2+ occurring at sites where IP3 induced larger Ca2+ elevations (Mak et al., 2001).
The cholinergic innervation of the CA1 region originates both from extrinsic and intrinsic cholinergic neurons (Frotscher and Leranth, 1985; Frotscher et al., 2000). In the CA1 region, cholinergic afferents terminate both on pyramidal cells and interneurons, acting mainly through muscarinic receptors in the former and nicotinic receptors in the latter (Amenta et al., 1995). Although there is widespread expression of mAChRs, particularly of the M1 subtype, in both neuronal soma and dendrites in rat hippocampal pyramidal cells (Levey et al., 1995; Power and Sah, 2002), there is also controversy regarding the contribution of the mAChR type to the different muscarinic actions in the CA1 region (Dutar and Nicoll, 1988; Ovsepian et al., 2004; Shinoe et al., 2005).
Interestingly, several neurotransmitters can enhance receptor-mediated activation of PLC and IP3 production. Release from IP3-sensitive stores, Ca2+ waves, and facilitation of LTP in hippocampal pyramidal cells can be induced by mGluRs activation (Cohen et al., 1998), possibly acting through intracellular cascades similar to those activated by mAChRs. Purinergic and adrenergic receptors also activate IP3 production (Nishizaki and Mori, 1998). Therefore, different membrane receptors may activate the same intracellular signaling cascade. However, it remains to be determined what functional demands require signaling through the different membrane receptors to produce IP3 and the induction of enduring modifications in synaptic efficacy.
AMPAR expression at the postsynaptic membrane is highly dynamic (Malinow and Malenka, 2002; Song and Huganir, 2002; Bredt and Nicoll, 2003). The rapid mobility of AMPARs occurs in a constitutive manner, with continual turnover of AMPARs at the synaptic membrane mediated by exocytosis and endocytosis (Lin et al., 2000), as well as through lateral mobility (Triller and Choquet, 2005). However, AMPAR trafficking is also modified by synaptic activity (Lissin et al., 1999; Ehlers, 2000; Lin et al., 2000). These activity-dependent changes in AMPAR trafficking have been linked to the modulation of synaptic strength that occurs during some forms of LTP and LTD (Malinow and Malenka, 2002). Our data demonstrate that ACh induces the increase of both GluR1 and GluR2 subunits of the AMPARs at the spines of CA1 pyramidal neurons. However we cannot discard a possible increase in the conductance of preexisting surface-expressed receptors (Benke et al., 1998) as a mechanism contributing to the long-lasting increase in the EPSCAMPA.
In conclusion, this LTPIP3 is expressed postsynaptically and requires Ca2+ release from IP3-sensitive stores and a rise in intracellular Ca2+ concentration. In contrast, it does not require depolarization or activation of voltage-gated Ca2+ conductances, nor of NMDARs that are indispensable to induce the classical LTPH. In addition, a similar muscarinic long-lasting enhancement of SC EPSPs may be induced by tetanic stimulation of septohippocampal cholinergic fibers, suggesting that LTPIP3 may be functional in the natural condition. This view is consistent with the high firing rates of medial septal neurons in vivo (Gogolak et al., 1968; Gaztelu and Buno, 1982). This novel LTPIP3 indicates that sustained modifications of synaptic efficacy may be more diverse than previously considered and reveals yet another cascade of postsynaptic events that might be present during behavior and can drive AMPARs into synapses and enhance synaptic transmission exclusively through Ca2+ release from ER stores.
Footnotes
W.B. and A.N. were supported by Dirección General de Investigación Científica y Tecnológica, Ministerio de Educación y Cultura Grant BFU2005-07486 (Spain). D.F. was initially funded by Ministerio de Ciencia y Tecnología (BFI2002-01107) and Comunidad Autónoma de Madrid Grants GR/SAL/0877/2004 and at present by Ministerio de Ciencia y Tecnología Grant BFU2005-07486. M.B. was on leave from the Departamento de Fisiología, Facultad de Medicina, Universidad de la República, Montevideo, Uruguay. Financial support for R.M. was provided by the National Institutes of Health.
References
- Abe T, Sugihara H, Nawa H, Shigemoto R, Mizuno N, Nakanishi S. Molecular characterization of a novel metabotropic glutamate receptor mGluR5 coupled to inositol phosphate/Ca2+ signal transduction. J Biol Chem. 1992;267:13361–13368. [PubMed] [Google Scholar]
- Aigner TG. Pharmacology of memory: cholinergic-glutamatergic interactions. Curr Opin Neurobiol. 1995;5:155–160. doi: 10.1016/0959-4388(95)80021-2. [DOI] [PubMed] [Google Scholar]
- Amenta F, Liu A, Giannella M, Pigini M, Tayebati SK, Zaccheo D. Age-related changes in the density of muscarinic cholinergic M1 and M2 receptor subtypes in pyramidal neurons of the rat hippocampus. Eur J Histochem. 1995;39:107–116. [PubMed] [Google Scholar]
- Ashby MC, Ibaraki K, Henley JM. It's green outside: tracking cell surface proteins with pH-sensitive GFP. Trends Neurosci. 2004;27:257–261. doi: 10.1016/j.tins.2004.03.010. [DOI] [PubMed] [Google Scholar]
- Auerbach JM, Segal M. A novel cholinergic induction of long-term potentiation in rat hippocampus. J Neurophysiol. 1994;72:2034–2040. doi: 10.1152/jn.1994.72.4.2034. [DOI] [PubMed] [Google Scholar]
- Auerbach JM, Segal M. Muscarinic receptors mediating depression and long-term potentiation in rat hippocampus. J Physiol. 1996;492:479–493. doi: 10.1113/jphysiol.1996.sp021323. [DOI] [PMC free article] [PubMed] [Google Scholar]
- Bardo S, Cavazzini MG, Emptage N. The role of the endoplasmic reticulum Ca2+ store in the plasticity of central neurons. Trends Pharmacol Sci. 2006;27:78–84. doi: 10.1016/j.tips.2005.12.008. [DOI] [PubMed] [Google Scholar]
- Benke TA, Luthi A, Isaac JT, Collingridge GL. Modulation of AMPA receptor unitary conductance by synaptic activity. Nature. 1998;393:793–797. doi: 10.1038/31709. [DOI] [PubMed] [Google Scholar]
- Blokland A. Acetylcholine: a neurotransmitter for learning and memory? Brain Res Brain Res Rev. 1995;21:285–300. doi: 10.1016/0165-0173(95)00016-x. [DOI] [PubMed] [Google Scholar]
- Borde M, Cazalets JR, Buno W. Activity-dependent response depression in rat hippocampal CA1 pyramidal neurons in vitro. J Neurophysiol. 1995;74:1714–1729. doi: 10.1152/jn.1995.74.4.1714. [DOI] [PubMed] [Google Scholar]
- Bredt DS, Nicoll RA. AMPA receptor trafficking at excitatory synapses. Neuron. 2003;40:361–379. doi: 10.1016/s0896-6273(03)00640-8. [DOI] [PubMed] [Google Scholar]
- Cabezas C, Buno W. Distinct transmitter release properties determine differences in short-term plasticity at functional and silent synapses. J Neurophysiol. 2006;95:3024–3034. doi: 10.1152/jn.00739.2005. [DOI] [PubMed] [Google Scholar]
- Castillo PE, Schoch S, Schmitz F, Sudhof TC, Malenka RC. RIM1alpha is required for presynaptic long-term potentiation. Nature. 2002;415:327–330. doi: 10.1038/415327a. [DOI] [PubMed] [Google Scholar]
- Cohen AS, Raymond CR, Abraham WC. Priming of long-term potentiation induced by activation of metabotropic glutamate receptors coupled to phospholipase C. Hippocampus. 1998;8:160–170. doi: 10.1002/(SICI)1098-1063(1998)8:2<160::AID-HIPO8>3.0.CO;2-P. [DOI] [PubMed] [Google Scholar]
- Dudar JD. The role of the septal nuclei in the release of acetyl-choline from the rabbit cerebral cortex and dorsal hippocampus and the effect of atropine. Brain Res. 1977;129:237–246. doi: 10.1016/0006-8993(77)90004-x. [DOI] [PubMed] [Google Scholar]
- Dutar P, Nicoll RA. Classification of muscarinic responses in hippocampus in terms of receptor subtypes and second-messenger systems: electrophysiological studies in vitro . J Neurosci. 1988;8:4214–4224. doi: 10.1523/JNEUROSCI.08-11-04214.1988. [DOI] [PMC free article] [PubMed] [Google Scholar]
- Ehlers MD. Reinsertion or degradation of AMPA receptors determined by activity-dependent endocytic sorting. Neuron. 2000;28:511–525. doi: 10.1016/s0896-6273(00)00129-x. [DOI] [PubMed] [Google Scholar]
- Fernandez de Sevilla D, Buno W. Presynaptic inhibition of Schaffer collateral synapses by stimulation of hippocampal cholinergic afferent fibres. Eur J Neurosci. 2003;17:555–558. doi: 10.1046/j.1460-9568.2003.02490.x. [DOI] [PubMed] [Google Scholar]
- Fernandez de Sevilla D, Cabezas C, de Prada AN, Sanchez-Jimenez A, Buno W. Selective muscarinic regulation of functional glutamatergic Schaffer collateral synapses in rat CA1 pyramidal neurons. J Physiol (Lond) 2002;545:51–63. doi: 10.1113/jphysiol.2002.029165. [DOI] [PMC free article] [PubMed] [Google Scholar]
- Frotscher M, Leranth C. Cholinergic innervation of the rat hippocampus as revealed by choline acetyltransferase immunocytochemistry: a combined light and electron microscopic study. J Comp Neurol. 1985;239:237–246. doi: 10.1002/cne.902390210. [DOI] [PubMed] [Google Scholar]
- Frotscher M, Vida I, Bender R. Evidence for the existence of non-GABAergic, cholinergic interneurons in the rodent hippocampus. Neuroscience. 2000;96:27–31. doi: 10.1016/s0306-4522(99)00525-4. [DOI] [PubMed] [Google Scholar]
- Gaztelu JM, Buno W., Jr Septo-hippocampal relationships during EEG theta rhythm. Electroencephalogr Clin Neurophysiol. 1982;54:375–387. doi: 10.1016/0013-4694(82)90201-2. [DOI] [PubMed] [Google Scholar]
- Gogolak G, Stumpf C, Petsche H, Sterc J. The firing pattern of septal neurons and the form of the hippocampal theta wave. Brain Res. 1968;7:201–207. doi: 10.1016/0006-8993(68)90098-x. [DOI] [PubMed] [Google Scholar]
- Hasselmo ME. Neuromodulation: acetylcholine and memory consolidation. Trends Cogn Sci. 1999;3:351–359. doi: 10.1016/s1364-6613(99)01365-0. [DOI] [PubMed] [Google Scholar]
- Hoffman DA, Sprengel R, Sakmann B. Molecular dissection of hippocampal theta-burst pairing potentiation. Proc Natl Acad Sci USA. 2002;99:7740–7745. doi: 10.1073/pnas.092157999. [DOI] [PMC free article] [PubMed] [Google Scholar]
- Huerta PT, Lisman JE. Bidirectional synaptic plasticity induced by a single burst during cholinergic theta oscillation in CA1 in vitro. Neuron. 1995;15:1053–1063. doi: 10.1016/0896-6273(95)90094-2. [DOI] [PubMed] [Google Scholar]
- Kirkwood A, Rozas C, Kirkwood J, Perez F, Bear MF. Modulation of long-term synaptic depression in visual cortex by acetylcholine and norepinephrine. J Neurosci. 1999;19:1599–1609. doi: 10.1523/JNEUROSCI.19-05-01599.1999. [DOI] [PMC free article] [PubMed] [Google Scholar]
- Kopec CD, Li B, Wei W, Boehm J, Malinow R. Glutamate receptor exocytosis and spine enlargement during chemically induced long-term potentiation. J Neurosci. 2006;26:2000–2009. doi: 10.1523/JNEUROSCI.3918-05.2006. [DOI] [PMC free article] [PubMed] [Google Scholar]
- Levey AI, Edmunds SM, Koliatsos V, Wiley RG, Heilman CJ. Expression of m1–m4 muscarinic acetylcholine receptor proteins in rat hippocampus and regulation by cholinergic innervation. J Neurosci. 1995;15:4077–4092. doi: 10.1523/JNEUROSCI.15-05-04077.1995. [DOI] [PMC free article] [PubMed] [Google Scholar]
- Lin JW, Ju W, Foster K, Lee SH, Ahmadian G, Wyszynski M, Wang YT, Sheng M. Distinct molecular mechanisms and divergent endocytotic pathways of AMPA receptor internalization. Nat Neurosci. 2000;3:1282–1290. doi: 10.1038/81814. [DOI] [PubMed] [Google Scholar]
- Lissin DV, Carroll RC, Nicoll RA, Malenka RC, von Zastrow M. Rapid, activation-induced redistribution of ionotropic glutamate receptors in cultured hippocampal neurons. J Neurosci. 1999;19:1263–1272. doi: 10.1523/JNEUROSCI.19-04-01263.1999. [DOI] [PMC free article] [PubMed] [Google Scholar]
- Mak DO, McBride S, Foskett JK. Regulation by Ca2+ and inositol 1,4,5-trisphosphate (InsP3) of single recombinant type 3 InsP3 receptor channels. Ca2+ activation uniquely distinguishes types 1 and 3 insp3 receptors. J Gen Physiol. 2001;117:435–446. doi: 10.1085/jgp.117.5.435. [DOI] [PMC free article] [PubMed] [Google Scholar]
- Malenka RC, Bear MF. LTP and LTD: an embarrassment of riches. Neuron. 2004;44:5–21. doi: 10.1016/j.neuron.2004.09.012. [DOI] [PubMed] [Google Scholar]
- Malenka RC, Kauer JA, Perkel DJ, Nicoll RA. The impact of postsynaptic calcium on synaptic transmission–its role in long-term potentiation. Trends Neurosci. 1989;12:444–450. doi: 10.1016/0166-2236(89)90094-5. [DOI] [PubMed] [Google Scholar]
- Malinow R, Malenka RC. AMPA receptor trafficking and synaptic plasticity. Annu Rev Neurosci. 2002;25:103–126. doi: 10.1146/annurev.neuro.25.112701.142758. [DOI] [PubMed] [Google Scholar]
- Markram H, Segal M. Acetylcholine potentiates responses to N-methyl-d-aspartate in the rat hippocampus. Neurosci Lett. 1990;113:62–65. doi: 10.1016/0304-3940(90)90495-u. [DOI] [PubMed] [Google Scholar]
- Markram H, Helm PJ, Sakmann B. Dendritic calcium transients evoked by single back-propagating action potentials in rat neocortical pyramidal neurons. J Physiol. 1995;485:1–20. doi: 10.1113/jphysiol.1995.sp020708. [DOI] [PMC free article] [PubMed] [Google Scholar]
- Nishizaki T, Mori M. Diverse signal transduction pathways mediated by endogenous P2 receptors in cultured rat cerebral cortical neurons. J Neurophysiol. 1998;79:2513–2521. doi: 10.1152/jn.1998.79.5.2513. [DOI] [PubMed] [Google Scholar]
- Oertner TG, Sabatini BL, Nimchinsky EA, Svoboda K. Facilitation at single synapses probed with optical quantal analysis. Nat Neurosci. 2002;5:657–664. doi: 10.1038/nn867. [DOI] [PubMed] [Google Scholar]
- Ovsepian SV, Anwyl R, Rowan MJ. Endogenous acetylcholine lowers the threshold for long-term potentiation induction in the CA1 area through muscarinic receptor activation: in vivo study. Eur J Neurosci. 2004;20:1267–1275. doi: 10.1111/j.1460-9568.2004.03582.x. [DOI] [PubMed] [Google Scholar]
- Paxinos G, Watson C. The rat brain in stereotaxic coordinates. New York: Academic; 1986. [DOI] [PubMed] [Google Scholar]
- Power JM, Sah P. Nuclear calcium signaling evoked by cholinergic stimulation in hippocampal CA1 pyramidal neurons. J Neurosci. 2002;22:3454–3462. doi: 10.1523/JNEUROSCI.22-09-03454.2002. [DOI] [PMC free article] [PubMed] [Google Scholar]
- Qian J, Saggau P. Presynaptic inhibition of synaptic transmission in the rat hippocampus by activation of muscarinic receptors: involvement of presynaptic calcium influx. Br J Pharmacol. 1997;122:511–519. doi: 10.1038/sj.bjp.0701400. [DOI] [PMC free article] [PubMed] [Google Scholar]
- Ramón y Cajal S. Significación fisiológica de las expansions protoplásmicas y nerviosas de la sustancia gris. Revista de Ciencias Médicas de Barcelona. 1891;22:23. [Google Scholar]
- Rose CR, Konnerth A. Stores not just for storage. intracellular calcium release and synaptic plasticity. Neuron. 2001;31:519–522. doi: 10.1016/s0896-6273(01)00402-0. [DOI] [PubMed] [Google Scholar]
- Rovira C, Ben-Ari Y, Cherubini E. Dual cholinergic modulation of hippocampal somatic and dendritic field potentials by the septo-hippocampal pathway. Exp Brain Res. 1983;49:151–155. doi: 10.1007/BF00235552. [DOI] [PubMed] [Google Scholar]
- Scheiderer CL, McCutchen E, Thacker EE, Kolasa K, Ward MK, Parsons D, Harrell LE, Dobrunz LE, McMahon LL. Sympathetic sprouting drives hippocampal cholinergic reinnervation that prevents loss of a muscarinic receptor-dependent long-term depression at CA3–CA1 synapses. J Neurosci. 2006;26:3745–3756. doi: 10.1523/JNEUROSCI.5507-05.2006. [DOI] [PMC free article] [PubMed] [Google Scholar]
- Sharp AH, McPherson PS, Dawson TM, Aoki C, Campbell KP, Snyder SH. Differential immunohistochemical localization of inositol 1,4,5-trisphosphate- and ryanodine-sensitive Ca2+ release channels in rat brain. J Neurosci. 1993;13:3051–3063. doi: 10.1523/JNEUROSCI.13-07-03051.1993. [DOI] [PMC free article] [PubMed] [Google Scholar]
- Shinoe T, Matsui M, Taketo MM, Manabe T. Modulation of synaptic plasticity by physiological activation of M1 muscarinic acetylcholine receptors in the mouse hippocampus. J Neurosci. 2005;25:11194–11200. doi: 10.1523/JNEUROSCI.2338-05.2005. [DOI] [PMC free article] [PubMed] [Google Scholar]
- Song I, Huganir RL. Regulation of AMPA receptors during synaptic plasticity. Trends Neurosci. 2002;25:578–588. doi: 10.1016/s0166-2236(02)02270-1. [DOI] [PubMed] [Google Scholar]
- Spacek J, Harris KM. Three-dimensional organization of smooth endoplasmic reticulum in hippocampal CA1 dendrites and dendritic spines of the immature and mature rat. J Neurosci. 1997;17:190–203. doi: 10.1523/JNEUROSCI.17-01-00190.1997. [DOI] [PMC free article] [PubMed] [Google Scholar]
- Triller A, Choquet D. Surface trafficking of receptors between synaptic and extrasynaptic membranes: and yet they do move! Trends Neurosci. 2005;28:133–139. doi: 10.1016/j.tins.2005.01.001. [DOI] [PubMed] [Google Scholar]
- Valentino RJ, Dingledine R. Presynaptic inhibitory effect of acetylcholine in the hippocampus. J Neurosci. 1981;1:784–792. doi: 10.1523/JNEUROSCI.01-07-00784.1981. [DOI] [PMC free article] [PubMed] [Google Scholar]
- Zenchenko KI, Kokoz YM, Ivanov VT, Ziganshin RH, Vinogradova OS. State-dependent effects of some neuropeptides and neurotransmitters on neuronal activity of the medial septal area in brain slices of the ground squirrel, Citellus undulatus . Neuroscience. 2000;96:791–805. doi: 10.1016/s0306-4522(99)00591-6. [DOI] [PubMed] [Google Scholar]
- Zucker RS. Calcium- and activity-dependent synaptic plasticity. Curr Opin Neurobiol. 1999;9:305–313. doi: 10.1016/s0959-4388(99)80045-2. [DOI] [PubMed] [Google Scholar]