

Abstract
In both humans and animals, an insult to the brain can lead, after a variable latent period, to the appearance of spontaneous epileptic seizures that persist for life. The underlying processes, collectively referred to as epileptogenesis, include multiple structural and functional neuronal alterations. We have identified the T-type Ca2+ channel Cav3.2 as a central player in epileptogenesis. We show that a transient and selective upregulation of Cav3.2 subunits on the mRNA and protein levels after status epilepticus causes an increase in cellular T-type Ca2+ currents and a transitional increase in intrinsic burst firing. These functional changes are absent in mice lacking Cav3.2 subunits. Intriguingly, the development of neuropathological hallmarks of chronic epilepsy, such as subfield-specific neuron loss in the hippocampal formation and mossy fiber sprouting, was virtually completely absent in Cav3.2−/− mice. In addition, the appearance of spontaneous seizures was dramatically reduced in these mice. Together, these data establish transcriptional induction of Cav3.2 as a critical step in epileptogenesis and neuronal vulnerability.
Keywords: plasticity, burst discharge, epileptogenesis, reorganization, channelopathy, temporal lobe epilepsy
Introduction
A single episode of status epilepticus (SE) can trigger epileptogenesis (i.e., a progressive structural and functional neuronal reorganization associated with the emergence of recurrent unprovoked seizures). Epileptogenesis is accompanied by many changes in synaptic function [synaptic plasticity (McNamara, 1999)] and in passive and active membrane properties of neurons [intrinsic plasticity (Yaari and Beck, 2002; Beck and Yaari, 2008)]. Synaptic plasticity primarily involves persistent changes in network connectivity, neurotransmitter release, and expression of postsynaptic receptors. Intrinsic plasticity comprises long-term changes in the expression and activity of voltage- and Ca2+-gated ion channels that generate electrical signals.
One of the most striking examples of intrinsic plasticity in SE-triggered epileptogenesis is the conversion of hippocampal pyramidal neurons from regular firing, which is the predominant spiking mode in normal conditions (Jensen et al., 1994; Azouz et al., 1996), to burst firing a few days after SE (Sanabria et al., 2001). Many of these neurons burst-fire in response to threshold depolarizations or even spontaneously. Consequently, synaptic excitation of these neurons elicits a greatly amplified spike output (Su et al., 2002). Furthermore, the spontaneously bursting pyramidal cells act as pacemakers of spontaneous, interictal-like population bursts, recruiting the entire CA1 population of pyramidal cells, nonbursters and bursters alike, into synchronized discharge (Sanabria et al., 2001). Detailed pharmacological experiments have suggested that aberrant bursting after SE is caused mainly by an upregulation of T-type Ca2+ channels in the apical dendrites (Su et al., 2002; Yaari et al., 2007).
Although the dramatic changes in hippocampal neuronal and network function resulting directly from the SE-induced upregulation of T-type Ca2+ channels are potentially epileptogenic, their unique contribution to the multifaceted process of epileptogenesis is difficult to assess. We have set out to examine this issue using mice deficient for Cav3.2 subunits. We show that Cav3.2 mRNA and protein levels are transiently augmented after SE, with a concomitant increase in T-type Ca2+ currents and intrinsic burst firing. Preventing these changes by genetic deletion of Cav3.2 subunits obviates the neuropathological damage that normally develops during epileptogenesis. Moreover, the emergence of spontaneous seizures is markedly attenuated. These results indicate that transcriptional upregulation of Cav3.2 is a critical step in SE-triggered epileptogenesis.
Materials and Methods
Animals and induction of chronic epilepsy.
Mice and rats were housed under a 12 h light/dark cycle with food and water ad libitum. Cav3.2+/+ and Cav3.2−/− male mice (≥60 d old; weight, >20 g) (Chen et al., 2003) and Wistar rats (150–200 g) were used for the analyses described below. All experiments were performed in accordance with the guidelines of the University of Bonn Medical Center Animal Care Committee. Sustained seizures were induced in experimental animals by the administration of pilocarpine, a muscarinic cholinergic agonist, using injection protocols derived from those described previously (Pitsch et al., 2007). In brief, animals received a low dose of scopolamine methyl nitrate (1 mg/kg, s.c.; Sigma) and after 25 min were given injections of pilocarpine hydrochloride (330 mg/kg, s.c.; Sigma) to induce SE. SE was defined as sustained series of generalized tonic–clonic convulsions (stage V; see below for description of stages). Sham-injected controls were treated identically but received an isotonic NaCl solution instead of pilocarpine. Cav3.2−/− mice were compared with littermate Cav3.2+/+ controls in all experiments. Diazepam (4 mg/kg, s.c.; Ratiopharm) was administered to mice 40 min after, and to rats 2 h after, the onset of SE to terminate seizures. After SE, all animals were fed with a 5% glucose solution (Fresenius) and soaked rodent food. Of pilocarpine-injected animals, only those that developed SE (SE experienced) were used for additional phenotypic and histological analyses.
Telemetric EEG monitoring and seizure classification.
The electrographic features of SE and chronic seizures were analyzed with a telemetric EEG/video monitoring system (Data Science International). The transmitter was placed on the right abdominal side subcutaneously under deep anesthesia [6 mg/kg xylazine (Rompun; Bayer) plus 90–120 mg/kg ketamine, i.m. (Ketavet; Pfizer)]. Stainless steel screws were used as electrodes and positioned such that they contacted the cerebral cortex. They were positioned at the stereotaxic coordinates −1.5 posterior, −1.5 lateral relative to bregma (Pitsch et al., 2007) and fixed with dental cement. Connections between electrodes and transmitter were placed subcutaneously. All implanted mice subsequently received analgetic treatment twice per day for 2 d (5 mg/kg Carprofen, s.c.; Rimadyl; Pfizer), as well as antibiotic treatment during the monitoring phase (5 mg/kg Enrofloxacin, orally; Baytril; Bayer). To examine the features of SE, mice were implanted with EEG electrodes 7 d before induction of SE. To analyze the development of recurrent seizures after SE, we implanted SE-experienced mice after recovery from SE (day 7 after SE). EEG recording with a sampling rate of 1 kHz was started at day 9 after SE, when mice had recovered from transmitter implantation and stable EEG signals were obtained. Monitoring was performed until day 26 after SE. EEG recordings were analyzed using fast Fourier power spectral analysis (FFT). To perform a time-dependent analysis, we used a moving-window approach. EEG signals were divided into nonoverlapping segments of 8192 sampling points each, corresponding to a window length of 8.2 s at the given sampling rate. Before the calculation of the FFT, data preprocessing was performed for each window. First, the data in each window were demeaned. Next, to avoid edge effects, each window was tapered using a cosine half-wave before performing FFT. These procedures ensured antialiasing of the transform, which would distort and falsely enhance activity in the lower frequencies. Power was analyzed in five frequency bands: δ (0.5–3.99 Hz), theta (4–7.99 Hz), α (8–12.99 Hz), β (13–30 Hz), and gamma (30–40 Hz). The duration of increased EEG activity in the different frequency bands was determined as the time during which band power was increased to >10% of maximal values. From concurrent video recordings, all spontaneous seizures were classified as described previously (Pitsch et al., 2007), with stage I (immobility, rigid posture), stage II (repetitive movements, head bobbing), stage III (severe seizures with rearing without falling), and stage IV (severe seizures with rearing and falling/loss of righting ability). Continuous tonic–clonic seizures during SE were classified as stage V. EEG polyspikes were defined as series of three to five repetitive sharp EEG elements at 30–80 Hz that were clearly distinguishable from baseline EEG activity by virtue of their large amplitude (>2× baseline peak-to-peak amplitude) and sharp morphology (see Fig. 8G for example).
Figure 8.

The appearance of spontaneous seizures is markedly attenuated in Cav3.2−/− mice. A, Representative interictal EEG recordings from sham-control and SE-experienced Cav3.2+/+ and Cav3.2−/− mice as indicated. Recordings were >11 d after treatment. B, Representative EEG recordings during stage III (top traces) and stage IV seizures (bottom traces) in Cav3.2−/− and Cav3.2+/+ mice. C, Development of spontaneous seizure activity after SE in Cav3.2+/+ versus Cav3.2−/− mice. Seizures were quantified in intervals of 3 consecutive days, and the average seizure frequency per day is presented as “average seizures per day.” The frequency of spontaneous seizures is substantially decreased in Cav3.2−/− versus Cav3.2+/+ mice (*p < 0.05, Mann–Whitney U test). D–F, Analysis of seizure severity in the chronic epileptic stage. D, Seizures were more severe in SE-experienced Cav3.2+/+ mice, with a high fraction of generalized stage IV seizures. In contrast, only a single Cav3.2−/− mouse had two stage IV seizures (*p < 0.05; ***p < 0.001; χ2 test). E, F, No significant differences with respect to seizure duration (E) and seizure amplitude (F) were found between Cav3.2+/+ and Cav3.2−/− mice. G, Representative example of an interictal EEG spike. These were more common in SE-experienced Cav3.2+/+ mice (see also A) compared with Cav3.2−/− mice. In D–G, n = 8 for Cav3.2−/− and n = 7 for Cav3.2+/+. Error bars indicate SEM.
Histopathological and immunohistochemical analyses.
Mice or rats were decapitated under deep isoflurane anesthesia (Forene) at different time points after SE, as indicated. Brains were removed quickly, and tissue was prepared as follows. One hemisphere was fixed by cryopreservation and stored at −80°C. We used horizontal hippocampal cryosections (20 μm thick) for hematoxylin and eosin (H&E) stains and immunohistochemistry. Neuronal densities within the pyramidal cell and dentate granule cell layers of the hippocampus (see Fig. 5) were determined in at least two H&E-stained sections of the ventral hippocampus per animal by an investigator blinded to the experimental group. We verified that this quantification accurately reports neuronal cell densities by performing a series of quantifications in sections immunolabeled with a monoclonal antibody directed against NeuN (supplemental Fig. 4, available at www.jneurosci.org as supplemental material) (Blümcke et al., 2001) and H&E-stained sections. No quantitative differences between these methods were observed.
Figure 5.

The development of hippocampal damage after SE is dramatically attenuated in Cav3.2−/− mice. A, Representative hippocampal sections from sham-control and SE-experienced Cav3.2+/+ and Cav3.2−/− mice stained with an antibody directed against the neuron-specific epitope NeuN. No significant neuronal cell loss is observed in these representative animals on day 2 after treatment (sham treatment or SE; n = 5 animals for each group). B, Representative hippocampal sections stained with an antibody directed against NeuN obtained 50 d after treatment. Note the pronounced neuronal cell loss in areas CA1 and CA3 after SE in Cav3.2+/+ mice but not in Cav3.2−/− mice. The higher-magnification micrographs of representative CA1 subfields of SE-experienced animals highlights the substantial neuronal degeneration in Cav3.2+/+ but not Cav3.2−/− mice (bottom). C–E, Quantification of neuronal cell density in CA1 (C), CA3 (D), and the dentate gyrus (E) in sham-control (open bars) or SE-experienced mice (filled bars). Quantification was done from H&E-stained sections. Note the pronounced neuronal cell loss in the SE group in Cav3.2+/+ but not in Cav3.2−/− mice (*p < 0.05; ***p < 0.001; t test). Day 2 after SE: Cav3.2+/+ sham, n = 5; Cav3.2+/+ SE, n = 5; Cav3.2−/− sham, n = 6; Cav3.2−/− SE, n = 5; day 10 after SE: Cav3.2+/+ sham, n = 6; Cav3.2+/+ SE, n = 8; Cav3.2−/− sham, n = 5; Cav3.2−/− SE, n = 7; day 50 after SE: Cav3.2+/+ sham, n = 6; Cav3.2+/+ SE, n = 7; Cav3.2−/− sham, n = 5; Cav3.2−/− SE, n = 9. F, We did not observe significant neuronal cell loss in either Cav3.2+/+ or Cav3.2−/− mice in the temporal neocortex, the entorhinal cortex. and the ventral subiculum in the chronic epileptic stage (n = 5 animals in each group). Error bars indicate SEM.
For Cav3.2 immunostaining, slices were air dried on Superfrost glass slides (Menzel) for 30 min, fixated in 4% paraformaldehyde (PFA)/PBS, pH 7.4, at room temperature for 10 min, and washed. All washing steps were performed twice for 5 min in PBS at room temperature. After washing, slides were subjected to a citric acid antigen retrieval procedure, followed by a 20 min incubation in 1% hydrogen peroxide in PBS to inhibit endogenous peroxidase activity. Subsequently, brain sections were blocked for 2 h at 37°C in PBS blocking buffer [10% fetal calf serum (FCS), 3% nonfat dry milk, 1% normal goat serum in PBS] to inhibit nonspecific antibody binding. To identify Cav3.2-labeled neurons, sections were incubated overnight at room temperature with a rabbit polyclonal antibody against Cav3.2 (Alamone Labs), diluted 1:150 in PBS blocking buffer including 10% FCS. After washing, slides were covered with a biotinylated secondary anti-rabbit antibody (Vector Laboratories), diluted 1:200 in PBS including 10% FCS and incubated for 2 h at 37°C. Slides were again washed and incubated with avidin–biotin complex (Vector Laboratories), diluted 1:150 in PBS including 10% FCS for 2 h at 37°C. After washing, labeling was visualized by diaminobenzidine (DAB) application [0.05 m Tris/HCl, pH 7.4, with DAB (1:50) and H2O2 (1:2000)], followed by hematoxylin staining as a routine counterstain. The immunolabeling experiments, as well as the immunoblotting experiments (see below), were performed in the rat. The antibody used in this study, in our hands, yielded satisfactory labeling in the rat but not in mice. This may be attributable to the fact that the antibody was raised to an epitope corresponding to residues 581–595 of the rat Cav3.2 protein, which is different from the mouse Cav3.2 protein. Because we could not test specificity of the antibody using Cav3.2 null mice, we performed a negative control as follows. A peptide with the amino acid sequence CHVEGPQERARVAHS corresponding to residues 581–595 of the rat Cav3.2 protein (0.01 μg/μl) was added during the incubation step with the polyclonal antibody against Cav3.2. In these experiments, staining with the Cav3.2 antibody only revealed robust immunolabeling (labeled with − in supplemental Fig. 2C, available at www.jneurosci.org as supplemental material), which was absent when sections were coincubated with the control antigen (labeled with + in supplemental Fig. 2C, available at www.jneurosci.org as supplemental material).
All digital images were captured with an Axiocam (Zeiss) and Axiovision software (Zeiss). For confocal image analysis, tissue blocks were freshly prepared as described above, fixed overnight in 4% PFA/PBS, and sectioned at 10 μm. Double labeling was performed simultaneously. Therefore, immunohistochemistry with a primary antibody against Cav3.2 was performed as described above. Furthermore, we used primary monoclonal antibodies against MAP2 (1:200; Millipore Bioscience Research Reagents) and parvalbumin (1:2000; Sigma-Aldrich) with the same procedure described above. Secondary detection was performed by Rhodamine Red X-conjugated goat anti-rabbit Cy3-conjugated, and accordingly, goat anti-mouse FITC-conjugated antibodies (both 1:400; Jackson ImmunoResearch). For Timm's stain, hippocampal 400 μm slices were sequentially incubated in 0.1% sodium sulfide for 10 min, 0.3% glutaraldehyde (Roth) in 0.15 m phosphate buffer (Merck) for 10 min, 70% ethanol for at least 1 d, and 30% sucrose in 0.15 m phosphate buffer overnight at 4°C. The 400 μm slices were then cut at 20 μm on a cryostat. After rinsing in 0.15 m phosphate buffer, mounted sections were incubated in developing solution for 30–50 min and counterstained for semiquantitative assessment of mossy fiber sprouting by assessing supragranular neo-Timm staining modified from Mello et al. (1993). In this study, the severity of mossy fiber sprouting was classified into four degrees: 0, no staining; 1, mild patchy staining; 2, moderate continuous staining; 3, very intense staining throughout the entire septotemporal axis of the hippocampal formation. We modified this approach by counting Timm granules in digital images captured with an Axiocam (Zeiss) and Axiovision software (Zeiss). These counts were normalized to the corresponding area of the field of view and binned into four bins corresponding to an increasing severity of mossy fiber sprouting (see Fig. 7B) (bins corresponding to 0, 1–10, 10–20, and >20 granules per 2500 μm2). This distribution was then tested between groups with a χ2 test.
Figure 7.
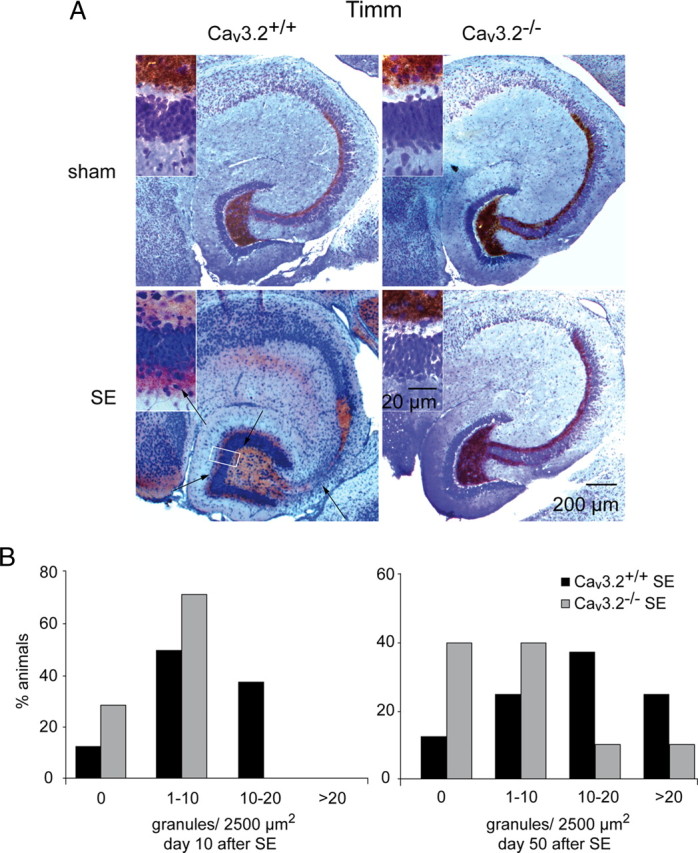
Mossy fiber sprouting after SE is substantially attenuated in Cav3.2−/− mice. A, Mossy fiber sprouting is visualized by Timm staining. SE-experienced Cav3.2+/+ mice display mossy fiber sprouting with an increased density of Timm-stained terminals in the supragranular layer, whereas sham-control mice did not (left; higher magnification in insets). In contrast, SE-induced mossy fiber sprouting is virtually absent in SE-experienced Cav3.2−/− mice (right; higher magnification in insets; scale bar in right bottom inset is for all insets). B, Assessment of the severity of mossy fiber sprouting with a semiquantitative measure (see Materials and Methods) (Mello et al., 1993) in animals 10 d after SE (left) and 50 d after SE (right). Mossy fiber sprouting is strongly reduced in Cav3.2−/− mice (χ2 test, p < 0.05). Day 10 after SE: Cav3.2+/+ sham, n = 6; Cav3.2+/+ SE, n = 8; Cav3.2−/− sham, n = 5; Cav3.2−/− SE, n = 7; day 50 after SE: Cav3.2+/+ sham, n = 6; Cav3.2+/+ SE, n = 7; Cav3.2−/− sham, n = 5; Cav3.2−/− SE, n = 9.
Terminal deoxynucleotidyl transferase-mediated dUTP nick end labeling.
To assess DNA fragmentation, sections were pretreated with proteinase K (10 μg/ml; Sigma) for 30 min at 37°C and incubated with terminal deoxynucleotidyl transferase-mediated dUTP nick end labeling (TUNEL) reaction mixture containing terminal deoxynucleotidyl transferase and tetramethylrhodamine red-labeled nucleotides (Roche) for 1 h at 37°C. Several sections were then washed with PBS, pH 7.4, for 15 min and costained with 4′,6-diamidino-2-phenylindole (DAPI; 1 mg/ml; Sigma) solution for 5 min at room temperature, followed by additional washes with PBS. Sections were then coverslipped in fluorescein mounting medium (Vectashield; Vector Laboratories) and analyzed under a fluorescence microscope (Zeiss). Virtual counting areas were placed within the hippocampal dentate gyrus, in the CA1 and CA3 pyramidal sections, and in the cortex and hilus region of Cav3.2−/− and Cav3.2+/+ mice (n = 5 each for 2 and 10 d after SE), and TUNEL-positive as well as TUNEL-negative cells were counted in each area to assess the percentage of TUNEL-positive neuronal cells.
Fluoro-Jade C staining.
We performed Fluoro-Jade C (FJ-C) immunostaining to mark degenerating neurons following a protocol as described in detail previously (López-Gallardo et al., 2008). Paraffin sections were deparaffinized in xylene two times for 10 min. Slides were then covered with 96% ethanol for 4 min, rinsed for 2 min in 70% ethanol, and rinsed for 2 min in distilled water. To label all nuclei and assure visual observation of nuclear morphology, DNA-binding fluorescent dye DAPI (Sigma-Aldrich) was added to the staining solution. The final DAPI concentration was 0.0002%. After the incubation, the slides were rinsed through three changes of distilled water for 1 min per change. Then, they were incubated in 0.06% potassium permanganate solution in distilled water for 10 min. Slides were rinsed twice in distilled water and incubated for 10 min in the staining solution consistent with a 0.0001% solution of FJ-C (Millipore Bioscience Research Reagents International) dissolved in 0.1% acetic acid. The staining solution was prepared from a 0.01% stock solution of the dye in distilled water, which was stored at 4°C until used. After the incubation, the slides were rinsed through three changes of distilled water for 1 min per change. Excess of water was drained onto a paper towel, and the slides were air dried on a slide warmer at 50°C for 5 min. The slides were then cleared in xylene for at least 1 min and coverslipped with DPX (Serva) nonfluorescent mounting medium.
Image acquisition and analysis.
Sections were analyzed with a confocal laser-scanning microscope (Leica TCS NT) equipped with an argon–krypton laser, and images with different dyes (FITC and Cy3) were acquired sequentially. For FITC, the following filters and laser lines were used: excitation, 488 nm; dichroic, 488/568 nm; emission bandpass, 530/30 nm. For Cy3, the following were used: excitation, 568 nm; dichroic, 488/568 nm; long pass, 590 nm. Images were acquired with a 40× objective (Leica), and the pinhole was set to 1 Airy unit. Laser power, detector gain, and offset were adjusted such that in the final scan (four to eight averages) only a few pixels had zero values or were saturated. Typically, detector gain and offset were set to ∼70% and ∼6 digital units, respectively.
Human embryonic kidney cell culture and Western blot analysis.
The following stably transfected human embryonic kidney 293 (HEK-293) cell lines were used in this study: hα1G-Q39, containing the human α1G channel Cav3.1a (GenBank accession number AF190860) (Cribbs et al., 2000); hh8–5, containing the Hh8 plasmid construct of human α1H, Cav3.2a (GenBank accession number AF051946) (Cribbs et al., 1998); Lt9–8, containing the LT9 plasmid construct of α1I, Cav3.3b (GenBank accession number AF393329) (Gomora et al., 2002). For Western blot analysis, cells were washed in ice-cold PBS, detached from the plates, and centrifuged for 1 min at 4°C. The pellet in PBS/10 mm EDTA was homogenized by ultrasound, and the protein concentration was determined. Samples were diluted with Laemmli sample buffer (Bio-Rad) and heated at 95°C for 3 min. Protein bands were separated on a 7% (w/v) SDS-PAGE gel and transferred to a nitrocellulose membrane. The membrane was blocked for 1 h at room temperature (5% nonfat dry milk plus 5% normal horse serum). This was followed by a 1 h incubation of an antibody against Cav3.2 (1:200; Alamone Labs) and subsequently another 1 h incubation with a secondary anti-rabbit antibody (1:5000) in TBS-T (20 mm Tris, 0.8% NaCl, 0.1% Tween 20). Enhanced chemiluminescence solution was applied for 1 min on the membranes, and after drying the film was developed.
For Western blots in rat brain tissue, the CA1 pyramidal cell layer of the hippocampus (n = 5 sham-controls vs n = 5 at day 5 after SE) was microdissected and homogenized in PBS with 10 mm EDTA and protease inhibitors (Roche). The protein concentration was determined by a nanodrop photometer (Thermo Fisher Scientific). Samples were diluted with Laemmli sample buffer and heated at 37°C for 3 min. A 150 μg protein sample was loaded on each lane, separated on a 7% (w/v) SDS-PAGE gel, and transferred to a nitrocellulose membrane. The membrane was blocked for 1 h at room temperature (5% nonfat dry milk plus 5% normal horse serum), followed by a 1 h incubation with an antibody against Cav3.2 (1:200; Alamone Labs) and subsequently another 1 h incubation with a secondary anti-antibody against rabbit fluorescently labeled with IRDye 680 (1:5000; LI-COR) in TBS-T. Immunoblots were imaged with the LI-COR Odyssey and quantified with AIDA evaluation software (Raytest).
Real-time reverse transcription-PCR.
CA1 regions were microdissected from hippocampal slices (400 μm), and mRNA was isolated with a Dynabeads mRNA Direct Micro kit (Dynal Biotech) according to the manufacturer's protocol. Ca2+ channel subunit transcript quantification was performed by real-time reverse transcription (RT)-PCR (PRISM 7700; PE Biosystems). Primers for Ca2+ channel subunits and synaptophysin were designed with Primer Express software (PE Biosystems) (supplemental Table 1, available at www.jneurosci.org as supplemental material). No significant homology of the amplicon sequences with other previously characterized genes has been found searching GenBank databases by the BLASTN program. Relative quantification of the starting mRNA copy numbers using multiple replicates for each reaction was performed according to the ΔΔCt method (Fink et al., 1998). The signal threshold was set within the exponential phase of the reaction for determination of the threshold cycle (Ct). Synaptophysin was used as an endogenous, neuron-specific reference gene, because it does not show expression changes at early (1–3 d, 5 d, and 10 d; data not shown; n = 5 each) or late (Chen et al., 2001) stages after pilocarpine-induced SE. Relative quantification started from 5.0–10.0 ng of mRNA. Real-time RT-PCR was performed in a 12.5 μl reaction volume containing 6.25 μl of SYBR Green PCR Master Mix (Invitrogen), 0.375 μl of forward and reverse primers (10 pmol/ml) shown in supplemental Table 1 (available at www.jneurosci.org as supplemental material), 3.0 μl of DEPC-H2O, and cDNA dissolved in 2.5 μl of DEPC-H2O. Reactions were performed at least in duplicates. After preincubation for 10 min at 95°C, we performed 50 PCR cycles (20 s at 94°C followed by 30 s at 59°C and 40 s at 72°C). The SYBR Green fluorescence signal was measured in each cycle.
Preparation of hippocampal slices.
For all experiments, animals were perfused through the heart with ice-cold, sucrose-based artificial CSF (sucrose-ACSF) containing (in mm) 56 NaCl, 100 sucrose, 2.5 KCl, 1.25 NaH2PO4, 30 NaHCO3, 1 CaCl2, 5 MgCl2, and 20 glucose (95% O2/5% CO2) under deep anesthesia with ketamine (100 mg/kg; Pfizer) and xylazine (15 mg/kg; Bayer). After complete perfusion, mice were decapitated, the brain was quickly removed, and 300- or 400-μm-thick transverse hippocampal slices were made with a Vibratome (MICROM or Leica VT1000S), as required, and gradually warmed to 30°C over 30 min in a storage chamber perfused with sucrose-ACSF [identical to the one above but with 26 mm NaHCO3 and 60 mm NaCl (95% CO2/5% O2)]. Slices were then transferred to a holding chamber and equilibrated at room temperature (21°C) for at least 30 min with ACSF containing (in mm) 125 NaCl, 3.5 KCl, 1.25 NaH2PO4, 2 MgCl2, 2 CaCl2, 26 NaHCO3, and 15 glucose, pH 7.4 (305 mOsm).
Sharp microelectrode recordings.
For intracellular recordings, 400-μm-thick hippocampal slices were placed in an interface chamber (33.5°C) and perfused with oxygenated ACSF containing (in mm) 124 NaCl, 3.5 KCl, 1.25 NaH2PO4, 2 MgSO4, 2 CaCl2, 26 NaHCO3, and 15 d-glucose. In experiments in which Ni2+ was added to the ACSF, NaH2PO4 was omitted. Intracellular recordings were obtained using sharp glass microelectrodes containing 4 m K+-acetate (90–110 MΩ). An active bridge circuit in the amplifier (Axoclamp 2B; Molecular Devices) allowed simultaneous injection of current and measurement of membrane potential. The signals were filtered on-line at 10 kHz, digitized at a sampling rate of 100 kHz, and stored on hard disk (pClamp; Molecular Devices). Measurements of passive membrane characteristics in current-clamp experiments were performed as reported previously (Sanabria et al., 2001). Cells were classified as intrinsically bursting or regular firing based on their discharge behavior to brief and long depolarizing current injections. Burst-firing neurons responded to either brief or long threshold current injection with an all-or-none burst response. Burst responses consisted of a series of at least three action potentials at high frequency (50–120 Hz) riding on a depolarizing envelope. Regular-firing neurons responded with a single spike to brief and a series of independent action potentials to long current injections. The size of the spike afterdepolarization (ADP) was determined by measuring the area under the ADP starting from the beginning of the fast afterhyperpolarization to 30 ms after the end of brief current injections. This delivers a value that incorporates both active and passive portions of the ADP (Jensen et al., 1996). To evaluate the magnitude of the active portion of the ADP, we first estimated the contribution of passive components by obtaining voltage responses to subthreshold current injections of identical duration. These passive voltage responses were scaled so that the passive charging trace for the subthreshold current injection was superimposed to the one for the suprathreshold stimulus. The corresponding area approximates the passive response of the neuron and was subtracted from the total ADP area, yielding the active component of the ADP.
Patch-clamp recordings.
For patch-clamp recordings in the slice preparation, 300 μm hippocampal slices were placed in a submerged recording chamber (21–24°C) and continuously perfused (2.5 ml min−1) with oxygenated ACSF containing (in mm) 20 TEA-Cl, 115 Na-methanesulfonate, 3.5 KCl, 10 N-2-hydroxyethylpiperazine-N′-2-ethane sulfonic acid (HEPES), 2 CaCl2, 2 MgCl2, 4 4-aminopyridine, and 25 glucose, pH 7.4 (osmolarity, 300 mOsm). For recordings of T-type Ca2+ channels, ω-conotoxin GVIA (2 μm), ω-conotoxin MVIIC (3 μm), ω-agatoxin GIVA (200 nm), and nifedipine (10 μm) were added to block high-threshold Ca2+ channels. Pyramidal cells in the CA1 field were visualized at 60× magnification with Dodt-Gradient-Contrast optics (Luigs and Neumann) using a Zeiss Axioskop microscope and an infrared video camera (Till Photonics). Recording patch pipettes (2–4 MΩ) were pulled from borosilicate glass on a vertical puller (Narishige). Pipettes were filled with an intracellular solution containing (in mm) 105 Cs-methanesulfonate, 20 TEA-Cl, 10 HEPES, 5 EGTA, 2 MgCl2, 2 CaCl2, 25 sucrose, 4 Na2-ATP, and 0.3 GTP, pH 7.4. Tight-seal whole-cell recordings were obtained using a patch-clamp amplifier (Axopatch 200A; Molecular Devices). The signals were collected on-line as described above. Series resistance compensation was used to improve the voltage-clamp control (60–85%) so that the maximal residual voltage error did not exceed 5 mV. A liquid junction potential of 14 mV was calculated between the intracellular and extracellular solutions and corrected. T-type Ca2+ current amplitude was determined from slow inward tail currents as described previously (Sochivko et al., 2002).
Statistical analysis.
Statistical significance was analyzed as appropriate with a χ2 test, an unpaired Student's t test, or a Mann–Whitney U test. The values were considered significantly different at p < 0.05. Results were expressed as mean ± SEM.
Results
Cav3.2 mRNA is selectively upregulated in CA1 after SE
We first examined the expression of pore-forming α1 Ca2+ channel subunits (Ertel et al., 2000) in CA1 of mice at various time points after pilocarpine-induced SE using real-time RT-PCR (Fig. 1). Of the three α1 subunits that give rise to T-type Ca2+ channels [Cav3.1, Cav3.2, and Cav3.3 (Perez-Reyes, 2003)], only the Cav3.2 mRNA was significantly increased 2 d (1.8-fold; n = 5) and 3 d (1.5-fold; n = 4) after SE in compared with sham-control littermates (Fig. 1A–C) (p < 0.05, Mann–Whitney U test). This upregulation was transient, because it had returned to control values within 10 d after SE (Fig. 1B). The mRNA abundance of the Cav2.3 subunit, which encodes R-type Ca2+ currents (Sochivko et al., 2002), was unaltered (Fig. 1D). Moreover, Cav1.1, Cav1.2, Cav2.1, and Cav2.2 subunit mRNAs, corresponding to N-, P/Q-, and L-type Ca2+ channels (Ertel et al., 2000), were unchanged after SE at any of these time points (data not shown; n = 5 for all groups). We also analyzed the expression of the accessory β1–3 and α2δ subunits (supplemental Fig. 1, available at www.jneurosci.org as supplemental material), which modify biophysical and pharmacological properties of most α1 subunits (Arikkath and Campbell, 2003). We observed a transiently increased mRNA expression of β1 and β2 subunits after SE (n = 5 for all groups; p < 0.05, Mann–Whitney U test) (supplemental Fig. 1A,B, available at www.jneurosci.org as supplemental material). In contrast, the expression of β3 subunits was significantly reduced at late stages (n = 8 and 9 for sham-control and SE-experienced mice, respectively; p = 0.046, Mann–Whitney U test) (supplemental Fig. 1C, available at www.jneurosci.org as supplemental material). The expression of α2δ subunits was unchanged by SE (n = 5) (supplemental Fig. 1D, available at www.jneurosci.org as supplemental material). We replicated these experiments in rats and found again that Cav3.2 mRNA is transiently upregulated in CA1 (4.1-fold upregulation on day 3 after SE; n = 15 and 10 for sham-control and SE-experienced rats, respectively; p = 0.012, Mann–Whitney U test) (Fig. 1E). These results show a surprisingly selective pattern of transcriptional regulation for Ca2+ channel α1 subunits in the CA1 region in the first days after SE, with an upregulation only of Cav3.2 subunits.
Figure 1.

R/T-type Ca2+ channel subunit expression after pilocarpine-induced SE. A–E, Quantitative determination of Ca2+ channel subunit mRNAs was performed using a real-time RT-PCR approach. Error bars indicate SEM. A–D, mRNA expression of Cav3.1 (A), Cav3.2 (B), Cav3.3 (C), and Cav2.3 (D) in mice at different time points after pilocarpine-induced SE. Data are given relative to the average values in sham-control animals. A significant increase in Cav3.2 mRNA levels was observed on days 2 and 3 after SE (*p < 0.05, Mann–Whitney U test). E, An upregulation of Cav3.2 mRNA was also observed after SE in the rat (*p < 0.05, Mann–Whitney U test). F, Immunohistochemical analysis of Cav3.2 expression in the CA1 region of sham-control rats 5 d after treatment and SE-experienced rats 5 and 30 d after treatment. Antibodies were directed against Cav3.2 (red) and MAP2 (green) to visualize dendrites in the stratum radiatum. Note the strongly increased staining of Cav3.2 in MAP2-positive dendrites at 5 d after SE. OL, Overlay. Scale bar, 100 μm. G, Western blots from lysates of HEK cell lines expressing Cav3.1, Cav3.2, and Cav3.3 with an antibody directed against Cav3.2 reveal selective staining of Cav3.2 subunits. H, Western blots from hippocampal CA1 protein isolates from rats at day 5 after SE versus sham-controls (n = 5 each) with an antibody directed against Cav3.2 reveals significant induction of the Cav3.2 protein at 5 d after SE. Syph, Synaptophysin.
Cav3.2 protein is upregulated in apical dendrites of CA1 pyramidal cells after SE
We next examined whether the upregulation of Cav3.2 mRNA is associated with enhanced expression of Cav3.2 protein in apical dendrites of rat CA1 pyramidal cells. To this end, we performed double immunostaining for Cav3.2 and MAP2. The Cav3.2 antibody we used was raised against amino acid residues 581–595 of the rat Cav3.2 protein. The specificity of the Cav3.2 antibody was verified immunohistochemically by using a peptide control (supplemental Fig. 2C, available at www.jneurosci.org as supplemental material) (see Materials and Methods for description) and in immunoblotting experiments using HEK cells stably overexpressing Cav3.1, Cav3.2, or Cav3.3 (Fig. 1G). Five days after pilocarpine-induced SE, Western blot analysis revealed a 4.6-fold increase in Cav3.2 protein in CA1 compared with controls (Fig. 1H) (control, 0.010 ± 0.009 SEM; SE, 0.046 ± 0.014 SEM relative protein expression normalized to synaptophysin; n = 5 each; p < 0.05, Mann–Whitney U test). In addition, Cav3.2 immunostaining in MAP2-positive dendrites was markedly increased (Fig. 1F, middle panels; red, Cav3.2; green, MAP2) compared with sham-control animals (Fig. 1F, top panels) (n = 4). In keeping with the transient nature of the mRNA upregulation, the increase in Cav3.2 protein was absent at late stages after SE (30 d) (Fig. 1F, bottom panels). It should be noted that the pronounced neuronal cell loss we observed at late time points after SE (see Fig. 5) may contribute to the reduction in Cav3.2 staining 30 d after SE. We also noted a transient loss of MAP2 immunoreactivity in dendrites. This may be attributable to epitope blocking by the induction of the immediate-early gene Arc after SE (Fujimoto et al., 2004).
As described previously (McKay et al., 2006), we found expression of Cav3.2 also in somata and some proximal processes of interneurons. Virtually all of the Cav3.2-expressing interneurons were found to be parvalbumin positive (supplemental Fig. 2B, available at www.jneurosci.org as supplemental material). Staining in parvalbumin-immunoreactive interneurons did not appear to be altered after SE and did not contribute to the Cav3.2 immunolabeling in the stratum radiatum after SE. Cav3.2-expressing dendrites in this subfield lacked expression of parvalbumin (supplementary Fig. 2B, available at www.jneurosci.org as supplemental material). The upregulation of Cav3.2 protein was not seen in the dentate gyrus (supplemental Fig. 2A, available at www.jneurosci.org as supplemental material), in keeping with the lack of aberrant bursting behavior in dentate granule cells (Y. Yaari, unpublished data). These findings indicate that upregulation of Cav3.2 is a regionally restricted phenomenon.
T-type Ca2+ currents mediated by Cav3.2 subunits are upregulated after SE
Using patch-clamp recordings in the slice preparation, we then examined whether the upregulation of Cav3.2 mRNA and protein leads to an increased magnitude of T-type Ca2+ currents in CA1 neurons of Cav3.2+/+ mice 7–12 d after SE (see Materials and Methods) (Fig. 2A). High-threshold N-, P/Q-, and L-type currents were blocked with the organic Ca2+ channel blockers ω-conotoxin GVIA (2 μm), ω-conotoxin MVIIC (3 μm), ω-agatoxin GIVA (200 nm), and nifedipine (10 μm). Under these conditions, depolarizing steps to subthreshold potentials (−43 mV) elicited inactivating inward currents in all experimental groups (Sochivko et al., 2002) (Fig. 2A, representative examples for sham-control and SE-experienced mice). To exclude even a small contribution of R-type Ca2+ currents, we recorded Ca2+ tail currents after brief (20 ms) depolarizing voltage steps, in which slowly deactivating components correspond to T-type Ca2+ currents, with a negligible contribution of R-type Ca2+ currents (Fig. 2B) (Sochivko et al., 2002). As described previously for rats (Su et al., 2002), tail currents mediated by T-type Ca2+ channels were significantly augmented in the SE-experienced (n = 10) versus sham-control (n = 5) Cav3.2+/+ mice (2.2-fold and 1.8-fold increase for voltage steps to −43 and −33 mV, respectively; p = 0.024 for both comparisons, Mann–Whitney U test) (Fig. 2C,D). In contrast, SE did not induce upregulation of these currents in Cav3.2−/− mice (Fig. 2B–D), confirming that the upregulation is caused by augmented expression of Cav3.2.
Figure 2.

Cav3.2 upregulation underlies increased T-type Ca2+ currents in CA1 neurons after SE. A, Representative examples of T-type Ca2+ currents elicited in the presence of the organic Ca2+ channel blockers ω-conotoxin GVIA (2 μm), ω-conotoxin MVIIC (3 μm), ω-agatoxin IVA (200 nm), and nifedipine (10 μm). Voltage steps to potentials of −43 mV caused activation of a transient, inactivating Ca2+ current mainly reflecting T-type Ca2+ currents. B, To allow discrimination of T-type from R-type Ca2+ currents, tail currents were measured after brief depolarizing steps (20 ms). Slowly deactivating tail currents reflect almost exclusively activation of T-type Ca2+ currents. C, D, Quantification of the magnitude of T-type Ca2+ currents at test pulse potentials of −43 and −33 mV reveals a 2.2-fold and 1.8-fold increase, respectively. T-type Ca2+ currents were significantly augmented after SE in Cav3.2+/+ mice but not in Cav3.2−/− mice. Error bars indicate SEM, p < 0.05.
The expression of all pore-forming and accessory Cav subunits was also analyzed in SE-experienced Cav3.2−/− mice. The pattern of subunit regulation was very similar to that observed in Cav3.2+/+ mice, with no changes in any of the pore-forming subunits at any time point (2, 10, and 50 d after SE; n > 5 for all groups). The only significant regulation observed was for accessory subunits, with an upregulation of β1 and β2 subunits (n > 5 for all groups) (supplemental Fig. 3, available at www.jneurosci.org as supplemental material). Thus, deleting Cav3.2 subunits appears to leave the SE-induced regulation of accessory subunits essentially intact. Additionally, these data show that accessory subunit regulation alone is not sufficient to mediate an upregulation of T-type calcium currents. Rather, an upregulation of Cav3.2 is required.
Interestingly, T-type Ca2+ currents in Cav3.2−/− sham-control mice were not smaller than those in Cav3.2+/+ mice (Fig. 2C,D), indicating some form of compensation by other T-type Ca2+ channel subunits. This compensation was not transcriptional, because the levels of Cav3.1, Cav3.3, or Cav2.3 mRNA in the two groups of mice were the same.
Cav3.2 upregulation induces a transient switch from regular to burst firing
We next examined the consequences of SE-induced upregulation of Cav3.2 for the intrinsic discharge behavior of CA1 pyramidal cells. To this end, we used intracellular recordings with sharp microelectrodes and elicited action potentials with depolarizing current injections. In sham-control Cav3.2+/+ and Cav3.2−/− mice examined 7–15 d (12.4 ± 0.7 d) after treatment (Fig. 3Aa1–a3,Ba1–a3), all neurons generated a single spike to brief stimuli (a3) and trains of independent spikes to long stimuli (a1,a2) (nine neurons from five mice). Therefore, they were classified as regular-firing cells (Fig. 3D) [see Sanabria et al. (2001) and Materials and Methods]. In contrast, in SE-experienced Cav3.2+/+ mice similarly examined 7–15 d (11.3 ± 1.2 d) after SE, ∼70% of the neurons exhibited a burst of action potentials as their threshold response to brief (Fig. 3Ab3) or prolonged (six of nine neurons from six mice) current injections (Fig. 3Ab2, leftmost bars) (p < 0.00001, χ2 test). In SE-experienced Cav3.2−/− mice, however, the incidence of burst firing was ∼14% (11.4 ± 0.4 d after SE; one of seven neurons from four mice) (Fig. 3Bb1–b3, representative example). These data are summarized in Figure 3D (rightmost bars).
Figure 3.

Cav3.2 upregulation underlies aberrant bursting after SE. A, Firing behavior of representative CA1 pyramidal cells (PCs) in a sham-control Cav3.2+/+ mouse (a1–a3) and a SE-experienced Cav3.2+/+ mouse (b1–b3), from a group recorded 7–15 d after treatment (cell in a, 12 d after sham treatment; cell in b, 9 d after SE). The bottommost traces in each panel correspond to the current injection step, and the topmost traces correspond to voltage recordings. In Aa2,a3,b2,b3 and Ca2,a3,b2,b3, the current injection step was just suprathreshold for generating an action potential. In a1 and b1, the current injection step was increased to elicit repetitive firing. B, Equivalent analysis as in A, but with Cav3.2−/− mice. C, Firing behavior of representative CA1 PCs from a group recorded 20–53 d after treatment in sham-control and SE-experienced Cav3.2+/+ mice in a (cell recorded 49 d after sham treatment) and b (cell recorded 22 d after SE), respectively. D, Quantification of the fraction of burst-firing neurons in the different experimental groups 7–15 d after treatment. Upregulation of burst firing after SE in Cav3.2+/+ mice was strongly attenuated in Cav3.2−/− mice. E, Quantification of the fraction of burst-firing neurons in the group measured 20–53 d after treatment. F, Sensitivity of aberrant burst firing in SE-experienced wild-type mice to Ni2+. The discharge of a burst-firing neuron in control ACSF (a1,a2) and after application of 100 μm Ni2+ (b1,b2). Traces from a2 and b2 are superimposed at larger magnification in c, demonstrating that application of Ni2+ dispersed the burst and markedly reduced the spike ADP.
Given the transient upregulation of Cav3.2 after SE, we tested whether aberrant bursting is maintained in Cav3.2+/+ mice long after SE. Burst firing was only rarely observed in neurons examined 20–53 d after SE (∼6%, 1 of 17 neurons from 12 mice) (Fig. 3C, compare a, b) and never in sham-control Cav3.2+/+ mice (seven neurons from six mice) (summary in Fig. 3E). In Cav3.2−/− mice, no bursting CA1 neurons were observed either in the sham-control (10 neurons from four mice) or in the SE-experienced (five neurons from three mice) group (summary in Fig. 3E).
In CA1 pyramidal cells, an increase in the propensity for bursting is associated with an increase in the magnitude of the graded spike ADP (Su et al., 2002; Yaari et al., 2007). Indeed, spike ADPs were larger in SE-experienced Cav3.2+/+ mice at the first days after SE (103 ± 27.6 mV · s; n = 7) compared with sham-control mice (34.3 ± 8.0 mV · s; n = 8; p < 0.05, Mann–Whitney U test). This increase was no longer detected 20–53 d after SE. In Cav3.2−/− mice, spike ADPs were not significantly increased at any time point after SE. These data are consistent with the appearance of burst firing only in Cav3.2+/+ neurons at an early time point after SE. The passive membrane properties of CA1 pyramidal cells were not significantly different between sham-control and SE-experienced animals, although there was a trend for action potential thresholds to be more hyperpolarized in SE-experienced mice (supplemental Table 2, available at www.jneurosci.org as supplemental material).
Because Cav3.2 channels are highly sensitive to low concentrations of Ni2+, we examined whether aberrant bursting in SE-experienced Cav3.2+/+ mice is blocked by Ni2+, as previously found in rats (Su et al., 2002; Yaari et al., 2007). Indeed, application of 100 μm Ni2+ to bursting CA1 neurons converted them to regular-firing neurons (Fig. 3Fa1,b1). As expected, Ni2+ also substantially reduced the spike ADP underlying the burst discharge (Fig. 3Fa2,b2, superimposed in c) (n = 4; ADP area reduction from 61.9 ± 17.2 to 34.0 ± 5.5 mV · s).
Pilocarpine-induced SE is comparable in Cav3.2+/+ and Cav3.2−/− mice
A potential pitfall in the interpretation of the data described above is that pilocarpine-induced SE in Cav3.2−/− mice could be milder than in Cav3.2+/+ mice. We addressed this issue by comparing the acute EEG and behavioral changes evoked by pilocarpine in the two groups of mice. The EEG was recorded telemetrically using electrodes implanted at least 1 week before induction of SE to allow a prolonged period of baseline EEG recordings (Fig. 4A). No differences were observed in baseline EEG recordings between Cav3.2+/+ and Cav3.2−/− mice (n = 5 for both groups) (Fig. 4A, leftmost panels). Application of pilocarpine first caused isolated electrographic seizures depicted as increases in the band power in the gamma range in representative Cav3.2+/+ and Cav3.2−/− mice (Fig. 4B) (more than stage III seizures are marked with asterisks; the zero time point corresponds to the time of pilocarpine injection; dots indicate the time points of the EEG recordings in A). Subsequently, animals experienced a period of continuous tonic–clonic seizures without individual separable seizure events, termed SE (see Materials and Methods). The intensity of electrographic activity during SE was quantified as the area under the band power curves for each frequency band from the initiation of continuous electrographic seizure activity until the time point of diazepam injection. No significant differences between Cav3.2+/+ and Cav3.2−/− mice were observed with respect to the relative increase in band power during SE for any frequency band (Fig. 4C). The duration of SE was also not different. It was quantified as the time during which band power was increased to >10% of maximal values. This quantification was performed for theta to gamma bands and did not reveal a difference between the two groups for any frequency band (Fig. 4E). We also quantified the latency to the first seizure (at least stage III; see Materials and Methods) or to SE after pilocarpine administration. Both parameters were not different when comparing Cav3.2−/− mice and littermate Cav3.2 controls (latency to first seizure: Cav3.2+/+, 33.1 ± 2.0; Cav3.2−/−, 331 ± 3.2; Mann–Whitney U test, 0.91; latency to SE: Cav3.2+/+, 51.1 ± 2.9; Cav3.2−/−, 56.3 ± 4.1; Mann–Whitney U test, 0.5). After termination of SE with diazepam, activity was substantially decreased but was still increased relative to pre-SE baseline (Fig. 4B). To exclude that residual activity after diazepam injection is altered in Cav3.2−/− mice, we also analyzed electrographic activity from the diazepam injection up to 24 h after the injection. When average band power over this time period was compared between Cav3.2+/+ and Cav3.2−/− mice, the activity levels were also similar (Fig. 4D). These results indicate that deletion of Cav3.2−/− does not alter the intensity of electrographic seizure activity experienced after pilocarpine injection.
Figure 4.

Electroencephalographic and behavioral features of pilocarpine-induced SE in Cav3.2+/+ and Cav3.2−/− mice. A, Representative EEG recordings 5 min after pilocarpine application (when no signs of seizures are observed) and 5, 20, and 40 min after the start of SE for Cav3.2+/+ and Cav3.2−/− mice. B, EEG recordings before and during pilocarpine-induced SE were subjected to Fourier transformation, and the power in different frequency bands was analyzed in Cav3.2+/+ and Cav3.2−/− mice (left and right, respectively; animals identical to those shown in A). Representative analyses of band power in the gamma band are shown. The zero time point corresponds to the time of pilocarpine injection. Asterisks mark isolated behavioral seizures (at least stage III; see Materials and Methods) before animals enter continuous SE (see Materials and Methods). Dots mark the time points of the EEG recordings shown in A. Diazepam was administered to terminate SE, as indicated. AU, Arbitrary units. C, As a measure for the severity of SE, the area under the different band power curves was determined from the initiation of continuous electrographic seizure activity until the time point of diazepam injection. The resultant values were normalized to the area under the band power curve obtained from baseline EEG recordings of identical duration obtained 24 h before SE. No significant differences with respect to the increase in all frequency bands during SE, compared with the basal EEG, were observed between Cav3.2+/+ and Cav3.2−/− mice. D, Electrographic changes during the first 24 h after diazepam injection were not significantly different between Cav3.2+/+ and Cav3.2−/− mice. Band power was computed as in C. E, The duration of increased activity in the different frequency bands was quantified as the period during which band power exceeded 10% of maximum band power. No differences in duration were observed for any frequency band. Analysis in the δ-band was not performed because a clear band power peak could not be delineated. Error bars indicate SEM.
SE-induced neuronal cell loss is absent in Cav3.2−/− mice
One hallmark of SE-induced epileptogenesis is the development of subfield-specific neuronal cell loss and axonal reorganization in the hippocampal formation. These neuropathological changes resemble those described in human temporal lobe epilepsy (TLE) with Ammon's horn sclerosis (Wyler et al., 1992; Blümcke et al., 1999; Wieser, 2004). In Cav3.2+/+ mice, SE caused progressive pyramidal cell loss in the CA1 and CA3 subfields. No neuron loss was evident in sections obtained 2 d after SE (Fig. 5A), whereas it was extensive in sections obtained 50 d after SE (Fig. 5B). The progressive neuron loss in CA1 and CA3 subfields are quantified in Figure 5, C and D (top panels). Although less remarkable, granule cell loss in the dentate gyrus was also observed in Cav3.2+/+ mice after SE (Fig. 5E, top) (n = 7–8; sham-control animals, n = 6–8). In marked contrast, SE caused no substantial neuronal loss in hippocampi of Cav3.2−/− mice (Fig. 5A,B, right panels, C–E, bottom panels) (n = 5–8 mice per group). In addition, we analyzed neuronal loss in the dentate hilus 50 d after SE. The number of hilar neurons was significantly reduced at this time point in Cav3.2+/+ mice (from 5.8 ± 0.22 neurons/2500 μm2 in Cav3.2+/+ sham-control to 2.23 ± 0.93 neurons/2500 μm2 in Cav3.2+/+ SE; p < 0.001), but not in Cav3.2−/− mice (sham-control, 5.63 ± 0.57 neurons/2500 μm2; SE, 3.74 ± 1.71 neurons/2500 μm2; p = 0.16; n = 5 for all groups). In the temporal neocortex, the entorhinal cortex, and the ventral subiculum, however, no significant neuronal cell loss was present in either Cav3.2+/+ or Cav3.2−/− mice (Fig. 5F) (n = 5 for all groups). These data show that deleting Cav3.2 confers virtually complete hippocampal neuroprotection after SE.
These results raise the possibility that the upregulation of Cav3.2 and associated bursting early after SE play a causative role in neuronal cell death. Alternatively, however, neuronal death may be triggered by Ca2+ influx through Cav3.2 channels during the initial SE independent of Cav3.2 upregulation at day 3 after SE (Fig. 1). The latter hypothesis predicts that in the first 2 d after SE (i.e., before the emergence of Cav3.2-dependent bursting), signs of early apoptotic degeneration should be more pronounced in Cav3.2+/+ mice than in Cav3.2−/−. We have therefore examined apoptotic degeneration 2 d after SE (Fig. 6, Table 1) using TUNEL staining (see Materials and Methods). In sham-control animals of either genotype, no TUNEL-positive cells were detected (data not shown). On day 2 after SE, both Cav3.2+/+ and Cav3.2−/− mice (n = 5 animals for all groups) showed a significant number of TUNEL-positive neurons (Fig. 6A, magnified micrographs of the CA1 pyramidal cell layer and dentate granule cell layer in Fig. 6B; quantification in Table 1). No significant differences in TUNEL-positive cell numbers after SE were detected between the two groups. We also assessed neuronal damage at the same time point using Fluoro-Jade staining. In sham-control animals, no Fluoro-Jade-positive neurons were seen (data not shown). On day 2 after SE, both Cav3.2+/+ and Cav3.2−/− mice (n = 5 animals for all groups) showed Fluoro-Jade-positive neurons. As with the TUNEL staining, there was no significant difference in the amount of Fluoro-Jade-positive neurons when comparing both genotypes (Fig. 6C, magnified micrographs of the CA1 pyramidal cell layer and dentate gyrus; quantification in Table 1).
Figure 6.

TUNEL and Fluoro-Jade staining at an early time point after SE. A, Representative TUNEL-stained hippocampal sections from sham-control and SE-experienced Cav3.2+/+ and Cav3.2−/− mice at day 2 after SE. Note TUNEL staining in the CA1 region of both Cav3.2−/− and Cav3.2+/+ mice. B, Magnified views of the CA1 pyramidal cell layer and dentate gyrus granule cell layer showing TUNEL-positive neurons in CA1, but not the dentate gyrus. C, Magnified views of the CA1 pyramidal cell layer and dentate gyrus granule cell layer showing Fluoro-Jade-positive neurons in CA1, but not the dentate gyrus. DG, dentate gyrus granule cell layer.
Table 1.
Quantification of TUNEL and Fluoro-Jade staining in different hippocampal subfields at day 2 after SE
| CA1 | CA3 | DG | Hilus | |
|---|---|---|---|---|
| TUNEL | ||||
| Cav3.2+/+ | 26.4 ± 11.5 | 0.8 ± 0.3 | 0.1 ± 0.1 | 5.2 ± 0.5 |
| Cav3.2−/− | 16.9 ± 6.0 | 2.3 ± 1.5 | 0.1 ± 0.0 | 5.0 ± 1.3 |
| Fluoro-Jade | ||||
| Cav3.2+/+ | 28.0 ± 11.9 | 1.3 ± 0.4 | 0.2 ± 0.2 | 7.7 ± 0.8 |
| Cav3.2−/− | 17.0 ± 4.3 | 2.9 ± 1.3 | 0.5 ± 0.3 | 7.3 ± 2.7 |
No significant differences with respect to TUNEL-positive cells were present between CaV3.2+/+ and CaV3.2−/− mice at day 2 after SE in the different subfields (n = 5 animals for each group under study; Mann–Whitney U test: CA1, p = 0.83; CA3, 0.43; DG, 0.32; hilus, 0.92). Likewise, no significant differences with respect to Fluoro-Jade-positive cells were seen (n = 5 for each group; Mann–Whitney U test: CA1, p = 0.69; CA3, 0.31; DG, 0.69; hilus, 0.31). There were virtually no significant TUNEL- or Fluoro-Jade-positive neurons in sham control animals (data not shown). DG, Dentate gyrus.
These results suggest that neuronal cell loss is not triggered by Ca2+ influx through Cav3.2 channels during or early after SE. Rather, they favor the hypothesis that neuronal cell loss is causatively linked to Cav3.2 upregulation.
Mossy fiber sprouting is absent in Cav3.2−/− mice
Sprouting of mossy fibers into the supragranular layer of the dentate gyrus is another hallmark of experimental and human TLE (Houser, 1992; Cavazos et al., 2003). In Cav3.2+/+ mice, mossy fiber sprouting monitored by Timm staining (see Materials and Methods) developed gradually after SE. No sprouting was observed at day 2 after SE (data not shown). Sparse Timm granules were observed at 10 d after SE, and prominent staining was seen 50 d after SE (Fig. 7A, compare left top and bottom panels; see insets for a magnification of the dentate gyrus molecular layer). In contrast, mossy fiber sprouting after SE was strongly reduced in Cav3.2−/− compared with Cav3.2+/+ mice (Fig. 7A, 50 d after SE, compare right top and bottom panels and insets). A semiquantitative analysis of Timm granules in the inner molecular layer according to a quantification system modified from Mello et al. (1993) (see Materials and Methods) confirmed these results (Fig. 7B, numbers of animals per group as reported for neuronal cell counts). A significant increase in supragranular neo-Timm staining was observed in Cav3.2+/+ mice at late stages (50 d; n ≥ 8; p < 0.05, χ2 test), whereas this increase was strongly reduced in Cav3.2−/− mice (Fig. 7B, right). At earlier stages, supragranular neo-Timm staining was less pronounced overall, but even then the degree of sprouting was reduced in SE-experienced Cav3.2−/− mice after SE (Fig. 7B, left) (n ≥ 7). In all sham-control animals, the molecular layer of the dentate gyrus was completely devoid of Timm staining.
Development of chronic seizures is strongly reduced in Cav3.2−/− mice
Given the striking neuroprotection observed in Cav3.2−/− mice, we tested whether deletion of Cav3.2 subunits retards the development of chronic epilepsy. To this end, we performed long-term telemetric EEG/video monitoring to determine the frequency and severity of spontaneous epileptic seizures in mice 9–26 d after SE (representative examples of EEG from sham-control animals and of interictal EEG in SE-experienced animals as indicated) (Fig. 8A). During long-term EEG recordings, spontaneous seizures were observed in all SE-experienced Cav3.2+/+ mice (n = 7), with an increase in spontaneous stage III/IV seizures (see Materials and Methods) over time after SE (Fig. 8B, representative EEG recordings of seizures, C, quantification of seizure frequency, black bars). Spontaneous seizures also occurred in most (five of seven) SE-experienced Cav3.2−/− mice but were substantially less frequent (Fig. 8B, representative EEG recordings, C, quantification of seizure frequency, gray bars). Two SE-experienced Cav3.2−/− mice did not exhibit spontaneous seizures of any type. In addition, when considering stage III and IV seizures separately, we found that Cav3.2−/− mice exhibited significantly less stage IV seizures, with only a single Cav3.2−/− mouse exhibiting two stage IV seizures (χ2 test, p < 0.001) (Fig. 8D). The duration of individual seizure episodes (Fig. 8E), as well as the average amplitude of the EEG activity during the seizures (Fig. 8F), was not significantly different when comparing SE-experienced Cav3.2+/+ and Cav3.2−/− mice. We also examined the interictal EEG in SE-experienced Cav3.2+/+ and Cav3.2−/− mice and noted the occurrence of EEG polyspikes (see Materials and Methods for definition) in both groups (Fig. 8A,G). However, they occurred significantly more often in SE-experienced Cav3.2+/+ compared with Cav3.2−/− mice (Cav3.2+/+: 95 ± 21 spikes per hour, n = 7; Cav3.2−/−: 27 ± 6 spikes per hour, n = 6; *p < 0.05, t test; spikes quantified in animals between days 12 and 14 after SE; one Cav3.2−/− mouse rejected as outlier; criteria for rejecting as an outlier were that the spike number was outside of a range defined by the mean spike number ±2 times the SD including the putative outlier). Thus, deletion of Cav3.2 not only prevented the neuropathological sequelae of SE in the hippocampus but also dramatically attenuated the development of chronic epilepsy.
Discussion
Here we show that SE causes a transient transcriptional upregulation of Cav3.2 channels, producing an increase in T-type Ca2+ currents, which in turn transforms CA1 pyramidal neurons from regular to burst firing mode. Genetic deletion of Cav3.2 prevents this form of intrinsic plasticity, protects against SE-induced neuropathological hippocampal damage, and ameliorates the development of chronic epilepsy. These data are consistent with the view that Cav3.2 upregulation and associated bursting is a key early event in epileptogenesis.
The time course of the molecular and functional changes we observed are in line with this idea. We found that the SE-induced upregulation of Cav3.2 at the mRNA and protein levels and the emergence of Cav3.2-dependent bursting occurred within a few days after SE. Moreover, these changes were transient, reversing within 1 month after SE. Thus, changes in Cav3.2 precede the onset of spontaneous seizures in our model, which occurred at ≥12 d after SE. It should be noted that we previously described an upregulation of intrinsic burst firing in rats after SE, without a detailed analysis of different time points after SE [2–6 weeks after SE (Sanabria et al., 2001) and 6–40 d after SE (Su et al., 2002)]. Reanalysis of these data also revealed a peak of bursting behavior early after SE, with a subsequent decline. However, in contrast to the present study, bursting neurons were also observed at longer intervals after SE (Y. Yaari, unpublished data). This more prolonged time course may be attributable to the threefold longer SE used to induce epileptogenesis (120 min instead of 40 min in the present study), or to species differences.
The presence of burst firing in our model exclusively at early time points after SE and not at later stages also suggests that Cav3.2-dependent changes in intrinsic excitability do not contribute directly to the neuronal hyperexcitability observed at the chronic stage of epileptogenesis. This conclusion is consistent with the finding that chronic seizures in the pilocarpine model are not suppressed by application of ethosuximide (Leite and Cavalheiro, 1995), which blocks T-type Ca2+ channels including Cav3.2 (Gomora et al., 2001).
How could Cav3.2 upregulation and associated bursting be linked to the subsequent emergence of spontaneous seizures? The conversion of CA1 neurons from regular to burst firing may trigger a number of persistent changes in neuronal functional properties. First, the likelihood for the expression of synaptic long-term potentiation is enhanced at synaptic pathways terminating on bursting neurons (Thomas et al., 1998; Pike et al., 1999). Therefore, the upregulation of Cav3.2-dependent bursting, in conjunction with the augmented T-type Ca2+ currents and Ca2+ spikes in the apical dendrites (Yaari et al., 2007), may promote a global persistent strengthening of afferent excitatory synapses (Zhang and Linden, 2003) and lead to long-term changes in hippocampal functional connectivity. Second, expression of Cav3.2 channels has been shown to regulate the expression of other voltage-gated ion channels (Chemin et al., 2002), suggesting that Cav3.2 upregulation in CA1 pyramidal cells may trigger additional changes in intrinsic properties of these neurons.
Deletion of Cav3.2 subunits also completely prevented the subfield-specific neuronal loss and sprouting of mossy fibers that is characteristic both of experimental and human TLE (Wyler et al., 1992; Mello et al., 1993; Wieser, 2004). Indeed, Ca2+ entering through T-type channels has been suggested to contribute to cellular vulnerability via specific signaling pathways (e.g., involving the calpain system) (Sandmann et al., 2002). This finding is consistent with the idea that Cav3.2 upregulation triggers an episode of increased intrinsic bursting, which then causes neuronal death. Alternatively, Cav3.2 channels could be required during the early phases after SE to trigger early phases of neuronal cell death, independent of the upregulation of Cav3.2-dependent bursting that occurs later. We therefore examined early apoptotic degeneration 2 d after SE. We reasoned that if Cav3.2 directly triggers neurodegeneration, then signs of early apoptotic degeneration should be less pronounced in Cav3.2−/− compared with Cav3.2+/+ mice. We found no significant difference in TUNEL- or Fluoro-Jade-positive cells at day 2 after SE when comparing Cav3.2−/− and Cav3.2+/+ mice, although a trend in this direction was observed. These results suggest that neuronal cell death is not significantly facilitated by Ca2+ influx through Cav3.2 channels during SE. They are more consistent with a causative role for Cav3.2 upregulation occurring a few days after SE in induction of neuronal death. It is possible that the increase in T-type Ca2+ current density, in conjunction with the apical dendritic Ca2+ spikes and somatic bursting, collectively cause a detrimental Ca2+ load in pyramidal neurons. A factor that would further enhance Ca2+ influx into neurons is the reversal of GABAA receptor-mediated currents from hyperpolarizing to depolarizing because a decrease in KCC2 expression (Pathak et al., 2007). In this situation, GABA causes postsynaptic excitation associated with massive Ca2+ influx via all types of voltage-gated Ca2+ channels that depends critically on the activation of Cav3.2 channels (Aptel et al., 2007). Thus, upregulation of Cav3.2 channels would strongly increase Ca2+ influx into CA1 neurons via a number of mechanisms, consistent with a role of this upregulation in promoting neuronal vulnerability.
The deletion of Cav3.2 subunits also prevented mossy fiber sprouting after SE. Although this effect may be secondary to the prevention of neuronal cell loss, it also raises the possibility that Cav3.2 may play a direct role in axonal sprouting in TLE. Indeed, Cav3.2 channels were shown to play an essential role in neuritogenesis (Chemin et al., 2002). Identifying those neurons that have upregulated Cav3.2 subunits after SE by genetic techniques or immunolabeling may now permit to address which specific cellular pathways lead from Cav3.2 upregulation to the induction of neuronal cell death and axonal sprouting.
Although these data suggest that the transient upregulation of bursting is an important event in epileptogenesis and the associated morphological and functional changes, caution is warranted in the interpretation of these data. First, we note that although the amount of chronic seizures after SE was strongly reduced in all Cav3.2−/− mice, most of these animals (five of seven) did display a few spontaneous seizures. These seizures occurred with a similar latency after SE. This indicates that SE induces additional changes unrelated to Cav3.2 that may be sufficient for epileptogenesis. Second, we have used a constitutive deletion of Cav3.2 subunits to probe the role of this subunit in epileptogenesis. We can therefore not completely exclude developmental effects of Cav3.2 deletion that modulate the capacity of the brain for SE-induced plasticity, Likewise, the lack of Cav3.2 subunits in extrahippocampal areas might conceivably affect the development of chronic epilepsy. Such areas appear to be important in the development of chronic epilepsy in different chronic epilepsy models. Area-specific as well as temporally controlled deletion of Cav3.2 subunits would be desirable to more conclusively address the role of this channel in epileptogenesis.
Nevertheless, our data suggest a major role for Cav3.2 in chronic epilepsy and a critical role in the development of associated neuropathological changes. The advent of more selective blockers of Cav3.2, or of inhibitors of Cav3.2 upregulation may prove therapeutically useful to impede epileptogenesis at its latent stage and thus protect against brain damage and the emergence of a chronic epileptic condition.
Footnotes
This work was supported by the Deutsche Forschungsgemeinschaft (DFG) (SFB TR3 B8, SFB TR3 C2, and SFB TR3 C6 to A.J.B., Y.Y., H.B., and S.S.; DFG-Emmy Noether Program to S.S.), Bundesministerium für Bildung und Forschung and Ministry of Science and Technology (A.J.B., H.B., and Y.Y.), Nationales Genomforschungsnetzwerk plus (H.B., S.S., and A.J.B.), EPICURE (H.B. and A.J.B.), and the BONFOR program of the University of Bonn Medical Center. Y.Y. was supported by the Henri and Erna Leir Chair for Research in Neurodegenerative Diseases. K.P.C. is an investigator of Howard Hughes Medical Institute. We thank E. Perez-Reyes for supplying HEK cell lines expressing Cav3 subunits. We thank P. Theofilas for technical support and S. Normann and M. Reitze for excellent technical assistance.
References
- Aptel H, Hilaire C, Pieraut S, Boukhaddaoui H, Mallie S, Valmier J, Scamps F. The Cav3.2/alpha1H T-type Ca2+ current is a molecular determinant of excitatory effects of GABA in adult sensory neurons. Mol Cell Neurosci. 2007;36:293–303. doi: 10.1016/j.mcn.2007.07.009. [DOI] [PubMed] [Google Scholar]
- Arikkath J, Campbell KP. Auxiliary subunits: essential components of the voltage-gated calcium channel complex. Curr Opin Neurobiol. 2003;13:298–307. doi: 10.1016/s0959-4388(03)00066-7. [DOI] [PubMed] [Google Scholar]
- Azouz R, Jensen MS, Yaari Y. Ionic basis of spike after-depolarization and burst generation in adult rat hippocampal CA1 pyramidal cells. J Physiol. 1996;492:211–223. doi: 10.1113/jphysiol.1996.sp021302. [DOI] [PMC free article] [PubMed] [Google Scholar]
- Beck H, Yaari Y. Plasticity of intrinsic neuronal properties in CNS disorders. Nat Rev Neurosci. 2008;9:357–369. doi: 10.1038/nrn2371. [DOI] [PubMed] [Google Scholar]
- Blümcke I, Beck H, Lie AA, Wiestler OD. Molecular neuropathology of human mesial temporal lobe epilepsy. Epilepsy Res. 1999;36:205–223. doi: 10.1016/s0920-1211(99)00052-2. [DOI] [PubMed] [Google Scholar]
- Blümcke I, Schewe JC, Normann S, Brüstle O, Schramm J, Elger CE, Wiestler OD. Increase of nestin-immunoreactive neuronal precursor cells in the dentate gyrus of pediatric patients with early-onset temporal lobe epilepsy. Hippocampus. 2001;11:311–321. doi: 10.1002/hipo.1045. [DOI] [PubMed] [Google Scholar]
- Cavazos JE, Zhang P, Qazi R, Sutula TP. Ultrastructural features of sprouted mossy fiber synapses in kindled and kainic acid-treated rats. J Comp Neurol. 2003;458:272–292. doi: 10.1002/cne.10581. [DOI] [PubMed] [Google Scholar]
- Chemin J, Nargeot J, Lory P. Neuronal T-type α 1H calcium channels induce neuritogenesis and expression of high-voltage-activated calcium channels in the NG108-15 cell line. J Neurosci. 2002;22:6856–6862. doi: 10.1523/JNEUROSCI.22-16-06856.2002. [DOI] [PMC free article] [PubMed] [Google Scholar]
- Chen CC, Lamping KG, Nuno DW, Barresi R, Prouty SJ, Lavoie JL, Cribbs LL, England SK, Sigmund CD, Weiss RM, Williamson RA, Hill JA, Campbell KP. Abnormal coronary function in mice deficient in alpha1H T-type Ca2+ channels. Science. 2003;302:1416–1418. doi: 10.1126/science.1089268. [DOI] [PubMed] [Google Scholar]
- Chen J, Sochivko D, Beck H, Marechal D, Wiestler OD, Becker A. Activity-induced expression of common reference genes in individual CNS neurons. Lab Invest. 2001;81:913–916. doi: 10.1038/labinvest.3780300. [DOI] [PubMed] [Google Scholar]
- Cribbs LL, Lee JH, Yang J, Satin J, Zhang Y, Daud A, Barclay J, Williamson MP, Fox M, Rees M, Perez-Reyes E. Cloning and characterization of alpha1H from human heart, a member of the T-type Ca2+ channel gene family. Circ Res. 1998;83:103–109. doi: 10.1161/01.res.83.1.103. [DOI] [PubMed] [Google Scholar]
- Cribbs LL, Gomora JC, Daud AN, Lee JH, Perez-Reyes E. Molecular cloning and functional expression of Ca(v)3.1c, a T-type calcium channel from human brain. FEBS Lett. 2000;466:54–58. doi: 10.1016/s0014-5793(99)01756-1. [DOI] [PubMed] [Google Scholar]
- Ertel EA, Campbell KP, Harpold MM, Hofmann F, Mori Y, Perez-Reyes E, Schwartz A, Snutch TP, Tanabe T, Birnbaumer L, Tsien RW, Catterall WA. Nomenclature of voltage-gated calcium channels. Neuron. 2000;25:533–535. doi: 10.1016/s0896-6273(00)81057-0. [DOI] [PubMed] [Google Scholar]
- Fink L, Seeger W, Ermert L, Hänze J, Stahl U, Grimminger F, Kummer W, Bohle RM. Real-time quantitative RT-PCR after laser-assisted cell picking. Nat Med. 1998;4:1329–1333. doi: 10.1038/3327. [DOI] [PubMed] [Google Scholar]
- Fujimoto T, Tanaka H, Kumamaru E, Okamura K, Miki N. Arc interacts with microtubules/microtubule-associated protein 2 and attenuates microtubule-associated protein 2 immunoreactivity in the dendrites. J Neurosci Res. 2004;76:51–63. doi: 10.1002/jnr.20056. [DOI] [PubMed] [Google Scholar]
- Gomora JC, Daud AN, Weiergraber M, Perez-Reyes E. Block of cloned human T-type calcium channels by succinimide antiepileptic drugs. Mol Pharmacol. 2001;60:1121–1132. [PubMed] [Google Scholar]
- Gomora JC, Murbartián J, Arias JM, Lee JH, Perez-Reyes E. Cloning and expression of the human T-type channel Ca(v)3.3: insights into prepulse facilitation. Biophys J. 2002;83:229–241. doi: 10.1016/s0006-3495(02)75164-3. [DOI] [PMC free article] [PubMed] [Google Scholar]
- Houser CR. Morphological changes in the dentate gyrus in human temporal lobe epilepsy. Epilepsy Res Suppl. 1992;7:223–234. [PubMed] [Google Scholar]
- Jensen MS, Azouz R, Yaari Y. Variant firing patterns in rat hippocampal pyramidal cells modulated by extracellular potassium. J Neurophysiol. 1994;71:831–839. doi: 10.1152/jn.1994.71.3.831. [DOI] [PubMed] [Google Scholar]
- Jensen MS, Azouz R, Yaari Y. Spike after-depolarization and burst generation in adult rat hippocampal CA1 pyramidal cells. J Physiol. 1996;492:199–210. doi: 10.1113/jphysiol.1996.sp021301. [DOI] [PMC free article] [PubMed] [Google Scholar]
- Leite JP, Cavalheiro EA. Effects of conventional antiepileptic drugs in a model of spontaneous recurrent seizures in rats. Epilepsy Res. 1995;20:93–104. doi: 10.1016/0920-1211(94)00070-d. [DOI] [PubMed] [Google Scholar]
- López-Gallardo M, Llorente R, Llorente-Berzal A, Marco EM, Prada C, Di Marzo V, Viveros MP. Neuronal and glial alterations in the cerebellar cortex of maternally deprived rats: gender differences and modulatory effects of two inhibitors of endocannabinoid inactivation. Dev Neurobiol. 2008;68:1429–1440. doi: 10.1002/dneu.20672. [DOI] [PubMed] [Google Scholar]
- Mello LE, Cavalheiro EA, Tan AM, Kupfer WR, Pretorius JK, Babb TL, Finch DM. Circuit mechanisms of seizures in the pilocarpine model of chronic epilepsy: cell loss and mossy fiber sprouting. Epilepsia. 1993;34:985–995. doi: 10.1111/j.1528-1157.1993.tb02123.x. [DOI] [PubMed] [Google Scholar]
- McKay BE, McRory JE, Molineux ML, Hamid J, Snutch TP, Zamponi GW, Turner RW. Ca(V)3 T-type calcium channel isoforms differentially distribute to somatic and dendritic compartments in rat central neurons. Eur J Neurosci. 2006;24:2581–2594. doi: 10.1111/j.1460-9568.2006.05136.x. [DOI] [PubMed] [Google Scholar]
- McNamara JO. Emerging insights into the genesis of epilepsy. Nature. 1999;399:A15–A22. doi: 10.1038/399a015. [DOI] [PubMed] [Google Scholar]
- Pathak HR, Weissinger F, Terunuma M, Carlson GC, Hsu FC, Moss SJ, Coulter DA. Disrupted dentate granule cell chloride regulation enhances synaptic excitability during development of temporal lobe epilepsy. J Neurosci. 2007;27:14012–14022. doi: 10.1523/JNEUROSCI.4390-07.2007. [DOI] [PMC free article] [PubMed] [Google Scholar]
- Perez-Reyes E. Molecular physiology of low-voltage-activated t-type calcium channels. Physiol Rev. 2003;83:117–161. doi: 10.1152/physrev.00018.2002. [DOI] [PubMed] [Google Scholar]
- Pike FG, Meredith RM, Olding AW, Paulsen O. Rapid report: postsynaptic bursting is essential for ‘Hebbian’ induction of associative long-term potentiation at excitatory synapses in rat hippocampus. J Physiol (Lond) 1999;518:571–576. doi: 10.1111/j.1469-7793.1999.0571p.x. [DOI] [PMC free article] [PubMed] [Google Scholar]
- Pitsch J, Schoch S, Gueler N, Flor PJ, van der Putten H, Becker AJ. Functional role of mGluR1 and mGluR4 in pilocarpine-induced temporal lobe epilepsy. Neurobiol Dis. 2007;26:623–633. doi: 10.1016/j.nbd.2007.03.003. [DOI] [PubMed] [Google Scholar]
- Sanabria ERG, Su H, Yaari Y. Initiation of network bursts by Ca2+-dependent intrinsic bursting in the rat pilocarpine model of temporal lobe epilepsy. J Physiol. 2001;532:205–216. doi: 10.1111/j.1469-7793.2001.0205g.x. [DOI] [PMC free article] [PubMed] [Google Scholar]
- Sandmann S, Spormann J, Prenzel F, Shaw L, Unger T. Calcium channel blockade limits transcriptional, translational and functional up-regulation of the cardiac calpain system after myocardial infarction. Eur J Pharmacol. 2002;453:99–109. doi: 10.1016/s0014-2999(02)02384-1. [DOI] [PubMed] [Google Scholar]
- Sochivko D, Pereverzev A, Smyth N, Gissel C, Schneider T, Beck H. The Cav2.3 calcium channel subunit contributes to R-type calcium currents in murine hippocampal and neocortical neurones. J Physiol. 2002;542(3):699–710. doi: 10.1113/jphysiol.2002.020677. [DOI] [PMC free article] [PubMed] [Google Scholar]
- Su H, Sochivko D, Becker A, Chen J, Jiang Y, Yaari Y, Beck H. Upregulation of a T-type Ca2+ channel causes a long-lasting modification of neuronal firing mode after status epilepticus. J Neurosci. 2002;22:3645–3655. doi: 10.1523/JNEUROSCI.22-09-03645.2002. [DOI] [PMC free article] [PubMed] [Google Scholar]
- Thomas MJ, Watabe AM, Moody TD, Makhinson M, O'Dell TJ. Postsynaptic complex spike bursting enables the induction of LTP by theta frequency synaptic stimulation. J Neurosci. 1998;18:7118–7126. doi: 10.1523/JNEUROSCI.18-18-07118.1998. [DOI] [PMC free article] [PubMed] [Google Scholar]
- Wieser HG. ILAE Commission Report. Mesial temporal lobe epilepsy with hippocampal sclerosis. Epilepsia. 2004;45:695–714. doi: 10.1111/j.0013-9580.2004.09004.x. [DOI] [PubMed] [Google Scholar]
- Wyler AR, Dohan FC, Schweitzer JB, Berry AD. A grading system for mesial temporal pathology (hippocampal sclerosis) from anterior temporal lobectomy. J Epilepsy. 1992;5:220–225. [Google Scholar]
- Yaari Y, Beck H. “Epileptic neurons” in temporal lobe epilepsy. Brain Pathol. 2002;12:234–239. doi: 10.1111/j.1750-3639.2002.tb00438.x. [DOI] [PMC free article] [PubMed] [Google Scholar]
- Yaari Y, Yue C, Su H. Recruitment of apical dendritic T-type Ca2+ channels by backpropagating spikes underlies de novo intrinsic bursting in hippocampal epileptogenesis. J Physiol. 2007;580:435–450. doi: 10.1113/jphysiol.2007.127670. [DOI] [PMC free article] [PubMed] [Google Scholar]
- Zhang W, Linden DJ. The other side of the engram: experience-driven changes in neuronal intrinsic excitability. Nat Rev Neurosci. 2003;4:885–900. doi: 10.1038/nrn1248. [DOI] [PubMed] [Google Scholar]