

Abstract
When an animal smells an odor, olfactory sensory neurons generate an activity pattern across olfactory glomeruli of the first sensory neuropil, the insect antennal lobe or the vertebrate olfactory bulb. Here, several networks of local neurons interact with sensory neurons and with output neurons—insect projection neurons, or vertebrate mitral/tufted cells. The extent and form of information processing taking place in these local networks has been subject of controversy. To investigate the role of local neurons in odor information processing we have used the calcium sensor G-CaMP to perform in vivo recordings of odor-evoked spatiotemporal activity patterns in five genetically defined neuron populations of the antennal lobe of Drosophila melanogaster: three distinct populations of local neurons (two GABAergic and one cholinergic), as well as sensory neurons and projection neurons. Odor-specific and concentration dependent spatiotemporal response patterns varied among neuron populations. Activity transfer differed along the olfactory pathway for different glomerulus–odor combinations: we found cases of profile broadening and of linear and complex transfer. Moreover, the discriminability between the odors also varied across neuron populations and was maximal in projection neurons. Discriminatory power increased with higher odor concentrations over a wide dynamic range, but decreased at the highest concentration. These results show the complexity and diversity of odor information processing mechanisms across olfactory glomeruli in the fly antennal lobe.
Keywords: olfactory processing, odor concentration, antennal lobe network, local neurons, Drosophila melanogaster, calcium imaging
Introduction
The first neuropil of the olfactory system, the insect antennal lobe or the vertebrate olfactory bulb, is a highly structured sensory processing network. Axons of olfactory sensory neurons (OSNs) expressing a particular receptor converge, in most cases, to a single glomerulus of the antennal lobe/olfactory bulb, where they make synapses with secondary neurons and local neurons (Wilson and Mainen, 2006). Insect secondary neurons, so-called antennal lobe projection neurons (PNs), are analogues to the vertebrate mitral/tufted cells and in most cases innervate a single glomerulus (Stocker, 1994). In vertebrates, computation of olfactory information is performed by different populations of local neurons: periglomerular cells, short-axon cells, and granule cells (Wachowiak and Shipley, 2006; Wilson and Mainen, 2006). In insects, the morphology and function of local neurons are less well understood (Sachse and Galizia, 2006). At least two different populations of inhibitory local neurons have been implicated in processing olfactory information in the insect antennal lobe (Christensen et al., 1998a; Sachse and Galizia, 2002; Sachse et al., 2006), and different roles in olfactory coding have been proposed (Sachse and Galizia, 2006; Wilson and Mainen, 2006). Additionally, excitatory local neurons interconnect olfactory glomeruli in Drosophila (Olsen et al., 2007; Shang et al., 2007).
Several studies have proposed processing mechanisms that appear to contradict each other: while it has been shown that interglomerular connectivity in the antennal lobe narrows odor response profiles in honeybees (Sachse and Galizia, 2003; Linster et al., 2005), reports in Drosophila support either a neutral effect of the antennal lobe network in the propagation of olfactory information (Ng et al., 2002; Wang et al., 2003) or a broadening of the response profiles at the PN level (Wilson et al., 2004).
To investigate the role and impact of local neurons in olfactory coding, we have taken advantage of the genetic tractability of Drosophila. We have used five different Gal4 lines to drive expression of the calcium-sensitive reporter protein G-CaMP (Nakai et al., 2001) in OSNs, in three distinct local neuron subpopulations (two GABAergic, one cholinergic), and in PNs. We have recorded odor evoked responses to concentrations ranging from 10−7 to 10−2 v/v. We found that the response patterns of the local neuron subpopulations differed both spatially and temporally. Moreover, while OSNs and PNs both had clearly glomerular activity patterns, local neuron responses were more diffuse but not uniform across the antennal lobe, and revealed odor- and subpopulation-specific spatial patterns. We also found that odor discriminability varied between local neurons subpopulations, and was higher in PNs than OSNs across a wide concentration range. We propose putative roles for the different local neuron subpopulations in the synaptic network of the antennal lobe. Our data provide evidence that both response-profile broadening as well as linear and complex information transfers occur within the antennal lobe, and that these mechanisms appear to be specific for a particular glomerulus–odor combination. The resulting complexity allows the antennal lobe network to adapt to the wide variety of natural odors and concentrations that an animal encounters throughout its life.
Materials and Methods
Flies.
Adult female Drosophila melanogaster (aged 1–3 weeks) were used. Flies were reared in standard medium (100 ml contained: 91.8 ml of water, 11.8 g of sugar beet syrup, 1.08 g of yeast, 0.406 g of agar, 9.4 g of cornmeal, 0.24 ml of propionic acid), and kept at 25°C, 50–60% relative humidity with a 12 h:12 h light:darkness regime.
All experimental flies carried the UAS:G-CaMP 1.3 insertion in the first chromosome (crossed from wP[UAS:G-CaMP];CyO/Sp;+ flies provided by Jing Wang, University of California, San Diego, La Jolla, CA) (Nakai et al., 2001; Wang et al., 2003), and a promoter:Gal4 insertion to direct expression of the calcium sensor to the desired neuron subpopulation. OSNs were labeled with ywP[UAS:G-CaMP];P[OR83b:Gal4] (provided by Leslie Vosshall, Rockefeller University, New York, NY). PNs were labeled with ywP[UAS:G-CaMP];P[GH146:Gal4]/CyO (stable line crossed from +; P[GH146:Gal4] flies provided by Reinhard Stocker, University of Fribourg, Fribourg, Switzerland). P[Np1227:Gal4] and P[Np2426:Gal4] drive expression of Gal4 in two nonoverlapping subpopulations of GABAergic local neurons (R. Okada and K. Ito, unpublished work). Np1227 flies were of the genotype ywP[UAS:G-CaMP];P[Np1227:Gal4] (crossed from +;P[Np1227:Gal4]). Np2426 flies were either ywP[UAS:G-CaMP]/P[Np2426:Gal4];+/CyO or ywP[UAS:G-CaMP]/P[Np2426:Gal4];+/Sp (crossed from P[Np2426:Gal4]). Since P[Np2426:Gal4] and P[UAS:G-CaMP] are located in the same chromosome we used the F1 generation for experiments. No differences were found in the performance of the two genotypes (Sp or CyO). Excitatory local neurons were labeled using the KRAS:Gal4 line (Shang et al., 2007). KRAS flies were of the genotype ywP[UAS:G-CaMP];+;P[krasavietz:Gal4] (stable line crossed from +;+;P[krasavietz:Gal4], provided by Gero Miesenböck, Yale University, New Haven, CT).
Fly preparation.
Flies were prepared as previously described (Silbering and Galizia, 2007). Briefly, flies were immobilized on ice for 10 min and then fixed to a Plexiglas stage by the head and neck, with thorax and abdomen hanging freely (supplemental Fig. S1A, available at www.jneurosci.org as supplemental material). Antennae were pulled forward using fine wire to allow visual access to the antennal lobes. Then, a thin polyethylene foil supported by a plastic coverslip was sealed to the head with two-component silicon (Kwik Sil; WPI) and a hole was cut to expose the cuticle. After placing a drop of Ringer's (in mm: 130 NaCl, 5 KCl, 2 MgCl2, 2 CaCl2, 36 saccharose, 5 HEPES, pH 7.3) (Estes et al., 1996) on top of the head, a window was cut in the cuticle. Glands and air sacks were removed, and saline was exchanged several times.
Odorant preparation and application.
Fifty microliters of the pure odor substance were diluted in 5 ml of mineral oil (Sigma-Aldrich) for the highest concentration tested (10−2 v/v). Tenfold serial dilutions were made down to a concentration of 10−7 v/v (throughout the text the indication v/v is omitted). Because all test odors have comparable vapor pressure, these dilutions spanned a comparable range of molecules/stimulus, and no vapor-pressure corrected values are given. All dilutions were prepared in 20 ml glass vials which were sealed with aluminum ring caps with a silicon-Teflon septum (Axel Semrau). All odors were purchased from Sigma-Aldrich, and were of maximum purity available. New odor dilutions were prepared every 3–4 weeks. Experimental odors used were isopentyl acetate (CAS 123-92-2), 1-butanol (CAS 71-36-3), and propionic acid (CAS 79-09-4). Diagnostic odors were ethyl hexanoate (CAS 123-66-0), pentyl acetate (CAS 628-63-7), E2-hexenal (CAS 6728-26-3), 1-octen-3-ol (CAS 3391-86-4), and ethyl-3-hydroxybutyrate (CAS 5405-41-4) (see supplemental Methods, available at www.jneurosci.org as supplemental material). 1-Butanol 10−2 or 10−3 was applied repeatedly to monitor the signal quality during the experiment. Control measurements were done with clean air and mineral oil.
A constant air stream (60 ml/min) generated with a vibrating armature air compressor (Rietschle Thomas) was directed to the fly antennae at a distance of ∼1 cm through a Teflon tube (1 mm inner diameter). Odors were applied with a computer-controlled autosampler originally designed for gas chromatography (CombiPAL, CTC Analytics) which injected 1 ml (1 ml/s) of odor-loaded headspace from the 20 ml vials into the Teflon tube 38 cm away from the tube exit. During odor application the constant air stream was interrupted to avoid mechanical artifacts due to increased air flow.
Calcium imaging.
Images were acquired with a CCD camera (TILL Photonics) mounted on a fluorescence microscope (BX51WI; Olympus) equipped with a 20× water-immersion objective (numerical aperture = 0.95; XLUMPlanFI; Olympus). Excitation light of 465 nm was produced with a monochromator (Polychrome II, TILL Photonics). A 490 nm dichroic mirror was used together with a 506–547 nm bandpass emission filter. Binned image size was 153 × 106 pixels on chip, corresponding to 245 μm × 170 μm at the preparation. Exposure time was varied between 70 and 120 ms to adjust for different basal fluorescence values of the preparations. Eleven-second films were recorded with an acquisition rate of 3 Hz. Odors were presented during 1 s, 3 s after the beginning of each measurement. Interstimulus interval was 2 min.
Data analysis.
Flies that showed stable calcium responses to the reference odor [1-butanol (10−3 or 10−2)] throughout the protocol and none or only negligible responses to air were considered for data analysis. Data were processed with custom made routines written in IDL (ITT Visual Information Solutions) as previously described (Silbering and Galizia, 2007). In short, data were first corrected for movement artifacts using anatomical landmarks. Overall fluorescence intensity decay due to bleaching was removed by fitting a logarithmic function of the form F(t) = a × e(bt) + c to the average frame light intensity change over time (Galizia and Vetter, 2004). Frames covering 7 s after stimulus onset were excluded from the bleach correction calculation. Then, the relative calcium change was calculated for each frame i as (ΔF/F)i (%) = [(Fi − F0)/F0] × 100, where Fi is the absolute fluorescence of the ith frame and F0 the average fluorescence of the five frames before stimulus onset (background fluorescence).
Glomerulus identification was achieved as previously reported (Silbering and Galizia, 2007). Two glomeruli (named X2 and X3) could be reliably identified in all flies, but not assigned to known glomeruli in the Drosophila antennal lobe atlas (Laissue et al., 1999) due to the lack of spatial references. See supplemental Methods (available at www.jneurosci.org as supplemental material) for details.
The average light intensity of a 7 × 7 pixel square (corresponding to ∼10 × 10 μm2) was calculated for each glomerulus and visualized as time traces. Response amplitude was calculated as the average of 3 frames during stimulation minus the average of 3 frames before stimulation. Since the initial responses (positive or negative) began within the stimulation time in most cases, this calculation was found to best reflect the changes in response amplitude. The same calculation was used to visualize activity patterns as color-coded images, which were then processed with a Gaussian filter (kernel = 3 pixels). Note that the color scale used in Figures 1, 3, and 5 is asymmetrical for negative and positive values, where one quarter of the scale is assigned to values from minimum to zero and three quarters to values from zero to maximum.
Figure 1.

Spatial odor response patterns of antennal lobe neurons in Drosophila. A, Scheme of the antennal lobe, with diagrams of the innervation patterns of single local neurons (left antennal lobe) and of OSNs and PNs (right antennal lobe). Antennal nerves and commissure are shown in dark gray, glomeruli in light gray. B, Position of the analyzed glomeruli in the left antennal lobe. AN, Antennal nerve; C, commissure. C, Raw fluorescence view of the antennal lobe for the five measured neuron types (Np1227, Np2426, KRAS, OSN, and PN) and color-coded odor responses to isopentyl acetate, 1-butanol, and propionic acid. Odor concentration was 10−3 for OSNs and KRAS, and 10−2 for all others. The left antennal lobe is overlaid with a schematic view of the glomeruli (compare with B). Numbers in the right corners of each picture indicate the scale range (% ΔF/F). The black line in the color scale indicates ΔF/F = 0%. The arrow in the PN response to propionic acid points to activity in the mushroom bodies (see Results). Note that the activity patterns for OSNs and PNs are glomerular, while local neurons have more distributed but not uniform response patterns.
Figure 3.
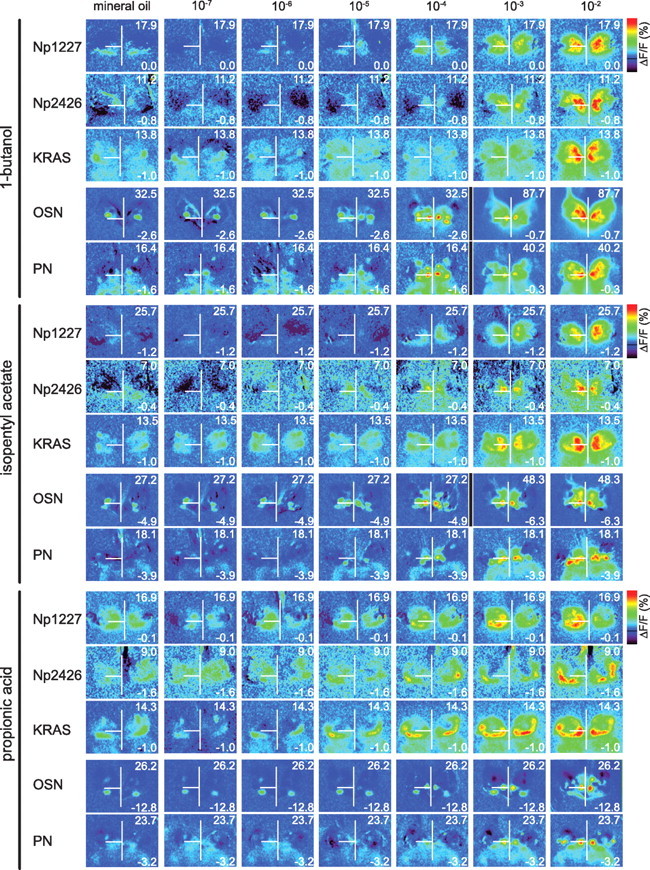
Spatial response patterns to increasing odor concentrations. Color-coded activity patterns in response to increasing concentrations of 1-butanol, isopentyl acetate, and propionic acid. The first column shows the responses to the solvent mineral oil. Numbers in the right corners of each picture indicate the scaling range (% ΔF/F). The vertical white line runs through the midline and the horizontal one through the left glomerulus DM2 to ease spatial comparisons. Black vertical lines point to a change in scaling between pictures. Movies of these measurements can be found at http://neuro.uni-konstanz.de/silbering/.
Figure 5.

Activity transformation across neuronal populations. Color-coded activity patterns, median traces, and concentrations-response curves for isopentyl acetate in glomerulus DL5 (broadening case) (A), 1-butanol in DM2 (linear case) (B), and propionic acid in DC2 (complex case) (C) in local neurons, OSNs, and PNs. Top, Each picture is scaled to the values indicated. Median traces are shown with odor concentration (10−7 to 10−2) given by trace-color shade. Scaling bars indicate the same response amplitude for all graphs belonging to the same odor/glomerulus combination. Bottom, Concentration–response relationships for each odor in the indicated glomerulus for all lines. Median responses are shown together with the corresponding interquartile ranges (gray surfaces). Note the responses in PNs in the absence of OSN input in A, the parallel concentration–response curves for all lines in B, and the complex relationships in C.
For quantitative analyses across animals, data were normalized within each animal to the calcium changes evoked by 1-butanol 10−3 in glomerulus DM2 in each fly (Response[glomerulusi, odorj, concentrationk, fly] = ΔF/F[glomerulusi, odorj, concentrationk, fly]/ΔF/F[DM2, 1-butanol, 10−3, fly]). Throughout the paper these normalized calcium changes are referred to as odor responses. Median responses and traces correspond to the median of n animals (Np1227: n = 4–5; Np2426: n = 5–6; KRAS: n = 6; OSN: n = 8–9; PN: n = 7–8). Each fly was stimulated once with each concentration (10−7 to 10−2) of one of the three tested odors (isopentyl acetate, 1-butanol, or propionic acid). All glomeruli except X2 and DM3 could be identified in all animals. X2 could not be identified in 2 flies where PN responses to 1-butanol were measured and in two flies where responses to isopentyl acetate where measured, one for the OSNs and one for the local neurons Np1227. DM3 could not be identified in one fly where isopentyl acetate responses where measured in local neurons labeled by the line Np2426.
In Figure 2D, responses were considered for fall time calculation if (1) the initial response (first second after stimulus onset) was >3 × SD of the mean fluorescence measured in the first 2 s of the recording (before stimulus onset); and (2) if fluorescence decayed at least to 66% of the maximum value by the end of the measurement. Fall time was calculated as the time elapsed between 90% and 66% of the maximum value in the decaying phase of the response. Maximum responses correspond to the normalized response value at the peak within 3 s after stimulus onset.
Figure 2.
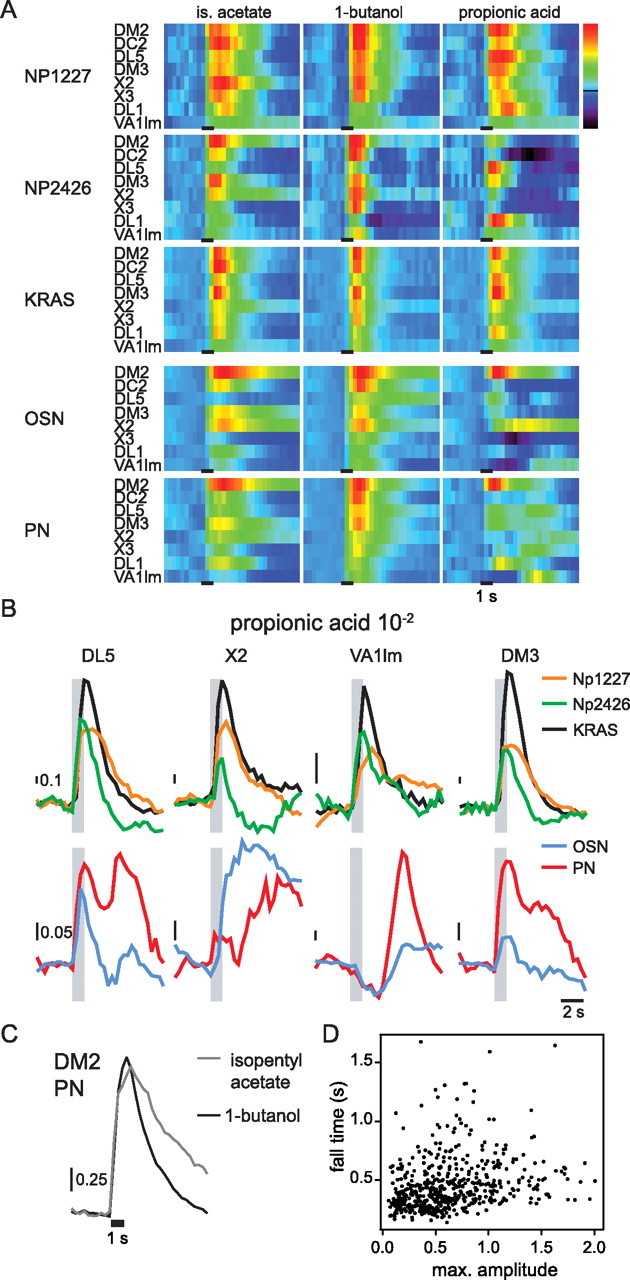
Temporal response patterns of antennal lobe neurons in Drosophila. A, Evolution of odor responses over time. Median odor responses over all animals are shown. Np1227: n = 4–5; Np2426: n = 5–6; KRAS: n = 6; OSN: n = 8–9; PN: n = 7–8. Colors are scaled from blue to red with blue ≅ −0.5 × max and red ≅ max, where max is the maximum response amplitude measured for each odor in each neuron type (over all glomeruli and time points). The time of stimulation (1 s) is indicated as a black line. Odor concentration was 10−2. Note the high diversity of time courses across lines, glomeruli, and odors. B, Comparison of the responses to propionic acid 10−2 in different glomeruli. Upper row, Np1227, Np2426, and KRAS. Lower row, OSN and PN. Gray bars indicate the time of stimulation (1 s). Vertical bars indicate the scale of the response amplitude. C, Median responses to isopentyl acetate 10−2 and 1-butanol 10−2 in the PNs of glomerulus DM2, showing that fall time cannot be predicted from response magnitude. Fall time (calculated as the time elapsed during signal decay from 90% to 66% of maximum amplitude) was 1.65 s (Q25 = 1.29 s, Q75 = 1.92 s, n = 7) for isopentyl acetate and 0.57 s (Q25 = 0.48 s, Q75 = 0.67 s, n = 9) for 1-butanol. Maximum responses were 1.63 (Q25 = 1.42, Q75 = 1.85) and 1.69 (Q25 = 1.48, Q75 = 1.72) for isopentyl acetate and 1-butanol, respectively. The black line below the traces indicates the time of stimulus (1 s). D, Relationship between the response amplitude and fall time. Each point represents the response of one odor-neuron type-glomerulus-concentration combination (3 odors, 5 neuron types, 8 glomeruli, and 6 concentrations). A given combination was included only if the fall time could be calculated for at least two responses (545 of 720 possible combinations). The correlation between response amplitude and fall time accounts for 7% fall time change (linear model, p < 10−9, R2 = 0.07), indicating that the response fall time depends more on the glomerulus-stimulus combination than on the response magnitude. Maximum responses correspond to the normalized response value at the peak within 3 s after stimulus onset.
The threshold concentration was defined as the concentration that elicited responses significantly higher than those elicited by the same odor at 10−7 in a Wilcoxon rank-sum test (p < 0.05).
To quantify the odor information content of the spatiotemporal response patterns we performed a linear discriminant analysis (LDA) (Venables and Ripley, 2002). This multidimensional statistical analysis uses the odor-class information to reveal the structure of the data. Specifically, a linear combination is computed to derive those axes that maximize the ratio of the separation of the class means (i.e., the mean signal within each odor) to the within-class variance (i.e., the variability of each odor representation). In other words, a new coordinate system is calculated where each axis provides a more accurate discrimination of the classes (odors in our case) than the original individual variables do (the individual glomerular response patterns, in our case). This is possible because in the projection, each axis is a linear combination of many glomeruli. The result is a projection onto a low-dimensional space. In the case of three odors, this is at best a two-dimensional plane (because three points always lie in a plane, just as two points define a line). In this space, the distance between odors is the maximal distance possible (hence the name “discriminant”; the transformed variables are often called linear discriminants or canonical variates).
Data analyses were performed with IDL, Excel (Office 2003; Microsoft), R (http://www.R-project.org), SigmaStat (SPSS), and ImageJ (http://rsb.info.nih.gov/ij/).
Results
To analyze the activity of the neurons involved in processing of odor information in the antennal lobe, we have measured odor-evoked calcium responses in three distinct subpopulations of local neurons (Fig. 1A) of the fruit-fly Drosophila melanogaster. Two of them were GABAergic, labeled with Np1227- and Np2426-Gal4 lines (Okada and Ito, unpublished work) (Sachse et al., 2007). The third subpopulation was cholinergic and labeled with the KRAS-Gal4 line (Shang et al., 2007). We also recorded odor-evoked responses to the same stimuli in OSNs (with the Or83b-Gal4 line) and in PNs (using GH146-Gal4). We quantified odor responses in eight glomeruli across animals (Fig. 1B) based on their morphology and position relative to other glomeruli and/or their responses to additional, “diagnostic” odors (i.e.: highly diluted odors that elicit activity in only one or very few known glomeruli) (for details, see supplemental Methods, available at www.jneurosci.org as supplemental material). Note that, compared with most morphological studies where the brain is removed from the head capsule, in our in vivo study we observed the brain in the living animal through a hole in the head capsule, which results in a slightly tilted view of the antennal lobes (see supplemental Fig. S1A, available at www.jneurosci.org as supplemental material).
Odor responses in distinct neuron populations
Local neurons branch across many glomeruli in the antennal lobe without an apparent glomerular organization, making it impossible to see glomerular borders in morphological views. Cell bodies were clearly visible at the periphery of the antennal lobe (Fig. 1C). We did not see glomerulus-specific activity in either GABAergic local neuron subpopulation (Np1227 or Np2426), suggesting a lack of glomerular organization at the functional level in these local neurons. In the excitatory local neuron subpopulation (KRAS line), on the other hand, the “diagnostic” odors elicited focalized responses corresponding to individual glomeruli (e.g., in glomerulus DM2 to stimulation with ethyl hexanoate 10−5 and in DC2 to stimulation with 1-octen-3-ol 10−4; data not shown). For the three test odors (isopentyl acetate, 1-butanol, and propionic acid), odor evoked activity covered large areas of the antennal lobe in all local neuron lines, but never the entire antennal lobe. Activity patterns were spatially structured, and spatial patterns differed both for different odors within one subpopulation, and for the same odor across subpopulations (Figs. 1C, 2A. Response patterns were highly conserved and variability was low across flies of the same line (see supplemental Fig. S1B,C, available at www.jneurosci.org as supplemental material), reinforcing the idea of a genetically predetermined connectivity map between neurons of different classes. Odors generally evoked calcium increases upon stimulus onset. In Np2426, however, some odors were found to elicit localized calcium decreases after stimulus offset, such as propionic acid in glomerulus DC2 (Fig. 2A and see below). Assuming that these after-stimulus inhibitions result from increased synaptic inhibitory input at stimulus offset, one would expect other neurons to respond to odors with an off-response (i.e., calcium increase at stimulus offset). In a more complex and alternative, putative network, a decreased excitatory input could be the cause of the observed calcium decrease. However, because there was no odor response, these neurons would need to be tonically active, and therefore again an increased inhibitory input would be necessary at stimulus offset. Interestingly, we never observed such off-responses in any of the local neuron subpopulations. This would suggest that at least one additional local neuron subpopulation might exist in addition to those covered in this study.
Unlike in local neurons, responses in OSNs and PNs were clearly glomerular, as expected from their glomerular arborization pattern (Figs. 1C, 2A). As for the local neurons, response patterns were conserved across animals (see supplemental Fig. S1B,C, available at www.jneurosci.org as supplemental material). Calcium decreases at odor onset were found in OSNs in response to propionic acid (Fig. 2A,B and see below). Response amplitudes (measured as ΔF/F before normalization, see Materials and Methods) were larger for OSNs (reaching ∼80% in some animals) and PNs (reaching up to ∼50%) than for local neurons (reaching ∼25% for Np1227, ∼10% for Np2426, and ∼20% for KRAS). For the line GH146, odor responses were also found in the mushroom bodies, indicating that the mushroom body intrinsic neuron MB-APL, which is labeled by the GH146 line (Tanaka et al., 2008) is generally responsive to odors (Fig. 1C, arrow in the PN response to propionic acid).
Complex spatiotemporal responses
Each stimulus elicited a complex and characteristic spatiotemporal activity pattern in each neuron population examined: activity returned to baseline quickly after stimulus offset in some glomeruli and slowly in others. Moreover, some glomeruli showed inhibitory responses, late responses or complex response patterns with multiple phases (Fig. 2A,B). Odor responses were spatially more uniform in local neurons than in OSNs and PNs. Generally, most glomeruli were activated in the line Np1227: for isopentyl acetate, the strongest responses were observed in DC2 and X2 and the weakest in VA1lm; for 1-butanol responses were quite uniform across all glomeruli, except DL1 and VA1lm in which the responses were weaker. Propionic acid elicited a complex pattern in Np1227, with late responses in some glomeruli (notably DL1 and DC2) (see Fig. 2A). More complex spatiotemporal patterns were observed in the neurons labeled by Np2426-Gal4, which showed a late inhibition to propionic acid in DC2, a biphasic response to 1-butanol in DL1, and differences in response duration (e.g., a long response to isopentyl acetate in DM2, but a short response of comparable amplitude to the same stimulus in DM3) (Fig. 2A,B). The time courses of the responses in excitatory KRAS neurons were the most uniform: the response peak was reached ∼1 s after stimulus onset and calcium level returned quickly back to baseline, with no inhibitory responses to any odor in any glomerulus. Unlike for Np1227 and Np2426, KRAS responses showed differences in their spatial pattern, but not in their time courses (Fig. 2A,B).
In OSNs and PNs responses differed between glomeruli both in magnitude and in time course. Responses to propionic acid were complex, including late excitatory responses after stimulus offset (e.g., glomerulus X2 in OSNs, and glomerulus VA1lm in PNs), inhibitory responses during and/or shortly after the stimulus (e.g., glomerulus X3 and VA1lm in OSNs, and VA1lm in PNs), and responses with two excitatory peaks, one during stimulus presentation, and the other several seconds later (e.g., DL5 in both OSNs and PNs) (Fig. 2B). Conversely, all responses to isopentyl acetate and 1-butanol were monophasic and differed only in response magnitude and fall-time, the former having only a small impact on the latter (Fig. 2C). Even across all odors and neuron populations studied, stronger responses could account for only 7% of the variability in fall time (linear model fit for fall time vs response amplitude, p < 10−9, R2 = 0.07) (Fig. 2D), suggesting that factors other than total calcium influx influence the return to calcium baseline.
Responses to different odor concentrations
With increasing odor concentration, responses increased both in magnitude and spatial extent: the excited area across the antennal lobe increased for local neurons, and in PNs and OSNs more glomeruli became active (Fig. 3). As a general rule with few exceptions, all glomeruli in all neuron populations analyzed showed increasing calcium influx with higher odor concentrations. 1-Butanol or isopentyl acetate at low concentration elicited a subpattern of the higher-concentration response. In contrast, with higher concentrations of propionic acid more glomeruli responded with a calcium decrease in OSN-labeled flies, up to three glomeruli at 10−3 (but only one at 10−2) (supplemental Fig. S2A, available at www.jneurosci.org as supplemental material; compare with Fig. 4A). Fewer glomeruli showed calcium reduction in PN-labeled flies.
Figure 4.
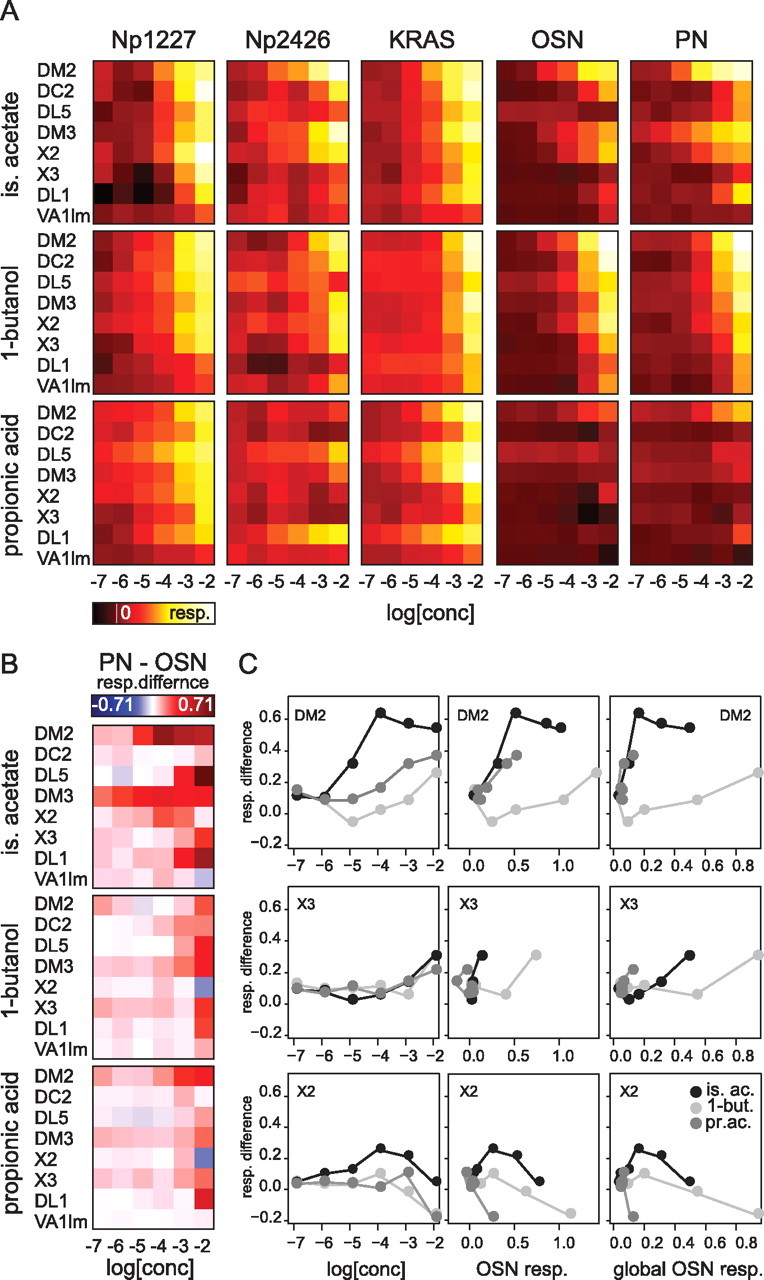
The profile of concentration dependency is odor and glomerulus specific. A, Color-coded median amplitude of responses to isopentyl acetate, 1-butanol and propionic acid for each neuron type in all analyzed glomeruli (n = 4–9). The white line in the color scale indicates no response, white corresponds to the maximum response in each neuron type (over all three odors) and black corresponds to −0.15 × max. B, Response difference between PNs and OSNs (for details, see supplemental Fig. S2B, available at www.jneurosci.org as (Figure legend continued.) supplemental material). White indicates no response difference; red indicates higher activity in PNs than OSNs and blue higher activity in OSNs than PNs. These plots show that of 24 odor/glomerulus combinations, 12 show “broadening” (at least at high concentrations), 2 show sharpening (blue squares at high concentrations), 7 show linear transmission and 2 complex transmission. C, Difference between PN and OSN responses as a function of odor concentration (left), OSN response in the same glomerulus (middle) or global OSN response (right) (global OSN response was calculated as the mean response of all glomeruli analyzed) for three exemplary glomeruli (DM2, X3, and X2). The segregation of the curves for the three odors in glomeruli DM2 and X2 shows that the modulation of the response profile in PNs cannot be accounted for by any of the three parameters, suggesting that activity transfer is modulated by a glomerulus-specific network driven by odor-specific activity patterns.
We found no calcium responses to odors at a concentration of 10−7 in any of the measured subpopulations. Response thresholds varied and were generally higher in local neurons than in OSNs and PNs: for isopentyl acetate, local neuron responses were significant at 10−5 for KRAS and 10−4 for Np1227 and Np2426, while the threshold was at 10−6 for OSNs (glomerulus DC2) and at 10−5 for PNs (in glomeruli DM2 and DM3). For 1-butanol, local neuron responses were significant at 10−4 for KRAS and Np2426, and 10−3 for Np1227, while the threshold was 10−5 in OSNs (glomerulus DM2) and 10−4 for the PNs (e.g.: glomeruli DM2 and DC2). Most strikingly, for propionic acid, KRAS local neurons were more sensitive than both PNs and OSNs in most glomeruli in our field of view (Fig. 4A).
In sensory physiology, concentration–response curves usually follow a sigmoidal shape and can be fitted with the Hill equation. In our study, however, response saturation was not reached in any of the glomeruli analyzed for any neuron subpopulation and odor over the concentration range spanning from 10−7 to 10−2. The only case where the concentration–response curves appeared to reach a plateau corresponded to glomerulus DM2 in response to isopentyl acetate (Fig. 4A). This indicates that the olfactory system is far from saturation even at the highest concentration tested here, which is higher than the highest concentration that a fruit fly is likely to encounter in the environment. For example, the concentration of isopentyl acetate found in banana mush is ∼2 × 10⁻⁴ (Jordán et al., 2001; Pelz et al., 2006), and thus well below the maximum concentration tested here. It appears, therefore, that the olfactory system of the fly is not driven to its physiological upper limits in the natural environment and can therefore detect signal differences even at the highest odor concentrations it might encounter. It is likely that such a broad concentration–response range is the result of the interplay between the odor-transduction cascade and an efficient and fast adaptation mechanism in sensory neurons (Laughlin, 1989). We also show that for most of the dynamic range, odor information increases with higher concentrations, although odor discrimination capacity, and thus the information content in the system, deteriorates at the higher concentration (see below). Every olfactory stimulus needs to be analyzed with respect to its identity and its intensity (concentration), and a broad dynamic range as found here allows for that information to be maintained. Information about odor concentration has an important ecological value for the fly and must therefore be retained along the olfactory pathway. Indeed, flies can learn to discriminate different odor concentrations (Borst, 1983; Xia and Tully, 2007), as has been shown for bees (Bhagavan and Smith, 1997; Pelz et al., 1997; Ditzen et al., 2003) and mammals (Cleland et al., 2007).
Concentration–response curves were different for the different neuron subpopulations in the same glomerulus (Fig. 4A,B). We found that in some instances there was a negative relationship between the response magnitudes of OSNs and PNs (i.e., weaker PN responses compared with OSN responses, e.g., for 1-butanol in glomerulus X2 and for isopentyl acetate in glomerulus VA1lm, both at the highest concentration 10−2), while in other instances the relationship was positive (i.e., stronger PN responses compared with OSN responses; note that this calculation was done on normalized data, to allow quantitative across-lines comparison). This transfer function was dependent on the odor and its concentration, as well as on the analyzed glomerulus. We analyzed whether the difference between PN and OSN responses was a function of odor concentration, OSN response magnitude in that glomerulus, or cumulative OSN response across all glomeruli, and found that for all of these variables the transfer function differed for different odors in at least some cases (Fig. 4C). This, together with the fact that PN responses were not directly predictable from OSN responses, suggests the involvement of local neuron input in shaping PN output. To address this issue, we analyzed odor-response properties across odor concentrations for all five cell populations in individual glomeruli, and classified the activity transfer functions into cases: broadening, linear, narrowing, and complex.
Profile broadening (e.g., responses to isopentyl acetate in glomerulus DL5)
Stimulation with increasing concentrations of isopentyl acetate induced a steady response increase in the area corresponding to glomerulus DL5 for the GABAergic line Np1227 and the cholinergic line KRAS, as well as in PNs (Fig. 5A). In contrast, we found no responses in OSNs, and responses in the other GABAergic line Np2426 were weak and did not show a clear concentration dependency. Given the absence of OSN input, PN activity in glomerulus DL5 must have been driven by lateral connections across glomeruli. Similar broadening effects were found in 12 of 24 odor/glomerulus combinations, although in most cases only at the highest concentration.
Two mutually nonexclusive mechanisms are conceivable: first, it would be feasible that PNs in DL5 are driven by a population of excitatory local neurons (e.g.: those visualized with the KRAS line) that is activated when the fly is stimulated with isopentyl acetate. Alternatively, inhibitory local neurons (possibly included in the Np1227 line) could inhibit other spontaneously active, inhibitory local neurons, thus releasing PNs from inhibition (Christensen et al., 1993). This putative population of spontaneously active inhibitory local neurons is probably missing in our study (see Discussion). These broadening mechanisms, however, are not likely to be universal in the antennal lobe: we did not find broadening for other odors in this glomerulus or in all other glomeruli for this odor (see below). DL5 was among the glomeruli with intermediate response strength to isopentyl acetate in PNs (Figs. 2A, 4A), raising the possibility that its contribution to the combinatorial representation of this odor is of minor importance.
Linear transfer (e.g., responses to 1-butanol in glomerulus DM2)
In glomerulus DM2, increasing the concentration of 1-butanol led to increasing calcium responses in all three local neuron subpopulations and also in OSNs and PNs (Fig. 5B). For the two GABAergic lines, responses reached their maximum quickly, remained high during stimulus duration, and then decayed slowly for Np1227 and rapidly for Np2426. Time courses for KRAS were short and pointed, with a fast return to baseline. Return to baseline was slower for PNs and OSNs, in particular at high odor concentrations. In addition to the differences in rise- and fall-times, this glomerulus/odor combination had a strikingly linear activity relationship across the concentration range examined, and the concentration–response curves of glomerular activity were perfectly parallel, with only a slight divergence among local neurons at the highest concentration (Fig. 5B). Seven glomerulus/odor combinations had such linear activity transfer, and other tested odors did not follow this linear pattern in DM2 itself. For propionic acid and isopentyl acetate, this glomerulus showed a relative increase in PN responses compared with OSN responses with increasing concentration and PN responses were not directly predictable from either local or global OSN activity (see Fig. 4B,C). This indicates that even glomerulus DM2, which showed a linear activity transfer among OSNs, local neurons and PNs in the case of 1-butanol, is embedded in a complex interglomerular network for the responses to other odors.
Profile narrowing (e.g., responses to 1-butanol in glomerulus X2)
The existence of inhibitory local neurons in the antennal lobe suggests the presence of interglomerular inhibition which would sharpen the response profiles in PNs compared with those in OSNs, as has been shown in honeybees (Sachse and Galizia, 2002, 2003). We therefore looked for glomeruli with a flatter concentration–response curve in PNs than OSNs. We found three examples, among which were the response to 1-butanol in glomerulus X2 and the response to isopentyl acetate in glomerulus VA1lm (Fig. 4B, blue squares). These effects were quite small, however, and in all cases occurred only at the highest concentration tested. It should be noted, though, that we measured OSN activity as calcium influx at the synaptic terminals. The activity at the terminals might already be influenced by presynaptic, GABAergic input (Boeckh and Tolbert, 1993; Olsen and Wilson, 2008). In particular, presynaptic hyperpolarization could reduce calcium influx to OSN presynaptic terminals. Narrowing effects, therefore, could already be part of our OSN measurements. To see them, it would be necessary to measure OSN activity in the sensory organ rather than at the axon terminals in the antennal lobe, and compare those values with the OSN measurements and the PN measurements presented here.
Complex transmission (e.g., responses to propionic acid in glomerulus DC2)
The activity of GABAergic local neurons labeled with Np1227 and cholinergic neurons labeled with KRAS increased tonically with increasing concentration of propionic acid (Fig. 5C). Responses in both subpopulations were monophasic. Responses in the other GABAergic local neuron subpopulation, labeled with Np2426, were more complex, consisting of an early calcium increase and a late inhibition. The inhibitory component appeared after stimulus offset and increased with increasing odor concentration, leading to a temporal narrowing of the early excitatory response. PNs showed no significant response during stimulation at any concentration, but a delayed response peak was visible a few seconds after stimulus offset at the highest concentration. The concentration–response relationship was particularly complex for OSNs: we did not find any responses at the lower concentrations, an inhibitory response at 10−3, and a monophasic excitatory response at 10−2. This glomerulus/odor combination appeared to be the most enigmatic one, because local neuron responses did not appear to be related at all to the activity found in either OSNs or PNs. The same glomerulus showed a fairly linear activity transfer for 1-butanol and isopentyl acetate (Fig. 4B). In the combinatorial pattern of the response to propionic acid, glomerulus DC2 was among the glomeruli with weak responses (see Fig. 4A). Two examples of such complex transmission where found.
Multidimensional analysis of odor responses
Odors are represented as ensembles of active glomeruli in the antennal lobe, from which the brain needs to extract odor-related information such as odor quality and odor concentration (Sachse and Galizia, 2003; Xia and Tully, 2007). We therefore sought to understand how such multidimensional information is encoded in the activity patterns measured by calcium imaging. In a multidimensional view, antennal lobe activity at each point in time can be represented as a vector with as many dimensions as glomeruli (Galán et al., 2004). An odor stimulus increases or decreases the activity of certain glomeruli, thus changing the values in the corresponding dimensions. In this multidimensional space where each glomerulus is one dimension, the resting state (absence of odor stimulus) corresponds to a point close to the origin (i.e., where most glomeruli have a value close to 0). During stimulation, activity in the antennal lobe moves away from the origin, and performs a characteristic trajectory across the glomerular space (Stopfer et al., 2003; Galán et al., 2004). In this study we quantified the activity of eight glomeruli. To visualize this eight-dimensional space in two- or three-dimensional graphs, we applied a linear discriminant analysis (LDA, see Materials and Methods). This analysis identifies the best linear projection that separates odors, and can therefore be used to assess the information content about an odor present in a particular odor-response. Unlike a principal component analysis, where data points are projected onto the plane that contains the maximal overall variance, an LDA takes into account to which groups (in our case: odors) the points belong, and finds the plane that contains the maximal variance across groups. The result is a linear projection of the multidimensional space onto fewer dimensions. Because we used three test odors, the resulting projection was always a two-dimensional plane in which the difference between odors was maximized (Fig. 6A).
Figure 6.
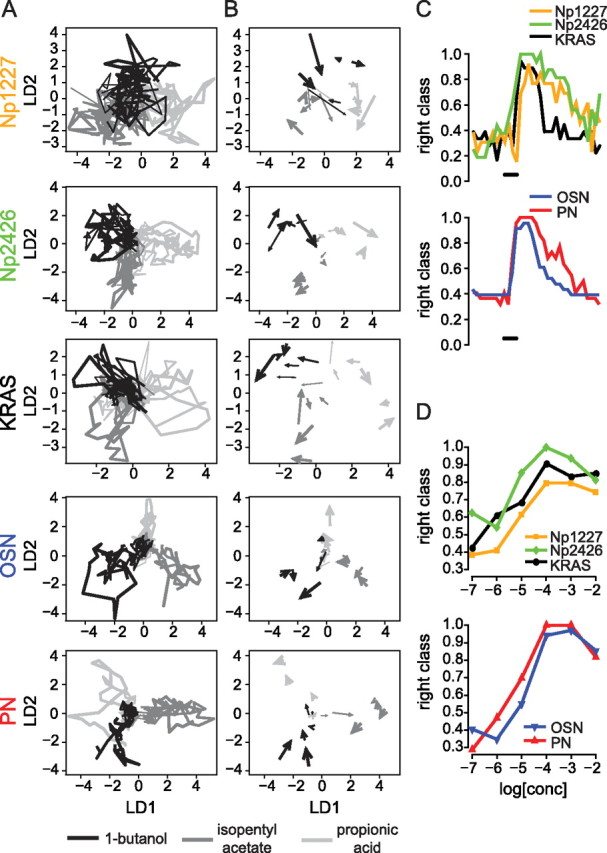
Multidimensional analysis of odor representations. A, Response trajectories projected into the 2-dimensional linear discriminant space. Odor identity is represented by gray shade and concentration by the line thickness. B, Same projection as in A for a single frame (1 s after stimulus onset), with the direction of the arrow showing the direction of the trajectory. Note how the overlap across odors differs from high (Np1227) to low (PNs). C, Classification success across time for a single concentration (10−4). Note the difference in decay time across neuron types. D, Classification success increases with odor concentration, but decreases at very high concentrations. Each point represents the average classification rate over one second 1.3 s after stimulus onset.
We plotted the entire trajectory for each averaged odor response at each concentration for each of the five subpopulations of antennal lobe neurons (Fig. 6A). We found that trajectory separation was good in Np2426 and KRAS. On the other hand, trajectories overlapped strongly in Np1227, with only a small part of the trajectories projecting to clearly distinct areas of the two-dimensional space. To separate the positions of trajectories that belonged to different odor concentrations, we plotted only the response segment that corresponded to 1 s after stimulus onset (Fig. 6B). At the selected time point, the KRAS local neurons showed the clearest concentration-independent separation between the three odors, followed by Np2426 neurons. For Np1227 neurons, trajectory separation was only possible at high concentrations. Projections of odor-response trajectories in OSNs and PNs generally allowed for a good separation of the three odors, with PNs having a clearly better separation of odor quality than OSNs (Fig. 6A,B).
Just as the time course of odor responses differed between lines (see above), so did the information content (in the sense of odor discriminability) differ along the odor response. We quantified classification performance for each time point, by performing the LDA for each concentration with all but one single-fly data traces of one neuron type, and then testing whether the excluded response was classified to the correct odor. We repeated this procedure (“leave-one-out”) for all response traces, and obtained a time trace for the classification power that resides in odor-evoked activity patterns across individual animals. In this analysis with three possible odors, a value of 0.33 is chance level. We found that discriminatory power increased rapidly upon stimulus onset in all lines (Fig. 6C). KRAS local neurons had fast responses, and information content decreased rapidly upon stimulus offset accordingly. The two GABAergic subpopulations labeled with Np2426 and Np1227 had a slower information decay trace. PNs had a better performance than OSNs over the whole time period, especially after stimulus offset (Fig. 6C).
We then compared the discriminatory performance across odor concentrations. Figure 6D shows the results for the time point 1.3 s after stimulus onset. Among the local neurons, Np1227 neurons had the lowest performance, indicating that spatial odor information is weaker in this neuron subpopulation than in the other subpopulations investigated. KRAS and Np2426 neurons showed comparable performances at low concentrations, with a slight advantage for Np2426 at high concentration. The slight superiority of PNs over OSNs in odor-specific information content was apparent at all concentrations except at 10−7 (at which no significant odor-evoked activity was recorded), and at 10−2. This suggests that the antennal lobe network increases discriminatory power for odors from OSNs to PNs. The consistent increase in discriminatory power also indicates that stimuli of increasing concentration elicited patterns with more information up to a concentration of 10−3. The observed decrease in discriminatory power at the highest concentration might indicate an odor saturation effect. Alternatively, it might be due to the fact that we studied a sample of only eight glomeruli. The information coded in the remaining ∼40 antennal lobe glomeruli in the fly might be enough to sustain discriminability over a broader range of concentrations. In mammals, across-glomerulus odor responses also increase with concentration, while relative activity patterns are stable over several orders of magnitude, with a similar increase in information content with increasing concentration as shown here (Cleland et al., 2007). This is in good agreement with behavioral data from bees and rats, showing better odor discrimination with increasing odor concentration (Bhagavan and Smith, 1997; Pelz et al., 1997; Cleland et al., 2007).
Discussion
In this study, we dissected physiological odor responses in five genetically determined neuron subpopulations in the first neural network that processes olfactory information in the fruit fly antennal lobe. We found that each local neuron population has distinct odor response properties, that the result of odor information processing in each glomerulus depends on the odor being processed, and that the discriminatory power increases from the antennal lobe input neurons (OSNs) to its output neurons (PNs).
We measured odor-evoked spatial activity patterns in three distinct local neuron subpopulations, two GABAergic (Np1227 and Np2426 lines), and one cholinergic (KRAS line). Our functional imaging analyses provide some clues about the possible roles of different local neuron subpopulations within the antennal lobe network. First, KRAS local neurons showed clearly focalized glomerular responses when the animal was stimulated with low-concentration, “diagnostic” odors. Because these stimuli activate only a single class of OSNs that innervate a single glomerulus, this result suggests that KRAS neurons might receive direct input from OSNs. Consequently, the other local neuron subpopulations either do not receive direct OSN input, or the OSN input is less dominant than for KRAS neurons, resulting in less focalized responses to the “diagnostic” odors. KRAS neurons also had very fast and phasic response properties, supporting their close link to receptor neuron activity. This view would also support their proposed role in increasing sensitivity to weak odor stimuli (Shang et al., 2007). However, since we found that concentration–response curves in the KRAS neurons clearly follow the entire concentration range tested without any sign of saturation, they are likely to play an important role in odor coding also at higher concentrations.
Second, GABAergic local neurons labeled by the Np1227 line might be related to a global, inhibitory network implicated in gain control (Sachse and Galizia, 2006; Silbering and Galizia, 2007). This hypothesis derives from the low spatial information content that we found in these local neurons: odor trajectories were strongly overlapping and the performance in the classification analysis was poor (Fig. 6). Based on our physiological data these neurons may be those making presynaptic input onto OSN terminals (Olsen and Wilson, 2008). Because odor-concentration information is maintained across the antennal lobe network, even in this model Np1227 neurons do not correct for concentration in a straight-forward “gain-control” mode, but might rather control the dynamic range. However, morphological data show that Np1227 local neurons arborize mainly in the core area of each glomerulus, which is extensively innervated by PNs but much less arborized by OSN terminals (Okada and Ito, unpublished work). More data are needed to resolve this issue.
Third, GABAergic local neurons labeled by the Np2426 line might be part of a reverberating network between and/or within olfactory glomeruli, involving synapses to and from PNs. In favor of this hypothesis are the strong discriminatory power contained in their spatial response patterns (Fig. 6), and the complex temporal time courses that include bouts of excitation and inhibition (Fig. 2A). In particular, odor discrimination power in these neurons is maintained for a longer time span after stimulus offset than in OSNs and in the cholinergic KRAS local neurons (Fig. 4). These neurons have been shown to be involved in glomerulus-specific activity-dependent developmental plasticity within the fly antennal lobe (Sachse et al., 2007), suggesting that they might contribute to intraglomerular computation (Sachse and Galizia, 2006). Interestingly, Np2426 neurons differ morphologically from Np1227 neurons, supporting the idea that they might play different roles within the network (Sachse et al., 2007). Unlike Np1227 neurons, Np2426 local neurons branch in the entire glomerulus, including its core and its periphery. However, their single cell morphology does not appear to be heterogeneous as known from honeybee local neurons, where each neuron innervates one glomerulus very densely, and others sparsely. Whether individual neurons in the Np2426 population innervate the entire antennal lobe or only part of it is not yet known. In addition, glomerulus-specific connectivity might be obtained by selective synaptic connections, and/or by the effect of modulatory signals, such as peptidergic transmitters.
Fourth, at least one subpopulation of local neurons seems to be left unidentified. Evidence for such a population is given by several inhibitory events observed at stimulus offset of both PNs and Np2426 neurons. These inhibitory events must have been generated by inhibitory input from other neurons, which consequently should be active at stimulus offset. However, we did not find any such responses in the neurons studied here, hence our assumption that we are missing at least one more neuron population.
While these hypotheses need further experimental corroboration, it is already clear from our results that odor-information is actively redistributed across glomeruli by the antennal lobe network. For example, responses to propionic acid were complex and distributed across glomeruli for all local neuron subpopulations and the PNs, even though they were weak in OSNs. This suggests that the primary input to the antennal lobe for this odor comes from glomeruli that were not investigated in this study, and that give rise to complex spatiotemporal response patterns in PNs mostly via interglomerular interactions.
There are two important aspects that should be considered when interpreting calcium imaging data. First, calcium mediates different processes within neurons. Therefore, even though calcium concentration correlates well with total spiking activity (Svoboda et al., 1997; Charpak et al., 2001; Kurtz et al., 2001; Galizia and Kimmerle, 2004), this correlation is not perfect. Most importantly, the polarity of input and output of the recorded neurons is unclear, because calcium is involved both in presynaptic and postsynaptic processes. Here the use of other tools, such as chloride sensitive reporters (Markova et al., 2008) or neurotransmitter release reporters (Miesenböck et al., 1998; Ng et al., 2002) would provide complementary data. Furthermore, because all measurements were performed on neuron populations, the polarity of individual neurons may be lost in our recordings. Therefore, single cell measurements with activity dependent proteins, ideally combined with single cell electrophysiology (Galizia and Kimmerle, 2004; Wilson et al., 2004; Root et al., 2007) would be helpful.
Another important issue concerns the limited temporal resolution of calcium imaging in general and of GFP based sensors in particular. It is likely that more information is encoded at a higher temporal resolution, which can only be revealed with electrophysiology (Laurent, 1997; Christensen et al., 1998b). Nevertheless, even at our temporal resolution complex temporal response patterns can be observed (Figs. 2, 5). Most importantly, we were able to show that odor information content is maintained within PNs for a longer time span than in OSNs (Fig. 6C). Whether this information contains a time stamp about odor onset, and thus information about the latest encountered odor plume, or whether it is a mechanism that allows the brain to process odor information detected previously while OSNs are again ready for the next plume remains to be elucidated.
Several papers published in recent years have analyzed the odor processing network in the fly antennal lobe. These papers showed examples of linear relationships between the input and the output of a single glomerulus (Ng et al., 2002; Wang et al., 2003), of global inhibitory interactions across glomeruli (Olsen and Wilson, 2008), of excitatory connections (Olsen et al., 2007; Shang et al., 2007) and of glomerulus-specific interactions across glomeruli (Silbering and Galizia, 2007). All these studies contribute to a long history of physiological research in the insect antennal lobe, including those that proposed a direct connection of OSNs onto PNs (Boeckh and Tolbert, 1993), and those proposing a disinhibitory pathway via local neurons (Christensen et al., 1993). Here, we showed that there need not be a controversy about which mechanism is implemented within the antennal lobe, because all of them might coexist (Fig. 5). Most importantly, whether the transfer-function in a glomerulus is broadening, linear, narrowing or complex is not a property of that glomerulus alone, but depends on the entire activity pattern within the antennal lobe, as shown by the observation that single glomeruli differed in their transfer function for different odors. In honeybees, glomeruli with similar odor-response properties inhibit each other (Linster et al., 2005). We did not find cases for response-sharpening in this study, with two exceptions at the highest odor concentration. We recently found that interglomerular interactions increase when more odors are mixed (Silbering and Galizia, 2007). The lack of narrowing effects in the present study might therefore be related to the stimulation with monomolecular odors, which activate fewer glomeruli altogether and thus might require less interglomerular inhibition for efficient coding (Schmuker and Schneider, 2007). Alternatively, our finding might reflect a genuine difference between flies and bees, since response-narrowing occurs even with monomolecular odors in bees (Sachse and Galizia, 2003). The fly with its only ∼50 glomeruli probably needs to cover many more odors with each glomerulus to efficiently span the sensory olfactory space, and therefore intraglomerular and interglomerular computation is more dominated by response broadening than response sharpening, while the bee, with ∼160 glomeruli, would be able to create more selective glomerular channels, and therefore profile sharpening may become more relevant. An implication of this view could be that in rats, with >1000 glomeruli, sharpening would be the dominant interglomerular computation. More experiments across species are needed to clarify these issues.
We have shown how odor information is processed in sequential and parallel steps along the neural network of the fly antennal lobe, revealing an unexpected complexity in the olfactory system of the fruit fly. Just as in the vertebrate olfactory bulb network, functionally different classes of local neurons seem to be involved in olfactory information processing in the antennal lobe of the fly.
Footnotes
This work was supported by the Volkswagen Stiftung (VW 1/75-399) and the Deutscher Akademischer Austausch Dienst (DAAD) and the German Bundesministerium für Bildung und Forschung (01GQ0771). We thank Beate Eisermann for excellent technical assistance, Jing Wang, Leslie Vosshall, and Gero Miesenböck for providing fly strains, Mathias Ditzen for providing data analysis tools, and members of the Galizia laboratory for helpful comments on this manuscript.
The authors declare no competing financial interests.
References
- Bhagavan S, Smith BH. Olfactory conditioning in the honeybee Apis mellifera: effects of odor intensity. Physiol Behav. 1997;61:107–117. doi: 10.1016/s0031-9384(96)00357-5. [DOI] [PubMed] [Google Scholar]
- Boeckh J, Tolbert LP. Synaptic organization and development of the antennal lobe in insects. Microsc Res Tech. 1993;24:260–280. doi: 10.1002/jemt.1070240305. [DOI] [PubMed] [Google Scholar]
- Borst A. Computation of olfactory signals in Drosophila melanogaster. J Comp Physiol A Neuroethol Sens Neural Behav Physiol. 1983;152:373–383. [Google Scholar]
- Charpak S, Mertz J, Beaurepaire E, Moreaux L, Delaney K. Odor-evoked calcium signals in dendrites of rat mitral cells. Proc Natl Acad Sci U S A. 2001;98:1230–1234. doi: 10.1073/pnas.021422798. [DOI] [PMC free article] [PubMed] [Google Scholar]
- Christensen TA, Waldrop BR, Harrow ID, Hildebrand JG. Local interneurons and information processing in the olfactory glomeruli of the moth Manduca sexta. J Comp Physiol A Neuroethol Sens Neural Behav Physiol. 1993;173:385–399. doi: 10.1007/BF00193512. [DOI] [PubMed] [Google Scholar]
- Christensen TA, Waldrop BR, Hildebrand JG. GABAergic mechanisms that shape the temporal response to odors in moth olfactory projection neurons. Ann N Y Acad Sci. 1998a;855:475–481. doi: 10.1111/j.1749-6632.1998.tb10608.x. [DOI] [PubMed] [Google Scholar]
- Christensen TA, Waldrop BR, Hildebrand JG. Multitasking in the olfactory system: context-dependent responses to odors reveal dual GABA-regulated coding mechanisms in single olfactory projection neurons. J Neurosci. 1998b;18:5999–6008. doi: 10.1523/JNEUROSCI.18-15-05999.1998. [DOI] [PMC free article] [PubMed] [Google Scholar]
- Cleland TA, Johnson BA, Leon M, Linster C. Relational representation in the olfactory system. Proc Natl Acad Sci U S A. 2007;104:1953–1958. doi: 10.1073/pnas.0608564104. [DOI] [PMC free article] [PubMed] [Google Scholar]
- Ditzen M, Evers JF, Galizia CG. Odor similarity does not influence the time needed for odor processing. Chem Senses. 2003;28:781–789. doi: 10.1093/chemse/bjg070. [DOI] [PubMed] [Google Scholar]
- Estes PS, Roos J, van der Bliek A, Kelly RB, Krishnan KS, Ramaswami M. Traffic of dynamin within individual Drosophila synaptic boutons relative to compartment-specific markers. J Neurosci. 1996;16:5443–5456. doi: 10.1523/JNEUROSCI.16-17-05443.1996. [DOI] [PMC free article] [PubMed] [Google Scholar]
- Galán RF, Sachse S, Galizia CG, Herz AV. Odor-driven attractor dynamics in the antennal lobe allow for simple and rapid olfactory pattern classification. Neural Comput. 2004;16:999–1012. doi: 10.1162/089976604773135078. [DOI] [PubMed] [Google Scholar]
- Galizia CG, Kimmerle B. Physiological and morphological characterization of honeybee olfactory neurons combining electrophysiology, calcium imaging and confocal microscopy. J Comp Physiol A Neuroethol Sens Neural Behav Physiol. 2004;190:21–38. doi: 10.1007/s00359-003-0469-0. [DOI] [PubMed] [Google Scholar]
- Galizia CG, Vetter RS. Optical methods for analyzing odor-evoked activity in the insect brain. In: Christensen TA, editor. Methods in insect sensory neuroscience. Boca Raton, FL: CRC; 2004. pp. 349–392. [Google Scholar]
- Jordán MJ, Tandon K, Shaw PE, Goodner KL. Aromatic profile of aqueous banana essence and banana fruit by gas chromatography-mass spectrometry (GC-MS) and gas chromatography-olfactometry (GC-O) J Agric Food Chem. 2001;49:4813–4817. doi: 10.1021/jf010471k. [DOI] [PubMed] [Google Scholar]
- Kurtz R, Warzecha AK, Egelhaaf M. Transfer of visual motion information via graded synapses operates linearly in the natural activity range. J Neurosci. 2001;21:6957–6966. doi: 10.1523/JNEUROSCI.21-17-06957.2001. [DOI] [PMC free article] [PubMed] [Google Scholar]
- Laissue PP, Reiter C, Hiesinger PR, Halter S, Fischbach KF, Stocker RF. Three-dimensional reconstruction of the antennal lobe in Drosophila melanogaster. J Comp Neurol. 1999;405:543–552. [PubMed] [Google Scholar]
- Laughlin SB. The role of sensory adaptation in the retina. J Exp Biol. 1989;146:39–62. doi: 10.1242/jeb.146.1.39. [DOI] [PubMed] [Google Scholar]
- Laurent G. Olfactory processing: maps, time and codes. Curr Opin Neurobiol. 1997;7:547–553. doi: 10.1016/s0959-4388(97)80035-9. [DOI] [PubMed] [Google Scholar]
- Linster C, Sachse S, Galizia CG. Computational modeling suggests that response properties rather than spatial position determine connectivity between olfactory glomeruli. J Neurophysiol. 2005;93:3410–3417. doi: 10.1152/jn.01285.2004. [DOI] [PubMed] [Google Scholar]
- Markova O, Mukhtarov M, Real E, Jacob Y, Bregestovski P. Genetically encoded chloride indicator with improved sensitivity. J Neurosci Methods. 2008;170:67–76. doi: 10.1016/j.jneumeth.2007.12.016. [DOI] [PubMed] [Google Scholar]
- Miesenböck G, De Angelis DA, Rothman JE. Visualizing secretion and synaptic transmission with pH-sensitive green fluorescent proteins. Nature. 1998;394:192–195. doi: 10.1038/28190. [DOI] [PubMed] [Google Scholar]
- Nakai J, Ohkura M, Imoto K. A high signal-to-noise Ca(2+) probe composed of a single green fluorescent protein. Nat Biotechnol. 2001;19:137–141. doi: 10.1038/84397. [DOI] [PubMed] [Google Scholar]
- Ng M, Roorda RD, Lima SQ, Zemelman BV, Morcillo P, Miesenböck G. Transmission of olfactory information between three populations of neurons in the antennal lobe of the fly. Neuron. 2002;36:463–474. doi: 10.1016/s0896-6273(02)00975-3. [DOI] [PubMed] [Google Scholar]
- Olsen SR, Wilson RI. Lateral presynaptic inhibition mediates gain control in an olfactory circuit. Nature. 2008;452:956–960. doi: 10.1038/nature06864. [DOI] [PMC free article] [PubMed] [Google Scholar]
- Olsen SR, Bhandawat V, Wilson RI. Excitatory interactions between olfactory processing channels in the Drosophila antennal lobe. Neuron. 2007;54:89–103. doi: 10.1016/j.neuron.2007.03.010. [DOI] [PMC free article] [PubMed] [Google Scholar]
- Pelz C, Gerber B, Menzel R. Odorant intensity as a determinant for olfactory conditioning in honeybees: roles in discrimination, overshadowing and memory consolidation. J Exp Biol. 1997;200:837–847. doi: 10.1242/jeb.200.4.837. [DOI] [PubMed] [Google Scholar]
- Pelz D, Roeske T, Syed Z, de Bruyne M, Galizia CG. The molecular receptive range of an olfactory receptor in vivo (Drosophila melanogaster Or22a) J Neurobiol. 2006;66:1544–1563. doi: 10.1002/neu.20333. [DOI] [PubMed] [Google Scholar]
- Root CM, Semmelhack JL, Wong AM, Flores J, Wang JW. Propagation of olfactory information in Drosophila. Proc Natl Acad Sci U S A. 2007;104:11826–11831. doi: 10.1073/pnas.0704523104. [DOI] [PMC free article] [PubMed] [Google Scholar]
- Sachse S, Galizia CG. Role of inhibition for temporal and spatial odor representation in olfactory output neurons: a calcium imaging study. J Neurophysiol. 2002;87:1106–1117. doi: 10.1152/jn.00325.2001. [DOI] [PubMed] [Google Scholar]
- Sachse S, Galizia CG. The coding of odour-intensity in the honeybee antennal lobe: local computation optimizes odour representation. Eur J Neurosci. 2003;18:2119–2132. doi: 10.1046/j.1460-9568.2003.02931.x. [DOI] [PubMed] [Google Scholar]
- Sachse S, Galizia CG. Topography and dynamics of the olfactory system. In: Grillner S, Graybiel AM, editors. Microcircuits: the interface between neurons and global brain function. Cambridge, MA: Dahlem UP–MIT; 2006. pp. 251–274. [Google Scholar]
- Sachse S, Peele P, Silbering AF, Gühmann M, Galizia CG. Role of histamine as a putative inhibitory transmitter in the honeybee antennal lobe. Front Zool. 2006;3:22. doi: 10.1186/1742-9994-3-22. [DOI] [PMC free article] [PubMed] [Google Scholar]
- Sachse S, Rueckert E, Keller A, Okada R, Tanaka NK, Ito K, Vosshall LB. Activity-dependent plasticity in an olfactory circuit. Neuron. 2007;56:838–850. doi: 10.1016/j.neuron.2007.10.035. [DOI] [PubMed] [Google Scholar]
- Schmuker M, Schneider G. Processing and classification of chemical data inspired by insect olfaction. Proc Natl Acad Sci U S A. 2007;104:20285–20289. doi: 10.1073/pnas.0705683104. [DOI] [PMC free article] [PubMed] [Google Scholar]
- Shang Y, Claridge-Chang A, Sjulson L, Pypaert M, Miesenböck G. Excitatory local circuits and their implications for olfactory processing in the fly antennal lobe. Cell. 2007;128:601–612. doi: 10.1016/j.cell.2006.12.034. [DOI] [PMC free article] [PubMed] [Google Scholar]
- Silbering AF, Galizia CG. Processing of odor mixtures in the Drosophila antennal lobe reveals both global inhibition and glomerulus-specific interactions. J Neurosci. 2007;27:11966–11977. doi: 10.1523/JNEUROSCI.3099-07.2007. [DOI] [PMC free article] [PubMed] [Google Scholar]
- Stocker RF. The organization of the chemosensory system in Drosophila melanogaster: a review. Cell Tissue Res. 1994;275:3–26. doi: 10.1007/BF00305372. [DOI] [PubMed] [Google Scholar]
- Stopfer M, Jayaraman V, Laurent G. Intensity versus identity coding in an olfactory system. Neuron. 2003;39:991–1004. doi: 10.1016/j.neuron.2003.08.011. [DOI] [PubMed] [Google Scholar]
- Svoboda K, Denk W, Kleinfeld D, Tank DW. In vivo dendritic calcium dynamics in neocortical pyramidal neurons. Nature. 1997;385:161–165. doi: 10.1038/385161a0. [DOI] [PubMed] [Google Scholar]
- Tanaka NK, Tanimoto H, Ito K. Neuronal assemblies of the Drosophila mushroom body. J Comp Neurol. 2008;508:711–755. doi: 10.1002/cne.21692. [DOI] [PubMed] [Google Scholar]
- Venables WN, Ripley BD. Modern applied statistics with S. New York: Springer; 2002. Classification; pp. 331–352. [Google Scholar]
- Wachowiak M, Shipley MT. Coding and synaptic processing of sensory information in the glomerular layer of the olfactory bulb. Semin Cell Dev Biol. 2006;17:411–423. doi: 10.1016/j.semcdb.2006.04.007. [DOI] [PubMed] [Google Scholar]
- Wang JW, Wong AM, Flores J, Vosshall LB, Axel R. Two-photon calcium imaging reveals an odor-evoked map of activity in the fly brain. Cell. 2003;112:271–282. doi: 10.1016/s0092-8674(03)00004-7. [DOI] [PubMed] [Google Scholar]
- Wilson RI, Mainen ZF. Early events in olfactory processing. Annu Rev Neurosci. 2006;29:163–201. doi: 10.1146/annurev.neuro.29.051605.112950. [DOI] [PubMed] [Google Scholar]
- Wilson RI, Turner GC, Laurent G. Transformation of olfactory representations in the Drosophila antennal lobe. Science. 2004;303:366–370. doi: 10.1126/science.1090782. [DOI] [PubMed] [Google Scholar]
- Xia S, Tully T. Segregation of odor identity and intensity during odor discrimination in Drosophila mushroom body. PLoS Biol. 2007;5:e264. doi: 10.1371/journal.pbio.0050264. [DOI] [PMC free article] [PubMed] [Google Scholar]