

Abstract
To intercept a fast target at destination, hand movements must be centrally triggered ahead of target arrival to compensate for neuromechanical delays. The role of visual-motion cortical areas is unclear. They likely feed downstream parietofrontal networks with signals reflecting target motion, but do they also contribute internal timing signals to trigger the motor response? We disrupted the activity of human temporoparietal junction (TPJ) and middle temporal area (hMT/V5+) by means of transcranial magnetic stimulation (TMS) while subjects pressed a button to intercept targets accelerated or decelerated in the vertical or horizontal direction. Target speed was randomized, making arrival time unpredictable across trials. We used either repetitive TMS (rTMS) before task execution or double-pulse TMS (dpTMS) during target motion. We found that after rTMS and dpTMS at 100–200 ms from motion onset, but not after dpTMS at 300–400 ms, the button-press responses occurred earlier than in the control, with time shifts independent of target speed. This suggests that activity in TPJ and hMT/V5+ can feed downstream regions not only with visual-motion information, but also with internal timing signals used for interception at destination. Moreover, we found that TMS of hMT/V5+ affected interception of all tested motion types, whereas TMS of TPJ significantly affected only interception of motion coherent with natural gravity. TPJ might specifically gate visual-motion information according to an internal model of the effects of gravity.
Keywords: interception, gravity, internal model, TMS, visual motion, magnetic
Introduction
Intercepting a moving target at destination requires predictive timing of the motor responses to compensate for sensorimotor delays (Tresilian and Plooy, 2006; Zago et al., 2008). In primates, several brain regions contribute the necessary visual and motor information (Merchant et al., 2004; Indovina et al., 2005; Miller et al., 2008; Senot et al., 2008). Recordings in monkey motor cortex and area 7a showed firing patterns timed to either the target or the hand movement (Port et al., 2001; Merchant et al., 2004). Less is known about the role in interception of earlier cortical regions sensitive to visual motion, such as the middle temporal area (MT/V5), medial superior temporal area (MST), or temporoparietal junction (TPJ). They likely feed visual-motion information (e.g., target direction and speed) into downstream regions, but do they also contribute internal timing signals?
A role for hMT/V5+ (putative human homolog of MT/MST) and posterior parietal cortex in time perception has been suggested by recent evidence that TMS of these two areas interferes with discrimination of the time duration of visual targets (Bueti et al., 2008). Moreover TMS of hMT/V5+ slowed down catching movements toward horizontally moving targets (Schenk et al., 2005) and a similar impairment in catching has been reported in a patient with bilateral lesion of hMT/V5+ (Schenk et al., 2000). Reduced catching speed might result from disruption of timing signals, consistent with the hypothesis that visual-motion regions may contribute to compute interception timing. However, these results might also reflect underestimates of target speed, as it is known that target speed is underestimated after TMS of hMT/V5+ in speed discrimination tasks (Matthews et al., 2001), or lesions of hMT/V5+ (Barton et al., 1996) and monkey MT in eye-tracking tasks (Newsome et al., 1985).
fMRI studies showed activation of hMT/V5+ during button-press interception of targets accelerated downward by gravity or decelerated downward by reversed gravity (Indovina et al., 2005; Miller et al., 2008). Instead, TPJ regions were activated preferentially by downward accelerating targets, suggesting a specialization for visual gravitational motion. However, these fMRI studies provided no conclusive evidence for a direct role of the visual-motion regions in interception timing, because these regions were also activated by viewing target motion.
To investigate causal relationships between TPJ or hMT/V5+ activity and the timing of interception, here we disrupted their activity by means of TMS while subjects pressed a button to intercept accelerated or decelerated targets at destination without performance feedback. Target speed was randomized, making arrival time unpredictable from trial to trial. In different experiments, the target moved vertically under gravity or horizontally without gravity.
We expected that TMS of hMT/V5+ should affect interception of accelerating and decelerating targets to a comparable extent, independent of gravity effects and motion direction, whereas TMS of TPJ should affect preferentially interception of targets accelerated downward by gravity, consistent with the hypothesis that TPJ is specialized for visual gravitational motion.
Moreover, if TMS of TPJ or hMT/V5+ affected interception only by altering the visual estimates of target motion, the perturbed responses should be time shifted relative to the control responses by an amount dependent on target speed. If instead TMS affected interception also by altering internal timing signals, the perturbed responses should be time shifted by an amount independent of target speed.
Materials and Methods
Participants
Thirty-five subjects (16 women, 19 men) aged between 20 and 32 years (mean age: 23.7 years) participated in this study. They had no known history of neurological disorders and met the additional safety criteria for TMS (Wassermann, 1998). All subjects were right handed, as determined by using an abbreviated version of the Edinburgh Handedness Inventory (Oldfield, 1971). The study was approved by the Ethics Committee of the Santa Lucia Foundation, and all participants provided written informed consent.
Setup, visual stimuli, and tasks
Subjects were seated in a semidarkened room with the head restrained by a forehead and chin rest, facing a 21“ CRT display (Philips, model 201B40, 1024 × 768 pixels, 85 Hz refresh rate) at a distance of 1.10 m. They wore a tightly fitting Lycra swimming cap, small earphones, and surface cup electrodes for electro-oculography (EOG) throughout the experiment.
Vertically moving targets.
A picture of a human figure standing next to a building and holding a basket was projected on the visual display. In each trial of the Interception task (IT), a ball (0.5° visual angle) descended from the cornice at the top of the building into the basket (4 m trajectory in picture coordinates, 9.3° visual angle). The overall motion duration (MD) was made unpredictable from trial to trial by randomizing the value of initial speed of the target. There were 4 possible MD, equally spaced between 700 and 890 ms. The corresponding range of mean target speeds was 4.5–5.71 m s−1 (10.5–13.3° s−1). The magnitude of ball acceleration was set at 9.81 m s−2 (22.9° s−2) in all trials, but its direction was congruent with either natural gravity (g trials, downward accelerated) or unnatural reversed gravity (−g trials, downward decelerated). g trials and −g trials were presented in alternated miniblocks (see below). Subjects were instructed to press a mouse button with the right index at the same time as the ball arrived within the basket, while maintaining gaze fixation on a red dot (0.36°) at the center of the basket throughout trial duration. No feedback was given to the subjects about their performance. The nominal temporal accuracy required to correctly intercept each target was ±12 ms (monitor refresh time).
Horizontally moving targets.
In IT trials, the moving target was represented by a motorcycle traveling along a horizontal road. The motorcycle appeared on the left side of the scene and moved rightwards before hitting a wall with its front wheel (4 m trajectory in picture coordinates, 9.3° visual angle). In separate blocks of trials, the motorcycle either accelerated or decelerated at the same rate (9.81 ms−2) we used for the vertically moving targets. As before, motion duration (MD) in each trial was randomly chosen among 4 different values. Subjects were instructed to press the mouse button with the right index at the same time as the front wheel of the motorcycle hit the wall. They maintained fixation on a red dot (0.36°) at the point of impact on the wall surface throughout trial duration.
Visual reaction time task.
In separate blocks of trials of protocol 1 and protocol 4 (see below), subjects also performed a visual reaction time task (RTT). Moving targets (the ball or the motorcycle) were not presented in these trials; instead, the fixation dot expanded by 1.7 times for 200 ms after a delay from the beginning of the trial randomly chosen among 4 values that matched the movement durations of the visual targets in the interception task. Subjects were instructed to press the button as soon as possible after the expansion of the fixation dot.
General procedures and recording apparatus.
Subjects familiarized with the behavioral tasks during a training session, which took place on the same day when we acquired the MRI anatomical scan (2–7 d before the TMS experiment) and consisted of 40 RTT trials and 180 IT trials. Button-press responses were recorded by sampling the analog output of a custom-made mouse at 1 kHz. EOG was recorded by means of Ag–AgCl surface cup electrodes (Grass, model: F-E9M) that were placed bitemporally to monitor horizontal eye movements, and above and below the right eye to monitor vertical eye movements. EOG signals were amplified, low-pass filtered (10 Hz cutoff), and sampled at 1 kHz. We calibrated the EOG signals by asking subjects to perform a series of eye movements in response to step displacements of a white target dot (0.5°) projected on the computer display. A series of target steps was used to sample the display area of the monitor.
EMG activity of selected muscles of the right-hand (see below) was recorded by means of two Ag–AgCl surface cup electrodes (Grass, model: F-E9M), while a ground electrode was placed over the left wrist. EMG responses were amplified (Grass, model 15A94), bandpass filtered, and sampled (filtering and sampling varied according to the procedures, see below). All signals recorded during the experiment (EOG, button presses, and EMG) were digitally stored by means of a PC-based data acquisition interface (Power 1401, Cambridge Electronic Design). A second PC was dedicated to monitor head and TMS coil displacements with the Optotrak system (see next section).
Transcranial magnetic stimulation
We used a figure 8 coil (Double 70 mm coil) connected to a SuperRapid stimulation unit (Magstim).
Target stimulation sites.
The locations of the target stimulation sites were determined a priori in normalized stereotactic space [Montreal Neurological Institute (MNI)] on the basis of previous fMRI studies. For TPJ, we selected two target stimulation sites from the mean brain volume activated jointly by visual gravitational motion (using the contrast [g trials > −g trials]) and vestibular caloric stimulation (using the contrast [left ear stimuli + right ear stimuli] > baseline) in the fMRI study of Indovina et al. (2005). These sites corresponded to two bilateral activation foci located on the surface of the supramarginal gyrus (BA 40): one near the posterior end of the Sylvian fissure (MNI X, Y, Z coordinates: ±62, −36, 32 mm), and the other one more rostral and ventral at the border with the parietal operculum and the superior temporal gyrus (MNI coordinates: ±61, −29, 21 mm). In a subset of 4 subjects of the present study (1 from protocol 1, and 3 from protocol 2) we were able to validate a posteriori the choice of TPJ stimulation sites as belonging to the brain volume activated by visual gravitational motion in fMRI. These subjects performed the interception tasks also during fMRI scanning according to the procedures previously described (Indovina et al., 2005, Miller et al., 2008). Single-subject analysis performed by means of statistical parametric mapping on the contrast [interception of g targets > interception of −g targets] revealed significant (p < 0.01) peaks of activity in TPJ: they were located at a mean distance of 6.7 mm from the stimulation site used in the TMS experiments in the same subjects.
With regard to area hMT/V5+, the anatomical location and extent of this area have been defined with good confidence by several neuroimaging studies (e.g., Watson et al., 1993; Tootell and Taylor, 1995; see also reviews by Van Essen, 2003; Orban et al., 2004). We centered the bilateral target sites at the MNI coordinates (±52, −71, 0 mm) of the activation foci reported by Orban et al. (2003). Although the criterion of identification of the target sites was exclusively anatomical, before the TMS experiment in 7 blindfolded subjects (three belonging to protocol 2, two to protocol 3, and one each to protocol 1 and 4) we verified that single-pulse TMS (intensity: 60–80% of the maximum stimulator output) applied on the selected site for hMT/V5+ produced the visual illusion of moving phosphenes, a technique that may be also used to functionally identify hMT/V5+ (Whitney et al., 2007).
Figure 1 illustrates the contour of the targeted region within the TPJ region (dark green line, BA40 drawn from Caret partitioning scheme, Van Essen 2005) and the borders of area hMT/V5+ (blue line, also drawn from Caret) plotted on a 3D fiducial rendering of the MNI brain template along with the actual locations of the stimulation sites (TPJ, red symbols; hMT/V5+, yellow symbols) of one series of experiments of the present study (protocol 1). The mean MNI coordinates of the TMS cortical sites for each experimental protocol are reported in Table 1, along with the distances from the selected target locations. In addition, for the hMT/V5+ sites the table reports the distances between the MNI coordinates of these stimulation sites and the coordinates of fMRI activation peaks reported by Orban et al. (2003) for two neighboring visual motion areas, LOS/KO and hV3a, which could be accidentally targeted in TMS studies investigating hMT/V5+ (Sack et al., 2006).
Figure 1.

Stimulation sites. The contours of the target regions of interest are plotted (green TPJ, blue hMT/V5+) on a 3D rendering of the right hemisphere of the MNI brain template. The locations of the stimulation sites in the two groups of subjects of protocol 1 are shown for TPJ (red) and hMT/V5+ (yellow).
Table 1.
TMS site localization
| Protocol | TPJ |
hMT/V5+ |
||||
|---|---|---|---|---|---|---|
| Mean MNI coordinates (± SD) | Target distance (mm) | Mean MNI coordinates (± SD) | Target distance (mm) | LOS distance (mm) | hV3a distance (mm) | |
| 1 | 65, −36.6, 30.1 (1.2, 3.3, 3.6) | 3.6 | 55, −67.8, 1.8 (1.4, 2.2, 3.0) | 4.7 | 20.7 | 31.4 |
| 2 | 67, −25.7, 22.7 (0.6, 3.5, 2.9) | 7 | 55.8, −68.2, 2.5 (1.5, 1.9, 4.8) | 5.3 | 21.0 | 31.7 |
| 3 | −62.5, −36.2, 30 (2.5, 6.6, 3.9) | 2.1 | −49.8, −71.0, 3.3 (0.7, 2, 2.7) | 3.9 | 15.2 | 32.0 |
| 4 | 65.3, −35, 27.3 (1.2, 4.1, 4.4) | 5.8 | 56.8, −66.8, 0.8 (1.9, 1.3, 3.3) | 6.4 | 22.7 | 33.5 |
The table reports the mean (± SD) MNI coordinates across subjects of the TPJ and hMT/V5 + stimulation sites for the four TMS protocols. For TPJ the distance between the mean coordinates of the stimulation site and either one of the two target sites (±62, −36, 32 or ±61, −29, 21) drawn from the fMRI activations of Indovina et al. (2005) is reported. For hMT/V5+, the distances between the mean coordinates of the stimulation site and the fMRI activation peaks in MNI coordinates drawn from Orban et al. (2003) for hMT/V5+ (target site, ±52, −71, 0), LOS/KO (±42, −84, 2) and hV3a (33, −90, 5 and −27, −93, 8) are also reported.
In addition to TPJ and hMT/V5+, for protocol 2 (see below), we stimulated the vertex (at the position Cz of the 10–20 International EEG system).
The coil was positioned on the scalp over the target stimulation sites by means of a coregistration technique onto individual anatomical MRI and held firmly in place with a multiple degrees of freedom mechanical arm (Magic Arm, Manfrotto). During each experimental session, we monitored the coil position so as to detect any displacement of the coil hotspot outside a volume of 7 mm radius centered on the target coordinates of the cortical site. When this occurred, the experiment was halted temporarily and resumed once the coil was repositioned on the desired scalp site (for a detailed description of these procedures and further details on TMS target site localization and validation, see supplemental material, available at www.jneurosci.org).
TMS intensity.
Stimulation intensity for the experiments was expressed relative to the individual resting motor threshold (THR) determined before each TMS experiment. To this end, we recorded the motor evoked potentials (MEP) from the abductor pollicis brevis (APB) muscle of the right-hand. TMS coil was positioned tangentially to the scalp overlying the left motor cortex at a 45° angle from the midline, with the handle pointing backwards. EMG activity was recorded from the APB by placing the active electrode over the muscle belly and the reference electrode over the first metacarpophalangeal joint. EMG responses were bandpass filtered at 30 Hz to 3 kHz, and sampled at 5 kHz. We determined the hot spot for the APB muscle starting with a stimulation intensity of 30% of the maximum stimulator output, increasing intensity with 5%-increments, and moving the coil with 0.5 cm steps over the scalp. We considered the subject's THR as the stimulation intensity at which ≥50% of the responses were >50 μV. The mean THR across all subjects was 63.5% (±5.9 SD). There was no significant difference in THR between each group of subjects who participated in different experimental protocols (p = 0.9, Kruskal–Wallis one-way ANOVA).
TMS paradigms.
We used two complementary approaches, off-line and event-related, to interfere with the neural activity of hMT/V5+ and TPJ. In the off-line protocol (protocol 1, see below), we applied low-frequency repetitive TMS (rTMS) before the execution of blocks of test trials. It is known that rTMS applied for the duration of several minutes produces disruption of the activity of the stimulated brain region that outlasts the rTMS train for approximately half of its duration (Pascual-Leone et al., 2000; Walsh and Cowey, 2000; Robertson et al., 2003). rTMS was delivered over either TPJ or hMT/V5+ at 1 Hz for 10 min, with a stimulation intensity equal to 70% of the maximum stimulator output. Seventy percent of the maximum stimulator output corresponded to 106.7 ± 9.2% (mean ± SD) of the individual THR, a value comparable to the 110% of the individual THR used for the 2 other protocols.
In protocols 2 and 3, we used an event-related approach in which magnetic pulses are applied at different times during each test trial, referenced to trial onset. Event-related TMS is used to characterize temporal aspects of the processing of a target cortical region by defining time windows of cortical inactivation during the test trial (Pascual-Leone et al., 2000). In particular, we used double-pulse TMS (dpTMS, 100-ms interpulse interval) (Fig. 2B) over two time windows. dpTMS was applied either 100 ms (dpTMS-100) or 300 ms after trial onset (dpTMS-300) with a stimulation intensity equal to 110% of the individual THR. If we assume that each TMS pulse delivered at this intensity interferes with cortical function for ∼50–100 ms after its delivery (Pascual-Leone et al., 2000, Siebner and Rothwell, 2003), dpTMS-100 may have transiently disrupted cortical activity over ∼100–300 ms after trial onset. By the same token, dpTMS-300 may have transiently inactivated the cortex over ∼300–500 ms after trial onset.
Figure 2.
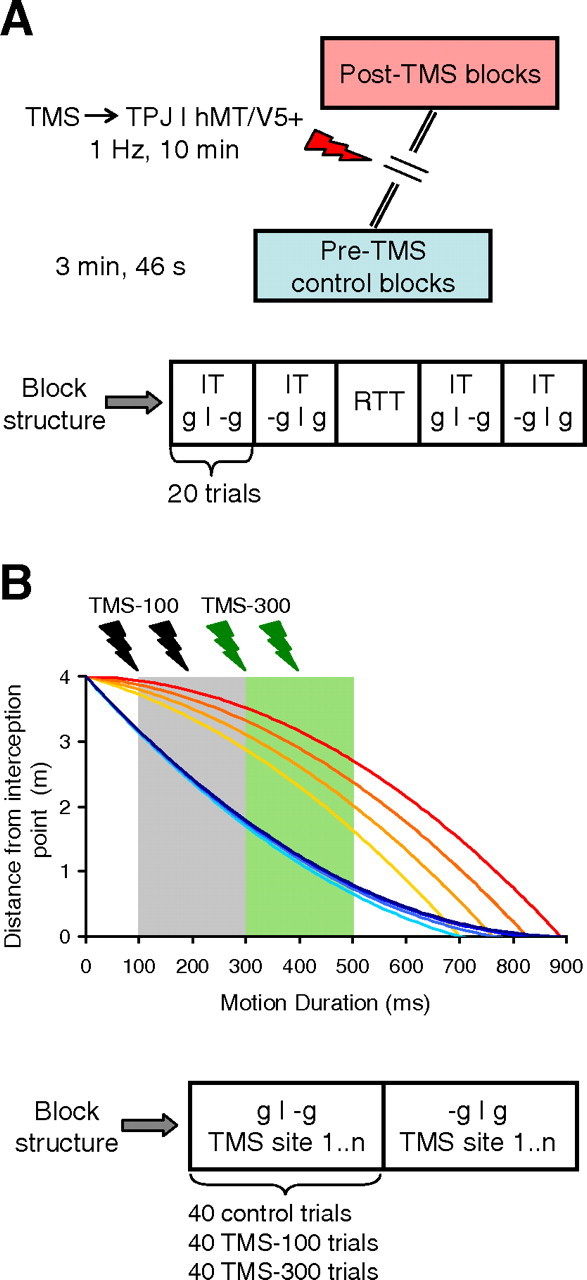
Experimental protocols. Block sequence and structure are shown for the low-frequency repetitive TMS (rTMS) experiments and double-pulse TMS (dpTMS) experiments in A and B, respectively. IT and RTT are miniblocks of interception trials and reaction-time trials, respectively. In B, dpTMS could be applied at either 100–200 ms (dpTMS-100) or 300–400 ms (dpTMS-300) after target motion onset, presumably interfering with cortical activity during the gray and green time window, respectively.
None of the subjects reported altered perception of the visual stimuli during the experimental sessions, although the demanding attentional requirements of the motor task might have masked potential TMS effects on perception.
We took specific measures to reduce the probability of interference with the motor responses by nonspecific auditory and somatosensory stimuli associated with dpTMS (Pascual-Leone et al., 1992; Terao et al., 1997). To minimize auditory artifacts, we masked the click noise of the coil discharge with white noise delivered continuously through earphones. To reduce somatosensory artifacts, we made fine adjustments of the coil orientation and position at the target site, until the occurrence and the magnitude of the muscle twitches and eye blinks that may accompany TMS were minimal. Finally, to control directly for TMS artifacts, we used vertex or sham-TMS (depending on the experimental protocol, see below) as control conditions. These conditions should elicit auditory and somatosensory artifacts similar to those associated with test TMS, without effectively stimulating the cortical sites of interest.
Experimental protocols
Protocol 1.
Twelve subjects participated in this protocol: half of them received rTMS on the right TPJ, and the other half on the right hMT/V5+. All subjects intercepted descending targets (IT, task of interest) and responded in reaction time to the expansion of the fixation point (RTT, control task) (see Fig. 2A).
They performed two blocks of 100 trials (intertrial interval = 2 s; block duration = 3 min, 46 s). The first block was performed at the beginning of the experiment (pre-rTMS control), whereas the other block of trials was performed immediately after rTMS of the cortical site (post-rTMS block). Each block comprised four miniblocks of 20 IT trials with either g or −g motion, and one miniblock of 20 RTT trials, which was always presented in the middle position within the miniblock sequence. The starting order of miniblocks with either g or −g trials was counterbalanced across subjects. Each block included 80 IT trials (10 repetitions of 8 experimental conditions, corresponding to 2 accelerations × 4 MD) and 20 RTT trials (5 repetitions of 4 experimental conditions corresponding to 4 expansion delays).
We also tested the effects of rTMS on TPJ and hMT/V5+ within a subset of 6 subjects (4 from the hMT/V5+ group and 2 from the TPJ group). To this end, we applied 10 min rTMS of the second cortical site, following a 30 min recovery period after the stimulation of the first cortical site. Immediately after rTMS of the second cortical site, subjects performed one additional block of trials with the same trial structure described above. The order of stimulation was hMT/V5+ first and TPJ next in 4 subjects, and vice versa in 2 subjects.
Protocol 2.
There were 3 groups of 6 subjects each: the first group received dpTMS on the right TPJ, the second one on the right hMT/V5+, and the third one on the vertex. One subject from this TPJ group had participated also in the hMT/V5+ group of protocol 1 approximately 7 months earlier.
The experiment consisted of two blocks of 120 IT trials with either g or −g motion (intertrial interval = 4.5 s) (see Fig. 2B). During each block, 40 trials (10 for each MD) were performed without TMS (no-TMS control trials), 40 trials with dpTMS-100, and 40 trials with dpTMS-300. The presentation order of the trials within a given block was randomized for MD and TMS condition (control, dpTMS-100, and dpTMS-300), whereas the block order was counterbalanced across subjects.
Protocol 3.
In 6 subjects we applied dpTMS on the left TPJ, dpTMS on left hMT/V5+, and sham dpTMS over the left TPJ site (as intrasubject control condition). For sham dpTMS, the coil was placed perpendicular to the scalp. The general block structure was the same as in protocol 2, except that now each subject performed six blocks of IT trials, 2 for each TMS site. Thus, every two blocks subjects were given a 10 min pause, during which the coil was repositioned to the next TMS site. Both block order (g or −g motion) and order of dpTMS site were counterbalanced across subjects.
Protocol 4.
We studied the interception of horizontally moving targets in 6 subjects who had previously participated (∼1 year earlier) in experimental protocols with vertical targets (5 subjects from protocol 1 and 1 subject from protocol 2). The general layout of the experiment was identical to protocol 1 (see Fig. 2A). The subjects underwent rTMS of either the right TPJ or the right hMT/V5+ in two separate experimental sessions at least 24 h apart (typically 3 d apart). As in protocol 1, in each experimental session subjects performed two blocks of 100 trials (intertrial interval = 2 s; block duration = 3 min, 46 s), one as pre-rTMS control and the other one immediately after rTMS of the cortical site (post-rTMS block). Each block comprised four miniblocks of 20 IT trials with either accelerated or decelerated motion, and one miniblock of 20 RTT trials. The starting order of miniblocks with either accelerated or decelerated trials was counterbalanced across subjects whereas the miniblock of RTT trials was invariably positioned in the middle of the miniblock sequence. Finally, the order of stimulation of the two cortical sites was also counterbalanced across subjects.
Estimate of the neuromechanical delay.
Transmission time (TT) between motor cortex and electrical muscle activity was estimated from the latency of MEP relative to the TMS pulse: mean latency was 23.7 (±0.46 SEM) across all experiments and subjects. This mean value is in good agreement with the TT previously estimated from the time lead of MEG signals recorded over primary motor cortex relative to EMG activity of finger muscles during isometric contractions (Salenius et al., 1997) and with values reported by other TMS studies (Hallett, 2000). In separate experiments, we estimated the delay (D) between the onset of the EMG activity recorded from the first lumbrical muscle (a flexor of the metacarpophalangeal joint of the index finger) and the time of the button press. In these experiments, six subjects performed one block of 100 trials (80 IT and 20 RTT trials) with the same trial sequence as in protocol 1. EMG responses were bandpass filtered at 20–200 Hz and sampled at 1 kHz. EMG signals were then rectified and digitally low-pass filtered (bidirectional, cutoff frequency = 20 Hz, second order Butterworth filter). We computed the onset of the EMG activity as the time when EMG activity first reached 30% of its peak value and measured the time interval between the EMG onset and the button press. We found that the mean value of D was 50.8 ms (± 4.48 SEM) for IT responses, whereas it was 44.7 ms (± 4.29 SEM) for RTT responses (the difference between D value for IT and D value for RTT was not significantly different from zero; p = 0.09 paired t test). One can estimate the overall neuromechanical delay (δ) between motor cortex activation and button-press response as δ = TT + D. Thus, δ ≈ 75 ms for IT responses.
Data analysis
We discarded from the dataset all the trials that did not comply with the following prerequisites: (1) gaze fixation was maintained throughout the trial; and (2) during dpTMS, the coil hotspot remained within a spherical volume of 7 mm radius centered on the target site coordinates. We verified that subjects maintained fixation by analyzing the EOG signals recorded during each trial to detect possible eye movements. To this end, we first analyzed the EOG signals recorded during the calibration routine and computed the eye movement threshold. The threshold was defined as half the lowest peak eye velocity recorded during the calibration eye movements. Then, we analyzed the EOG signals recorded during the IT and RTT tasks and discarded the trials which showed suprathreshold peak eye velocities. According to this criterion, we discarded 3.5% of the total number of trials across subjects.
With regard to TMS coil positioning, we found that the hotspot of the TMS coil was displaced outside the target cortical region only twice and we discarded the corresponding trials.
The analysis of the response times was performed according to the following procedures. For the IT trials, we computed the time of occurrence (TM) of the button press relative to the time of target motion onset. The timing errors (TE) were computed as the difference between TM and MD (target motion duration): negative values correspond to early responses, whereas positive values correspond to late responses. Mean TE values were computed for each experimental condition and pooled across subjects for subsequent group analyses. To assess the effects of TMS on interception timing, we computed the difference (denoted ΔTE) between the TE values in TMS trials for each specific condition and the corresponding values in control trials.
For the RTT trials, reaction time (RT) was computed as the difference between the button-press time and the onset time of fixation point expansion. Based on data reported in visual RTT literature showing that shortest RT responses are typically >180 ms (Teichner and Krebs, 1972; Welford, 1988), we discarded response times shorter than 140 ms as they were likely triggered before the visual stimulus onset. Mean response times were computed for each expansion delay and then pooled across subjects for later group analyses. To assess the effects of TMS on RT, we computed the difference (denoted ΔRT) between RT values in TMS trials and RT values in control trials.
ANOVAs with TMS as repeated-measures factor were used to evaluate the statistical significance of the TMS effects on the response times. The analysis was performed separately for accelerated and decelerated trials, using MD and fixation point expansion delay as additional factors to account for the variability in IT and RTT trials, respectively. We evaluated the statistical significance (p < 0.05) of the main effect of TMS and of the interaction between TMS and MD (TMS × MD), which tested a potential dependence on the target MD of the TMS effects on motor timing.
In addition, for those conditions that showed statistically significant TMS effects on motor timing according to the ANOVA, we performed multiple regression analyses which tested for linear and quadratic trends of the ΔTE with target MD or initial speed:
This general regression model was submitted to an iterative backward elimination of the least significant predictors (cutoff α = 0.05) to determine which independent predictors explained a significant fraction of the dataset variance. We analyzed separately accelerated and decelerated trials, either by pooling together data from all experiments or by considering data from each experimental protocol and TMS location separately. Statistical analyses were performed using SYSTAT 9.0 (SPSS).
Numerical simulations
In all-or-none interception tasks, such as button-press interceptions, subjects must program their response in a predictive manner, because there is no possibility for corrections once the response is triggered. Most predictive models of interception assume that an estimate of target time-to-contact (TTC) is compared with a preset threshold value (λ) during target motion (Lee et al., 1983; Port et al., 1997; McIntyre et al., 2003; Zago et al., 2004; Senot et al., 2005; Tresilian and Plooy, 2006). When the threshold is reached, an interceptive program is executed generating a motor response after a time delay μ. μ is comprised of processing time reflecting internal delays in relaying visual information to motor regions and motor command execution time (including neuromechanical delays). If the neural estimates of target kinematics were exact and μ matched λ, the interception response would be perfectly synchronized with target arrival. In reality, visual estimates of target kinematics may be noisy or inaccurate (Weiss et al., 2002), and λ may overestimate or underestimate TTC depending on target kinematics (Zago et al., 2004; Senot et al., 2005). However, subjects might compensate for such errors in TTC estimates by shortening μ when TTC is overestimated, and lengthening μ when TTC is underestimated. A modulation of μ might therefore allow a more flexible control of interception. In all-or-none interceptive responses, the component of μ attributable to transmission time (such as the neuromechanical delay) is probably unmodifiable, but the component attributable to central processing time can be shortened or lengthened as a function of task demands (Senot et al., 2005). Note that, although μ corresponds to the time interval intervening between threshold time and motor response, the specific value of processing time could be set at any time before threshold time.
TMS of TPJ or hMT/V5+ might disrupt interception timing in two different ways: (1) by altering the neural estimates of target kinematics, or (2) by altering internal time delays. Estimated kinematic parameters might be distorted by a factor s:
 |
 |
 |
where x, ẋ, and ẍ are the target position, speed, and acceleration at a given time t, respectively, and “capped” variables denote the neural estimates of the corresponding physical variables. A given parameter is correctly estimated when s = 1, whereas it is underestimated when s < 1 or overestimated when s > 1.
In the present experiments, the motion of the target moving from the starting point to the arrival point is described by the following equations:
where x0 and ẋ0 are the initial distance from the arrival point and speed, respectively, and ẍ0 is the constant acceleration of the target (ẍ0 = ±9.81 m s−2, depending on trial type).
Let ε denote the time elapsed after the onset of target motion when threshold time λ before the expected target arrival is reached. At that time, the estimated kinematics is equivalent to
At the same time, actual target kinematics is
Combining equations, we obtain
Substituting and solving for ε gives
 |
In sum, the predicted time of motor response relative to motion onset is equivalent to
 |
and the corresponding value of the predicted response time relative to actual target arrival time is
Note that, for figure clarity, time-shifts and internal time delays have been plotted as absolute values. We simulated the effects of TMS predicted by our different hypotheses in the following manner. (1) We assumed that the neural estimate of target position, speed, or acceleration is distorted by TMS according to Equations 2–4. Then we used Equation 12 to compute the amount by which the TMS-perturbed response would be time shifted (Δτ) relative to the control response as a result of the distortion. The values of Δτ are plotted as a function of sv as continuous curves in Figure 3. Predictably, an increasing distortion of target speed leads to an increasing time shift of the response. However, the magnitude of the effect changes drastically with motion duration (MD), as shown by the different slopes of the curves: curves labeled 1–4 correspond to the 4 MD of the present experiments in decreasing order of duration. We verified that the overall qualitative trend of the simulations does not depend on the specific choice of distortion parameters (for instance, whether TMS induces a multiplicative or additive distortion of measured target speed). Also, we verified that the trend remains qualitatively similar (although the effects are much larger) if we assume that TMS distorts not only target speed (sv ≠ 1), but also position (sp ≠ 1) and/or acceleration (sa ≠ 1). The key point of these simulations reflects the intuitive notion that a distortion of the neural estimates of target motion (as resulting from TMS) should lead to a time shift of the motor response that depends on target kinematics.
Figure 3.
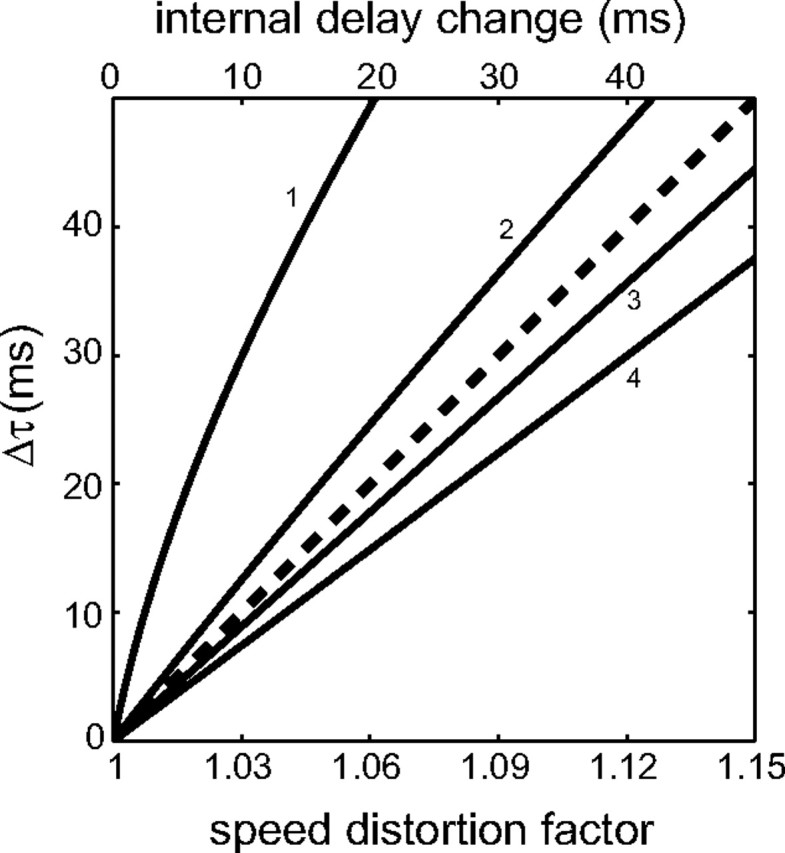
Simulations of TMS effects on interception timing. Continuous curves: predicted time shifts (Δτ, ordinates) of the TMS-perturbed responses relative to the control responses are plotted as a function of the distortion (sv) of the visual estimate of target speed (bottom abscissae) theoretically produced by TMS. Target speed is correctly estimated for sv = 1, whereas it is overestimated for sv > 1. Curves labeled 1–4 correspond to motion durations 890–700 ms, respectively. Dashed-line: predicted time shifts are plotted as a function of the change of internal time delays (top abscissae) theoretically produced by TMS. Here all the curves corresponding to the 4 different motion durations coincide exactly.
(2) We assumed that TMS alters the internal time delay μ. The values of the time shifts Δτ are plotted as a function of the decrement in μ induced by TMS as the dashed line in Figure 3. Here all the curves corresponding to the 4 different motion durations coincide exactly, showing that the time shifts are independent of MD, in contrast with the effects of a distortion of estimated target kinematics.
We also compared quantitatively the experimentally observed responses TM to the responses TM* predicted by Equation 12, based on a least-squares fitting procedure. For this analysis, we used the large dataset of the experiments with vertical motion. TM values were computed separately for each motion duration and for g and −g trials. They were then averaged across all corresponding trials of all subjects. Goodness-of-fit was assessed via the root mean square error (RMSE) of TM* relative to TM, as well as from the distribution of the residuals around the mean. For the control trials, we set sp = sv = 1, sa = 0 (as in the tau model) (Lee et al., 1983; Port et al., 1997) or sa = 1 (as in the internal model of gravity) (McIntyre et al., 2001; Zago et al., 2004), and found the best-fitting values of λ and μ. For the TMS (perturbed) trials, we followed two different approaches to test the predictions of the hypotheses mentioned above. (1) We best-fitted a variable value of sv to TMS data, while keeping λ and μ fixed to the control values. (2) We best-fitted a variable value of μ to TMS data, while keeping sv and λ fixed to the control values. We will not report the results of changing λ values, because they were similar to those of changing sv. This is because λ and s are multiplied together everywhere in Equation 12, except for the term in ẍ0.
Results
Targets could move at one of two different accelerations (positive or negative g), and one of four motion durations (depending on the randomly chosen value of initial speed). Target arrival time at destination was unpredictable from trial to trial. In different experiments, target motion direction was either vertical or horizontal. Because subjects were not provided with performance feedback, they could not use sensory error signals to correct their performance with practice. Overall, the use of targets with distinctly different kinematics together with the presence of significant motor errors results in a wide range of response times that are amenable to correlation with the target kinematics. If TMS of TPJ or hMT/V5+ affects interception timing by altering the neural estimates of target motion, the TMS-perturbed responses should be time shifted relative to the control responses by an amount that depends on motion duration (see Fig. 3 and Materials and Methods, Numerical simulations). If instead TMS of TPJ or hMT/V5+ affects interception timing by altering the internal time delays, the TMS-perturbed responses should be time shifted relative to the control responses by an amount that does not depend on motion duration.
Our protocols were also aimed at testing whether hMT/V5+ or TPJ are specialized for specific types of motion. In particular, the hypothesis that TPJ is specialized for visual gravitational motion (Indovina et al., 2005; Miller et al., 2008) predicts that TMS of this region should affect preferentially interception of targets accelerated downward by gravity. In contrast, one would expect that hMT/V5+ is not specialized for gravity, and TMS of this area should affect interception of accelerating and decelerating targets to a comparable extent, independent of gravity effects and motion direction (vertical or horizontal).
Interception of vertically moving targets
In this series of experiments, subjects intercepted a ball descending along the vertical with constant acceleration (g targets) or deceleration (−g targets).
Unperturbed interception
The results obtained in the control conditions were similar to the previous findings obtained during fMRI experiments with a similar task (Indovina et al., 2005; Miller et al., 2008). The timing errors TE (response time relative to actual arrival time of the target) for g targets were significantly different from those for −g targets (p < 10−3, two-sample t test over all subjects and experiments). Mean TE was −11.5 ms (± 4.8 SEM) for g trials, and −93.2 ms (± 9.2 SEM) for −g trials, indicating an interception timing more accurate in the former than in the latter case (Indovina et al., 2005; Miller et al., 2008). Moreover, TE for g trials was independent of target motion duration MD (F(3,140) = 0.135; p = 0.94), whereas TE for −g trials was increasingly negative with increasing MD (F(3,140) = 9.68; p < 10−3).
Off-line TMS protocol
In a first series of experiments (protocol 1), low-frequency repetitive transcranial magnetic stimulation (rTMS) was applied after the execution of the pre-rTMS control blocks of trials and before the execution of post-rTMS blocks of trials (see Fig. 2A). These experiments were designed to interfere with the activity of targeted neural populations throughout the trial duration of post-rTMS blocks. The target sites were either TPJ or hMT/V5+ of the right hemisphere in two different groups of subjects (between-group design, see Materials and Methods). In a subset of these subjects, the stimulation was applied to both target sites in sequential order during the same experiment, with a 30 min recovery period in-between (within-group design).
Between-group rTMS effects on interception trials.
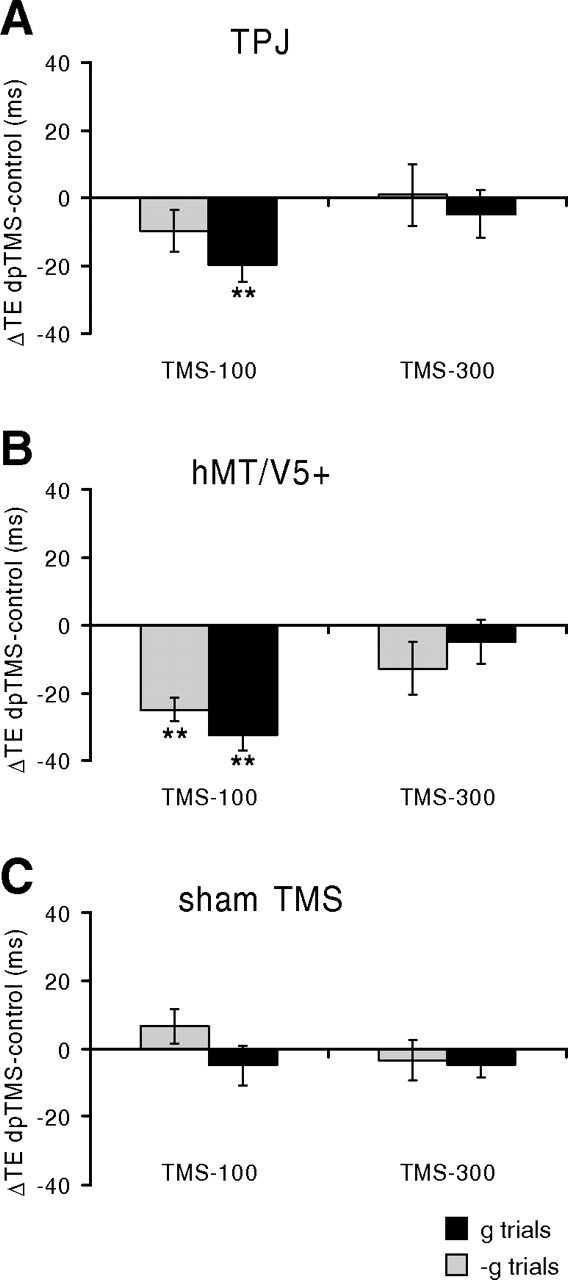
Stimulation of the two target sites showed a very different selectivity for g and −g targets: rTMS on TPJ significantly affected the interception of g targets but not that of −g targets, whereas rTMS on hMT/V5+ significantly affected the interception of both g and −g targets (Fig. 4, Table 2). For area hMT/V5+, the ensemble average of ΔTE (difference between the TE values in post-rTMS trials and the corresponding values in pre-rTMS control trials, averaged over all trials and MD) was not significantly different between g and −g trials (paired t test, p = 0.46). Moreover, for g trials there was no statistically significant difference between the ΔTE observed in the hMT/V5+ and in the TPJ group (two-sample t test, p = 0.28).
Figure 4.
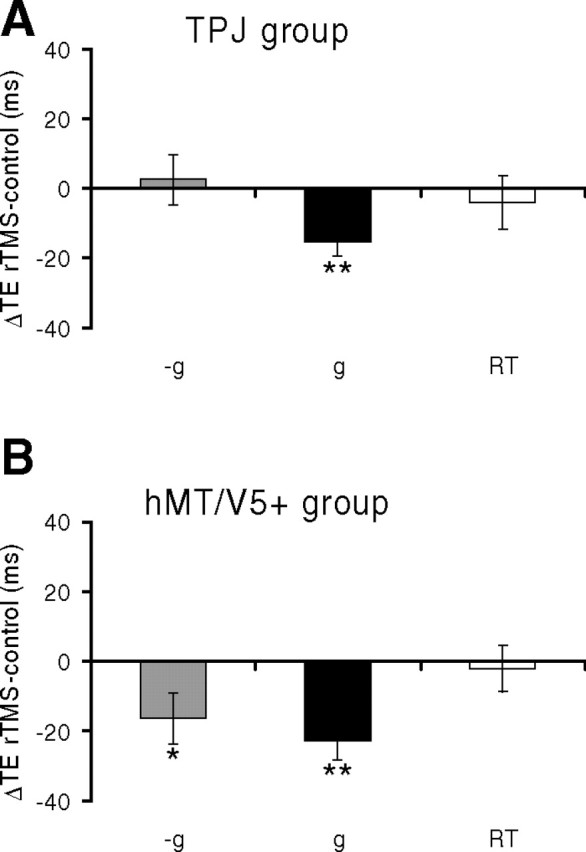
Interception of vertically moving targets (protocol 1). rTMS was applied over right TPJ (A) or hMT/V5+ (B). Bar graphs report mean differences (±SEM) of the timing errors (TE) between post-rTMS and pre-rTMS trials, pooled across all trials of all subjects. Negative (positive) values of ΔTE correspond to responses earlier (later) than the control responses. Gray: −g trials; black: g trials; white: RT trials. Statistically significant effects are indicated with asterisks: *p < 0.05; **p < 0.001 (repeated-measures ANOVA).
Table 2.
Summary table of the ANOVA results applied to protocol 1 data
| Trial type | TPJ group |
hMT/V5 + group |
||||
|---|---|---|---|---|---|---|
| ΔTE ± SEM (ms) | TMS F(1,20) | TMS × MD F(3,20) | ΔTE ± SEM (ms) | TMS F(1,20) | TMS × MD F(3,20) | |
| Between-group design | ||||||
| −g | 2.6 (7.1) | 0.11 | 0.12 | −16.3 (7.2) | 4.67* | 0.3 |
| g | −15.3 (4.1) | 12.7** | 0.36 | −22.7 (5.6) | 19.01** | 2.14 |
| RT | −4.1 (7.7) | 0.25 | 0.1 | −2.0 (6.6) | 0.13 | 2.92 |
| Within-group design | ||||||
| −g | −3.7 (7.0) | 0.27 | 0.49 | −18.3 (8.1) | 4.58* | 0.28 |
| g | −27.5 (2.9) | 80.0** | 0.44 | −25.3 (5.2) | 23.6** | 1.0 |
| RT | −9.6 (5.9) | 2.8 | 1.4 | −7.4 (5.9) | 1.7 | 1.6 |
Along with the mean ΔTEs (± SEM) computed over all trials and target motion duration (MD), we report the F ratios of the main effect of TMS and its interaction with the MD (TMS × MD), testing the overall effect of TMS on the response timing and its dependence on the MD, respectively. Statistically significant effects are indicated in bold. *p < 0.05; **p < 0.001.
When interception timing was disrupted by rTMS, the effects were in the same direction for TPJ and hMT/V5+: the motor responses occurred systematically earlier than in the control trials. Furthermore, these time shifts were approximately constant and did not depend significantly on the target motion duration (MD, see Table 2). Also, there were no significant temporal trends of the response timing as a function of repetition, either in the pre-rTMS control trials or post-rTMS trials, presumably because of the lack of performance feedback.
Within-group rTMS effects on interception trials.
The results obtained in the subjects who underwent sequential rTMS over TPJ and hMT/V5+ (separated by a recovery period) were very similar to those reported above for the between-group study (Table 2, bottom panel). Thus, rTMS on TPJ significantly affected the interception timing for g trials, but did not significantly affect interception of −g trials. Instead, rTMS on hMT/V5+ produced significant time shifts for both g and −g trials. As before, the time shifts did not depend significantly on MD also in the within-group study.
Reaction time trials.
In contrast with the timing of interceptive responses, the reaction time (RT) responses to the sudden expansion of the fixation point were not significantly affected by rTMS of the two target sites (see Fig. 4, Table 2), indicating that the effects of TMS on TPJ and hMT/V5+ were specific to the interception task.
Event-related protocols
In a second series of experiments (protocol 2 and 3), we used double-pulse TMS (dpTMS) delivered over two different time windows in separate sets of trials (see Fig. 2B). In dpTMS-100 trials, the pulses were delivered 100 and 200 ms after target motion onset. In dpTMS-300 trials, they were delivered at 300 and 400 ms. Thus, neural processing was presumably disrupted over 100–300 ms after motion onset by dpTMS-100, and over 300–500 ms by dpTMS-300 (see Materials and Methods). In protocol 2, dpTMS were applied on TPJ, hMT/V5+, or vertex of the right hemisphere in 3 different groups of subjects (between-group design) (Fig. 5, Table 3). In protocol 3, instead, dpTMS were applied on TPJ, hMT/V5+, or sham-TPJ of the left hemisphere in one group of subjects (within-group design) (Fig. 6, Table 4).
Figure 5.
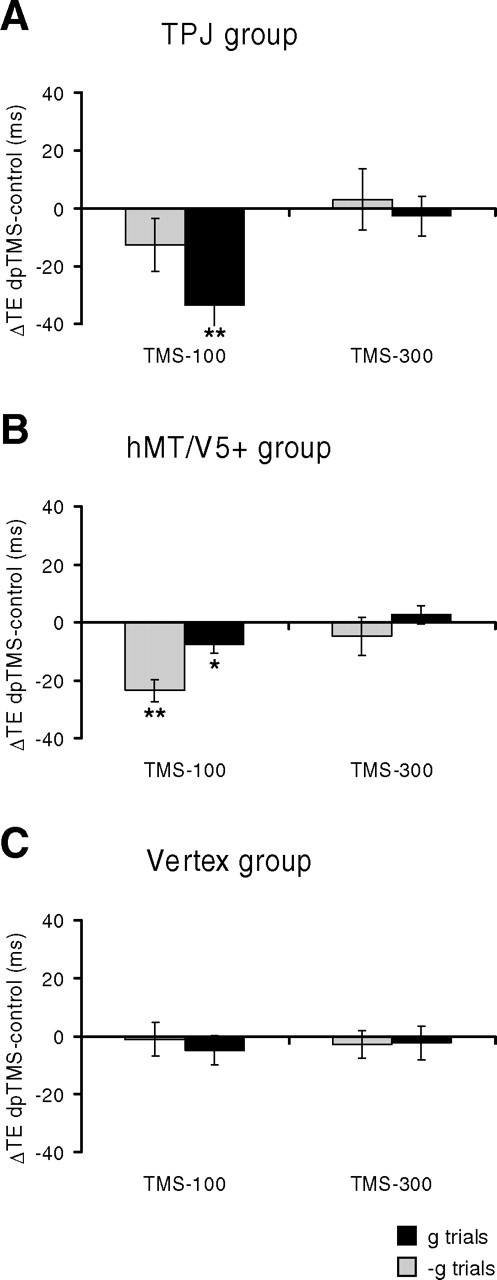
Results of protocol 2. dpTMS was applied over right TPJ (A), hMT/V5+ (B), or vertex (C). Bar graphs report mean differences (±SEM) of TE between either dpTMS-100 or dpTMS-300 trials and no-TMS control trials, pooled across all trials of all subjects. Other conventions as in Figure 4.
Table 3.
Summary table of the ANOVA applied to protocol 2 data
| Trial type | TPJ group |
hMT/V5+ group |
Vertex group |
||||||
|---|---|---|---|---|---|---|---|---|---|
| ΔTE ± SEM (ms) | TMS F(1,20) | TMS × MD F(3,20) | ΔTE ± SEM (ms) | TMS F(1,20) | TMS × MD F(3,20) | ΔTE ± SEM (ms) | TMS F(1,20) | TMS × MD F(3,20) | |
| TMS-100 | |||||||||
| −g | −12.6 (9.1) | 1.8 | 0.6 | −23.6 (3.9) | 41.7** | 2.2 | −1.1 (5.9) | 0.03 | 0.09 |
| g | −33.6 (8.9) | 15.1** | 1.6 | −7.9 (2.7) | 4.7* | 0.5 | −4.8 (5.1) | 0.93 | 1.4 |
| TMS-300 | |||||||||
| −g | 3.0 (10.6) | 0.07 | 1.7 | −4.8 (6.7) | 0.5 | 1.3 | −2.9 (4.6) | 0.28 | 0.06 |
| g | −2.7 (6.8) | 0.15 | 1.2 | 2.6 (3.1) | 0.93 | 2.9 | −2.2 (5.8) | 0.14 | 0.98 |
The parameters reported are the same as in Table 2. Statistically significant effects are indicated in bold. *p < 0.05; **p < 0.001.
Figure 6.
Results of protocol 3. dpTMS was applied over left TPJ (A) or hMT/V5+ (B), or sham-dpTMS was applied over left TPJ (C).
Table 4.
Summary table of the ANOVA applied to protocol 3 data
| Trial type | TPJ |
hMT/V5+ |
Sham TMS |
||||||
|---|---|---|---|---|---|---|---|---|---|
| ΔTE ± SEM (ms) | TMS F(1,20) | TMS × MD F(3,20) | ΔTE ± SEM (ms) | TMS F(1,20) | TMS × MD F(3,20) | ΔTE ± SEM (ms) | TMS F(1,20) | TMS × MD F(3,20) | |
| TMS-100 | |||||||||
| −g | −9.8 (6.1) | 2.6 | 1.0 | −25.0 (3.4) | 26.7** | 1.1 | 6.6 (5.2) | 2.1 | 3.0 |
| g | −19.7 (4.9) | 14.6** | 0.34 | −32.3 (4.6) | 50.1** | 0.61 | −4.9 (5.7) | 0.65 | 0.13 |
| TMS-300 | |||||||||
| −g | 0.85 (8.9) | 0.01 | 0.44 | −12.7 (7.8) | 2.6 | 0.76 | −3.4 (6.0) | 0.29 | 0.15 |
| g | −4.8 (6.9) | 0.48 | 1.1 | −5.1 (6.6) | 0.7 | 2.4 | −4.8 (3.7) | 1.8 | 1.9 |
We found that dpTMS-100 on either TPJ or hMT/V5+ altered the timing of interception in the same direction as in protocol 1, regardless of the stimulated hemisphere. In both protocols 2 and 3, dpTMS-100 on TPJ significantly affected the interception of g targets but not that of −g targets, whereas dpTMS-100 on hMT/V5+ significantly affected the interception of both g and −g targets. In particular, for area hMT/V5+, ΔTE was significantly greater for −g trials than g trials in protocol 2 (paired t test, p < 0.01), whereas there was no significant difference between these two ΔTEs in protocol 3 (paired t test, p = 0.46), as in the case of protocol 1.
When interception timing was disrupted, the motor responses tended to occur systematically earlier than in the control trials, the time shifts being independent of target speed and MD. It should be also noted that the size of the effects of dpTMS of hMT/V5+ was not significantly different in the subgroup of subjects (n = 5) for which the visual illusion of moving phosphenes was verified before the experiment with single pulses of TMS, compared with the remaining subjects (two-sample t test, p > 0.05).
In contrast, the timing of interception was not altered significantly by dpTMS-300 on TPJ and hMT/V5+, suggesting that the critical time window is within the first 300 ms of target motion. Finally we found that TMS stimulation of the vertex or sham-TMS over the TPJ site did not affect significantly the interception timing, indicating that the timing shifts we observed with TMS of TPJ and hMT/V5+ could not be accounted by nonspecific effects of TMS.
Quantitative analysis of the relationship between TMS effects and target kinematics
As we remarked at the outset, the relationship between the time shifts induced by TMS and target kinematics is critical to discriminate between alternative hypotheses about the role of TPJ and hMT/V5+ in interception timing. Thus, we performed additional quantitative analyses on the subset of data that showed significant TMS effects on motor timing to test these hypotheses more directly. First, we used regression analyses to determine whether the response time shifts (ΔTE) induced by TMS were related linearly and/or quadratically to the target motion duration (see Eq. 1 in Materials and Methods). In agreement with the results of the ANOVAs reported in Tables 2–4, we found no significant (p > 0.05) linear and/or quadratic trends of ΔTE with either target motion duration or initial speed for both g and −g trials (Fig. 7). This negative result was obtained regardless of whether the data were pooled together across all experimental protocols or they were drawn separately from each experimental protocol and TMS location. In addition, we performed the same regression analysis using all single trials data of each individual, thus taking into account the intertrial variability associated with open-loop responses, which was fairly high as the mean range of TE across subjects and control conditions was 153.9 ms and 120.1 ms for −g and g trials, respectively. As expected, we generally did not find any significant dependence of the TMS effects on target motion duration with the exception of only 4 of the 54 regressions tested.
Figure 7.
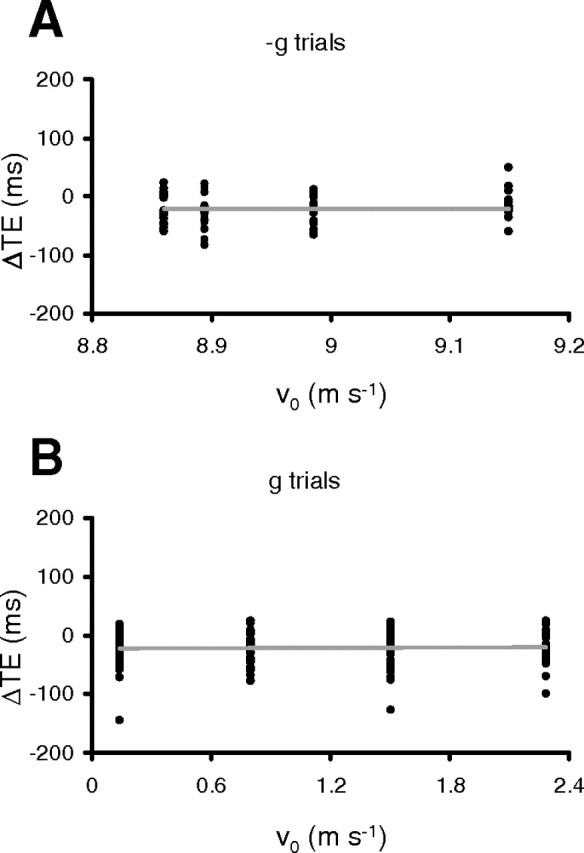
Relationships between TMS-induced time shifts (ΔTE) and initial target speed (which is uniquely related to MD for a given acceleration). Each data-point represents the mean ΔTE for a given subject, ball motion duration, and acceleration (A, −g trials; B, g trials). All experimental conditions that showed statistically significant TMS effects were considered.
Next, we analyzed the relationship between perturbed TE and unperturbed TE across all trials. If the TMS effects are independent of target kinematics, the perturbed responses should be offset relative to the unperturbed responses by a roughly constant amount, and the relationship between perturbed TE and unperturbed TE should be described by a line with unity slope and significant offset from the origin. If instead the TMS effects are dependent on target kinematics, the slope of the linear regression should be significantly different from unity or the relationship should be nonlinear. We found that the first scenario best describes our data (Fig. 8). The data are well fitted by a regression line with slope not significantly different from unity (p = 0.51) and intercept significantly offset from the origin (p < 10−3). The intercept corresponds to the mean ΔTE (−21.18 ms) across all data. The regression parameters computed separately for g trials were not significantly different (p > 0.65, two sample t test) from those for −g trials (slope = 1.035 and 1.008, intercept = −21.32 and −21.02 ms for g and −g trials, respectively). Moreover, the regression parameters computed separately for the shortest MD were not significantly different (p > 0.48, two sample t test) from those for the longest MD (slope: 1.05 and 1.005, intercept: −16.8 and −20.8 ms for MD = 700 ms and MD = 890 ms, respectively). Thus, the regression analysis confirmed the result that the time shifts induced by TMS were independent of target kinematics.
Figure 8.

Timing errors (TE) in TMS trials vs timing errors in control trials. Each point is the mean value (across all repetitions) of TE for a given subject, motion duration, trial type (g or −g), and protocol. Data (n = 216) correspond to all g trials with TMS on TPJ, all g and −g trials with TMS on hMT/V5+. Identity line (perturbed TE = control TE) and least-squares regression line across all data are plotted as thin and thick lines, respectively. Regression parameters are indicated in the inset.
Finally, we compared the experimental responses TM (time of occurrence of the button press relative to the time of target motion onset) with the responses TM* predicted by threshold-based interception models (see Numerical simulations in Materials and Methods). These models are obviously limited in so far as they neglect possible nonlinearities and cross talks. Nevertheless, also the modeling results were consistent with the ANOVA and regression analyses. We found that TM values for both the control and TMS trials were predicted accurately by using the internal gravity model for g trials and the tau model for −g trials: mean RMSE was 15 ms (± 3 ms SD) and 14 ms (± 2 ms) in the control and TMS trials, respectively (corresponding to <2% of TM values). In this approach, the speed distortion factor (sv) was set to 1 corresponding to no speed distortion, whereas the value of internal delay (μ) was best-fitted. Best-fitting μ for TMS trials was significantly (p < 10−3) lower than that for control trials: μ was 114 ± 17 ms (mean ± SD) and 136 ± 26 ms for TMS and control trials, respectively. The mean Δμ value (−22 ms) between TMS and control trials closely matched the mean time shift ΔTE (−21 ms) found experimentally. Moreover, the mean Δμ value for g trials was not significantly different (p = 0.21) from the corresponding value for −g trials. In contrast, best-fitting the TMS data with a variable sv and a constant μ (the same as in the control) yielded sv values for g trials significantly different (p < 10−3) from those for −g trials, and more importantly the responses TM* predicted by this model depended significantly (p < 10−3) on MD, in contrast with the lack of such dependency for the experimental responses TM. These results are consistent with the hypothesis that TMS of TPJ and hMT/V5+ affected the interception responses of the present experiments mainly by altering internal time delays.
Interception of horizontally moving targets
The preferential effect of TMS of TPJ on the interception of g targets is consistent with the hypothesis that TPJ activity is specialized for visual gravitational motion (Indovina et al., 2005; Miller et al., 2008). However, in the experiments presented so far, the apparent effect of gravity was associated invariably with an accelerated motion of the target. Therefore, TPJ activity might reflect either gravitational motion or accelerated motion. To address this potential confound, we tested 6 subjects (who had previously participated in the vertical motion paradigms) in the interception of a motorcycle traveling along a horizontal road with the same constant acceleration or deceleration as that of the vertically moving ball.
Unperturbed interception
The pattern of the responses recorded in the control trials was different from that of the control trials recorded for the interception of vertically moving targets. The responses to horizontal targets tended to be late relative to target arrival time (recall that the responses to vertical targets tended to be early). Moreover, the mean TE for accelerated targets was not significantly different from that for decelerated targets (p = 0.072, two-sample t test over all subjects and the control conditions of the two experimental sessions). Mean TE was 40.87 ms (± 2.4 SEM) for accelerated trials, and 51.04 ms (± 4.98 SEM) for decelerated trials. TE for accelerated and decelerated trials showed, however, different trends with respect to the target motion duration (MD), because TE for accelerated trials was independent of MD (F(3,44) = 0.732; p = 0.538), whereas TE for decelerated trials depended significantly on MD (F(3,44) = 8.501; p < 10−3).
Effects of rTMS
The effect of stimulating TPJ was very different from that of stimulating hMT/V5+ in the case of horizontal targets. rTMS of TPJ did not affect significantly the interception timing of either accelerated or decelerated targets (Fig. 9, Table 5). Instead, rTMS of hMT/V5+ altered significantly the response timing for both accelerated and decelerated targets, by inducing earlier responses compared with control responses, similarly to what we reported for the interception of vertical targets. The time shifts determined by TMS were not statistically different between the accelerated and decelerated trials (paired t test, p = 0.92). Furthermore, the time shifts did not depend significantly on the target motion duration.
Figure 9.
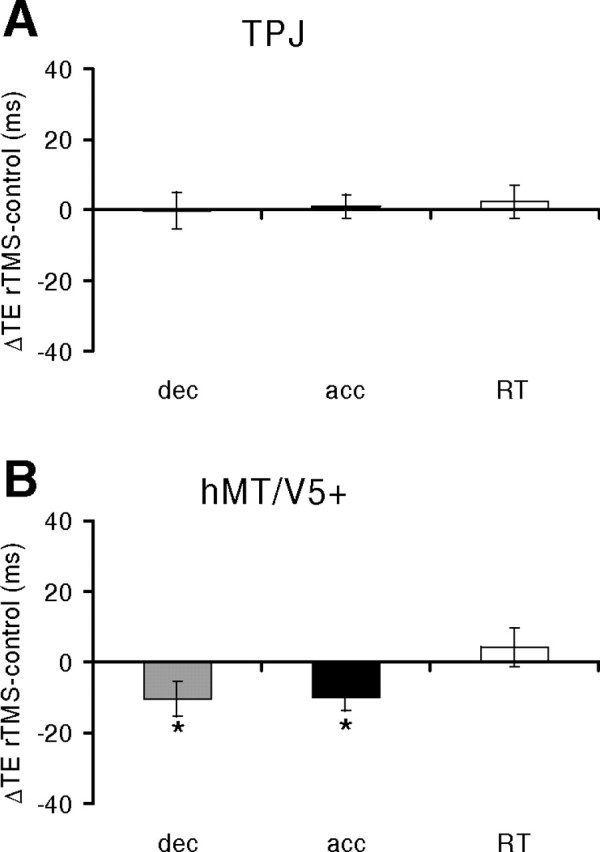
Interception of horizontally moving targets (protocol 4). rTMS was applied over right TPJ (A) or hMT/V5+ (B). Same format as in Figure 4. Gray: Decelerated trials; black: accelerated trials; white: RT trials. *p < 0.05 (repeated-measures ANOVA).
Table 5.
Summary table of the ANOVA applied to protocol 4 data (horizontally moving targets)
| Trial type | TPJ |
hMT/V5+ |
||||
|---|---|---|---|---|---|---|
| ΔTE ± SEM (ms) | TMS F(1,20) | TMS × MD F(3,20) | ΔTE ± SEM (ms) | TMS F(1,20) | TMS × MD F(3,20) | |
| Decelerated | −0.2 (5.1) | 0.002 | 1.2 | −10.3 (5.1) | 4.7* | 2.2 |
| Accelerated | 1.1 (3.3) | 0.1 | 0.5 | −9.8 (3.8) | 6.1* | 0.6 |
| RT | 2.2 (4.6) | 0.2 | 2.2 | 4.2 (5.4) | 0.5 | 0.06 |
The results with horizontal motion, together with those with vertical motion, suggest that TMS over TPJ affects preferentially the interception of gravitational motion, whereas TMS over hMT/V5+ affects the interception of moving targets regardless of the acceleration (positive or negative) and the direction of motion (vertical or horizontal).
Effects of TMS on motor variability
It has been suggested that, in some conditions, TMS may introduce noise in neural activity at the targeted site (Mochizuki et al., 2005). In theory, neural noise might lead to increased variability of the motor responses. Thus, for each experimental protocol and target acceleration, we compared the distributions of SDs of TE (computed separately for each subject and MD), in control and TMS conditions. We found that TMS did not affect significantly the variability of the interception responses, except in 2 out of 32 tested cases. Response variability was significantly increased (Wilcoxon signed-rank test, p < 0.05) in one case (g trials of dpTMS-100 of the right TPJ, protocol 2), whereas it was significantly decreased in the other one (−g trials after 1 Hz rTMS of the right TPJ, protocol 1).
Discussion
To correlate motor response time with target kinematics, we used a wide range of target motion parameters resulting in a wide range of response times. We found that, when TMS disrupted motor timing, it anticipated the responses by an amount independent of target kinematics. TMS effects were specific to the interception task, because reaction-time responses were not significantly affected. We interpret our results as consistent with the hypothesis that neural activity in hMT/V5+ and TPJ can feed downstream regions not only with visual-motion information, but also with internal timing signals used for interception at destination.
Although the effects on motor timing were in the same direction regardless of whether hMT/V5+ or TPJ was targeted, these regions showed different selectivity for the type of target motion: TMS of hMT/V5+ affected interception of all tested motion types, whereas TMS of TPJ affected only interception of motion coherent with natural gravity. This finding is consistent with the previous hypothesis that TPJ activity is specialized for visual gravitational motion (Indovina et al., 2005; Miller et al., 2008). TPJ might gate visual-motion information according to its congruence with an internal model of the visual effects of gravity (Zago et al., 2004).
Consistent with monkey electrophysiology (see Born and Bradley, 2005) and human neuroimaging (see Orban et al., 2003), several TMS studies (Beckers and Zeki, 1995; Anand et al., 1998; Walsh et al., 1998; Hotson and Anand, 1999; Silvanto et al., 2005; Sack et al., 2006; Laycock et al., 2007) have shown that hMT/V5+ plays a key role in visual-motion processing. TMS of this region also affects visuomotor coordination: it reduces the spatial accuracy of reaching to stationary objects after adaptation to background motion (Whitney et al., 2007), and the movement speed to catch horizontally moving targets (Schenk et al., 2005). This latter study used a rather different task from ours, but it also revealed a (statistically nonsignificant) reduction of movement latency that qualitatively goes in the same direction as our time shifts.
It is quite possible that TMS affected visual-motion processing in the present experiments, but these effects were presumably obscured in our behavioral measures by those on motor timing. Indeed, target speed is underestimated after TMS of hMT/V5+ in speed discrimination tasks (Matthews et al., 2001; McKeefry et al., 2008), or lesions of hMT/V5+ (Barton et al., 1996) and monkey MT in eye-tracking tasks (Newsome et al., 1985). Disruption of interception timing primarily because of underestimates of target speed predicts that perturbed responses occurred later than unperturbed ones, the opposite of what we found. More critically, if TMS affected interception mainly by altering visual estimates of target motion, perturbed responses should be time shifted relative to control responses by an amount dependent on target kinematics, again the opposite of what we found. Further evidence that effects on visual-motion processing were not the main cause of the observed time shifts is provided by the observation that very similar results were obtained with rTMS and with dpTMS applied 100–200 ms after target motion onset, but no significant effect was found with dpTMS applied 300–400 ms after motion onset. This last time window corresponds to 300–590 ms before target arrival (depending on the specific motion duration), when visual information for timing interception is most critical as revealed by visual-occlusion experiments (Sharp and Whiting, 1975; Benguigui et al., 2003; Teixeira et al., 2006). Visual motion can also affect perceptual estimates of time durations in several ways (Burr et al., 2007). Thus local adaptation of the visual field by fast-moving stimuli selectively reduces the apparent duration for stimuli presented to that position (Johnston et al., 2006). Moreover apparent duration of visual stimuli increases with increasing speed (Kanai et al., 2006). Although these observations would predict a correlation between the time shifts of the motor responses and target speed which we did not observe, nevertheless they are relevant to the present findings, in so far as they point to a link between visual motion and time estimates.
We were able to simulate TMS effects on interception timing by means of appropriate decrements of a delay parameter (μ), which may reflect internal delays in relaying visual information to downstream regions, as well as motor command execution time. Best-fitting μ was 136 and 114 ms in control and TMS-perturbed trials, respectively. After we account for the neuromechanical delay between motor cortex activation and button-press response (∼75 ms, see Materials and Methods), we estimate the additional processing time to be ∼40–60 ms, compatible with processing delays between visual-motion regions and motor cortex in target tracking or interception (Kruse et al., 2002; Merchant et al., 2004; Senot et al., 2008).
Although a motor decision is translated into a timed interceptive response only within the last 100–200 ms of target motion (Benguigui et al., 2003; Zago et al., 2004), the value of processing time might be preset much earlier at cortical level. This possibility is suggested by the finding that dpTMS affected interception timing when applied 100–200 ms after target motion onset, corresponding to 500–790 ms before interception time. Accordingly, some visual and motor events might be processed in parallel. In particular, preparation of timing of the motor response might overlap with visual-motion analysis and TTC estimates. This agrees with observations by Merchant et al. (2004) who showed activity related to motor timing in both area 7a and primary motor cortex over time windows overlapping those of visual-motion processing in the same areas.
We do not know whether the TMS-induced time shifts mimic a physiological mechanism. However, it has been found that subjects learn to intercept novel types of vertical target by shortening or lengthening the processing time, the direction of change depending on the task (Zago et al., 2004, 2005; Senot et al., 2005; Zago and Lacquaniti, 2005a,b; Miller et al., 2008). Also, interception timing of targets accelerating along the horizontal improves after subjects learn to compensate for a force field acting in the same direction on the hand, demonstrating a tight interconnection between motor learning and visual-motion processing (Brown et al., 2007). Therefore, neural modulation of processing time can allow adaptive control of motor timing, compensating for erroneous TTC estimates caused by inaccurate or novel visual information, or compensating for changes in the effector dynamics as a result of fatigue, added inertia, or friction.
Neural estimates of TTC depend on the combination of target position and motion information (Port et al., 1997; Zago et al., 2004). Motion and positional information may first interact in hMT/V5+: TMS of hMT/V5+ (but not V1) reduces the shifts in the perceived position of stationary objects induced by drifting objects (McGraw et al., 2004). Interestingly, these shifts have been interpreted as indicative of neural compensation of delays in relaying visual motion information (De Valois and De Valois, 1991). Time shifts induced by TMS in the present experiments also might reflect neural compensation of visual delays (Nijhawan, 2008). Internal time signals may arise directly in visual-motion regions through the modulation of local horizontal connections, resulting in trailing inhibition left behind by the moving object (Ferrera and Barborica, 2006; Sundberg et al., 2006).
Electrical microstimulation of monkey MT has been shown to instruct learning of smooth-pursuit eye movements in a way that mimics learning induced by real visual motion (Carey et al., 2005). Moreover, it has been suggested that predictions about future positions of a moving object are compared with visual feedback, and the difference can speed or slow perceived time to match the physics of the sensory feedback (Eagleman et al., 2005). Indeed, TMS of hMT/V5+ and posterior parietal cortex has recently been shown to interfere with discrimination of the duration of visual targets (Bueti et al., 2008). Although our subjects never reported abnormal perception associated with TMS during the experiments, they might have internally sensed their responses as systematically late leading them to decrease μ by an approximately constant amount to compensate. Because performance feedback was not provided, motor responses could not be adapted to the TMS perturbations.
Neural mechanisms for timing interceptive/avoidance behaviors have been investigated in different animal species (Sun and Frost, 1998; Rind and Simmons, 1999; Gabbiani et al., 2002; Maimon and Assad, 2006; Merchant and Georgopoulos, 2006; Preuss et al., 2006). In monkeys, MT/MST feed visual information into posterior parietal cortex regions, such as area 7a and LIP, which contain neurons with ramping activities whose slopes tightly correlate with motor response timing (Merchant et al., 2004; Maimon and Assad, 2006). The slope of such ramps is probably shaped by spatiotemporal integration of excitatory and inhibitory inputs related to visual-motion and motor intention signals. We conjecture that the processing time reflects the slope of such ramps and that hMT/V5+ and TPJ exert inhibitory control on this slope. Thus, the finding that TMS elicited earlier motor responses than in the control could be attributable to disinhibitory effects produced by the virtual lesions of the two sites (Thut et al., 2005). Population activity in these regions might contribute signals that are readout in downstream regions (PPC and frontal motor areas) to construct motor timing decisions (Cook and Maunsell, 2002; Maimon and Assad, 2006; Merchant and Georgopoulos, 2006; Gold and Shadlen, 2007). However, Maimon and Assad (2006) found evidence for internal motor trigger signals in LIP but not in MT/MST in a proactive task that required reversing the motion of a target at a freely chosen time within an assigned time window. Thus, our hypothesis applies to interception of moving targets at destination, but not necessarily to less constrained interceptions.
In conclusion, this study suggests that signals related to the timing of motor responses to visual-motion stimuli may start to be elaborated at earlier cortical stages than previously thought. It may make sense that visual-motion areas contribute internal timing signals, because these same areas encode critical sensory information on which motor trigger decision is partly based.
Footnotes
This work was supported by grants from the Italian Ministry of University and Research (Progetti di Ricerca di Interesse Nazionale grant), the Italian Space Agency (Disorders of Motor and Cardiorespiratory Control grant), and the Italian Ministry of Health (Ricerca Corrente grant). We thank Dr. Vincenzo Maffei for providing software to generate the visual stimuli and suggestions with data modeling, and Dr. Emiliano Macaluso and the Neuroimaging Laboratory of Santa Lucia Foundation for the use of the MRI scanner.
References
- Anand S, Olson JD, Hotson JR. Tracing the timing of human analysis of motion and chromatic signals from occipital to temporo-parieto-occipital cortex: a transcranial magnetic stimulation study. Vision Res. 1998;38:2619–2627. doi: 10.1016/s0042-6989(98)00025-x. [DOI] [PubMed] [Google Scholar]
- Barton JJ, Sharpe JA, Raymond JE. Directional defects in pursuit and motion perception in humans with unilateral cerebral lesions. Brain. 1996;119:1535–1550. doi: 10.1093/brain/119.5.1535. [DOI] [PubMed] [Google Scholar]
- Beckers G, Zeki S. The consequences of inactivating areas V1 and V5 on visual motion perception. Brain. 1995;118:49–60. doi: 10.1093/brain/118.1.49. [DOI] [PubMed] [Google Scholar]
- Benguigui N, Ripoll H, Broderick MP. Time-to-contact estimation of accelerated stimuli is based on first-order information. J Exp Psychol Hum Percept Perform. 2003;29:1083–1101. doi: 10.1037/0096-1523.29.6.1083. [DOI] [PubMed] [Google Scholar]
- Born RT, Bradley DC. Structure and function of visual area MT. Annu Rev Neurosci. 2005;28:157–189. doi: 10.1146/annurev.neuro.26.041002.131052. [DOI] [PubMed] [Google Scholar]
- Brown LE, Wilson ET, Goodale MA, Gribble PL. Motor force field learning influences visual processing of target motion. J Neurosci. 2007;27:9975–9983. doi: 10.1523/JNEUROSCI.1245-07.2007. [DOI] [PMC free article] [PubMed] [Google Scholar]
- Bueti D, Bahrami B, Walsh V. Sensory and association cortex in time perception. J Cogn Neurosci. 2008;20:1054–1062. doi: 10.1162/jocn.2008.20060. [DOI] [PubMed] [Google Scholar]
- Burr D, Tozzi A, Morrone MC. Neural mechanisms for timing visual events are spatially selective in real-world coordinates. Nat Neurosci. 2007;10:423–425. doi: 10.1038/nn1874. [DOI] [PubMed] [Google Scholar]
- Carey MR, Medina JF, Lisberger SG. Instructive signals for motor learning from visual cortical area MT. Nat Neurosci. 2005;8:813–819. doi: 10.1038/nn1470. [DOI] [PMC free article] [PubMed] [Google Scholar]
- Cook EP, Maunsell JH. Dynamics of neuronal responses in macaque MT and VIP during motion detection. Nat Neurosci. 2002;5:985–994. doi: 10.1038/nn924. [DOI] [PubMed] [Google Scholar]
- De Valois RL, De Valois KK. Vernier acuity with stationary moving Gabors. Vision Res. 1991;31:1619–1626. doi: 10.1016/0042-6989(91)90138-u. [DOI] [PubMed] [Google Scholar]
- Eagleman DM, Tse PU, Buonomano D, Janssen P, Nobre AC, Holcombe AO. Time and the brain: how subjective time relates to neural time. J Neurosci. 2005;25:10369–10371. doi: 10.1523/JNEUROSCI.3487-05.2005. [DOI] [PMC free article] [PubMed] [Google Scholar]
- Ferrera VP, Barborica A. A flashing line can warp your mind. Neuron. 2006;49:327–329. doi: 10.1016/j.neuron.2006.01.012. [DOI] [PubMed] [Google Scholar]
- Gabbiani F, Krapp HG, Koch C, Laurent G. Multiplicative computation in a visual neuron sensitive to looming. Nature. 2002;420:320–324. doi: 10.1038/nature01190. [DOI] [PubMed] [Google Scholar]
- Gold JI, Shadlen MN. The neural basis of decision making. Annu Rev Neurosci. 2007;30:535–574. doi: 10.1146/annurev.neuro.29.051605.113038. [DOI] [PubMed] [Google Scholar]
- Hallett M. Transcranial magnetic stimulation and the human brain. Nature. 2000;406:147–150. doi: 10.1038/35018000. [DOI] [PubMed] [Google Scholar]
- Hotson JR, Anand S. The selectivity and timing of motion processing in human temporo-parieto-occipital and occipital cortex: a transcranial magnetic stimulation study. Neuropsychologia. 1999;37:169–179. doi: 10.1016/s0028-3932(98)00091-8. [DOI] [PubMed] [Google Scholar]
- Indovina I, Maffei V, Bosco G, Zago M, Macaluso E, Lacquaniti F. Representation of visual gravitational motion in the human vestibular cortex. Science. 2005;308:416–419. doi: 10.1126/science.1107961. [DOI] [PubMed] [Google Scholar]
- Johnston A, Arnold DH, Nishida S. Spatially localized distortions of event time. Curr Biol. 2006;16:472–479. doi: 10.1016/j.cub.2006.01.032. [DOI] [PubMed] [Google Scholar]
- Kanai R, Paffen CL, Hogendoorn H, Verstraten FA. Time dilation in dynamic visual display. J Vis. 2006;6:1421–1430. doi: 10.1167/6.12.8. [DOI] [PubMed] [Google Scholar]
- Kruse W, Dannenberg S, Kleiser R, Hoffmann KP. Temporal relation of population activity in visual areas MT/MST and in primary motor cortex during visually guided tracking movements. Cereb Cortex. 2002;12:466–476. doi: 10.1093/cercor/12.5.466. [DOI] [PubMed] [Google Scholar]
- Laycock R, Crewther DP, Fitzgerald PB, Crewther SG. Evidence for fast signals and later processing in human V1/V2 and V5/MT+: a TMS study of motion perception. J Neurophysiol. 2007;98:1253–1262. doi: 10.1152/jn.00416.2007. [DOI] [PubMed] [Google Scholar]
- Lee DN, Young DS, Reddish PE, Lough S, Clayton TM. Visual timing in hitting an accelerating ball. Q J Exp Psychol A. 1983;35:333–346. doi: 10.1080/14640748308402138. [DOI] [PubMed] [Google Scholar]
- Maimon G, Assad JA. A cognitive signal for the proactive timing of action in macaque LIP. Nat Neurosci. 2006;9:948–955. doi: 10.1038/nn1716. [DOI] [PubMed] [Google Scholar]
- Matthews N, Luber B, Qian N, Lisanby SH. Transcranial magnetic stimulation differentially affects speed and direction judgments. Exp Brain Res. 2001;140:397–406. doi: 10.1007/s002210100837. [DOI] [PubMed] [Google Scholar]
- McGraw PV, Walsh V, Barrett BT. Motion-sensitive neurones in V5/MT modulate perceived spatial position. Curr Biol. 2004;14:1090–1093. doi: 10.1016/j.cub.2004.06.028. [DOI] [PubMed] [Google Scholar]
- McIntyre J, Zago M, Berthoz A, Lacquaniti F. Does the brain model Newton's laws? Nat Neurosci. 2001;4:693–694. doi: 10.1038/89477. [DOI] [PubMed] [Google Scholar]
- McIntyre J, Senot P, Prévost P, Zago M, Lacquaniti F, Berthoz A. The use of on-line perceptual invariants versus cognitive internal models for the predictive control of movement and action. the First IEEE EMBS Conference on Neural Engineering; March; Capri, Italy. 2003. Paper presented at. [Google Scholar]
- McKeefry DJ, Burton MP, Vakrou C, Barrett BT, Morland AB. Induced deficits in speed perception by transcranial magnetic stimulation of human cortical areas V5/MT+ and V3A. J Neurosci. 2008;28:6848–6857. doi: 10.1523/JNEUROSCI.1287-08.2008. [DOI] [PMC free article] [PubMed] [Google Scholar]
- Merchant H, Georgopoulos AP. Neurophysiology of perceptual and motor aspects of interception. J Neurophysiol. 2006;95:1–13. doi: 10.1152/jn.00422.2005. [DOI] [PubMed] [Google Scholar]
- Merchant H, Battaglia-Mayer A, Georgopoulos AP. Neural responses during interception of real and apparent circularly moving stimuli in motor cortex and area 7a. Cereb Cortex. 2004;14:314–331. doi: 10.1093/cercor/bhg130. [DOI] [PubMed] [Google Scholar]
- Miller WL, Maffei V, Bosco G, Iosa M, Zago M, Macaluso E, Lacquaniti F. Vestibular nuclei and cerebellum put visual gravitational motion in context. J Neurophysiol. 2008;99:1969–1982. doi: 10.1152/jn.00889.2007. [DOI] [PubMed] [Google Scholar]
- Mochizuki H, Franca M, Huang YZ, Rothwell JC. The role of dorsal premotor area in reaction task: comparing the “virtual lesion” effect of paired pulse or theta burst transcranial magnetic stimulation. Exp Brain Res. 2005;167:414–421. doi: 10.1007/s00221-005-0047-5. [DOI] [PubMed] [Google Scholar]
- Newsome WT, Wurtz RH, Dürsteler MR, Mikami A. Deficits in visual motion processing following ibotenic acid lesions of the middle temporal visual area of the macaque monkey. J Neurosci. 1985;5:825–840. doi: 10.1523/JNEUROSCI.05-03-00825.1985. [DOI] [PMC free article] [PubMed] [Google Scholar]
- Nijhawan R. Visual prediction: psychophysics and neurophysiology of compensation for time delays. Behav Brain Sci. 2008;31:179–198. doi: 10.1017/S0140525X08003804. discussion 198–239. [DOI] [PubMed] [Google Scholar]
- Oldfield RC. The assessment and analysis of handedness: the Edinburgh inventory. Neuropsychologia. 1971;9:97–113. doi: 10.1016/0028-3932(71)90067-4. [DOI] [PubMed] [Google Scholar]
- Orban GA, Fize D, Peuskens H, Denys K, Nelissen K, Sunaert S, Todd J, Vanduffel W. Similarities and differences in motion processing between the human and macaque brain: evidence from fMRI. Neuropsychologia. 2003;41:1757–1768. doi: 10.1016/s0028-3932(03)00177-5. [DOI] [PubMed] [Google Scholar]
- Orban GA, Van Essen D, Vanduffel W. Comparative mapping of higher visual areas in monkeys and humans. Trends Cogn Sci. 2004;8:315–324. doi: 10.1016/j.tics.2004.05.009. [DOI] [PubMed] [Google Scholar]
- Pascual-Leone A, Valls-Solé J, Wassermann EM, Brasil-Neto J, Cohen LG, Hallett M. Effects of focal transcranial magnetic stimulation on simple reaction time to acoustic, visual and somatosensory stimuli. Brain. 1992;115:1045–1059. doi: 10.1093/brain/115.4.1045. [DOI] [PubMed] [Google Scholar]
- Pascual-Leone A, Walsh V, Rothwell J. Transcranial magnetic stimulation in cognitive neuroscience—virtual lesion, chronometry, and functional connectivity. Curr Opin Neurobiol. 2000;10:232–237. doi: 10.1016/s0959-4388(00)00081-7. [DOI] [PubMed] [Google Scholar]
- Port NL, Lee D, Dassonville P, Georgopoulos AP. Manual interception of moving targets. I. Performance and movement initiation. Exp Brain Res. 1997;116:406–420. doi: 10.1007/pl00005769. [DOI] [PubMed] [Google Scholar]
- Port NL, Kruse W, Lee D, Georgopoulos AP. Motor cortical activity during interception of moving targets. J Cogn Neurosci. 2001;13:306–318. doi: 10.1162/08989290151137368. [DOI] [PubMed] [Google Scholar]
- Preuss T, Osei-Bonsu PE, Weiss SA, Wang C, Faber DS. Neural representation of object approach in a decision-making motor circuit. J Neurosci. 2006;26:3454–3464. doi: 10.1523/JNEUROSCI.5259-05.2006. [DOI] [PMC free article] [PubMed] [Google Scholar]
- Rind FC, Simmons PJ. Seeing what is coming: building collision-sensitive neurones. Trends Neurosci. 1999;22:215–220. doi: 10.1016/s0166-2236(98)01332-0. [DOI] [PubMed] [Google Scholar]
- Robertson EM, Théoret H, Pascual-Leone A. Studies in cognition: the problems solved and created by transcranial magnetic stimulation. J Cogn Neurosci. 2003;15:948–960. doi: 10.1162/089892903770007344. [DOI] [PubMed] [Google Scholar]
- Sack AT, Kohler A, Linden DE, Goebel R, Muckli L. The temporal characteristics of motion processing in hMT/V5+: combining fMRI and neuronavigated TMS. Neuroimage. 2006;29:1326–1335. doi: 10.1016/j.neuroimage.2005.08.027. [DOI] [PubMed] [Google Scholar]
- Salenius S, Portin K, Kajola M, Salmelin R, Hari R. Cortical control of human motoneuron firing during isometric contraction. J Neurophysiol. 1997;77:3401–3405. doi: 10.1152/jn.1997.77.6.3401. [DOI] [PubMed] [Google Scholar]
- Schenk T, Mai N, Ditterich J, Zihl J. Can a motion-blind patient reach for moving objects? Eur J Neurosci. 2000;12:3351–3360. doi: 10.1046/j.1460-9568.2000.00194.x. [DOI] [PubMed] [Google Scholar]
- Schenk T, Ellison A, Rice N, Milner AD. The role of V5/MT+ in the control of catching movements: an rTMS study. Neuropsychologia. 2005;43:189–198. doi: 10.1016/j.neuropsychologia.2004.11.006. [DOI] [PubMed] [Google Scholar]
- Senot P, Zago M, Lacquaniti F, McIntyre J. Anticipating the effects of gravity when intercepting moving objects: differentiating up and down based on nonvisual cues. J Neurophysiol. 2005;94:4471–4480. doi: 10.1152/jn.00527.2005. [DOI] [PubMed] [Google Scholar]
- Senot P, Baillet S, Renault B, Berthoz A. Cortical dynamics of anticipatory mechanisms in interception: a neuromagnetic study. J Cogn Neurosci. 2008;20:1827–1838. doi: 10.1162/jocn.2008.20129. [DOI] [PubMed] [Google Scholar]
- Sharp RH, Whiting HTA. Information-processing and eye movement behaviour in a ball catching skill. J Hum Mov Stud. 1975;1:124–131. [Google Scholar]
- Siebner HR, Rothwell J. Transcranial magnetic stimulation: new insights into representational cortical plasticity. Exp Brain Res. 2003;148:1–16. doi: 10.1007/s00221-002-1234-2. [DOI] [PubMed] [Google Scholar]
- Silvanto J, Lavie N, Walsh V. Double dissociation of V1 and V5/MT activity in visual awareness. Cereb Cortex. 2005;15:1736–1741. doi: 10.1093/cercor/bhi050. [DOI] [PubMed] [Google Scholar]
- Sun H, Frost BJ. Computation of different optical variables of looming objects in pigeon nucleus rotundus neurons. Nat Neurosci. 1998;1:296–303. doi: 10.1038/1110. [DOI] [PubMed] [Google Scholar]
- Sundberg KA, Fallah M, Reynolds JH. A motion-dependent distortion of retinotopy in area V4. Neuron. 2006;49:447–457. doi: 10.1016/j.neuron.2005.12.023. [DOI] [PubMed] [Google Scholar]
- Teichner WH, Krebs MJ. Laws of the simple visual reaction time. Psychol Rev. 1972;79:344–358. doi: 10.1037/h0032946. [DOI] [PubMed] [Google Scholar]
- Teixeira LA, Chua R, Nagelkerke P, Franks IM. Use of visual information in the correction of interceptive actions. Exp Brain Res. 2006;175:758–763. doi: 10.1007/s00221-006-0740-z. [DOI] [PubMed] [Google Scholar]
- Terao Y, Ugawa Y, Suzuki M, Sakai K, Hanajima R, Gemba-Shimizu K, Kanazawa I. Shortening of simple reaction time by peripheral electrical and submotor-threshold magnetic cortical stimulation. Exp Brain Res. 1997;115:541–545. doi: 10.1007/pl00005724. [DOI] [PubMed] [Google Scholar]
- Tresilian JR, Plooy AM. Effects of acoustic startle stimuli on interceptive action. Neuroscience. 2006;142:579–594. doi: 10.1016/j.neuroscience.2006.06.029. [DOI] [PubMed] [Google Scholar]
- Thut G, Nietzel A, Pascual-Leone A. Dorsal posterior parietal rTMS affects voluntary orienting of visuospatial attention. Cereb Cortex. 2005;15:628–638. doi: 10.1093/cercor/bhh164. [DOI] [PubMed] [Google Scholar]
- Tootell RB, Taylor JB. Anatomical evidence for MT and additional cortical visual areas in humans. Cereb Cortex. 1995;5:39–55. doi: 10.1093/cercor/5.1.39. [DOI] [PubMed] [Google Scholar]
- Van Essen DC. Organization of visual areas in macaque and human cerebral cortex. In: Chalupa L, Werner JS, editors. The visual neurosciences. Cambridge, MA: MIT; 2003. pp. 507–521. [Google Scholar]
- Van Essen DC. A Population-Average, Landmark- and Surface-based (PALS) atlas of human cerebral cortex. Neuroimage. 2005;28:635–662. doi: 10.1016/j.neuroimage.2005.06.058. [DOI] [PubMed] [Google Scholar]
- Walsh V, Cowey A. Transcranial magnetic stimulation and cognitive neuroscience. Nat Rev Neurosci. 2000;1:73–79. doi: 10.1038/35036239. [DOI] [PubMed] [Google Scholar]
- Walsh V, Ellison A, Battelli L, Cowey A. Task-specific impairments and enhancements induced by magnetic stimulation of human visual area V5. Proc Biol Sci. 1998;265:537–543. doi: 10.1098/rspb.1998.0328. [DOI] [PMC free article] [PubMed] [Google Scholar]
- Wassermann EM. Risk and safety of repetitive transcranial magnetic stimulation: report and suggested guidelines from the International Workshop on the Safety of Repetitive Transcranial Magnetic Stimulation, June 5–7, 1996. Electroencephalogr Clin Neurophysiol. 1998;108:1–16. doi: 10.1016/s0168-5597(97)00096-8. [DOI] [PubMed] [Google Scholar]
- Watson JD, Myers R, Frackowiak RS, Hajnal JV, Woods RP, Mazziotta JC, Shipp S, Zeki S. Area V5 of the human brain: evidence from a combined study using positron emission tomography and magnetic resonance imaging. Cereb Cortex. 1993;3:79–94. doi: 10.1093/cercor/3.2.79. [DOI] [PubMed] [Google Scholar]
- Weiss Y, Simoncelli EP, Adelson EH. Motion illusions as optimal percepts. Nat Neurosci. 2002;5:598–604. doi: 10.1038/nn0602-858. [DOI] [PubMed] [Google Scholar]
- Welford AT. Reaction time, speed of performance, and age. Ann N Y Acad Sci. 1988;515:1–17. doi: 10.1111/j.1749-6632.1988.tb32958.x. [DOI] [PubMed] [Google Scholar]
- Whitney D, Ellison A, Rice NJ, Arnold D, Goodale M, Walsh V, Milner D. Visually guided reaching depends on motion area MT+ Cereb Cortex. 2007;17:2644–2649. doi: 10.1093/cercor/bhl172. [DOI] [PMC free article] [PubMed] [Google Scholar]
- Zago M, Lacquaniti F. Internal model of gravity for hand interception: parametric adaptation to zero-gravity visual targets on Earth. J Neurophysiol. 2005a;94:1346–1357. doi: 10.1152/jn.00215.2005. [DOI] [PubMed] [Google Scholar]
- Zago M, Lacquaniti F. Cognitive, perceptual and action-oriented representations of falling objects. Neuropsychologia. 2005b;43:178–188. doi: 10.1016/j.neuropsychologia.2004.11.005. [DOI] [PubMed] [Google Scholar]
- Zago M, Bosco G, Maffei V, Iosa M, Ivanenko YP, Lacquaniti F. Internal models of target motion: expected dynamics overrides measured kinematics in timing manual interceptions. J Neurophysiol. 2004;91:1620–1634. doi: 10.1152/jn.00862.2003. [DOI] [PubMed] [Google Scholar]
- Zago M, Bosco G, Maffei V, Iosa M, Ivanenko YP, Lacquaniti F. Fast adaptation of the internal model of gravity for manual interceptions: evidence for event-dependent learning. J Neurophysiol. 2005;93:1055–1068. doi: 10.1152/jn.00833.2004. [DOI] [PubMed] [Google Scholar]
- Zago M, McIntyre J, Senot P, Lacquaniti F. Internal models and prediction of visual gravitational motion. Vision Res. 2008;48:1532–1538. doi: 10.1016/j.visres.2008.04.005. [DOI] [PubMed] [Google Scholar]