

Abstract
The primary somatosensory cortex (SI) retains its capability for cortical reorganization after injury or differential use into adulthood. The plastic response of SI cells to peripheral stimulation is characterized by extension of cortical representations accompanied by changes of the receptive field size of neurons. We used intracortical microstimulation that is known to enforce local, intracortical synchronous activity, to induce cortical reorganization and applied immunohistochemical methods in the same individual animals to investigate how plasticity in the cortical topographic maps is linked to changes in the spatial layout of the inhibitory and excitatory neurotransmitter systems. The results reveal a differential spatiotemporal pattern of upregulation and downregulation of specific factors for an excitatory (glutamatergic) and an inhibitory (GABAergic) system, associated with changes of receptive field size and reorganization of the somatotopic map in the rat SI. Predominantly local mechanisms are the specific reduction of the calcium-binding protein parvalbumin in inhibitory neurons and the low expression of the activity marker c-Fos. Reorganization in the hindpaw representation and in the adjacent SI cortical areas (motor cortex and parietal cortex) is accompanied by a major increase of the excitatory transmitter glutamate and c-Fos. The spatial extent of the reorganization appears to be limited by an increase of glutamic acid decarboxylase and the inhibitory transmitter GABA. The local and medium-range net effects are excitatory and can facilitate receptive field enlargements and cortical map expansion. The longer-range increase of inhibition appears suited to limit these effects and to prevent neurons from pathological hyperexcitability.
Keywords: plasticity, somatosensory system, receptive field, GABA, glutamate, parvalbumin
Introduction
The primary somatosensory cortex (SI) is a popular model for studies of cortical plasticity in rats. A number of different experimental manipulations, such as sensory deprivation, lesions, training, or intracortical microstimulation (ICMS), have been used to alter the cortical map or the size, position, shape, and sensitivity of receptive fields (RFs) (Merzenich et al., 1984; Recanzone et al., 1992; Elbert et al., 1995; Buonomano and Merzenich, 1998; Montoya et al., 1998). The changes in the RF properties have been shown to occur within minutes to hours and to last over several months (Elbert et al., 1995; Buonomano and Merzenich, 1998).
Based on theoretical and experimental work, it has been suggested that the maintenance of cortical maps and RFs arises from a meticulous balance of both local and global mechanisms based on feedforward and recurrent inputs (Stratford et al., 1996; Miller et al., 2001; Kalarickal and Marshall, 2002), on alterations of both excitatory and inhibitory mechanisms (Heizmann, 1993; Jones, 2000; Kalarickal and Marshall, 2002; Rosselet et al., 2006), and on a continues protein synthesis (Kleim et al., 2003).
Experimental work on a timescale of days to weeks reveals that cortical map expansion and RF sharpening/contraction induced by the repetitive cutaneous stimulation during nursing is associated with changes in the inhibitory and excitatory system (Rosselet et al., 2006). The authors show that, at different time points, only one of the systems is changed. First, during the initial decrease of RF sizes, an upregulation in the inhibitory system [glutamic acid decarboxylase (GAD65 and GAD67)] was detected by Western blot analysis. Afterward, the expansion of cortical representation was accompanied by upregulation of the NR2A subunit of NMDA receptors and calcium/calmodulin kinase type II, both markers associated with the excitatory system. At this time, the RF sharpening was maintained and no changes in the inhibitory system (GAD65 and GAD67) occurred.
Previous work revealed, after eye removal, TTX injection, and monocular deprivation, a decrease in the neuronal activity that induced a decrease in the neuronal GABA and GAD expression after 4 and 5 d (Hendry and Jones, 1986, 1988). After the reversal of deprivation, the downregulation of the inhibitory system recovered to normal values (Hendry and Jones, 1986, 1988). Similar results were observed in the barrel cortex after vibrissectomy, denervation, or deprivation in which the cortical GABA and GAD expression was decreased in the projection area of affected/treated vibrissa (Welker et al., 1989; Akhtar and Land, 1991; Kossut et al., 1991).
Changes in cortical maps and RF sizes after dorsal rhizotomy or unloading the hindlimb for 14 d were accompanied only by a reduction of inhibition (D'Amelio et al., 1996; Canu et al., 2006). The concentration of inhibitory amino acids (GABA and taurine) in the deprived cortex (by unloading) were decreased, whereas the excitatory amino acid (glutamate) did not change (Canu et al., 2006).
Very fast changes in RF properties have been observed after direct pharmacological disruption of inhibition. A number of studies in SI have shown that blockade of GABAA receptors by iontophoretic application of GABA antagonists leads to rapid expansion of the RFs of most neurons (Hicks and Dykes, 1983; Dykes et al., 1984; Alloway and Burton, 1986, 1991), whereas glutamate enlarges the RFs in only 4% of the recorded cells (Lamour et al., 1988).
The first goal of the present study was to induce cortical plasticity by ICMS in SI and to investigate the time course and reversibility of changes in neuronal RF properties. The second goal was to study the spatiotemporal pattern of changes in the GABAergic and glutamatergic systems at the stimulation site and in the surrounding cortical areas.
Materials and Methods
Animals and experimental procedures.
Briefly, a total of 62 adult Sprague Dawley rats (male, 300–400 g) were anesthetized by intraperitoneal injection of urethane (1.5 g/kg body weight) and kept under a constant level of anesthesia by monitoring forepaw withdrawal, corneal reflex, and respiratory rate, and, if necessary, an extra dose (10% of original dose) was administrated. Body temperature was monitored and maintained between 37 and 37.5°C.
Experimental procedures were similar to those used previously (Recanzone et al., 1992; Benali et al., 2003). One series of animals was used to validate the ICMS-induced plasticity. The cortical hindpaw representation in 13 adult rats was mapped as described by Dinse et al. (1997).
In the second (43 rats, stimulated animals) and third (six rats, sham animals) series of animals, a surgical procedure was developed to minimize possible structural artifacts induced by the craniotomy. After abrading the skull to a thin layer, local field potentials were recorded from the skull after electrical stimulation of the middle toe to localize the toe representation in the left or right somatosensory cortex (0.5 Hz, 1 min, 20–50 μA). At the location of the maximum local field potential, a small hole (0.1 ± 0.05 mm2) was carefully drilled above each hemisphere. Through this aperture, a glass microelectrode (3 m sodium acetate; 1–2 MΩ) was inserted, and action potentials were extracellularly recorded in layer IV in depths of 600–800 μm. For tactile stimulation, an electrically driven stimulator (Bruel & Kjaer) was used to apply computer-controlled tactile stimuli of 8 ms duration (1 Hz). The receptive field mapping was performed as described by Recanzone et al. (1992) before and after ICMS at 15 min intervals (Fig. 1a).
Figure 1.

Experimental procedure. a, The ratunculus with the hindpaw representation and the recording sites (dots) with a representative receptive field. An enlargement of the rectangle in illustration a is represented in b. It shows the place of the hindpaw representation in the map, which was electrically stimulated. c, For the investigation of the immunolabeled cells, at least nine coronal sections in a rostrocaudal extent of 2 mm with intervals of 250 μm between the sections were analyzed for each marker. Each coronal section was divided into sampling areas (five on each hemisphere) with a dorsoventral extent from the pia mater to the white matter and with a mediolateral extent of 500 μm in layer IV. HP, Hindpaw; UZ, unresponsive zone; FP, forepaw; Barrel, barrel cortex; T, tail.
Intracortical microstimulation.
To induce plasticity in the somatosensory cortex, we applied intracortical microstimulation in the cortical layer IV. This method has been successfully used in studies of rapid plastic changes inducible within a few hours, in adult motor, somatosensory, and auditory cortex and thalamus, which were fully reversible (Nudo et al., 1990; Recanzone et al., 1992; Spengler and Dinse, 1994; Maldonado and Gerstein, 1996; Dinse et al., 1997; Buonomano and Merzenich, 1998; Ma and Suga, 2001; Sakai and Suga, 2001), and was partially reversible in the visual cortex of the cat (Godde et al., 2002).
ICMS was applied for 2 h in one hemisphere (ICMS side). The ICMS side was stimulated via the microelectrode with charged balanced repetitive pulse trains of 40 ms duration (13 pulses, 0.2 ms duration at 300 Hz, 6 μA) for 2 h at a repetition rate of 1/s (supplemental Fig. 2, available at www.jneurosci.org as supplemental material). To exclude possible lateralization differences between the hemispheres, the ICMS was randomly applied in individual animals to the left or the right hemisphere. The sham-operated group (n = 6) received the same surgery as the ICMS-treated animals, including the insertion of a glass microelectrode (3 m sodium acetate) into each hemisphere but without electrical stimulation.
Microcoagulation.
At the end of each experiment, two microcoagulations were induced anteriorly and posteriorly to the somatosensory cortex to find the electrode tracks of the control electrode and ICMS electrode in the stained sections of the cortex (supplemental Fig. 1a, available at www.jneurosci.org as supplemental material). The microcoagulation was induced through the stimulation/control electrode with direct current of 20 μA for 5 min. A Masson's trichrome staining (see below) of every tenth section allowed us to find the microcoagulations and the electrode tracks (supplemental Fig. 1b,c, available at www.jneurosci.org as supplemental material). Based on the coordinates of the three landmarks (two microcoagulations plus ICMS/control electrode position), selection of the sections and positioning of the sampling areas were possible. The position of the stimulation/control electrode was in most cases at 2.5 ± 0.5 mm lateral of the fissura longitudinalis cerebri (measured in layer IV). If the electrodes were outside this area, the animals were not included in the study. The sampling areas were aligned according to the position of the ICMS electrode.
Reversibility of the ICMS-induced plasticity.
To examine the reversibility of the ICMS-induced plasticity, the animals were kept under anesthesia after the stimulation. During the recovery periods of 2, 5, 7, and 10 h (Table 1), the RFs were determined in 15–30 min intervals. After the different survival times, the animals were perfused and their brains were treated like those of the acute animals.
Table 1.
Overview of the experimental groups and number of animals
| Series 1: ICMS and cortical mapping | Series 2: ICMS and RF mapping | Series 3: sham | ||||
|---|---|---|---|---|---|---|
| 0–2 h | 0 | 2h | 5h | 7h | 10h | |
| 13 | 31 | 2 | 4 | 3 | 3 | 6 |
Fixation and histochemistry.
After ICMS and the different recovery periods, the rats were killed with an overdose of urethane, and their brains were fixed by intracardial perfusion with 0.9% NaCl, followed by 4% paraformaldehyde in 0.1 m phosphate buffer, pH 7.4. The brains were postfixed for 4 h at 4°C in the same fixative.
After postfixation, the brains were either prepared for embedding in paraffin or cryoprotected in sucrose (30% in PBS). For paraffin embedding, tissue was dehydrated through graded alcohols and xylene and embedded in paraffin. Serial sections of 5 μm were cut coronally, and every 10th section was placed on gelatin-coated slides, dewaxed in xylene, transferred through a descending ethanol series into PBS, and then stained with cresyl violet (a Nissl stain) for cytoarchitectural control and a Masson's trichrome stain for microcoagulation and electrode reconstruction (Carson, 1990).
Frozen sections of 30 μm were cut with a freezing microtome. The sections were rinsed in PBS, and every 10th section was stained with cresyl violet.
Immunohistochemistry.
Consecutive serial sections (interval of 100 μm for paraffin sections or 300 μm for frozen sections) adjacent to Nissl-stained sections (first series) were treated immunohistochemically with antibody against glutamate (second series; 1:4000; Sigma), GABA (third series; 1:4000; Sigma), GAD (fourth series; 1:500; DakoCytomation), parvalbumin (PV) (fifth series; 1:1000; clone PA-235; Swant), calbindin D28K(CB) (sixth series; 1:250; Swant), calretinin (CR) (seventh series; 1:1000; Swant), and c-Fos (eighth series; 1:3000; Dianova). The sections were blocked with normal goat or normal horse serum [1:100 in PBS, 1 h, room temperature (RT); Vector Laboratories] and incubated with primary antibodies overnight at RT and then with the appropriate secondary antibody (Vectastain, 1:200 in PBS, 1.5 h, RT). Detection was performed with a standard ABC kit (Vectastain, 1:500, 1.5 h, RT). The immunostaining was visualized using the glucose oxidase–diaminobenzidine–nickel method (Shu et al., 1988), resulting in black nuclear or cytoplasmatic staining. Sections were finally rinsed in buffer, dehydrated, cleared in xylene, and coverslipped with DePeX (Serva). For negative controls, sections were incubated omitting the primary antibody (replaced by PBS), but all other procedures were maintained.
Data collections and data analysis.
Data collection of immunolabeled neurons was performed manually (glutamate, c-Fos, CB, and CR) and automatically (GABA, GAD, PV, and Nissl) (Benali et al., 2003) using a Leitz Wetzlar Dialux 20 microscope (Leica) equipped with a color video camera [CCD KH 609 (Heimann); MetaMorph (Universal Imaging)]. Cell counts were performed at a final magnification of 50× to 400×. For quantification, marked cells of at least nine coronal sections per animal from a rostrocaudal extent of 2000 μm with intervals of 250 μm between sections were evaluated for each marker. Each coronal section was divided into sampling areas (five in each hemisphere of a section, 45 in each hemisphere and 90 in each animal) (Fig. 1c) with a dorsoventral extent from the pia mater to the white matter and with a mediolateral extent of 500 μm in layer IV, and these areas are in the following called the region of interest (ROI). From each of these ROIs, four to eight images were taken depending on the magnification and cortical thickness. All data given in Results are number of cells per ROI.
To quantify the concentration of substances in the tissue, the optical density (OD) was measured by using the NIH Image system (version 1.61). According to Beer's law, the concentration is proportional to the optical density (Rees and Laurence, 1955). The measurement was made at a final magnification of 200× in layer IV (ICMS was induced in layer IV) in all five areas on each hemisphere (Fig. 1c). Because the OD of the immune reaction varies among animals, the data were standardized for comparison as follows. For each animal, the average mean value of the recorded data for each marker was determined. The OD of each individual measurement was normalized in relation to this mean value.
Data presentations.
The spatial distribution of the cell numbers and ODs are presented as false-color-coded images in Figure 4. The x-axes of the distributions indicate the mediolateral position of the analyzed areas and the y-axes the rostrocaudal distance from the ICMS site (with ICMS set at zero). The color of each point encodes the local cell number or the local OD. The spatially continuous distributions were calculated by linear interpolation between the cell numbers (or optical density) of the ROIs that are discretely distributed. Data from the hemispheres of the ICMS or control animals are separate two-dimensional linear interpolations in the areas 0–4.5 mm lateral and −1 to 1 mm rostrocaudal from the stimulation or control electrode. By the interpolation, the values at the original measurement points were not changed. The implementation of the calculations were made with standard functions of Matlab version 6.0 (MathWorks).
Figure 4.

Summary of the changes after 2 h of ICMS are shown in first two columns. a, b, d, e, g, h, j, k, Color-coded representations of the histological changes after ICMS. The statistical differences are marked by * (significance level of 1%) or × (significance level of 5%). Arrows indicate the location of the electrodes during ICMS or without ICMS. Note that, in controls (sham), c-Fos-IR cells are below threshold for color coding (Tables 2–4). The third column (c, f, i, l) summarizes the changes of the different expression pattern and classifies the different zones. L, Lateral; M, medial.
Statistics.
A nonparametric Mann–Whitney U-Test was used to determine whether there were differences in the number of cells and in the OD between the stimulated and the sham group. Quantitative differences between the hemispheres were assessed by a nonparametric paired Wilcoxon's test or by a parametric paired Student's t test. The results are given as the mean ± SD. A p value of <0.05 was considered significant.
Results
ICMS-induced enlargement of cortical and peripheral representations
Cortical representation
To verify that our application of microstimulation induced the plasticity effects that have been described previously (Recanzone et al., 1992; Spengler and Dinse, 1994), we electrophysiologically mapped the cortical representation of the hindpaw (Fig. 2a,b, red area) and the RF sizes (Fig. 2c,d) before and after ICMS. Before stimulation onset, the cortical hindpaw representation had an area of 1.77 ± 0.48 mm2 and after 2 h of ICMS an area of 2.65 ± 0.82 mm2, which is an enlargement of the representation by a factor of 1.5. In controls without stimulation (sham group), the cortical representation did not change within 2 h (1.79 ± 0.27 vs 1.83 ± 0.26 mm2).
Figure 2.

Somatosensory mapping of the hindpaw representation before (a) and after (b) ICMS. L, Lateral; C, caudal. Dots indicate recording sites with the appending receptive field (indicated by the arrow). Bars show recording sites, which are unresponsive to tactile stimulation. Asterisks mark newly accrued receptive fields after ICMS (b). Receptive field size from both hemispheres of control (sham) and stimulated animals (c). Time course of receptive field changes before (pre ICMS) and after 2 h of electrical stimulation (post ICMS) over an interval of 10 h after stimulation compared with preconditions (d). *p < 0.05.
Peripheral representation (receptive field) of the ICMS site
To minimize possible structural artifacts induced by the treatments (see above, Animals and experimental procedures), only a small craniotomy was performed for inserting the electrode. ICMS was applied to a single site of the cortical representation of toe 3. In sham-operated animals (n = 6), the average RF size at the tip of toe 3 (Figs. 1a, 2c) was 27.53 ± 11.45 mm2 in the right hemisphere and 30.74 ± 10.14 mm2 in the left hemisphere (p > 0.05, paired t test) (Fig. 2c). In the ICMS-treated animals (n = 39), the mean value of the RF size before stimulation was 39.39 ± 29.22 mm2 for the ICMS side and 56.59 ± 45.33 mm2 for the contralateral side (p > 0.05, paired t test) (Fig. 2c). After stimulation, we found a significant increase of the RF sizes on the stimulated side (221.73 ± 73.35 mm2; paired t test, p < 0.005) (Fig. 2c). The maximum increase was present for 45 min from 15 min up to 1 h after stimulation (Fig. 2d). Afterward, the RF sizes began to decrease. However, even 2–5 h after stimulation, the RF sizes were still significantly increased (t test, p < 0.001) (Fig. 2d) and returned to normal values between 5 and 10 h after stimulation offset (Fig. 2d). On the contralateral side, the RF size did not change (60.23 ± 48.41 mm2; paired t test, p = 0.81) (Fig. 2c).
To investigate the underlying mechanisms of the functional changes after stimulation (RF enlargement and increase of the cortical representation), brain tissue from stimulated and sham-operated animals was evaluated with Nissl stain (we counted in the ROI the number of cells to get an overview about the total number of cortical cells and to rule out cell loss as a possible reason for changes in protein expression) and immunohistochemical markers indicative for neuronal activity and the state of the glutamatergic and GABAergic transmitter systems (Bradford, 1995; MacDermott, 2001).
Mapping the neuronal activity by c-Fos
First we tested whether the RF enlargement at the ICMS site and the increase of the cortical map was induced by an increase of the neuronal activity. The metabolic marker c-Fos, an immediate early gene known for its powerful indication of cellular/metabolic activity, was used for mapping the neuronal activity (Morgan et al., 1987; Sagar et al., 1988). After stimulation offset on the ICMS side, many cells were labeled (Fig. 3a). However, in the area directly surrounding the stimulation electrode up to a distance of 125–150 μm, some cells (18.1 ± 9.2/ROI) showed a weak c-Fos labeling, reflecting a low concentration of the marker. Outside this area, a 10-fold greater number of labeled cells (200.5 ± 19.8/ROI) was observed (Fig. 4a). c-Fos labeling extended up to 4.5 mm lateral around the stimulation site, including all adjacent cortical areas. On the contralateral side (3.3 ± 2.4/ROI) and in the sham-operated animals, fewer cells (3.3 ± 1.0/ROI) expressed c-Fos (Figs. 3a, 4a).
Figure 3.

Histological changes after 2 h of ICMS compared with the contralateral side. a, b, Changes at the stimulation site in c-Fos and in PV. A dark arrow indicates the electrode track. c, Increase of the excitatory system (glutamate) after 2 h of ICMS 1 mm lateral the ICMS electrode. The small right top image shows a magnification of stained pyramidal cell. d, e, Enhancement of inhibitory system after 2 h of ICMS in GABA and GAD 500 μm rostral the ICMS electrode. In the small windows of the GAD images at a higher magnification, a nonlabeled pyramidal cell is shown, which is surrounded by labeled GAD puncta. (For magnification, see scale bar in a).
Mapping of the inhibitory and excitatory systems at the stimulation site
After we revealed that, after ICMS, the RF size increase at the stimulation site is not correlated with an increase of the metabolic activity (low c-Fos labeling) and the RF size increase in the surround correlates with an increased metabolic neural activity (high c-Fos labeling), we wanted to get more insight into the possible underlying mechanisms of these different RF size enlargements. A possible assumption is that an expression of high inhibition/low excitation at the stimulation site and high excitation/low inhibition in the surround is induced by shifts in transmitter balance. Therefore, we analyzed the expression of the neurotransmitters for the excitatory (glutamate) and inhibitory (GABA plus GAD) systems.
Although we had the highest receptive field enlargement at the stimulation site, we did not find differences in either transmitter system compared with controls. Neither the number of immunoreactive (IR) cells nor the OD of the labeling for glutamate and for GABA were significantly changed in this region (Table 2) (see Table 5). Furthermore, the expression of the GABA-synthesis enzyme GAD was not significantly different between the control animals and the stimulated animals at the stimulation site, but there were indications for a specific downregulation of the GABAergic system based on the expression of the calcium-binding proteins.
Table 2.
Summary of the number of IR cells in the suppression zone immediately after the ICMS (Fig. 4)
| ICMS | Control | p< | |
|---|---|---|---|
| c-Fos | 18.1 ± 9.2 | 3.3 ± 1.0 | 0.394 |
| Parvalbumin | 43.9 ± 4.0 | 132.5 ± 9.0 | 0.001 |
| Calbindin | 59.3 ± 8.5 | 69.1 ± 7.5 | 0.059 |
| Calretinin | 75.3 ± 10.9 | 87.3 ± 8.6 | 0.142 |
| Glutamate | 370.1 ± 12.6 | 335.5 ± 8.9 | 0.065 |
| GABA | 181.6 ± 22.1 | 162.0 ± 7.2 | 0.262 |
| GAD | 122.0 ± 7.2 | 111.6 ± 9.8 | 0.215 |
| Nissl | 3001 ± 274 | 2657 ± 172 | 0.187 |
Table 5.
Summary of the optical density in the three zones for GABA, GAD, and glutamate immediately after the ICMS (Fig. 4)
| ICMS | Control | p < | |
|---|---|---|---|
| Suppression zone | |||
| GABA | 1.01 ± 0.048 | 0.96 ± 0.07 | 0.881 |
| GAD | 0.95 ± 0.25 | 1.1 ± 0.11 | 0.393 |
| Glutamate | 0.92 ± 0.07 | 0.99 ± 0.28 | 0.8 |
| Excitation zone | |||
| GABA | 0.86 ± 0.05 | 0.97 ± 0.01 | 0.305 |
| GAD | 0.96 ± 0.01 | 0.97 ± 0.04 | 0.514 |
| Glutamate | 1.06 ± 0.15 | 0.97 ± 0.06 | 0.001 |
| Inhibition zone | |||
| GABA | 0.98 ± 0.14 | 0.93 ± 0.11 | 0.024 |
| GAD | 1.07 ± 0.16 | 0.99 ± 0.06 | 0.001 |
| Glutamate | 0.92 ± 0.05 | 0.98 ± 0.02 | 0.884 |
Mapping the expression of calcium-binding proteins at the stimulation site
Several types of GABAergic neurons can be differentiated by their expression of the calcium-binding proteins (CaBPs) PV, CB, and CR. Each of these three CaBPs is mostly colocalized with GABA in distinct subpopulations of nonpyramidal cells (Hendry et al., 1989; Celio, 1990). We used CaBP immunohistochemistry to visualize specific changes in the GABAergic cell population. We did not find any changes in the number of CR- and CB-positive cells (Table 2) but a local reduction at the stimulation site in the number of inhibitory interneurons expressing parvalbumin (Figs. 3b, 4b). This protein is expressed in fast-spiking basket cells and is involved in the coordination of functional activity across related cortical regions by inhibiting the pyramidal cell output (Heizmann, 1993). The decrease of the number of parvalbumin-IR cells at the stimulation site was highly significant (p < 0.001) (Table 2). The mediolateral extension of this area was 200–300 μm and includes the zone, in which the c-Fos expression was low (Fig. 3a). In the following, we will call this area suppression zone (SZ) (Fig. 4c). Outside of this zone, we did not observe significant differences in the number of stained parvalbumin cells compared with control animals (Tables 3, 4).
Table 3.
Summary of the number of IR cells in the excitation zone immediately after the ICMS (Fig. 4)
| ICMS | Control | p < | |
|---|---|---|---|
| c-Fos | 200.5 ± 19.8 | 2.6 ± 0.2 | 0.001 |
| Parvalbumin | 119.4 ± 4.8 | 122.83 ± 2.1 | 0.42 |
| Calbindin | 70.1 ± 2.7 | 70.3 ± 3.9 | 0.872 |
| Calretinin | 124.8 ± 5.1 | 143.6 ± 7.2 | 0.057 |
| Glutamate | 425.6 ± 6.8 | 336.4 ± 8.0 | 0.001 |
| GABA | 240.8 ± 24.1 | 187.7 ± 10.0 | 0.1 |
| GAD | 125.9 ± 5.7 | 119.0 ± 3.5 | 0.581 |
| Nissl | 2468 ± 146 | 2640 ± 224 | 0.445 |
Table 4.
Summary of the number of IR cells in the inhibition zone immediately after the ICMS (Fig. 4)
| ICMS | Control | p< | |
|---|---|---|---|
| c-Fos | 163.5 ± 17.5 | 2.0 ± 0.2 | 0.001 |
| Parvalbumin | 122.5 ± 4.4 | 116.85 ± 2.5 | 0.811 |
| Calbindin | 61.5 ± 2.4 | 63.1 ± 3.6 | 0.586 |
| Calretinin | 142.1 ± 6.5 | 150.4 ± 8.6 | 0.518 |
| Glutamate | 426.1 ± 9.1 | 372.1 ± 14.7 | 0.005 |
| GABA | 215.9 ± 19.5 | 162.8 ± 7.1 | 0.007 |
| GAD | 122.0 ± 7.2 | 111.6 ± 3.9 | 0.215 |
| Nissl | 2657 ± 142 | 2414 ± 88 | 0.187 |
Mapping excitatory neurotransmitter system outside the stimulation site
Adjacent to the SZ, the OD of glutamate staining was significantly enhanced 250 μm caudal to the stimulation site in an area extending from the fissura longitudinalis cerebri up to 4 mm toward lateral. This area includes the motor cortex, the hindlimb region, forelimb region, and the dysgranular region of S1.
The number of glutamate-IR cells was significantly increased 250 μm rostral to the stimulation site in the hindpaw and forepaw region and 750 μm anterior to the stimulation site in the motor cortex (Fig. 4d). Also, an increase in the number of cells expressing glutamate occurred 1 mm lateral to the stimulation site in the forepaw representation in an area of 1.250 mm anteroposterior extent (Fig. 4d). At 1 mm posterior to the stimulation site, an increase of the number cells expressing glutamate was observed in the motor cortex and the somatosensory hindlimb and dysgranular region of S1 (see Fig. 6b), which are highly interconnected (Hoover et al., 2003).
Figure 6.

Cortical topography surrounding the ratunculus in primary somatosensory cortex (a). VC, Visual cortex; fl, forelimb; hl, hindlimb; SI, primary somatosensory cortex; MC, motor cortex; cg, cingulate cortex; OB, bulbus olfactorius; RAG, retrosplenial cortex; TE, temporal cortex; CR, cerebral cortex; SII, secondary somatosensory cortex; Ins, insular cortex; PIR, piriform cortex. Classification of the zones attributable to the specific changes of the transmitters and proteins immediately after two hours of ICMS and overlay these to the cortical representation (b). FP, Forepaw; HP, hindpaw; IZ, inhibition zone; UZ, unresponsive zone.
This zone, which is characterized by positive changes in the excitatory transmitter system, will be further called excitation zone (EZ). Within the EZ, for example in the hindpaw representation, the electrophysiological recordings revealed an enlargement of the cortical area and increased RFs (Fig. 2) that lasted up to 5 h. The glutamate staining observed at different time points (2, 5, 7, and 10 h after stimulation) showed a similar time course and lasted up to 5 h after stimulation (Fig. 5a).
Figure 5.
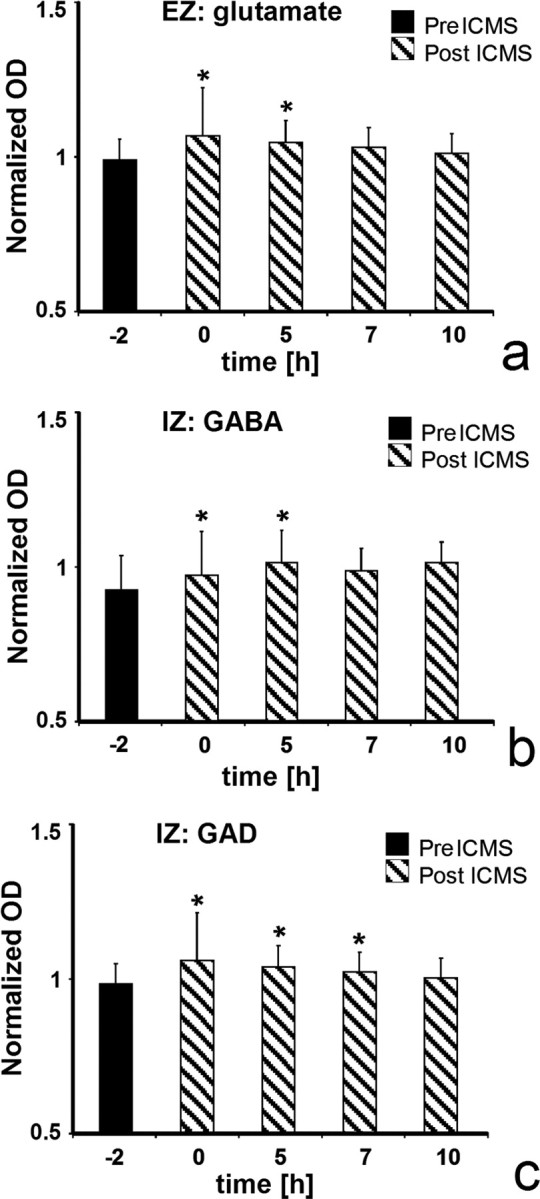
Optical density of glutamate (a), GABA (b), and GAD (c) at different time points after ICMS from the different zones (Fig. 4c,f,l). For comparison, see time course of changes in RF size (Fig. 2d). Because the OD of the immunoreactivity of animals differ, the data were standardized, to compare among animals. The OD of each individual measure was divided by the average value of all stained sections from the same animal and same marker. IZ, Inhibition zone.
In parts of the EZ, an upregulation of the inhibitory system was found as well (Figs. 4g,j, 6b).
Mapping the inhibitory neurotransmitter system outside the stimulation site
The changes in the inhibitory transmitter system displayed a different spatial distribution compared with the excitatory system (Figs. 4f,i–l, 6b).
The OD of the GABA and GAD staining was significantly changed outside the EZ (Fig. 4h,k; Table 5). The OD of GAD staining was increased 500 μm caudal/3.5 mm lateral of the stimulation site and 750 μm rostral extending from the fissura longitudinalis cerebri up to 1.5 mm lateral (Fig. 4k). The OD of the transmitter GABA was increased medial to the stimulation site in the agranular frontal cortex (Fig. 4h) and extended into the contralateral side (data not shown).
Significant changes in the number of GABA- and GAD-immunoreactive cells in the ROI are located 750 μm caudal and 500 μm rostral to the stimulation site (Fig. 4g,j). Caudal, the number of IR cells was increased for GABA at 3.5 mm lateral and for GAD from 1.5 up to 2.5 mm lateral to the fissura longitudinalis cerebri. Rostral, the number of GABA-IR cells was increased from 2.5 up to 4.5 mm lateral to the fissura longitudinalis cerebri, and the number of GAD-IR cells was increased at 2.5 mm lateral. In addition, GABA-IR cells are significantly increased 1000 μm rostral and 0.5, 1.5, and 3.5 mm lateral. In summary, the upregulation of GABA and GAD seems to represent an inhibitory surround that could functionally limit the increase of glutamatergic excitation (Fig. 6b). This zone, which is characterized by positive changes in the inhibitory transmitter system, will be further called inhibition zone (Fig. 4l).
Discussion
Our histological and electrophysiological results indicate that cortical reorganization and RF enlargement after ICMS are characterized by a specific spatiotemporal pattern of changes in transmitter systems and proteins. In the SZ, which was located immediately around the stimulation site, we found no changes of the transmitter systems and a moderate increase of the neural activity (c-Fos) but a reduction of the calcium-binding protein parvalbumin. A second asymmetric zone surrounded the SZ. In this zone (excitation zone), we found an increase of the excitatory transmitter glutamate and an increase of the neural activity (c-Fos). A third zone (inhibition zone) with an upregulation of the GABAergic inhibitory system (GABA and GAD) and the neural activity (c-Fos) seems to enclose the preceding zones.
Suppression zone
The immunohistochemistry of the calcium-binding protein parvalbumin showed a decrease of IR cells at the stimulation site after ICMS. A decline of parvalbumin is also observed after epileptic seizure (Kamphuis et al., 1989; Sloviter, 1989; DeFelipe et al., 1993; Schwaller et al., 2004), in schizophrenia (Eyles et al., 2002; Zhang and Reynolds, 2002; Sakai et al., 2008), and in Alzheimer‘s disease (Solodkin et al., 1996). Under all these conditions, the decrease of parvalbumin indicates a change in the neuronal network, but, as far as we know, we here describe for the first time a change of parvalbumin immunoreactivity that correlates with changes in a topographic map.
We assume that the decrease of parvalbumin is dependent on the electrophysiological properties (fast-spiking vs regular firing) of the cells that are involved in synchronizing the neuronal activity (McBain and Fisahn, 2001). A relationship between the firing pattern of nonpyramidal cells and the CaBPs has been reported (Kawaguchi, 2001). Only the fast-spiking neurons expressing parvalbumin are able to follow a high-stimulation frequency (Celio, 1986; Kawaguchi, 2001). This is consistent with our finding that calbindin and calretinin (Table 2) did not change significantly at the stimulation site, whereas we observed a significant decrease of cells expressing parvalbumin.
Differences between the CaBP-containing neurons exist in their cortical distribution and their morphology (Markram et al., 2004). The parvalbumin protein is located with a higher density in layer IV (the layer in which we applied ICMS in this study) and is expressed mainly in basket and chandelier cells (Markram et al., 2004). The basket cells have a local dendritic tree and their axonal arms (two up to five) can extend up to 1 mm from the dendritic field in the plan view (Kisvárday, 1992) and are specialized in targeting the somata and proximal dendrites of pyramidal neurons and interneurons (Markram et al., 2004). They are therefore the primary source of lateral inhibition across columns within the layer that contains their somata.
The chandelier neurons can be multipolar or bitufted and are targeting the initial axon segment in which they can control the generation of action potentials (Zhu et al., 2004). This means that the GABAergic input on the dendrites and somata of pyramidal cells originates from numerous and various types of basket cells, but the only source of synapses on their axon initial segment is from one or a few chandelier cells (DeFelipe, 1999).
ICMS has been shown to produce a small RF enlargement already after 30 min of stimulation and RF size additional increases with longer application time (Dinse et al., 1993). We assume that, at the beginning of ICMS, both the excitatory and the inhibitory system are strongly activated by the synchronized stimulation, but the PV-IR cells control the output of the pyramidal cells (Zhu et al., 2004), and, if the activity in the network increases by the ICMS, then the inhibition of pyramidal cells increases, too. Similar findings were observed during the critical period (Hensch, 2005; Hensch and Fagiolini, 2005; Morishita and Hensch, 2008), in which the onset of the critical period correlates with the emergence of PV-IR cells (del Río et al., 1994). The increase of inhibition adjusts the excitatory output of pyramidal cells and consolidates plasticity during the critical period (Morishita and Hensch, 2008). In a previous study, it was shown that repetitive intracortical microstimulation in brain slices of the rat SI induces long-term depression in the excitatory system (Heusler et al., 2000). As a consequence, the transmitter release of the depressed excitatory synapses is reduced. Calcium-permeable AMPA and NMDA receptors are expressed in PV interneurons (Goldberg et al., 2003; Nyíri et al., 2003). In cells expressing PV, the calcium-permeable AMPA receptors provide a fast and NMDA receptors a slow calcium influx (Goldberg et al., 2003). A decrease of the glutamatergic transmitter release (hypoglutamatergic condition) leads to a drop in the calcium influx (Kinney et al., 2006) and to a compensatory mechanism, with a decrease of parvalbumin-positive GABAergic interneurons and a loss of their phenotypic appearance (Kinney et al., 2006). These findings might well explain our data at the stimulation site, in which no expression of parvalbumin and a moderate expression of c-Fos occurred.
ICMS seems to “reset” the excitatory and inhibitory balance and to induce a state as found in the precritical period during development (Morishita and Hensch, 2008). The physiological state of the parvalbumin-positive basket cells is disturbed and this attenuation of the GABAergic circuits in maturity induces cortical reorganization as observed during the critical period in the somatosensory cortex (Fox 1992; Stern et al., 2001) or visual cortex (Fox, 1992; Hensch, 2005; Hensch and Fagiolini, 2005).
Excitation zone
Direct synaptic projections are supposed to activate neurons within a range of 125–600 μm (Stoney et al., 1968; Tehovnik, 1996). Thus, the increase of glutamate in the EZ might be directly attributable to synaptic activation via stimulated nerve fibers originating from the SZ or indirectly attributable to missing inhibition from the SZ indicated by the decrease of parvalbumin in the fast-spiking basket cells and chandelier cells. Increased excitation and/or missing inhibition might explain the increased RF sizes measured in this area. An enlargement of the receptive field size is seen after iontophoretic application of glutamate to neurons in the forelimb and hindlimb representation of the somatosensory cortex of rats (Lamour et al., 1988). In addition, extracellular glutamate enhances the responses of the affected neurons to peripheral stimulation and uncovers new receptive fields that induce an enlargement of the cortical representation (Lamour et al., 1988).
After partial deafferentation of the hindlimb, granular cortex of the rat by nerve transection neurons in the cortical hindlimb area were more readily depolarized by glutamate (Lamour and Dykes, 1988). In this deafferentated cortex, the neuronal responses to a fixed dose of glutamate were larger than in normal cortex. The main effect of glutamate was an enlargement of the receptive field sizes and only few receptive fields were uncovered by glutamate. These data were interpreted in such a way that the cells from deafferentated cortex had fewer excitatory inputs and were apparently under a comparatively weaker degree of inhibitory control than in controls (Lamour and Dykes, 1988). Interestingly, a similar mechanism is observed in the visual cortex, too. An increase of glutamate immunoreactivity was seen after peripheral retinal lesions in the visual cortex of cats. The increase is located in the boundary region of the lesion projection zone (LPZ) (Arckens et al., 2000). This effect might be explained by a very similar mechanism. Like in the SZ of our experiments, the cortical activity is strongly reduced in the LPZ as a result of the missing afferent signals after retinal lesions. In the boundary region of the LPZ, intracortical lateral inhibition from the LPZ is reduced, inducing increased activity and enlarged RF sizes (Giannikopoulos and Eysel, 2006). The upregulation of GABA and glutamate in the EZ must not be a contradiction. Similar upregulations of both transmitter systems is observed after 1–2 months after retinal lesion in the nondeprived cat visual cortex (Massie et al., 2003) and during the critical period (Hensch, 2005). The increase of glutamatergic excitation would allow the strengthening of synapses and the expansion of the receptive fields, and the increase of GABA shapes the new RFs. Therefore, the coregulation maintains the balance between excitation and inhibition and stabilizes the functional organization of the cortical RFs.
Inhibition zone
The third and outermost zone induced by ICMS in the somatosensory cortex was characterized by an increase of markers for the GABAergic system. The increased activity of the inhibitory system in the inhibition zone probably represents a compensatory reaction to the increased activity in the EZ. It could serve to prevent a propagation of the excitation over the whole cortex as seen during epileptic seizures (Prince and Wilder, 1967; Goldensohn and Salazar, 1986; Schwartz and Bonhoeffer, 2001). In the inhibition zone, the RF enlargement was smaller than at the stimulation site and in the EZ (Haupt et al., 2004). The ICMS-induced changes are, on the one hand, functionally limited by this inhibition zone, and, on the other hand, structurally restricted by the range of horizontal connections and anatomical rules such as the fact that, within the hindpaw representation, layer IV cells maintain relatively few axonal connections with adjacent more dysgranular cortical regions (Chapin et al., 1987). In addition, layer VI cell connectivity has to be considered because the changes of IR after ICMS extend over the whole column. Forty-four percent of all corticocortical projections of layer VI neurons from the primary somatosensory cortex of the rat project to SII and motor cortex (Zhang and Deschenes, 1997), which could limit cortical reorganization to these areas.
Footnotes
This work was supported by Deutsche Forschungsgemeinschaft (DFG) Grant Sonderforschungsbereich (SFB) 509 TP C4 (U.T.E.), FORUM F108/00 M122/13 (E.W.), and DFG Grant SFB 509 TP C5 (H.R.D.). We thank Dr. M. A. Giese for his comments on this manuscript and help with the statistical and data analysis, and Ute Neubacher and Gabriele Bomholt for their technical help.
References
- Akhtar ND, Land PW. Activity-dependent regulation of glutamic acid decarboxylase in the rat barrel cortex: effects of neonatal versus adult sensory deprivation. J Comp Neurol. 1991;307:200–213. doi: 10.1002/cne.903070204. [DOI] [PubMed] [Google Scholar]
- Alloway KD, Burton H. Bicuculline-induced alterations in neuronal responses to controlled tactile stimuli in the second somatosensory cortex of the cat: a microiontophoretic study. Somatosens Res. 1986;3:197–211. doi: 10.3109/07367228609144584. [DOI] [PubMed] [Google Scholar]
- Alloway KD, Burton H. Differential effects of GABA and bicuculline on rapidly- and slowly-adapting neurons in primary somatosensory cortex of primates. Exp Brain Res. 1991;85:598–610. doi: 10.1007/BF00231744. [DOI] [PubMed] [Google Scholar]
- Arckens L, Schweigart G, Qu Y, Wouters G, Pow DV, Vandesande F, Eysel UT, Orban GA. Cooperative changes in GABA, glutamate and activity levels: the missing link in cortical plasticity. Eur J Neurosci. 2000;12:4222–4232. doi: 10.1046/j.0953-816x.2000.01328.x. [DOI] [PubMed] [Google Scholar]
- Benali A, Leefken I, Eysel UT, Weiler E. A computerized image analysis system for quantitative analysis of cells in histological brain sections. J Neurosci Methods. 2003;125:33–43. doi: 10.1016/s0165-0270(03)00023-2. [DOI] [PubMed] [Google Scholar]
- Bradford HF. Glutamate, GABA and epilepsy. Prog Neurobiol. 1995;47:477–511. doi: 10.1016/0301-0082(95)00030-5. [DOI] [PubMed] [Google Scholar]
- Buonomano DV, Merzenich MM. Cortical plasticity: from synapses to maps. Annu Rev Neurosci. 1998;21:149–186. doi: 10.1146/annurev.neuro.21.1.149. [DOI] [PubMed] [Google Scholar]
- Canu MH, Treffort N, Picquet F, Dubreucq G, Guerardel Y, Falempin M. Concentration of amino acid neurotransmitters in the somatosensory cortex of the rat after surgical or functional deafferentation. Exp Brain Res. 2006;173:623–628. doi: 10.1007/s00221-006-0401-2. [DOI] [PubMed] [Google Scholar]
- Carson FL. Histology: a self-instructional text. Chicago: ASCP; 1990. pp. 142–144. [Google Scholar]
- Celio MR. Parvalbumin in most gamma-aminobutyric acid-containing neurons of the rat cerebral cortex. Science. 1986;231:995–997. doi: 10.1126/science.3945815. [DOI] [PubMed] [Google Scholar]
- Celio MR. Calbindin D-28k and parvalbumin in the rat nervous system. Neuroscience. 1990;35:375–475. doi: 10.1016/0306-4522(90)90091-h. [DOI] [PubMed] [Google Scholar]
- Chapin JK, Sadeq M, Guise JL. Corticocortical connections within the primary somatosensory cortex of the rat. J Comp Neurol. 1987;263:326–346. doi: 10.1002/cne.902630303. [DOI] [PubMed] [Google Scholar]
- D'Amelio F, Fox RA, Wu LC, Daunton NG. Quantitative changes of GABA-immunoreactive cells in the hindlimb representation of the rat somatosensory cortex after 14-day hindlimb unloading by tail suspension. J Neurosci Res. 1996;44:532–539. doi: 10.1002/(SICI)1097-4547(19960615)44:6<532::AID-JNR3>3.0.CO;2-C. [DOI] [PubMed] [Google Scholar]
- DeFelipe J. Chandelier cells and epilepsy. Brain. 1999;122:1807–1822. doi: 10.1093/brain/122.10.1807. [DOI] [PubMed] [Google Scholar]
- DeFelipe J, Garcia Sola R, Marco P, del Río MR, Pulido P, Ramón y Cajal S. Selective changes in the microorganization of the human epileptogenic neocortex revealed by parvalbumin immunoreactivity. Cereb Cortex. 1993;3:39–48. doi: 10.1093/cercor/3.1.39. [DOI] [PubMed] [Google Scholar]
- del Río JA, de Lecea L, Ferrer I, Soriano E. The development of parvalbumin-immunoreactivity in the neocortex of the mouse. Brain Res Dev Brain Res. 1994;81:247–259. doi: 10.1016/0165-3806(94)90311-5. [DOI] [PubMed] [Google Scholar]
- Dinse HR, Recanzone GH, Merzenich MM. Alterations in correlated activity parallel ICMS-induced representational plasticity. Neuroreport. 1993;5:173–176. doi: 10.1097/00001756-199311180-00020. [DOI] [PubMed] [Google Scholar]
- Dinse HR, Godde B, Hilger T, Haupt SS, Spengler F, Zepka R. Short-term functional plasticity of cortical and thalamic sensory representations and its implication for information processing. Adv Neurol. 1997;73:159–178. [PubMed] [Google Scholar]
- Dykes RW, Landry P, Metherate R, Hicks TP. Functional role of GABA in cat primary somatosensory cortex: shaping receptive fields of cortical neurons. J Neurophysiol. 1984;52:1066–1093. doi: 10.1152/jn.1984.52.6.1066. [DOI] [PubMed] [Google Scholar]
- Elbert T, Pantev C, Wienbruch C, Rockstroh B, Taub E. Increased cortical representation of the fingers of the left hand in string players. Science. 1995;270:305–307. doi: 10.1126/science.270.5234.305. [DOI] [PubMed] [Google Scholar]
- Eyles DW, McGrath JJ, Reynolds GP. Neuronal calcium-binding proteins and schizophrenia. Schizophr Res. 2002;57:27–34. doi: 10.1016/s0920-9964(01)00299-7. [DOI] [PubMed] [Google Scholar]
- Fox K. A critical period for experience-dependent synaptic plasticity in rat barrel cortex. J Neurosci. 1992;12:1826–1838. doi: 10.1523/JNEUROSCI.12-05-01826.1992. [DOI] [PMC free article] [PubMed] [Google Scholar]
- Giannikopoulos DV, Eysel UT. Dynamics and specificity of cortical map reorganization after retinal lesions. Proc Natl Acad Sci U S A. 2006;103:10805–10810. doi: 10.1073/pnas.0604539103. [DOI] [PMC free article] [PubMed] [Google Scholar]
- Godde B, Leonhardt R, Cords SM, Dinse HR. Plasticity of orientation preference maps in the visual cortex of adult cats. Proc Natl Acad Sci U S A. 2002;99:6352–6357. doi: 10.1073/pnas.082407499. [DOI] [PMC free article] [PubMed] [Google Scholar]
- Goldberg JH, Yuste R, Tamas G. Ca2+ imaging of mouse neocortical interneurone dendrites: contribution of Ca2+-permeable AMPA and NMDA receptors to subthreshold Ca2+ dynamics. J Physiol. 2003;551:67–78. doi: 10.1113/jphysiol.2003.042598. [DOI] [PMC free article] [PubMed] [Google Scholar]
- Goldensohn ES, Salazar AM. Temporal and spatial distribution of intracellular potentials during generation and spread of epileptogenic discharges. Adv Neurol. 1986;44:559–582. [PubMed] [Google Scholar]
- Haupt SS, Spengler F, Husemann R, Dinse HR. Receptive field scatter, topography and map variability in different layers of the hindpaw representation of rat somatosensory cortex. Exp Brain Res. 2004;155:485–499. doi: 10.1007/s00221-003-1755-3. [DOI] [PubMed] [Google Scholar]
- Heizmann CW. Calcium signaling in the brain. Acta Neurobiol Exp (Wars) 1993;53:15–23. [PubMed] [Google Scholar]
- Hendry SH, Jones EG. Reduction in number of immunostained GABAergic neurones in deprived-eye dominance columns of monkey area 17. Nature. 1986;320:750–753. doi: 10.1038/320750a0. [DOI] [PubMed] [Google Scholar]
- Hendry SH, Jones EG. Activity-dependent regulation of GABA expression in the visual cortex of adult monkeys. Neuron. 1988;1:701–712. doi: 10.1016/0896-6273(88)90169-9. [DOI] [PubMed] [Google Scholar]
- Hendry SH, Jones EG, Emson PC, Lawson DE, Heizmann CW, Streit P. Two classes of cortical GABA neurons defined by differential calcium binding protein immunoreactivities. Exp Brain Res. 1989;76:467–472. doi: 10.1007/BF00247904. [DOI] [PubMed] [Google Scholar]
- Hensch TK. Critical period plasticity in local cortical circuits. Nat Rev Neurosci. 2005;6:877–888. doi: 10.1038/nrn1787. [DOI] [PubMed] [Google Scholar]
- Hensch TK, Fagiolini M. Excitatory-inhibitory balance and critical period plasticity in developing visual cortex. Prog Brain Res. 2005;147:115–124. doi: 10.1016/S0079-6123(04)47009-5. [DOI] [PubMed] [Google Scholar]
- Heusler P, Cebulla B, Boehmer G, Dinse HR. A repetitive intracortical microstimulation pattern induces long-lasting synaptic depression in brain slices of the rat primary somatosensory cortex. Exp Brain Res. 2000;135:300–310. doi: 10.1007/s002210000530. [DOI] [PubMed] [Google Scholar]
- Hicks TP, Dykes RW. Receptive field size for certain neurons in primary somatosensory cortex is determined by GABA-mediated intracortical inhibition. Brain Res. 1983;274:160–164. doi: 10.1016/0006-8993(83)90533-4. [DOI] [PubMed] [Google Scholar]
- Hoover JE, Hoffer ZS, Alloway KD. Projections from primary somatosensory cortex to the neostriatum: the role of somatotopic continuity in corticostriatal convergence. J Neurophysiol. 2003;89:1576–1587. doi: 10.1152/jn.01009.2002. [DOI] [PubMed] [Google Scholar]
- Jones EG. Cortical and subcortical contributions to activity-dependent plasticity in primate somatosensory cortex. Annu Rev Neurosci. 2000;23:1–37. doi: 10.1146/annurev.neuro.23.1.1. [DOI] [PubMed] [Google Scholar]
- Kalarickal GJ, Marshall JA. Rearrangement of receptive field topography after intracortical and peripheral stimulation: the role of plasticity in inhibitory pathways. Network. 2002;13:1–40. [PubMed] [Google Scholar]
- Kamphuis W, Huisman E, Wadman WJ, Heizmann CW, Lopes da Silva FH. Kindling induced changes in parvalbumin immunoreactivity in rat hippocampus and its relation to long-term decrease in GABA-immunoreactivity. Brain Res. 1989;479:23–34. doi: 10.1016/0006-8993(89)91331-0. [DOI] [PubMed] [Google Scholar]
- Kawaguchi Y. Distinct firing patterns of neuronal subtypes in cortical synchronized activities. J Neurosci. 2001;21:7261–7272. doi: 10.1523/JNEUROSCI.21-18-07261.2001. [DOI] [PMC free article] [PubMed] [Google Scholar]
- Kinney JW, Davis CN, Tabarean I, Conti B, Bartfai T, Behrens MM. A specific role for NR2A-containing NMDA receptors in the maintenance of parvalbumin and GAD67 immunoreactivity in cultured interneurons. J Neurosci. 2006;26:1604–1615. doi: 10.1523/JNEUROSCI.4722-05.2006. [DOI] [PMC free article] [PubMed] [Google Scholar]
- Kisvárday Z. GABAergic networks of basket cells in the visual cortex. Prog Brain Res. 1992;90:385–404. doi: 10.1016/s0079-6123(08)63623-7. [DOI] [PubMed] [Google Scholar]
- Kleim JA, Bruneau R, Calder K, Pocock D, VandenBerg PM, MacDonald E, Monfils MH, Sutherland RJ, Nader K. Functional organization of adult motor cortex is dependent upon continued protein synthesis. Neuron. 2003;40:167–176. doi: 10.1016/s0896-6273(03)00592-0. [DOI] [PubMed] [Google Scholar]
- Kossut M, Stewart MG, Siucinska E, Bourne RC, Gabbott PL. Loss of gamma-aminobutyric acid (GABA) immunoreactivity from mouse first somatosensory (SI) cortex following neonatal, but not adult, denervation. Brain Res. 1991;538:165–170. doi: 10.1016/0006-8993(91)90393-a. [DOI] [PubMed] [Google Scholar]
- Lamour Y, Dykes RW. Somatosensory neurons in partially deafferented rat hindlimb granular cortex subsequent to transection of the sciatic nerve: effects of glutamate and acetylcholine. Brain Res. 1988;449:18–33. doi: 10.1016/0006-8993(88)91020-7. [DOI] [PubMed] [Google Scholar]
- Lamour Y, Dutar P, Jobert A, Dykes RW. An iontophoretic study of single somatosensory neurons in rat granular cortex serving the limbs: a laminar analysis of glutamate and acetylcholine effects on receptive-field properties. J Neurophysiol. 1988;60:725–750. doi: 10.1152/jn.1988.60.2.725. [DOI] [PubMed] [Google Scholar]
- Ma X, Suga N. Plasticity of bat's central auditory system evoked by focal electric stimulation of auditory and/or somatosensory cortices. J Neurophysiol. 2001;85:1078–1087. doi: 10.1152/jn.2001.85.3.1078. [DOI] [PubMed] [Google Scholar]
- MacDermott AB. Glutamate and GABA: a painful combination. Neuron. 2001;32:376–378. doi: 10.1016/s0896-6273(01)00494-9. [DOI] [PubMed] [Google Scholar]
- Maldonado PE, Gerstein GL. Reorganization in the auditory cortex of the rat induced by intracortical microstimulation: a multiple single-unit study. Exp Brain Res. 1996;112:420–430. doi: 10.1007/BF00227948. [DOI] [PubMed] [Google Scholar]
- Markram H, Toledo-Rodriguez M, Wang Y, Gupta A, Silberberg G, Wu C. Interneurons of the neocortical inhibitory system. Nat Rev Neurosci. 2004;5:793–807. doi: 10.1038/nrn1519. [DOI] [PubMed] [Google Scholar]
- Massie A, Cnops L, Smolders I, Van Damme K, Vandenbussche E, Vandesande F, Eysel UT, Arckens L. Extracellular GABA concentrations in area 17 of cat visual cortex during topographic map reorganization following binocular central retinal lesioning. Brain Res. 2003;976:100–108. doi: 10.1016/s0006-8993(03)02717-3. [DOI] [PubMed] [Google Scholar]
- McBain CJ, Fisahn A. Interneurons unbound. Nat Rev Neurosci. 2001;2:11–23. doi: 10.1038/35049047. [DOI] [PubMed] [Google Scholar]
- Merzenich MM, Nelson RJ, Stryker MP, Cynader MS, Schoppmann A, Zook JM. Somatosensory cortical map changes following digit amputation in adult monkeys. J Comp Neurol. 1984;224:591–605. doi: 10.1002/cne.902240408. [DOI] [PubMed] [Google Scholar]
- Miller KD, Pinto DJ, Simons DJ. Processing in layer 4 of the neocortical circuit: new insights from visual and somatosensory cortex. Curr Opin Neurobiol. 2001;11:488–497. doi: 10.1016/s0959-4388(00)00239-7. [DOI] [PubMed] [Google Scholar]
- Montoya P, Ritter K, Huse E, Larbig W, Braun C, Töpfner S, Lutzenberger W, Grodd W, Flor H, Birbaumer N. The cortical somatotopic map and phantom phenomena in subjects with congenital limb atrophy and traumatic amputees with phantom limb pain. Eur J Neurosci. 1998;10:1095–1102. doi: 10.1046/j.1460-9568.1998.00122.x. [DOI] [PubMed] [Google Scholar]
- Morgan JI, Cohen DR, Hempstead JL, Curran T. Mapping patterns of c-fos expression in the central nervous system after seizure. Science. 1987;237:192–197. doi: 10.1126/science.3037702. [DOI] [PubMed] [Google Scholar]
- Morishita H, Hensch TK. Critical period revisited: impact on vision. Curr Opin Neurobiol. 2008;18:101–107. doi: 10.1016/j.conb.2008.05.009. [DOI] [PubMed] [Google Scholar]
- Nudo RJ, Jenkins WM, Merzenich MM. Repetitive microstimulation alters the cortical representation of movements in adult rats. Somatosens Mot Res. 1990;7:463–483. doi: 10.3109/08990229009144720. [DOI] [PubMed] [Google Scholar]
- Nyíri G, Stephenson FA, Freund TF, Somogyi P. Large variability in synaptic N-methyl-d-aspartate receptor density on interneurons and a comparison with pyramidal-cell spines in the rat hippocampus. Neuroscience. 2003;119:347–363. doi: 10.1016/s0306-4522(03)00157-x. [DOI] [PubMed] [Google Scholar]
- Prince DA, Wilder BJ. Control mechanisms in cortical epileptogenic foci. “Surround” inhibition. Arch Neurol. 1967;16:194–202. doi: 10.1001/archneur.1967.00470200082007. [DOI] [PubMed] [Google Scholar]
- Recanzone GH, Merzenich MM, Dinse HR. Expansion of the cortical representation of a specific skin field in primary somatosensory cortex by intracortical microstimulation. Cereb Cortex. 1992;2:181–196. doi: 10.1093/cercor/2.3.181. [DOI] [PubMed] [Google Scholar]
- Rees VH, Laurence DJ. The correspondence with Beer's law for the optical density of stained protein patterns on filter paper as a function of surface protein concentration. Clin Chem. 1955;1:329–344. [PubMed] [Google Scholar]
- Rosselet C, Zennou-Azogui Y, Xerri C. Nursing-induced somatosensory cortex plasticity: temporally decoupled changes in neuronal receptive field properties are accompanied by modifications in activity-dependent protein expression. J Neurosci. 2006;26:10667–10676. doi: 10.1523/JNEUROSCI.3253-06.2006. [DOI] [PMC free article] [PubMed] [Google Scholar]
- Sagar SM, Sharp FR, Curran T. Expression of c-fos protein in brain: metabolic mapping at the cellular level. Science. 1988;240:1328–1331. doi: 10.1126/science.3131879. [DOI] [PubMed] [Google Scholar]
- Sakai M, Suga N. Plasticity of the cochleotopic (frequency) map in specialized and nonspecialized auditory cortices. Proc Natl Acad Sci U S A. 2001;98:3507–3512. doi: 10.1073/pnas.061021698. [DOI] [PMC free article] [PubMed] [Google Scholar]
- Sakai T, Oshima A, Nozaki Y, Ida I, Haga C, Akiyama H, Nakazato Y, Mikuni M. Changes in density of calcium-binding-protein-immunoreactive GABAergic neurons in prefrontal cortex in schizophrenia and bipolar disorder. Neuropathology. 2008;28:143–150. doi: 10.1111/j.1440-1789.2007.00867.x. [DOI] [PubMed] [Google Scholar]
- Schwaller B, Tetko IV, Tandon P, Silveira DC, Vreugdenhil M, Henzi T, Potier MC, Celio MR, Villa AE. Parvalbumin deficiency affects network properties resulting in increased susceptibility to epileptic seizures. Mol Cell Neurosci. 2004;25:650–663. doi: 10.1016/j.mcn.2003.12.006. [DOI] [PubMed] [Google Scholar]
- Schwartz TH, Bonhoeffer T. In vivo optical mapping of epileptic foci and surround inhibition in ferret cerebral cortex. Nat Med. 2001;7:1063–1067. doi: 10.1038/nm0901-1063. [DOI] [PubMed] [Google Scholar]
- Shu SY, Ju G, Fan LZ. The glucose oxidase-DAB-nickel method in peroxidase histochemistry of the nervous system. Neurosci Lett. 1988;85:169–171. doi: 10.1016/0304-3940(88)90346-1. [DOI] [PubMed] [Google Scholar]
- Sloviter RS. Calcium-binding protein (calbindin-D28k) and parvalbumin immunocytochemistry: localization in the rat hippocampus with specific reference to the selective vulnerability of hippocampal neurons to seizure activity. J Comp Neurol. 1989;280:183–196. doi: 10.1002/cne.902800203. [DOI] [PubMed] [Google Scholar]
- Solodkin A, Veldhuizen SD, Van Hoesen GW. Contingent vulnerability of entorhinal parvalbumin-containing neurons in Alzheimer's disease. J Neurosci. 1996;16:3311–3321. doi: 10.1523/JNEUROSCI.16-10-03311.1996. [DOI] [PMC free article] [PubMed] [Google Scholar]
- Spengler F, Dinse HR. Reversible relocation of representational boundaries of adult rats by intracortical microstimulation. Neuroreport. 1994;5:949–953. doi: 10.1097/00001756-199404000-00024. [DOI] [PubMed] [Google Scholar]
- Stern EA, Maravall M, Svoboda K. Rapid development and plasticity of layer 2/3 maps in rat barrel cortex in vivo. Neuron. 2001;31:305–315. doi: 10.1016/s0896-6273(01)00360-9. [DOI] [PubMed] [Google Scholar]
- Stoney SD, Jr, Thompson WD, Asanuma H. Excitation of pyramidal tract cells by intracortical microstimulation: effective extent of stimulating current. J Neurophysiol. 1968;31:659–669. doi: 10.1152/jn.1968.31.5.659. [DOI] [PubMed] [Google Scholar]
- Stratford KJ, Tarczy-Hornoch K, Martin KA, Bannister NJ, Jack JJ. Excitatory synaptic inputs to spiny stellate cells in cat visual cortex. Nature. 1996;382:258–261. doi: 10.1038/382258a0. [DOI] [PubMed] [Google Scholar]
- Tehovnik EJ. Electrical stimulation of neural tissue to evoke behavioral responses. J Neurosci Methods. 1996;65:1–17. doi: 10.1016/0165-0270(95)00131-x. [DOI] [PubMed] [Google Scholar]
- Welker E, Soriano E, Van der Loos H. Plasticity in the barrel cortex of the adult mouse: effects of peripheral deprivation on GAD-immunoreactivity. Exp Brain Res. 1989;74:441–452. doi: 10.1007/BF00247346. [DOI] [PubMed] [Google Scholar]
- Zhang ZJ, Reynolds GP. A selective decrease in the relative density of parvalbumin-immunoreactive neurons in the hippocampus in schizophrenia. Schizophr Res. 2002;55:1–10. doi: 10.1016/s0920-9964(01)00188-8. [DOI] [PubMed] [Google Scholar]
- Zhang ZW, Deschênes M. Intracortical axonal projections of lamina VI cells of the primary somatosensory cortex in the rat: a single-cell labeling study. J Neurosci. 1997;17:6365–6379. doi: 10.1523/JNEUROSCI.17-16-06365.1997. [DOI] [PMC free article] [PubMed] [Google Scholar]
- Zhu Y, Stornetta RL, Zhu JJ. Chandelier cells control excessive cortical excitation: characteristics of whisker-evoked synaptic responses of layer 2/3 nonpyramidal and pyramidal neurons. J Neurosci. 2004;24:5101–5108. doi: 10.1523/JNEUROSCI.0544-04.2004. [DOI] [PMC free article] [PubMed] [Google Scholar]