

Abstract
Laterally connected inhibitory circuitry is found throughout the nervous system, including many early sensory processing systems. The extent to which it plays a role in shaping neuronal stimulus selectivity in systems like olfaction, however, which lack a simple two-dimensional representation of their stimulus space, has remained controversial. We examined this issue using an experimental preparation that allowed electrophysiological recording from the accessory olfactory bulb of an anesthetized mouse during the controlled delivery of pheromonal stimuli, in this case derived from the urine of male and female mice. We found that individual neurons were often highly selective for the sex of the urine donor. Examination of both explicitly inhibitory responses, as well as responses to mixtures of male and female urine, revealed that laterally connected inhibition was both prevalent and of large magnitude, particularly for male-selective neurons. Pharmacological manipulation of this inhibition resulted in a shift in many neurons' stimulus selectivities. Finally, we found that a behavioral response (pregnancy block) evoked by the presence of unfamiliar male urine could be suppressed by the addition of female urine to the stimulus, demonstrating that this system displays a behavioral opponency consistent with neural inhibition. Together, these results indicate that laterally connected inhibitory circuitry in the accessory olfactory bulb plays an important role in shaping neural selectivity for natural stimuli.
Keywords: lateral inhibition, olfaction, accessory olfactory bulb, pheromone, pregnancy block, sex differences
Introduction
In systems such as vision, much progress has been made in understanding the representation of sensory information at different stages of neural processing. For particular circuits like the retina, there is also a growing understanding of the circuit mechanisms that generate these representations. However, the distributed nature of central processing has made it difficult to extend this type of understanding to the circuitry that transforms sensory data into representations that can be used to guide behavior. One promising strategy is to pursue questions of sensory processing, pattern recognition, and the selection of behavioral outputs in model systems with fewer stages of processing between sensory input and behavioral output.
The mammalian accessory olfactory system (AOS) detects socially relevant odors, often called pheromones. In this system, which is anatomically and functionally segregated from the main olfactory system (MOS), sensory input [to the vomeronasal organ (VNO)] is separated from hypothalamic output by just two stages of neuronal processing (see Fig. 1A) (Halpern, 1987). Despite this brevity, this sensory system subserves roles of pattern recognition and even learning and memory; moreover, natural stimuli, such as male and female mouse urine, trigger particular, well characterized behaviors (Brennan and Keverne, 1997)
Figure 1.

Anatomy of the AOS and layout of the preparation. A, Primary sensory neurons located in the VNO send their axons to the AOB, where they make contact with second order sensory neurons; >90% of these second order sensory neurons project to the vomeronasal amygdala, where their output is integrated with that of other sensory systems (Swanson and Petrovich, 1998) and used to guide behavior, including the neuroendocrine output of the hypothalamus. Stimuli were delivered through a tube inserted into the lumen of the VNO. Recordings were performed through a craniotomy; pharmacological agents were supplied through the solution superfusing the cavity. B, The AOB contains two layers of laterally inhibitory connections: the synaptic contacts between primary (VRN) and secondary (MC) sensory neurons are organized into glomerular structures (GL) which are partially ensheathed by GABAergic periglomerular cells (PG). More numerous than the periglomerular cells are the GABAergic granule cells (GC), which form reciprocal dendro-dendritic synapses onto both the lateral and, most often, the primary dendrites of the mitral cells.
The first stage of processing in the AOS is the accessory olfactory bulb (AOB). Within the AOB, the connections between the primary and secondary sensory neurons are made in the context of two layers of laterally connected inhibitory neurons (see Fig. 1B), an arrangement strikingly similar to that seen in the early processing stages of many other sensory systems, such as vision or touch (Haberly, 1998). In the visual and tactile systems, however, our understanding of the role of these inhibitory layers is intimately tied to their spatial organization, and it is unclear whether these interpretations generalize to olfaction (Laurent, 1999; Urban, 2002; Shepherd et al., 2007). Indeed, in studies of mammalian systems, there has been a surprising lack of consistency regarding the functional relevance or even the strength of inhibition present in the either the main or accessory olfactory bulbs (Brennan and Keverne, 1997; Urban, 2002; Luo et al., 2003; Schoppa and Urban, 2003; McGann et al., 2005; Arenkiel et al., 2007; Davison and Katz, 2007; Arevian et al., 2008), highlighting the need for an exploration of the role of inhibition in the recognition of behaviorally relevant olfactory stimuli. While the AOS appears to be an ideal system for exploring these questions, technical difficulties have obstructed progress, with only two studies reporting the responses of AOB neurons to chemical stimuli (Luo et al., 2003; Zhang et al., 2007). Indeed, in the mouse the AOS has never been studied under conditions allowing the controlled delivery of stimulus.
In this work, we developed an experimental preparation in which the spiking responses of AOB neurons to stimuli of controlled concentration and duration can be recorded. Using a combination of stimulus manipulations and pharmacology, we found inhibition in general and lateral inhibition in particular to play a widespread role in the processing of sex-specific cues. The physiological results suggested that female cues might oppose the recognition of male cues, a prediction that was verified for a behavior known as pregnancy block. Together, these results indicate that laterally connected inhibition plays a pervasive and functionally relevant role in shaping the neural representation of sex-selective stimuli in the accessory olfactory system.
Materials and Methods
All experimental procedures were performed in accordance with animal care and use requirements approved by the Washington University Institutional Animal Care and Use Committee. Electrophysiological experiments were performed using 92 female B6D2F1/J mice and 6 BALB/cJ mice, ranging in age from 4 weeks to 39 weeks (24 mice between 4 and 7 weeks; 67 mice between 7 and 21 weeks, and 6 mice between 21 and 39 weeks; mice used in behavioral experiments described below).
Surgical methods and data collection.
Mice were anesthetized with one of two anesthesia regimes (either induction with isoflurane followed by 50 mg/g atropine s.c. and maintenance on 1.5–1.8 mg/g urethane i.p., or induction with 0.25–0.3 mg/g ketamine i.p. to be followed by 1–2% isoflurane via tracheotomy), tracheotomized, and placed on a respirator; the animals' temperature was maintained using a heating pad. The VNO was cannulated (see also Holekamp et al., 2008) using 0.0056” ID medical grade polyimide tubing (A–M Systems): First, with the animal on its back and the jaw held open, the anterior 1–2 mm of the soft pallet was unilaterally retracted to expose the exterior of the bony capsule surrounding the VNO. Next, under a stereo microscope, tubing was threaded by hand through the nares and into the VNO. Once the localization of the tip of the cannula to the lumen of the VNO was confirmed visually, tissue glue was used to cement the tube into place at the point where it entered the nares. A craniotomy was performed unilaterally over the forebrain, the anterior-most portion of which was removed by aspiration to expose the surface of the AOB. A superfusion of temperature-controlled artificial CSF (ACSF; 132 mm NaCl, 2.5 mm KCl, 2 mm CaCl2, 1 mm MgCl2,18 mm NaHCO3, 1.25 mm NaH2 PO4, 25 mm glucose) was set up to flow at 1.5–5 ml/min and 38°F over the surface.
Extracellular activity from the MC layer of the AOB was recorded using single glass electrodes (≈10-MΩ, ≈1 μm tip) filled with 0.5 m Na-acetate and saturating Pontamine Blue. Signals were amplified and filtered at 1000–2000 gain and 100–250 to 10,000 Hz bandpass (Dagan 2400A). Spikes from single cells were identified on the basis of waveform and refractory period using custom written software. The AOB was targeted under visual guidance, and the recording site was confirmed by the activity characteristics of the recordings (lack of burst-type responses and responsiveness to high-K+ solution stimulus delivered to the VNO). Localization of the recording site to the MC layer was based on the depth of penetration into the tissue and the electrophysiological signature of the cells (see Fig. 2). Localization was confirmed by histological methods in a subset (n = 26 of 310) of cells as described below.
Figure 2.
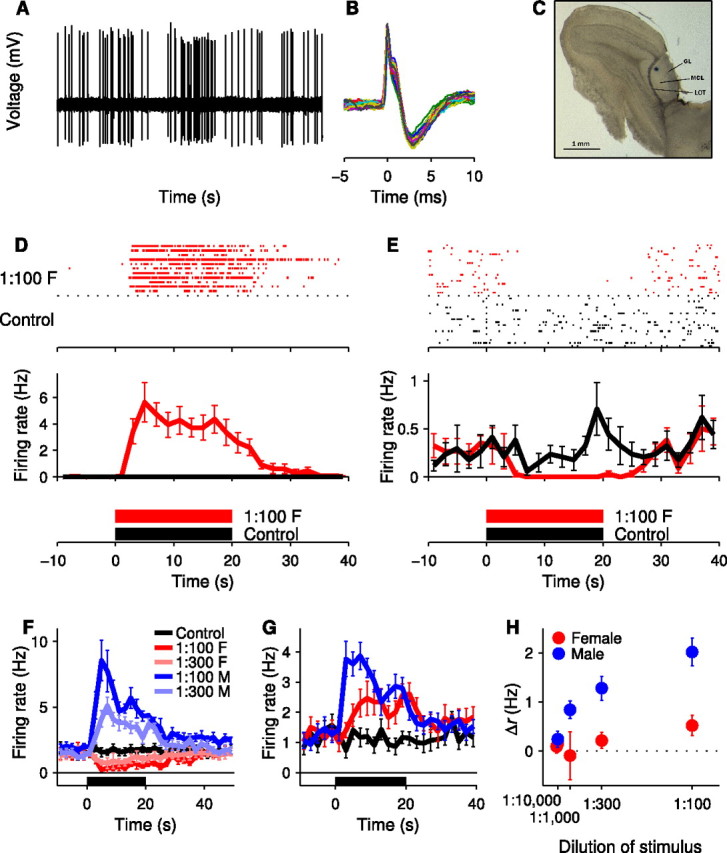
Individual AOB neurons show stimulus-specific and concentration-dependent responses to FMU and MMU. A, Raw waveform recording from the mitral cell layer of the AOB. B, Overlay of all 75 action potentials recorded during the 50 s shown in A, illustrating the consistency of the waveform amplitude and duration. The bifurcated waveform shape commonly observed in AOB neuron recordings is evident. C, Histological section showing the localization of the recording site to the mitral cell layer of the AOB. D, Raster and peristimulus time histogram (PSTH) showing the response of a single AOB neuron when either 1:100 diluted FMU or a negative control (Ringer's solution) are delivered to the VNO. This cell was silent during application of the negative control. E, Raster and PSTH of a second AOB neuron with a slightly higher baseline firing rate, showing a complete silencing of firing during the presentation of FMU to the VNO. F, PSTH of a single AOB neuron showing an increase in firing rate during the presentation of MMU and a decrease in firing rate during the presentation of FMU (8 trials of each stimulus). G, PSTH of a second AOB neuron showing increases in firing rate in response to both MMU and FMU but of different magnitude (15 trials of each stimulus). H, Average change in firing rate (Δr) for the AOB neuron shown in G in response to concentrations of stimuli ranging from 1:10,000 diluted to 1:100 diluted FMU and MMU. All error bars represent SEM.
Stimulus presentation and design.
Male and female mouse urine was collected from BALB/c mice (Jackson). Urine was frozen at −196°C upon production and stored at −80°C; before use, urine was spun down and the supernatant was filtered with a Millex-HV filter. Stimuli consisted of either male or female mouse urine, diluted in Ringer's solution (115 mm NaCl, 5 mm KCl, 2 mm CaCl2, 2 mm MgCl2, 25 mm NaHCO3, 10 mm HEPES, 10 mm glucose), high potassium Ringer's solution (70 mm NaCl, 50 mm KCl, 2 mm CaCl2, 2 mm MgCl2, 25 mm NaHCO3, 10 mm HEPES, 10 mm glucose), or, as a negative control, Ringer's solution alone.
Stimuli were delivered via the VNO cannula, which was connected to an 8 or 16 channel perfusion pencil that allowed up to 16 different sources of fluid to be delivered directly to the lumen of the VNO. All stimulus solutions, including the negative control, were maintained during an experiment at the same volumes and pressures. When stimuli were not being presented, a constant flow of a flush Ringer's solution was maintained. The rate of fluid delivery to the VNO was controlled by a pressure-based system, and was maintained throughout experiments at ∼0.1–0.2 ml/min.
While the electrode was being advanced, brief pulses of high potassium Ringer's solution were used to screen for cells, so that even cells with low spontaneous firing rates could be identified. During experiments, urine stimuli and the Ringer's control were delivered for periods of 20 s, while high potassium Ringer's solution was presented for periods of 10 s. Stimulus periods were followed by 40–120 s of Ringer's flush solution. Stimuli were presented in blocks that included one presentation of each stimulus; in the majority of experiments, the order within each block was randomized.
Pharmacology.
Bicuculline was prepared as 200 μl of aliquots at 50 mm in double deionized water and stored at −80°C; aliquots were thawed immediately before use and diluted 1:250 in 50 ml of ACSF to a final concentration of 200 μm. This ACSF was then substituted for the standard ACSF flowing over the AOB over a period of 20–30 min. The efficacy and specificity of the pharmacologic agents was confirmed by contrasting the effects of bicuculline with those of tetrodotoxin (data not shown) and control experiments using ACSF alone. For a subset of the pharmacology experiments (10 of the bicuculline experiments and 8 of the control experiments), a corresponding set of 200 μl of aliquots of deionized water were prepared, the aliquot for use in each experiment was chosen randomly, and the experimenter was blinded, from data collection through spike-sorting, as to whether a bicuculline or water aliquot had been selected.
The slow penetrance of pharmacological agents through the pia covering the AOB makes it possible that the blockade of inhibitory transmission was only partial in at least some preparations, so these experiments may underestimate the strength of inhibition.
Analysis of histological data.
For 14 cells, post hoc histologic examination was used to localize the recording location in three dimensions. For each of these samples, at the end of recording the site was marked by iontophoretic deposition of Pontamine blue. The olfactory bulb was surgically removed and drop-fixed in 10% glutaraldehyde. Slices were taken sagittally, beginning from the lateral edge of the olfactory bulb, at 50 μm intervals. Location in the anterior–posterior plane was normalized to the length of the AOB visible in the slice containing the recording site. Depth was taken along an axis perpendicular to the surface of the bulb, and normalized to the total distance along that axis before the lateral olfactory tract was reached. Location along the lateral-medial axis was calculated based on the number of slices separating the slice containing the recording site from the first slice in which the AOB was clearly visible (defined as the distance between the surface of the bulb and the lateral olfactory tract being at least 50 μm at its widest point). For one cell, problems with the slicing procedure did not allow the lateral edge of the AOB at the cell's anterior/posterior position to be clearly defined; that one cell's lateral coordinate is therefore omitted from supplemental Fig. S2, available at www.jneurosci.org as supplemental material.
Analysis of electrophysiological data.
Δr values were calculated as the mean firing rate during a single stimulus delivery period minus the mean baseline firing rate during the five seconds immediately preceding the onset of that stimulus presentation. The statistical significance of the difference between the response to one stimulus and the response to a second stimulus or to a negative control was tested using a two-tailed Student's t test comparing the collection of Δr values across trials; unless otherwise specified, a criterion of p < 0.01 was used to identify significant stimulus responses.
To quantify the falloff in stimulus response with decreasing stimulus concentration (supplemental Fig. S1, available at www.jneurosci.org as supplemental material), we examined all units which showed a statistically significant response at both 1:100 dilution (p < 0.05) and at some lower concentration c (p < 0.01). On the collection of Δr values for such units, we performed linear regression to determine the slope of the best-fit line relating Δr at concentration c to Δr at 1:100.
d′ values representing the discriminability of the responses of a single AOB neuron to two stimuli A and B, each at a single concentration, were calculated based on the mean Δr values of the cell's responses (ΔrA and ΔrB) and the variances of those Δr values (σA2 and σB2) according to:
 |
(A d′ value calculated using differing variances for the two populations is often denoted by d′a, but because we did not need to distinguish between this model and a uniform-variance model, the d′ notation was used throughout for simplicity.) Under assumptions of Gaussian distributions and equal variance (which are not strictly satisfied with these data sets), d′ values can be interpreted as an expected percent-correct in a discrimination task: a d′ of 1 corresponds to an expected single-trial accuracy of 76%, while a d′ of 2 predicts an accuracy of 92% (Elliott, 1964). Also note that d′ is non-negative, which implies that even chance-level detection is expected to yield d′ 0 from sampling statistics alone. Typically, in the absence of any actual difference, random guessing should yield d′ ∼1/ for discriminations involving n repeated trials.
The d′ values for the discrimination of stimuli when the concentrations were intermixed were calculated analogously, using the pooled Δr values from both concentrations.
d′ values as a function of time were calculated for each AOB neuron by dividing stimulus responses into 500 ms bins, with bins starting every 10 ms. For each bin, a d′ value for the discrimination of two stimuli was calculated as above (Δr0.5s values represent the firing rate in the 500 ms bin minus the firing rate in the 5 s before stimulus onset). To focus on the role of mitral cell activation (rather than suppression) in signaling stimulus detection, d′ values were set to 0 for bins in which the Δr0.5s in response to the stimulus to be detected (either the noncontrol stimulus or, in the case of the discrimination of male mouse urine (MMU) from female mouse urine (FMU), the stimulus which had resulted in the larger Δr when the entire stimulus period was taken into account) was less than that for the control or comparison stimulus. The d′ value for each 10 ms period was then taken to be the mean of the d′ values calculated for all 500 ms bins including the 10 ms window, so that each point represented an average of 25 different sets of bin edge times.
Comparing the time course of discrimination across cells was done using only the 251 cells obtained from experiments performed after May 2005, from which point the length of tubing connecting the stimulus solutions to the VNO was kept at a fairly consistent short length (so that latency from the stimulus delivery is minimized and approximately constant). These cells were divided into three groups according to their selectivity for MMU versus FMU: cells with a higher Δr in response to MMU than FMU and for which the d′ value for the discrimination of these stimuli, using Δr values based on the entire stimulus delivery period, were >1; cells with a higher Δr in response to FMU than MMU and a d′ value >1; and cells with d′ values <1. Consequently, all cells were included in one of these groups. To find the average time course of discrimination across a group of cells, the time course for each cell was divided by its peak d′ value, the mean time course across the group was determined, and this mean time course was multiplied by the mean of the peak d′ values used in the normalization.
Subadditivity was quantified by computing for each AOB neuron a subadditivity index that represents the discrepancy between the neuron's observed response to a mixed stimulus (where both MMU and FMU are present at 1:300-fold dilution, for a total urine concentration of 1:150 dilution), and what would be expected if the cell's response were a linear sum of its responses to the two stimuli presented independently (each at 1:300-fold dilution); this discrepancy was then scaled by the predicted linear response. As only the increases in firing rate above baseline would be expected to sum linearly, this predicted linear response was taken to be ΔrM + ΔrF + r0, where r0 indicates the baseline firing rate calculated across all trials; when this predicted value is compared with the observed value (Δrmix + r0), the baseline firing rate term drops out of the numerator, leaving:
 |
Similarly, mixture suppression was quantified by comparing, for each AOB neuron, the neuron's Δr in response to a mixed concentration stimulus to the neuron's Δr in response to its preferred stimulus (either MMU or FMU, whichever resulted in a larger Δr for that neurons), according to the following formula:
 |
For the analysis of the relationship of mixture suppression to selectivity for MMU versus FMU, selectivity was calculated by:
 |
The statistical significance of the relationship was assessed using bootstrapping. To determine whether the significant difference in cases of large mixture suppression (see Fig. 5E) depended on the chosen threshold, the analysis was repeated while varying this parameter; statistical significance was found to be consistent for all large magnitude criteria between −0.25 and −0.49 (p < 0.05, two-tailed test). (Criteria restricting analysis to cells with mixture inhibition indices of < −0.49 were not considered, because they result in too few total cells under consideration.) To determine whether the effect was enhanced or diminished by focusing only on the more highly sex-selective cells, this analysis was repeated using only cells with a sex-selectivity index with absolute value >0.1; statistical significance was found to be equal to or greater than when all cells were included (p < 0.05 for all large magnitude criteria between −0.23 and −0.7, and p < 0.01 for large magnitude criteria between −0.23 and −0.48).
Figure 5.

Mixture suppression is common in AOB neurons, particularly those that are selective for MMU. A, Histogram showing subadditivity indices (Isubadditivity, see Materials and Methods) for all 52 cells with sufficient intervals of each stimulus. Negative values indicate subadditivity, while positive values indicate superadditivity. Black indicates cells which showed on average an increase in firing rate in response to both stimuli, while gray indicates cells which showed on average a decrease in firing rate in response to at least one of the two stimuli. B, PSTH of a single AOB neuron showing a subadditive response to the mixture of 1:300 FMU and 1:300 MMU. For this AOB neuron, the response to 1:300 diluted MMU is nearly equal to that to 1:100 diluted MMU, with the response to the mixture lying between these two, suggesting that for this cell, subadditivity might be explained by a saturation of excitation or of firing rate. C, PSTH of a second AOB neuron showing a subadditive response to a mixture of FMU and MMU. For this cell, the response to the mixture is well below the response to 1:300 diluted FMU, ruling out the possibility that this subadditivity could be explained by saturation alone. D, Histogram showing mixture suppression indices (Isuppression, see Materials and Methods) for all 38 cells showing subadditive behavior. Negative values indicate mixture suppression. Colors are as in A. E, Mixture suppression indices plotted as a function of selectivity for FMU; selectivity for MMU is indicated by negative selectivity values. Each point indicates one cell; the highlighted cells indicate the examples shown in B and C, respectively. Small plot on left includes all cells included in D; blow-up on right shows region near and below zero at higher resolution. Most cases of sizable mixture suppression occurred in male-selective neurons (p < 0.05, see Materials and Methods).
To compare the responsivity of the cells in our data set with those reported previously from awake behaving animals (Luo et al., 2003), we calculated for each unit and for each 1:100 dilution stimulus to which it was exposed (MMU and/or FMU) a response index representing the number of excess spikes during the stimulus period normalized by the duration of the stimulus and baseline firing rate:
 |
where nstimulus represents the number of spikes fired during stimulus delivery; ncontrol represents the number of spikes fired during the delivery of the negative control (Ringer's solution), and tstimulus is the duration of stimulus delivery.
Behavior.
Behavioral experiments were performed using 60 sexually naive female B6D2F1/J mice (6 weeks old), 30 male CBA/J mice (8 weeks old), and 30 male BALB/CJ mice (7 weeks old). Mice were pair-housed before mating. Mating was performed by monogamously pairing a single female and a stud male. Females were examined each morning following pairing, and a successful mating was indicated by the presence of a vaginal plug. Upon recognition of a plug, the stud male was separated from the female and the time was designated as day 0 of the pregnancy.
At the beginning of day 1, the female was introduced to a new cage containing bedding that had been soiled with one of the following mixtures: 10 ml of familiar male urine + 10 ml of water, 10 ml of unfamiliar male urine + 10 ml of water, or 10 ml of familiar male urine + 10 ml of unfamiliar female urine. On day 10 females were killed and uteri examined for implantation.
Statistical tests of significance for behavioral data were performed using bootstrap methods (see Fig. 6) (one-tailed test for the comparison of familiar and unfamiliar male urine, two-tailed tests for all other comparisons; however, the statistical significance of our tests relative to a threshold of p = 0.05 is unaltered by switching all one-tailed tests to two-tailed tests). Because many murine behaviors appear to be affected by seasonal differences even in lab mice, when data were combined across experimental runs, the identities of the experimental group were maintained as separate subgroups. Additionally, it was observed that in each experimental run, the last third of female mice to develop a vaginal plug had lower average pregnancy rates regardless of other experimental conditions; because of this, within each experimental run the first two thirds and the last third of mice to display a vaginal plug were considered separate subgroups, as well.
Figure 6.

The pregnancy rate for female mice exposed to a mixture of unfamiliar MMU and FMU is significantly higher than that for females exposed to unfamiliar MMU alone. A, Fraction of female mice who were pregnant following mating with a BALB/c male followed by exposure to urine from either BALB/c males (B/B) or CBA males (B/C), or mating with a CBA male followed by exposure to urine from either BALB/c males (C/B) or CBA males (C/C). Black bars correspond to unfamiliar cues, gray bars to familiar cues. B, Fraction of female mice who were pregnant following exposure to urine from familiar males, unfamiliar males, unfamiliar males mixed with unfamiliar females, and familiar males mixed with unfamiliar females. The pregnancy rate in the group exposed to unfamiliar male urine was significantly different from that in the groups exposed to familiar male urine (p = 0.006) or unfamiliar male urine plus unfamiliar female urine (p = 0.003), but there was no significant difference between the pregnancy rates in the groups exposed to familiar male urine and the groups exposed to unfamiliar male urine plus unfamiliar female urine (p = 0.477), or to familiar male urine and unfamiliar female urine (p = 0.35). *p < 0.05; **p < 0.01; N.S., p > 0.05.
To test whether the maintenance of experimental subgroups affected the outcomes of our analyses, all statistical tests were performed twice, once with the assignment of each data point to an individual subgroup (defined by experimental run and whether the female was among the first 2/3 or the last 1/3 of mice within that run to have a vaginal plug identified) maintained during resampling, and once with the subgroups collapsed together; no substantial differences in the results were observed. p-values cited in the text are from collapsed subgroups.
Definitions of key terms.
By laterally connected inhibition, we mean inhibition that occurs between two different processing streams—specifically from receptor types with different affinities. Self-inhibition refers to inhibition that arises from activation of a single receptor type onto mitral cells that receive excitatory input from that receptor type. Both periglomerular and granule cells could contribute to either or both types of inhibition (Shipley and Ennis, 1996). Subadditivity means a response to a mixture of stimuli that is smaller than the sum of responses to each individually (Eq. 2). Mixture suppression means a response to a mixture that is smaller than the response to the preferred stimulus on its own (Eq. 3).
Results
We developed a novel preparation (see also Holekamp et al., 2008) that allowed electrophysiological recording from the mouse AOB while delivering chemical stimuli under controlled conditions (Fig. 1). Adult female mice were anesthetized, fitted with an endotracheal tube, and mechanically ventilated. A thin polyimide tube was threaded through the nares under visual guidance (see Materials and Methods) into the lumen of the VNO. Liquid-phase stimuli (as is appropriate for the VNO, Luo and Katz, 2004) were delivered through this tube in pseudo-random sequences, with a flush solution supplied between different stimuli so that the total fluid flow out of the stimulus tube was constant. The neural activity from the mitral cell layer of the AOB was recorded using a single glass electrode, inserted through a craniotomy superfused continuously with ACSF.
Extracellularly recorded action potentials of AOB neurons were often large in amplitude (≈1 mV) (Fig. 2A), and sometimes had a distinctive bifurcated waveform shape (Fig. 2B). This bifurcation may be a consequence of multiple spike initiation zones (Chen et al., 2002), a phenomenon that has been documented in AOB mitral cells (Urban and Castro, 2005). Localization of the recording site was based on visual guidance, the depth of penetration into the tissue, and the electrophysiological characteristics of the recordings (see Materials and Methods); localization was confirmed by histological methods in a subset of cells (n = 26) (Fig. 2C). All 26 of these sites were in the mitral cell layer, suggesting that most or all of the recordings reported here were from mitral cells.
For 14 of the 26 cells examined histologically, the 3-dimensional spatial position was determined in normalized coordinates (see Materials and Methods). The cells showed a strong tendency to cluster both anteriorly and laterally, with 12 of the 14 cells located in the anterior 35% of the AOB and all but one of the 14 cells located in the lateral half of the AOB (supplemental Fig. S2, available at www.jneurosci.org as supplemental material). These tendencies mirror the anatomical distribution of mitral cells within the AOB (Yonekura and Yokoi, 2008).
General features of mitral cell stimulus responses
Recordings were made from 310 isolatable single units. Baseline firing rates typically ranged from 0.6–2.3 Hz (inner quartile range; 9 had no observable baseline firing). AOB neurons responded to stimulation with natural, pheromone-containing stimuli (urine from male and female mice, diluted 1:100 in Ringer's solution; see Materials and Methods) by altering their firing rates. Responses of single units to 20 s stimulus presentations included both increases (Fig. 2D) and decreases (Fig. 2E) in firing rate compared with either the period preceding stimulus delivery or the response to a negative control (Ringer's solution). Responses were reproducible across trials over periods of up to 8 h, with typical recordings lasting for 2–3 h.
Many AOB neurons showed differential responses to dilute male (MMU) and female (FMU) mouse urine. In some cases the response to MMU and FMU were in opposite directions (Fig. 2F); in other cases they were in the same direction but of different magnitude and/or time course (Fig. 2G).
As a simple quantitative comparison of the responses to different stimuli, we calculated the change Δr in average firing rate upon stimulation, and tested its significance using a t test across repeated trials (see Materials and Methods). For Figure 2, F and G, for example, the urine responses could be easily distinguished from responses to the control (with p-values ranging from 0.0001–0.01); responses to MMU could also be distinguished from those to FMU (F: p < 0.0001; G: p < 0.03). Because of the low baseline firing rates, even relatively modest (few Hz) Δr values can correspond to very reliable responses. For inhibitory responses, this can be taken to the extreme, as in the example of Figure 2E, in which a Δr of just −0.24 Hz can be reliably distinguished from the negative control (p = 0.016).
When the concentration of the stimulus was reduced through dilution, the Δr values of units generally decreased monotonically, as in the example shown in Figure 2H (see also supplemental Fig. S1, available at www.jneurosci.org as supplemental material). Even when the dilution was only increased from 1:100 to 1:300 the average magnitude of responses dropped off by ∼20%, and larger drop-offs were seen at 1:1000 or higher dilutions. Responses to MMU generally dropped off more quickly than those to FMU, especially at higher dilutions (supplemental Fig. S1, available at www.jneurosci.org as supplemental material).
Systematic analysis of stimulus selectivity
Behavioral evidence demonstrates that the AOS is capable of mediating the discrimination of MMU from FMU (Dulac and Torello, 2003; Halpern and Martinez-Marcos, 2003; Luo and Katz, 2004). To learn more about the neural basis for this discrimination, we explored the extent and reliability of AOB neurons' selectivity for these stimuli. Of the 189 cells for which at least 4 trials of both FMU and MMU were recorded, 65 cells (34%) were found to be responsive to at least one of the two stimuli at a level of p < 0.01. Of these, 47 were responsive to FMU (37 with Δr >0 and 10 with Δr <0) and 41 were responsive to MMU (30 with Δr >0 and 11 with Δr <0). When responses to MMU were compared with responses to FMU for each neuron, nearly all possible combinations of joint MMU and FMU responsivity were observed (Fig. 3A). Despite this variety, AOB neurons' joint MMU/FMU responsivities did not appear to be distributed evenly across the potential space of joint responsivities, but rather to be biased toward responding to one stimulus without responding to the other, i.e., clustered along the axes. We chose to explore this possibility in the context of discrimination.
Figure 3.

The single-trial responses of many AOB neurons are sufficient to discriminate FMU from MMU over a range of concentrations. A, Changes in firing rate in response to MMU plotted against the changes in firing rate in response to FMU for 54 urine-responsive (p < 0.01; see Materials and Methods) AOB neurons. AOB neurons display all combinations of increases and decreases in firing rate in response to FMU and MMU, with some tendency to be selective for a single stimulus. Each point represents one cell; error bars indicate SEM. B, Reliability of single neurons' single-trial responses for the discrimination of high-K+ solution from control, averaged across a population of neurons and plotted as a function of time relative to stimulus onset. Cells are grouped according to their overall selectivity for FMU versus MMU (see Materials and Methods). Note that chance detection corresponds to d′ ≥ 0 because d′ takes the scaled absolute value of any differences, even those arising from sampling statistics (see Materials and Methods). C, Time course of discrimination of a neuron's preferred urine stimulus (1:100 FMU or 1:100 MMU, whichever produced the larger positive Δr for that cell) from control; plotting as in B. D, Time course of discrimination of 1:100 FMU from 1:100 MMU; plotting as in B. E, Histogram showing the d′ values for all 65 cells with at least 3 stimulus presentations for both FMU and MMU and a response (p < 0.01) to at least one of the two stimuli. Vertical red lines indicate d′ values of 1 and 2. 41 cells (55%) had a d′ >1 (corresponding to correct single-trial discrimination ∼ 76% of the time, see Materials and Methods), and 23 cells (31%) had a d′ > 2 (92% correct discrimination). F, d′ values for 1:300 diluted stimuli plotted against d′ values for 1:100 diluted stimuli; each point represents one cell. Black line indicates the expected locations if the d′ values at the two concentrations are equal; red line indicates the least squares estimate of the average slope (95% confidence interval given by dashed lines). Of 34 cells tested with at least 3 stimulus presentations at 1:300 diluted, 18 (53%) had a d′ >1, and 5 (15%) had a d′ >2. G, d′ values for stimuli at an unknown concentration (see Materials and Methods) plotted against d′ values for 1:100 diluted stimuli. The estimated slope is not 39 cells, 17 (50%) had d′ values >1, and 5 (15%) had d′ values >2.
Olfactory sensory discrimination has often been investigated in terms of stimulus recognition by neuronal ensembles (Laurent et al., 2001; Friedrich, 2006; Koulakov et al., 2007). The tendency of many AOB neurons to respond relatively specifically to either MMU or FMU suggests, however, that in this system, the single-trial responses of individual AOB neurons may suffice for discrimination between these behaviorally relevant stimuli. (This possibility does not exclude population-based discrimination, and indeed tasks more difficult than male/female discrimination might require population measures.) Accurate discrimination requires that the difference between the responses to the two stimuli exceed their trial-to-trial variability; consequently, discriminability is conventionally quantified by a metric, d′, which scales the difference between the mean responses by the combined SD (see Materials and Methods).
In some olfactory systems, responses and discriminability have been shown to change substantially over the time course of the response to stimuli (Friedrich and Laurent, 2004; Mazor and Laurent, 2005); consequently, we first calculated the time course of discriminability for AOB neurons' responses to urine and high K+ (see Materials and Methods). Average d′ values as a function of time are shown for three groups of cells: FMU-preferring cells, MMU-preferring cells, and cells without strong selectivity for either urine stimulus (Fig. 3B,D).
For the discrimination of high-K+ solution from control, the mean d′ values for all three groups of cells rose almost immediately upon opening of the stimulus valve, although they continued to rise for several more seconds (Fig. 3B). In contrast, d′ values for the discrimination of urine stimuli from control, or for the discrimination of MMU from FMU, did not exceed baseline values for 800–1000 ms after stimulus onset (Fig. 3C,D). A similar delay between high-K+ and urine stimuli has been seen at the level of the sensory neurons in the VNO (Holy et al., 2000).
After rising following the onset of stimulus, mean d′ values generally remained high throughout the period of stimulus delivery. FMU- and MMU-selective neurons showed relatively similar ability to discriminate, with a slightly higher average discriminability for FMU-preferring neurons, particularly in the early phase of the response. Because discriminability remained high throughout the stimulus period, we subsequently analyzed discriminability on a cell-by-cell basis by pooling spikes from the entire stimulus period.
Individual AOB neurons displayed a range of d′ values for the discrimination of MMU from FMU at 1:100 dilution (Fig. 3E). Some encoded sex very reliably: 31% of the cells had a d′ >2, corresponding to ∼92% correct (see Materials and Methods). At a slightly lower concentration (1:300 dilution), no statistically significant falloff in discriminability was seen.
For a behaving animal, stimuli must most often be identified when their concentration is unknown. Because the response to a preferred stimulus at a low concentration must now be distinguished from the response to a less-preferred stimulus at a high concentration, this task has the potential to be significantly harder than discrimination at a single, known concentration. However, we hypothesized that the substantial stimulus selectivity of individual AOB neurons might make such discriminations feasible. Indeed, when the responses to 1:100 and 1:300 dilutions were pooled, across the population there was no statistically significant falloff in discrimination (mean difference is 0.045 d′ units, p = 0.55) (Fig. 3G). These results demonstrate that, even with some ambiguity about concentration, accurate discrimination of sex may be made on the basis of the single-trial responses of individual AOB neurons, suggesting the presence of some degree of concentration-invariant stimulus selectivity at this stage of the AOS.
Effects of inhibition blockade on AOB neuron stimulus responses
To directly test the role of inhibition in crafting AOB neuron responses, we recorded stimulus responses before and during the application of the GABAA blocker bicuculline. Bicuculline was applied to the AOB at 200 μm through addition to the ACSF used as a superfusate (Fig. 1A).
The application of bicuculline resulted in an increase in the firing rates of AOB neurons, particularly during periods of stimulus presentation. Figure 4A shows an example of a cell where the baseline firing rate showed no significant change during the drug period compared with before the drug period (0.42 ± 0.05 Hz vs 0.45 ± 0.10 Hz, mean ± SEM, respectively). The average firing rate during the application of high-K+ solution, however, increased significantly, from 1.1 ± 0.1 Hz to 4.2 ± 1.2 Hz (p = 0.036). The inhibition of the cell by FMU was also abolished (mean firing rate during the presentation of FMU rose from 0.07 ± 0.02 Hz to 0.51 ± 0.23 Hz, which is not significantly different from baseline, p = 0.69). It is interesting to note that the significant dip in firing rate that occurred several seconds into high-K+ solution stimulation in the predrug period was entirely absent during the drug period, consistent with it being the result not of intrinsic cellular dynamics but of either lateral- or auto-inhibitory processes.
Figure 4.

Bicuculline alters the responses and selectivity of AOB neurons. A, PSTHs showing the stimulus responses of a single cell before and during the application of bicuculline. Bicuculline increased the cell's response to high-K+ solution (note change in y-axis scale between left and right), and removed FMU-induced inhibition. B, PSTHs for a cell that was highly selective for MMU before bicuculline application, showing an increase in the response to MMU during drug application without a commensurate increase in the response to FMU. C, D, PSTHs for cells which showed intermediate selectivity for MMU (C) or FMU (D) before the application of bicuculline, showing a significant drop in selectivity during drug application. E, Δr values in response to the presentation of high- K+ solution during versus before the drug period. Each point indicates one cell; black points are cells for which bicuculline was added to the superfusate during the drug period, while gray points are cells for which a negative control was added to the superfusate (see Materials and Methods). Cell highlighted in blue correspond to example cell shown in A. F, Mean firing rates in response to negative control stimulus during versus before the drug period. Cells highlighted in blue correspond to example cells shown in B–D. G, Comparison of d′ before and during application of bicuculline. Each point represents one cell, with statistically significant (p < 0.05) changes in d′ shown with a larger marker. Labels indicate the examples shown in B–D. H, Comparison of d′ before and during mock trials that used only ACSF (negative control).
The preferential effect of bicuculline on stimulus periods seen in Figure 4A was consistent across the population of 20 cells recorded under these conditions (Fig. 4E,F). Responses to high- K+ solution increased substantially (1.83 ± 0.54 Hz, p < 0.01), while baseline firing rates were increased more modestly (mean increase in Δr was 0.41 ± 0.32 Hz, p = 0.045). In contrast, a set of 17 control neurons, recorded under similar conditions with bicuculline-free superfusion, showed no such changes (Fig. 4E,F, gray points).
Bicuculline also substantially affected the sex selectivity of AOB neurons, but the nature of the effect varied across the population (Fig. 4G). For several neurons with high selectivity in the absence of bicuculline, firing rates became larger and more sustained in the presence of bicuculline, without revealing any new response to the nonpreferred stimulus (see example in Fig. 4B). In such cases, selectivity presumably arises through the receptor neurons that provide excitation to these cells. In contrast, for the cases in which a neuron showed substantial excitatory responses to both stimuli, as well as for cases where a neuron showed an inhibitory response to one of the stimuli, bicuculline caused enhanced excitatory responses but a decrease in selectivity (see examples in Fig. 4C,D, also G). Control experiments, in which ACSF was used instead of bicuculline, showed far smaller changes in discriminability (Fig. 4H). The magnitude of the bicuculline effect varied considerably across cells, and because of this variability the mean value was not significantly different from control experiments. Overall, though, 14/20 cells treated with bicuculline showed a decrease in selectivity, as opposed to only 4/13 control cells (p = 0.002). Whether bicuculline exerts its effects through stimulus-selective inhibitory circuitry, or through modulation of overall excitability and neuronal saturation, these results indicate a role for inhibition in the sex selectivity of AOB mitral cells.
Responses to mixtures of MMU and FMU
To gain further insight into the mechanisms of discrimination and the degree to which inhibition is lateral, we examined the responses of AOB neurons to stimuli that are intermediate between two categories. Such stimuli can be produced using mixtures (Uchida and Mainen, 2003; Abraham et al., 2004; Guo and Holy, 2007). We therefore examined the cells' responses to 1:300 diluted MMU, 1:300 diluted FMU, and to a stimulus that contained both 1:300 diluted MMU and 1:300 diluted FMU (for a total urine concentration of 1:150).
The responses to this mixed stimulus were first compared with a simple additive model, where the Δr in response to a mixed stimulus is expected to be the sum of the Δr values seen in response to each component. For the majority of cells (38/52, or 73%), including nearly all which showed excitatory responses to both unmixed stimuli, the response to the mixture was smaller than predicted from the linear sum (Fig. 5A). Such “subadditivity” could be produced by at least two plausible mechanisms, acting alone or in concert. First, the responses of AOB neurons might saturate (Fig. 5B), a possibility consistent with the sublinearity of most AOB neurons' responses to variations in stimulus concentration over this range (supplemental Fig. S1, available at www.jneurosci.org as supplemental material). Second, the nonpreferred stimulus might also contribute inhibition, the true strength of which might in these cases not be revealed without the additional excitation from the preferred stimulus (Fig. 5C). For example, inhibition might be masked by the fact that firing rates cannot be negative, or might primarily act to shunt excitatory input currents along the primary dendrite (Koch, 1999).
To determine whether saturation can account for the observed extent of subadditivity, or whether inhibition might also be contributing, for each AOB neuron that demonstrated subadditivity we compared the mixture response to that of the preferred stimulus alone (Fig. 5D). Surprisingly, the large majority (34/38) of these neurons showed a smaller response to the mixture than to their preferred stimulus alone, indicating that the net effect of adding the nonpreferred stimulus was inhibitory. We call this phenomenon “mixture suppression.” Thus, the contribution of inhibition appears to be far more widespread than might be deduced from the responses to individual natural stimuli (Fig. 3A).
To determine whether inhibition correlates with the selectivity of a given AOB neuron, we examined the relationship between a cell's sex selectivity and its response to the mixture (Fig. 5E). In particular, because VNO recordings reveal a greater abundance of female-selective neurons (Holy et al., 2000; Stowers et al., 2002; Holekamp et al., 2008; He et al., 2008, and unpublished observations), but AOB recordings display a more balanced selectivity (Fig. 3A), we hypothesized that inhibition might play a greater role for male-selective AOB neurons. As predicted, most cases of sizable mixture suppression occurred in male-selective neurons, as can be seen by plotting the degree of mixture suppression versus sex selectivity for each neuron (Fig. 5E). Of neurons with a positive Δr in response to at least one stimulus, the fraction showing strong mixture suppression (Δr, see Materials and Methods) was significantly larger for male-selective neurons (9/20) than for female-selective neurons (4/23, p < 0.05; see Materials and Methods). Thus, this analysis suggests that a sizable portion of male-selective neurons in particular may achieve their stimulus selectivity in part through contributions of inhibition.
A minority of cells (14/52, or 27%) demonstrated a larger response to the mixture than predicted from the linear sum (Fig. 5A). In all but one of these cases, these were cells for which the Δr in response to at least one of the two unmixed stimuli was negative. Therefore, one possible explanation for this phenomenon is “inhibition of inhibition”: neurons that inhibited the recorded cell were themselves inhibited by the mixture, allowing a stronger response by the recorded cell to the mixture. Alternatively, a few (not all) of these “superadditive” cells had very small responses, and for these superadditivity could have simply been an artifact of noise.
Behavioral evidence for opponency in the detection of MMU and FMU
The physiological phenomenon of mixture inhibition is an example of an oppositional interaction, where the presence of one stimulus feature inhibits the response to another stimulus feature. In some cases, oppositional neural interactions are correlated with opponency in behavioral discrimination. Well-known examples in other sensory systems include color opponency, where red and green color channels inhibit each other so that there is no color recognized as “reddish-greenish” (Hering, 1920; Hurvich and Jameson, 1957); similarly, native English speakers distinguish between /r/and/l/in an opponent (or antagonistic) manner (Iverson and Kuhl, 1996). We investigated the potential for such oppositional interaction in a well characterized behavior known as pregnancy block (for review, see Brennan and Keverne, 1997). In this effect, also known as the Bruce Effect, the exposure of a recently mated female mouse to urine from an “unfamiliar” male mouse (a mouse of a different strain than the stud male) is able to cause a high rate of pregnancy loss; exposure to urine from a familiar male mouse or from a female mouse, however, does not cause an increased rate of pregnancy loss (Bruce and Parrott, 1960; Bruce, 1965). Activity within the AOB appears to be both necessary and sufficient for this behavioral effect (Kaba and Nakanishi, 1995): when activity in the AOB is blocked, the pregnancy block is prevented (Kaba et al., 1989); when broad activity in the AOB is stimulated pharmacologically or electrically, pregnancy loss can be triggered directly (Kaba et al., 1989; Li et al., 1994).
Although the mechanism by which male mouse urine and female mouse urine are distinguished in this behavior is unknown, one might expect there to be a compound or a set of compounds present in male mouse urine whose presence is required for pregnancy block to occur. In contrast, the above physiological findings raise the possibility that recognition of “maleness” may depend at least in part on the absence of female cues, rather than the presence of male cues alone.
To distinguish between these possibilities, we compared the efficacy of MMU alone in triggering pregnancy block to that of a mixture of unfamiliar MMU and FMU. We first showed that pregnancy block could be triggered solely by urine applied to the bedding, without exposure to a live male. Pooling all matings and exposures, the overall tendency to retain a pregnancy did not depend (p = 0.5) on whether the mating male was CBA or BALB/c (Fig. 6A). Consistent with previous observations (Bruce and Parrott, 1960), females exposed to urine from unfamiliar males showed approximately two-fold lower pregnancy rates than females exposed to urine from familiar males (Fig. 6B) (significance of difference p < 0.01, n = 28 in each group). The strain dependence was approximately symmetric, with a trend for CBA males to be slightly more effective in blocking BALB/c pregnancies than vice versa (Fig. 6A) (CBA blocks BALB/c, p = 0.01; BALB/c blocks CBA, p = 0.06). For the remaining analyses, we pooled results into familiar/unfamiliar groupings independent of the particular strain.
For females exposed to a mixture of unfamiliar male and female mouse urine (Fig. 6B), the pregnancy rate was significantly higher than that for females exposed to unfamiliar male mouse urine alone (p < 0.01, n = 22 in each group). In fact, there was no statistically significant difference between the rate of maintained pregnancy in the group exposed to female mixed with unfamiliar male urine compared with the group exposed to familiar male urine alone (p = 0.48, n = 22 for mixed stimulus and 28 for unmixed). Finally, to test whether FMU exerted a general enhancement in retention of pregnancies, we also compared the rate of maintained pregnancy in the group exposed to familiar male mouse urine alone to the rate of maintained pregnancy in a group exposed to familiar male urine plus female mouse urine; no statistically significant difference between these groups was found (p = 0.35, n = 22 for mixed stimulus and 28 for unmixed).
Thus, female cues strongly oppose the block induced by unfamiliar male cues. This result is counterintuitive in terms of the conventional view that this behavior is the result of distinguishing between familiar and unfamiliar cues. It is, however, consistent with our electrophysiological observation that the activity of AOB neurons' response to male cues can be inhibited by the presence of female cues.
Discussion
The most well known examples of laterally connected inhibitory networks are in sensory systems such as vision and touch, where there is an inherently spatial component to the incoming sensory information, and where this spatial component is one that is expected to carry significance for the organism in its interpretation of the information. In these systems, hypotheses about the functions of laterally inhibitory networks have focused primarily on mechanisms by which this circuitry can carry out spatially oriented “preprocessing” tasks such as contrast enhancement or edge-detection (Hartline, 1942; Mountcastle and Darian-Smith, 1968). It has long been known that laterally connected inhibitory circuitry reminiscent of the early visual system is found in the olfactory system (Shipley and Ennis, 1996; Haberly, 1998), and its role in olfaction has been theorized to be conceptually similar to its proposed role in vision (Urban, 2002). However, also on theoretical grounds it has been observed that such “preprocessing” may not provide computational advantages in a setting, like olfaction, which lacks a simple low-dimensional spatial organization (Laurent, 1999). Instead, local inhibitory circuitry in this context has been proposed to function mainly in setting the precision of spike timing and synchrony (Laurent, 1999; Brody and Hopfield, 2003), or as a mechanism for globally and nonspecifically regulating the total level of activity as stimulus concentration varies (Urban, 2002). Finally, in the AOS, inhibition has been proposed to play a major role in learning (Brennan and Keverne, 1997). Aside from questions about function, recent experimental studies of the mammalian MOS have come to somewhat differing views about even the prevalence and scale of lateral inhibition (Kashiwadani et al., 1999; Luo and Katz, 2001; Urban, 2002; Aungst et al., 2003; Linster and Cleland, 2004; McGann et al., 2005; Vuciniæ et al., 2006; Arenkiel et al., 2007; Davison and Katz, 2007). One possible explanation is that the effects of inhibition are at least partially gated by activity (Arevian et al., 2008), implying that its contributions may depend on the experimental paradigm. These diverse proposals and observations highlight the need for greater understanding of inhibition in the processing of natural stimuli.
This work used a novel experimental preparation to explore the role of laterally connected inhibitory circuitry in the accessory olfactory system of the anesthetized mouse. AOB neurons were observed to respond to natural stimuli and be highly selective for sex-specific cues. Much of this selectivity apparently arose from the properties of the receptor neurons themselves. But by several measures, inhibition was found to be widespread in the AOB, with a significant impact on both the basic stimulus response properties of AOB neurons and the selectivity of the neurons for natural stimuli. Experiments with mixtures of stimuli (Fig. 5) also suggested that laterally connected inhibition may play a larger role in shaping the stimulus selectivity of male- than female-selective neurons. Together, these findings led to the surprising prediction that the addition of female cues to male cues may diminish the recognition of male cues by the AOS. For the phenomenon known as pregnancy block (or Bruce Effect), this prediction was confirmed, indicating a likely behavioral significance of lateral inhibition in the AOB.
Neural activity in the anesthetized preparation: comparison to awake recordings
In mice, the spiking responses of AOB neurons to stimuli have been previously reported only once, in the context of freely exploring awake behaving mice (Luo et al., 2003). The anesthetized preparation presented here has a number of advantages over this previous approach. First, the direct application of stimulus to the VNO allows control over the concentration, duration, and identity of the stimulus; it is this control that allows a particular stimulus to be presented repeatedly so that the reliability of responses can be assessed. The anesthetized preparation also allows the circuitry of the AOB to be manipulated pharmacologically, and stimulus responses during such manipulation to be compared with the responses before drug application.
One advantage of the awake behaving experiments, however, is that they reveal the patterns of responses in the conditions in which we know the system is actually used. Comparing the responses observed in the anesthetized preparation with what has been reported for the awake behaving animals reveals some differences; in particular, the reported baseline firing rates in the awake preparation (2–5 Hz) appear to be somewhat higher, on average, than the baseline firing rates we observed (see Results). Some of this difference may be due selection bias: Luo et al. identified units based on spontaneous activity, whereas we used pulses of high-K+ solution (see Materials and Methods), allowing the isolation of units with very low or absent baseline firing rates (e.g., 23 units, or 8%, had baseline firing rates off <0.2 Hz). Alternatively, the presence of anesthesia or factors associated with the lack of concurrent stimulation from other sensory systems may have led to lower baseline firing rates in our preparation. The level of stimulus responsivity, however, is similar: from a population of 43 single units exposed to an average of just >5 stimuli each, Luo et al. found that in 11% of these stimulus exposures a ‘strong’ excitatory response was observed, while in 10% of these stimulus exposures a ‘strong’ inhibitory response was observed. Analyzing our data using a similar metric (see Materials and Methods), we find that, from our 310 single units' 541 pairings with either 1:100 diluted MMU or FMU, 23% of responses are classified as ‘strong’ excitatory responses, while 13% are classified as ‘strong’ inhibitory responses.
These relatively modest differences between the awake and anesthetized AOS are in sharp contrast to recent findings in the main olfactory system, where the proportion of responses to stimuli varies dramatically with anesthesia (Rinberg et al., 2006). One likely explanation is that the main olfactory bulb receives extensive input from cortical areas (Meisami and Bhatnagar, 1998; Singer et al., 2007), whose activity is presumably strongly affected by anesthesia, whereas the AOB receives relatively little centrifugal input (Brennan and Keverne, 1997; Meisami and Bhatnagar, 1998).
Contribution of laterally connected inhibition to neuronal selectivity
As revealed by the effects of bicuculline, inhibition contributed to an enhancement of sex selectivity, although the degree of this enhancement varied across cells (Fig. 4). One natural interpretation of this result is that bicuculline blocks laterally connected inhibition, thus leading to a decrease in selectivity. However, the bicuculline experiments by themselves do not exclude a different possibility, that the effect of bicuculline is caused through decreasing self inhibition, leading to a general increase in neuronal excitability coupled with firing-rate saturation.
More direct evidence specifically for laterally connected inhibition was obtained from experiments on mixture inhibition, in which the presence of a less-preferred stimulus decreased the size of the response to a simultaneously presented preferred stimulus. While it cannot be ruled out that this mixture suppression occurs at the receptor level, convincing inhibitory responses to urine stimuli have not been seen in thousands of recordings from the VNO (Nodari et al., 2008).
These experiments also provided evidence for a somewhat asymmetric role of inhibition, in that male-selective neurons were more strongly inhibited by mixtures than were female-selective neurons (Fig. 5E). In this context, it may be relevant to note that recordings from the VNO have demonstrated a substantially stronger overall response to FMU than to MMU (Holy et al., 2000; Stowers et al., 2002; He et al., 2008; Holekamp et al., 2008), an imbalance that seems not to be repeated in the AOB (Fig. 3A). While we cannot exclude the possibility that the difference between these two stages in the pathway is a consequence of recording bias, it is also possible that the asymmetry in inhibition might be a circuit mechanism that compensates for this imbalance in VNO neuron selectivity.
Behavioral relevance of laterally connected inhibition in the AOB
For many sensory systems in which physiologic evidence of lateral inhibition is observed, behavioral discrimination tasks show evidence of oppositional interactions between stimuli (Hering, 1920; Sperling and Mills, 1991). By themselves, psychophysical experiments do not determine whether the relevant inhibition occurs at a particular site in the brain; nevertheless, these experiments provide insight about and constraints on the behavioral significance of physiological observations.
For tasks depending primarily on the AOS, previous evidence for oppositional stimulus interactions is limited. One study (Clancy et al., 1988) found that the surge in luteinizing hormone (LH) observed in males upon exposure to female urine could be suppressed by including male urine in the stimulus, consistent with a role in opposing the recognition or action of female cues. This hormonal surge may (Coquelin et al., 1984) or may not (Pfeiffer and Johnston, 1994) rely exclusively on the accessory olfactory system. A recent study that examined the ultrasonic singing behavior of male mice when presented with FMU found no evidence that this behavior is antagonized by the addition of MMU to the stimulus (Guo and Holy, 2007). However, it seems possible that the presence or absence of opponency might depend on the specific behavioral task. The electrophysiological finding that laterally connected inhibition plays a somewhat larger role in shaping mitral cell selectivity for male cues than for female cues, thus, suggested that oppositional interactions might be most readily observable in a task that depends on the recognition of male cues.
We chose to test this prediction in the context of a behavior where the outcome— pregnancy loss—is triggered by the detection of MMU via increases in mitral cell firing rates (Brennan and Keverne, 1997). As expected from previous studies, the exposure of recently mated females to the urine of unfamiliar male mice caused a significantly higher rate of pregnancy loss than exposure to the urine of familiar male mice. But we also found that this effect was entirely prevented by the additional inclusion of female mouse urine, demonstrating that FMU opposes the effect of MMU.
If pregnancy block is viewed as a product of an abstract pattern-matching circuit that detects differences between a presented stimulus and the stored template, this result is unexpected, because the addition of unfamiliar female cues would be predicted to be at least as unfamiliar as male urine alone. From a more mechanistic perspective, the addition of unfamiliar female mouse urine would, in the absence of significant lateral inhibition, also be expected to produce no less block-inducing activity than unfamiliar male mouse urine alone (Brennan and Keverne, 1997). In contrast, the behavioral result is consistent with predictions based on our observation of opponency between male- and female-selective neural pathways, and suggests a direct role for lateral inhibition in the processing of behaviorally relevant stimuli.
Footnotes
This work was supported by the Pew Scholars Program (T.E.H.), the G. Harold and Leila Y. Mathers Foundation (T.E.H.), and a National Institute on Deafness and Other Communication Disorders predoctoral National Research Service Award (F30) (R.C.H.). Terrence Holekamp gave advice in developing the in vivo recordings. We thank Dora Angelaki, Greg DeAngelis, Paul Gray, Steve Mennerick, Larry Snyder, and the anonymous reviewers for comments on this manuscript.
References
- Abraham NM, Spors H, Carleton A, Margrie TW, Kuner T, Schaefer AT. Maintaining accuracy at the expense of speed: stimulus similarity defines odor discrimination time in mice. Neuron. 2004;44:865–876. doi: 10.1016/j.neuron.2004.11.017. [DOI] [PubMed] [Google Scholar]
- Arenkiel BR, Peca J, Davison IG, Feliciano C, Deisseroth K, Augustine GJ, Ehlers MD, Feng G. In vivo light-induced activation of neural circuitry in transgenic mice expressing channelrhodopsin-2. Neuron. 2007;54:205–218. doi: 10.1016/j.neuron.2007.03.005. [DOI] [PMC free article] [PubMed] [Google Scholar]
- Arevian AC, Kapoor V, Urban NN. Activity-dependent gating of lateral inhibition in the mouse olfactory bulb. Nat Neurosci. 2008;11:80–87. doi: 10.1038/nn2030. [DOI] [PMC free article] [PubMed] [Google Scholar]
- Aungst JL, Heyward PM, Puche AC, Karnup SV, Hayar A, Szabo G, Shipley MT. Centre-surround inhibition among olfactory bulb glomeruli. Nature. 2003;426:623–629. doi: 10.1038/nature02185. [DOI] [PubMed] [Google Scholar]
- Brennan PA, Keverne EB. Neural mechanisms of mammalian olfactory learning. Prog Neurobiol. 1997;51:457–481. doi: 10.1016/s0301-0082(96)00069-x. [DOI] [PubMed] [Google Scholar]
- Brody CD, Hopfield JJ. Simple networks for spike-timing-based computation, with application to olfactory processing. Neuron. 2003;37:843–852. doi: 10.1016/s0896-6273(03)00120-x. [DOI] [PubMed] [Google Scholar]
- Bruce HM. Effect of castration on the reproductive pheromones of male mice. J Reprod Fertil. 1965;10:141–143. doi: 10.1530/jrf.0.0100141. [DOI] [PubMed] [Google Scholar]
- Bruce HM, Parrott DM. Role of olfactory sense in pregnancy block by strange males. Science. 1960;131:1526. doi: 10.1126/science.131.3412.1526. [DOI] [PubMed] [Google Scholar]
- Chen WR, Shen GY, Shepherd GM, Hines ML, Midtgaard J. Multiple modes of action potential initiation and propagation in mitral cell primary dendrite. J Neurophysiol. 2002;88:2755–2764. doi: 10.1152/jn.00057.2002. [DOI] [PubMed] [Google Scholar]
- Clancy AN, Singer AG, Macrides F, Bronson FH, Agosta WC. Experiential and endocrine dependence of gonadotropin responses in male mice to conspecific urine. Biol Reprod. 1988;38:183–191. doi: 10.1095/biolreprod38.1.183. [DOI] [PubMed] [Google Scholar]
- Coquelin A, Clancy AN, Macrides F, Noble EP, Gorski RA. Pheromonally induced release of luteinizing hormone in male mice: involvement of the vomeronasal system. J Neurosci. 1984;4:2230–2236. doi: 10.1523/JNEUROSCI.04-09-02230.1984. [DOI] [PMC free article] [PubMed] [Google Scholar]
- Davison IG, Katz LC. Sparse and selective odor coding by mitral/tufted neurons in the main olfactory bulb. J Neurosci. 2007;27:2091–2101. doi: 10.1523/JNEUROSCI.3779-06.2007. [DOI] [PMC free article] [PubMed] [Google Scholar]
- Dulac C, Torello AT. Molecular detection of pheromone signals in mammals: from genes to behaviour. Nat Rev Neurosci. 2003;4:551–562. doi: 10.1038/nrn1140. [DOI] [PubMed] [Google Scholar]
- Elliott PB. Tables of d′. In: Swets JA, editor. Signal detection and recognition by human observers. New York: Wiley; 1964. p. 681. [Google Scholar]
- Friedrich RW. Mechanisms of odor discrimination: neurophysiological and behavioral approaches. Trends Neurosci. 2006;29:40–47. doi: 10.1016/j.tins.2005.10.004. [DOI] [PubMed] [Google Scholar]
- Friedrich RW, Laurent G. Dynamics of olfactory bulb input and output activity during odor stimulation in zebrafish. J Neurophysiol. 2004;91:2658–2669. doi: 10.1152/jn.01143.2003. [DOI] [PubMed] [Google Scholar]
- Guo Z, Holy TE. Sex selectivity of mouse ultrasonic songs. Chem Senses. 2007;32:463–473. doi: 10.1093/chemse/bjm015. [DOI] [PubMed] [Google Scholar]
- Haberly LB. Olfactory cortex. In: Shepherd GM, editor. The synaptic organization of the brain. Oxford UP: 1998. pp. 377–416. Chap 10. [Google Scholar]
- Halpern M. The organization and function of the vomeronasal system. Annu Rev Neurosci. 1987;10:325–362. doi: 10.1146/annurev.ne.10.030187.001545. [DOI] [PubMed] [Google Scholar]
- Halpern M, Martinez-Marcos A. Structure and function of the vomeronasal system:an update. Prog Neurobiol. 2003;70:245–318. doi: 10.1016/s0301-0082(03)00103-5. [DOI] [PubMed] [Google Scholar]
- Hartline HK. The neural mechansim of vision. The Harvey Lectures. 1942 Ser 37. [Google Scholar]
- He J, Ma L, Kim S, Nakai J, Yu CR. Encoding gender and individual information in the mouse vomeronasal organ. Science. 2008;320:535–538. doi: 10.1126/science.1154476. [DOI] [PMC free article] [PubMed] [Google Scholar]
- Hering E. Outlines of the theory of the light sense. In: Herrick LM, Jameson D, translators. Reprint. Cambridge, MA: Harvard UP; 1920. 1964. [Google Scholar]
- Holekamp TF, Turaga D, Holy TE. Fast three-dimensional fluorescence imaging of activity in neural populations by objective-coupled planar illumination microscopy. Neuron. 2008;57:661–672. doi: 10.1016/j.neuron.2008.01.011. [DOI] [PubMed] [Google Scholar]
- Holy TE, Dulac C, Meister M. Responses of vomeronasal neurons to natural stimuli. Science. 2000;289:1569–1572. doi: 10.1126/science.289.5484.1569. [DOI] [PubMed] [Google Scholar]
- Hurvich LM, Jameson D. An opponent-process theory of color vision. Psychol Rev. 1957;64:384–404. doi: 10.1037/h0041403. [DOI] [PubMed] [Google Scholar]
- Iverson P, Kuhl PK. Influences of phonetic identification and category goodness on American listeners' perception of /r/ and /l/ J Acoust Soc Am. 1996;99:1130–1140. doi: 10.1121/1.415234. [DOI] [PubMed] [Google Scholar]
- Kaba H, Nakanishi S. Synaptic mechanisms of olfactory recognition memory. Rev Neurosci. 1995;6:125–141. doi: 10.1515/revneuro.1995.6.2.125. [DOI] [PubMed] [Google Scholar]
- Kaba H, Rosser A, Keverne B. Neural basis of olfactory memory in the context of pregnancy block. Neuroscience. 1989;32:657–662. doi: 10.1016/0306-4522(89)90287-x. [DOI] [PubMed] [Google Scholar]
- Kashiwadani H, Sasaki YF, Uchida N, Mori K. Synchronized oscillatory discharges of mitral/tufted cells with different molecular receptive ranges in the rabbit olfactory bulb. J Neurophysiol. 1999;82:1786–1792. doi: 10.1152/jn.1999.82.4.1786. [DOI] [PubMed] [Google Scholar]
- Koch C. Oxford UP: 1999. Biophysics of computation: information processing in single neurons. [Google Scholar]
- Koulakov A, Gelperin A, Rinberg D. Olfactory coding with all-or-nothing glomeruli. J Neurophysiol. 2007;98:3134–3142. doi: 10.1152/jn.00560.2007. [DOI] [PubMed] [Google Scholar]
- Laurent G. A systems perspective on early olfactory coding. Science. 1999;286:723–728. doi: 10.1126/science.286.5440.723. [DOI] [PubMed] [Google Scholar]
- Laurent G, Stopfer M, Friedrich RW, Rabinovich MI, Volkovskii A, Abarbanel HD. Odor encoding as an active, dynamical process: experiments, computation, and theory. Annu Rev Neurosci. 2001;24:263–297. doi: 10.1146/annurev.neuro.24.1.263. [DOI] [PubMed] [Google Scholar]
- Li CS, Kaba H, Seto K. Effective induction of pregnancy block by electrical stimulation of the mouse accessory olfactory bulb coincident with prolactin surges. Neurosci Lett. 1994;176:5–8. doi: 10.1016/0304-3940(94)90857-5. [DOI] [PubMed] [Google Scholar]
- Linster C, Cleland TA. Configurational and elemental odor mixture perception can arise from local inhibition. J Comput Neurosci. 2004;16:39–47. doi: 10.1023/b:jcns.0000004840.87570.2e. [DOI] [PubMed] [Google Scholar]
- Luo M, Katz LC. Response correlation maps of neurons in the mammalian olfactory bulb. Neuron. 2001;32:1165–1179. doi: 10.1016/s0896-6273(01)00537-2. [DOI] [PubMed] [Google Scholar]
- Luo M, Katz LC. Encoding pheromonal signals in the mammalian vomeronasal system. Curr Opin Neurobiol. 2004;14:428–434. doi: 10.1016/j.conb.2004.07.001. [DOI] [PubMed] [Google Scholar]
- Luo M, Fee MS, Katz LC. Encoding pheromonal signals in the accessory olfactory bulb of behaving mice. Science. 2003;299:1196–1201. doi: 10.1126/science.1082133. [DOI] [PubMed] [Google Scholar]
- Mazor O, Laurent G. Transient dynamics versus fixed points in odor representations by locust antennal lobe projection neurons. Neuron. 2005;48:661–673. doi: 10.1016/j.neuron.2005.09.032. [DOI] [PubMed] [Google Scholar]
- McGann JP, Pírez N, Gainey MA, Muratore C, Elias AS, Wachowiak M. Odorant representations are modulated by intra- but not interglomerular presynaptic inhibition of olfactory sensory neurons. Neuron. 2005;48:1039–1053. doi: 10.1016/j.neuron.2005.10.031. [DOI] [PubMed] [Google Scholar]
- Meisami E, Bhatnagar KP. Structure and diversity in mammalian accessory olfactory bulb. Microsc Res Tech. 1998;43:476–499. doi: 10.1002/(SICI)1097-0029(19981215)43:6<476::AID-JEMT2>3.0.CO;2-V. [DOI] [PubMed] [Google Scholar]
- Mountcastle VB, Darian-Smith I. Neural mechanisms in somesthesia. In: Mountcastle VB, editor. Medical physiology. Vol 2. St. Louis: Mosby; 1968. [Google Scholar]
- Nodari F, Hsu FF, Fu X, Holekamp TF, Kao LF, Turk J, Holy TE. Sulfated steroids as natural ligands for mouse pheromone-sensing neurons. J Neurosci. 2008;28:6407–6418. doi: 10.1523/JNEUROSCI.1425-08.2008. [DOI] [PMC free article] [PubMed] [Google Scholar]
- Pfeiffer CA, Johnston RE. Hormonal and behavioral responses of male hamsters to females and female odors: roles of olfaction, the vomeronasal system, and sexual experience. Physiol Behav. 1994;55:129–138. doi: 10.1016/0031-9384(94)90020-5. [DOI] [PubMed] [Google Scholar]
- Rinberg D, Koulakov A, Gelperin A. Sparse odor coding in awake behaving mice. J Neurosci. 2006;26:8857–8865. doi: 10.1523/JNEUROSCI.0884-06.2006. [DOI] [PMC free article] [PubMed] [Google Scholar]
- Schoppa NE, Urban NN. Dendritic processing within olfactory bulb circuits. Trends Neurosci. 2003;26:501–506. doi: 10.1016/S0166-2236(03)00228-5. [DOI] [PubMed] [Google Scholar]
- Shepherd GM, Chen WR, Willhite D, Migliore M, Greer CA. The olfactory granule cell: from classical enigma to central role in olfactory processing. Brain Res Rev. 2007;55:373–382. doi: 10.1016/j.brainresrev.2007.03.005. [DOI] [PubMed] [Google Scholar]
- Shipley MT, Ennis M. Functional organization of olfactory system. J Neurobiol. 1996;30:123–176. doi: 10.1002/(SICI)1097-4695(199605)30:1<123::AID-NEU11>3.0.CO;2-N. [DOI] [PubMed] [Google Scholar]
- Singer BH, Kim S, Zochowski M. Binaral interaction and centrifugal input enhances spatial contrast in olfactory bulb activation. Eur J Neurosci. 2007;25:576–586. doi: 10.1111/j.1460-9568.2007.05279.x. [DOI] [PubMed] [Google Scholar]
- Sperling HG, Mills SL. Red-green interactions in the spectral sensitivity of primates as derived from erg and behavioral data. Vis Neurosci. 1991;7:75–86. doi: 10.1017/s0952523800010956. [DOI] [PubMed] [Google Scholar]
- Stowers L, Holy TE, Meister M, Dulac C, Koentges G. Loss of sex discrimination and male-male aggression in mice deficient for TRP2. Science. 2002;295:1493–1500. doi: 10.1126/science.1069259. [DOI] [PubMed] [Google Scholar]
- Swanson LW, Petrovich GD. What is the amygdala? Trends Neurosci. 1998;21:323–331. doi: 10.1016/s0166-2236(98)01265-x. [DOI] [PubMed] [Google Scholar]
- Uchida N, Mainen ZF. Speed and accuracy of olfactory discrimination in the rat. Nat Neurosci. 2003;6:1224–1229. doi: 10.1038/nn1142. [DOI] [PubMed] [Google Scholar]
- Urban NN. Lateral inhibition in the olfactory bulb and in olfaction. Physiol Behav. 2002;77:607–612. doi: 10.1016/s0031-9384(02)00895-8. [DOI] [PubMed] [Google Scholar]
- Urban NN, Castro JB. Tuft calcium spikes in accessory olfactory bulb mitral cells. J Neurosci. 2005;25:5024–5028. doi: 10.1523/JNEUROSCI.0297-05.2005. [DOI] [PMC free article] [PubMed] [Google Scholar]
- Vuciniæ D, Cohen LB, Kosmidis EK. Interglomerular center-surround inhibition shapes odorant-evoked input to the mouse olfactory bulb in vivo. J Neurophysiol. 2006;95:1881–1887. doi: 10.1152/jn.00918.2005. [DOI] [PubMed] [Google Scholar]
- Yonekura J, Yokoi M. Conditional genetic labeling of mitral cells of the mouse accessory olfactory bulb to visualize the organization of their apical dendritic tufts. Mol Cell Neurosci. 2008;37:708–718. doi: 10.1016/j.mcn.2007.12.016. [DOI] [PubMed] [Google Scholar]
- Zhang JJ, Huang GZ, Halpern M. Firing properties of accessory olfactory bulb mitral/tufted cells in response to urine delivered to the vomeronasal organ of gray shorttailed opossums. Chem Senses. 2007;32:355–360. doi: 10.1093/chemse/bjm005. [DOI] [PubMed] [Google Scholar]