

Abstract
Dendritic spines have been proposed to function as electrical compartments for the active processing of local synaptic signals. However, estimates of the resistance between the spine head and the parent dendrite suggest that compartmentalization is not tight enough to electrically decouple the synapse. Here we show in acute hippocampal slices that spine compartmentalization is initially very weak, but increases dramatically upon postsynaptic depolarization. Using NMDA receptors as voltage sensors, we provide evidence that spine necks not only regulate diffusional coupling between spines and dendrites, but also control local depolarization of the spine head. In spines with high-resistance necks, presynaptic activity alone was sufficient to trigger calcium influx through NMDA receptors and R-type calcium channels. We conclude that calcium influx into spines, a key trigger for synaptic plasticity, is dynamically regulated by spine neck plasticity through a process of electrical compartmentalization.
Keywords: dendritic spines, NMDA receptors, R-type channels, spine neck resistance, compartmental modeling, two-photon imaging
Introduction
In hippocampal pyramidal cells, the induction of synaptic long-term plasticity is associated with changes in shape and size of dendritic spines (Toni et al., 1999; Matsuzaki et al., 2004; Zhou et al., 2004; Harvey and Svoboda, 2007). How spine morphology affects synaptic function, on the other hand, is less clear. The narrow necks of mushroom-shaped spines form diffusional barriers that slow down the exchange of second messengers between spine heads and dendrites (Müller and Connor, 1991). As a consequence of the partial biochemical isolation of synapses on neighboring spines, changes in synaptic strength can be induced with single-synapse specificity (Matsuzaki et al., 2004; Harvey and Svoboda, 2007; Zhang et al., 2008). A second potential function of dendritic spines is more controversial: Since spines are equipped with different types of voltage-gated channels (Bloodgood and Sabatini, 2007), they could in principle serve as active electrical amplifiers (Segev and Rall, 1988). According to this theory, active spines could locally boost synaptic currents at minimal metabolic cost, providing a substrate for information storage as well as information processing (Koch and Poggio, 1985; Koch, 1999). Whether or not electrical amplification plays a role in synaptic transmission depends critically on the amplitude of the EPSP inside the spine (Koch and Zador, 1993). Unfortunately, it is not yet possible to measure spine EPSPs or the electrical resistance of individual spine necks directly. What can be assessed in live neurons is the diffusional coupling between spine head and dendrite, using photoactivation or fluorescence recovery after photobleaching (FRAP). Diffusion time constants can in principle be used to estimate spine neck resistance, since current propagation in neurons is mediated by electrodiffusion. Estimates from different preparations, however, did not reach agreement about the typical resistance of a spine neck (Harris and Stevens, 1989; Svoboda et al., 1996; Bloodgood and Sabatini, 2005). In brain slice cultures, it has been demonstrated that spine neck properties change dynamically, dependent on the level of activity (Bloodgood and Sabatini, 2005). This is an alarming finding, since the level of spontaneous activity in the most popular model system for synaptic physiology, the acute brain slice, is very low. Low spontaneous activity provides a conveniently quiet baseline for electrophysiological studies, but might have unexpected effects on synaptic function.
In this study, we revisit the question of electrical compartmentalization using two-photon calcium imaging of synaptically triggered calcium transients (CaTs) in spines. The strong voltage dependence and high calcium permeability of synaptic NMDA receptors (NMDARs) provided us with a natural sensor for spine head depolarization during the EPSP. However, the relationship between calcium current and depolarization is not linear, and in addition, depolarizing currents through NMDARs and other voltage-dependent channels provide positive feedback. To estimate spine head depolarization from the amplitude of synaptically evoked CaTs, we therefore simulated the interplay of different ion channels using an active compartmental model of a CA1 pyramidal cell. We show that the spine neck resistance tightly controls NMDAR unblocking and spine calcium transients, but has little effect on the amplitude of somatic EPSPs. This might explain how the dramatic neck resistance changes we demonstrate here could go unnoticed in many years of electrophysiological experiments.
Materials and Methods
Slice preparation.
Acute hippocampal brain slices were prepared from Sprague Dawley rats (postnatal day 16–20) in accordance with the animal care and use guidelines of the Veterinary Department Basel-Stadt. Horizontal slices (350 μm) were cut on a vibroslicer (Leica) in ice-cold solution containing (in mm): 110 choline chloride, 25 NaHCO3, 25 d-glucose, 11.6 sodium ascorbate, 7 MgSO4, 2.5 KCl, 1.25 NaH2PO4, and 0.5 CaCl2. Slices were incubated at 34°C for 30–45 min in oxygenated artificial CSF (ACSF), containing (in mm) 127 NaCl, 25 NaHCO3, 25 d-glucose, 2.5 KCl, 1 MgCl2, 2 CaCl2, and 1.25 NaH2PO4 and then stored at room temperature until used. Experiments were performed at 32°C in ACSF containing 10 μm bicuculline, 30 μm serine, and 2 μm thapsigargin to block GABAA receptors, glycine-dependent desensitization of NMDARs, and intracellular Ca2+ stores.
Electrophysiology.
Whole-cell recordings from CA1 pyramidal cells were made with a Multiclamp 700B amplifier (Axon Instruments), using 3–6 MΩ pipettes filled with (in mm): 130 K-methylsulfonate (or 135 cesium methanesulfonate), 10 HEPES, 10 sodium phosphocreatine, 3 sodium ascorbate, 4 MgCl2, 4 Na2-ATP, 0.4 Na-GTP, 0.6 fluo-5F, and 0.03 Alexa Fluor 594 (pH 7.2). Schaffer collaterals were stimulated with a monopolar glass electrode filled with 1 m NaCl, positioned 15–25 μm from an oblique dendrite, using short hyperpolarizing pulses (0.2 ms, −3 to −5 V) delivered by a stimulus isolator (NPI Electronics). The synaptic reversal potential was determined by first depolarizing the cell at the soma until the synaptic currents reversed, then slowly repolarizing until synaptic stimulation evoked zero current. This procedure provided precise compensation for unavoidable space clamp errors. In K+ based internal solution, current reversal was typically achieved with the soma clamped between +25 and +30 mV. If the synaptic currents could not be reversed, the experiment was aborted.
Two-photon imaging and data analysis.
We used a custom-built 2-photon laser scanning microscope based on a BX51WI microscope (Olympus) and a pulsed Ti:Sapphire laser (Chameleon XR, Coherent) tuned to λ = 810 nm, controlled by the open source software package “ScanImage” (Pologruto et al., 2003). Fluorescence was detected in epifluorescence (LUMPlan W-IR2 60× 0.9 NA, Olympus) and transfluorescence modes (achromatic aplanatic condenser, 1.4 NA, Olympus) using 4 photomultiplier tubes (R3896, Hamamatsu). We used 725DCXR dichroic mirrors and E700SP blocking filters to reflect emitted photons into a secondary beamsplitter, containing a 560DCXR dichroic and 525/50 (green) and 610/75 (red) bandpass filters (AHF Analysentechnik). For FRAP experiments, we bleached Alexa Fluor 594 (Molecular Probes) with a 0.5 ms laser pulse at 810 nm. The fluorescence recovery was fit with a single exponential function. For calcium imaging experiments, we used a mixture of fluo-5F and Alexa Fluor 594. Responsive spines on oblique dendrites 100–200 μm (average 170 μm) from the soma were identified using frame scans (4 Hz). For quantitative measurements, line scans (500 Hz) were used. We subtracted the PMT dark current and evaluated the ratio of green/red fluorescence intensity (G/R) (Yasuda et al., 2004). To quantify the amplitude of spine calcium transients, we first generated a response template for each spine by fitting the difference of two exponentials to the average response. This response template was scaled in amplitude to fit each individual response (scaling factor × template amplitude = response amplitude). Summary data are reported as mean ± SEM.
Using calcium signal decay to estimate spine diffusional coupling.
Under our experimental conditions, removal of free calcium ions from the cytoplasm was compromised for the following reasons: (1) the membrane potential was always above the calculated reversal potential of the sodium/calcium exchanger ENCX = 3ENa − 2ECa = −103 mV (Török, 2007), (2) SERCA pumps were blocked by thapsigargin, and (3) plasma membrane Ca2+ pumps had to compete for free Ca2+ ions with the high added buffer capacity of 600 μm fluo-5F (Kd ∼ 0.8 μm). Under these conditions, the decay of the fluorescence signal in the spine was mainly due to diffusion of calcium-bound dye molecules into the dendrite, which we verified by combining two-photon uncaging of MNI-glutamate (Matsuzaki et al., 2001) and FRAP experiments (see Fig. 2C).
Figure 2.

Spine neck resistance controls NMDA receptor activation during the EPSP. A, Synaptically evoked spine calcium transients. For ratio measurements, cells were filled with a green calcium-sensitive dye (fluo-5F) and a red dye (Alexa Fluor 594). Calcium signals were measured in line-scan mode. B, Synaptically evoked calcium transients were measured first under depolarized conditions (voltage clamp at synaptic reversal potential, yellow trace), then in current clamp (gray trace). τdecay was extracted by fitting the difference of 2 exponentials to the average response under depolarized conditions (yellow trace). C, Decay time constant of the calcium transient at the synaptic reversal potential was correlated with FRAP recovery time constant, indicating diffusion of calcium-bound dye molecules through the spine neck. D, Fractional calcium transient amplitude was correlated with spine neck properties (decay time constant of the calcium transient at the synaptic reversal potential). Coefficient of determination R2 = 0.42, p < 0.01 (two-tailed test), n = 28 spines.
In vivo FRAP measurements.
Transgenic mice expressing yellow fluorescent protein [B6.Cg-Tg(Thy1-YFPH)2Jrs/J, Jackson Laboratory] were anesthetized by IP injection (17 mg/ml ketamine, 1.7 mg/ml xylazine). The skull was exposed and thinned with a dental drill as described (Grutzendler et al., 2002). For imaging and photobleaching, an Ultima 2-photon microscope (Prairie Technologies) with a 60×/1.1 NA objective (Olympus) was used at 920 nm excitation wavelength (Mai Tai HP, Spectra Physics). Of each spine, 40 images (64 × 64 pixels) were taken at 13 Hz according to the following protocol: 10 frames baseline, bleach pulse (0.5 s), 10 frames, 5 s wait, 10 frames, 10 s wait, 10 frames (Fig. 6). Laser power was adjusted to bleach the spine to 30–40% of its baseline intensity. Custom-written software (Matlab) was used to measure the spine fluorescence intensity, compensating for small movements by centering the region of interest (ROI) on the spine in every frame.
Figure 6.
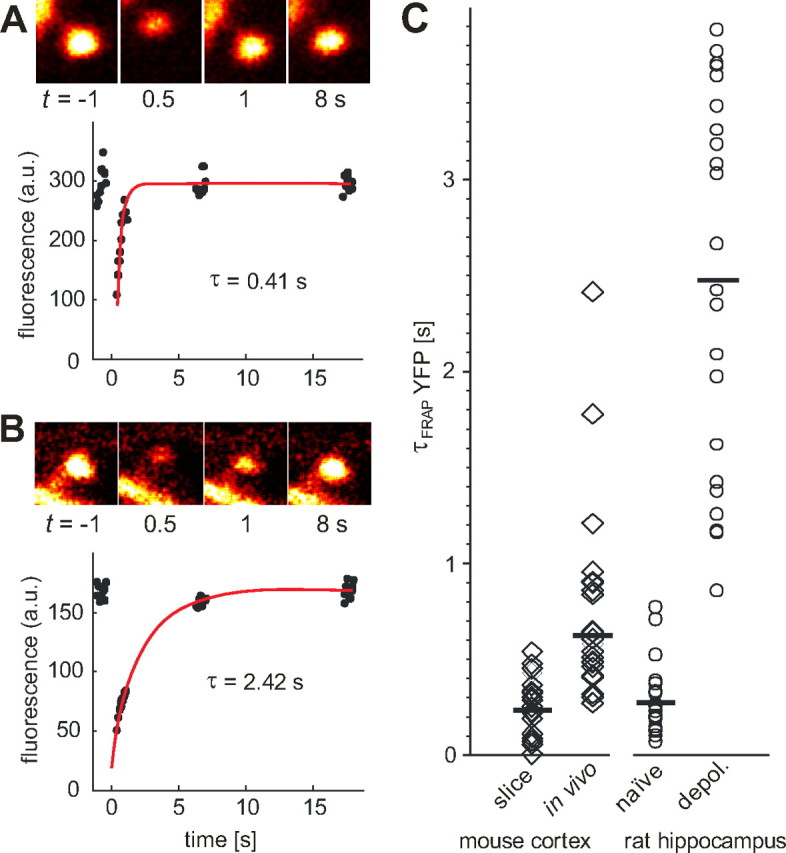
In vivo FRAP experiments on thy1-YFPH mice. A, Bleaching of single spine in frame scan mode (13 Hz frame rate, 64 × 64 pixels). To extract the fluorescence time course and compensate for heart beat induced movements, a region of interest (ROI) of fixed size was manually centered on the spine head in every frame. Red line: Mono-exponential fit. B, Example of spine with high diffusional resistance. Note that visibility of spine neck cannot be used to predict diffusional resistance. C, Recovery time constants of spines in neocortical slices (median τFRAP = 0.23 s, range, 0.01–0.54 s, n = 21) and in vivo of thy1-YFPH mice (median τFRAP = 0.62 s, range, 0.27–2.42 s, n = 24 spines, 3 animals). To facilitate direct comparison with Alexa-FRAP experiments in acute rat hippocampal slices (naive/depol.), we replotted the data from Figure 1D scaled by the experimentally determined conversion factor 4.85 (see supplemental Methods, available at www.jneurosci.org as supplemental material).
Results
Prompted by a study reporting changes in spine neck resistance after pharmacological modulation of activity (Bloodgood and Sabatini, 2005), we set out to test whether depolarization of a single cell affects the diffusional coupling between its spines and dendrites. To measure FRAP time constants (τFRAP) of individual spines, we filled CA1 pyramidal cells with Alexa Fluor 594 (Fig. 1A) and bleached spine heads on oblique dendrites by two-photon excitation at 810 nm. To our surprise, shortly after a 4 min depolarizing pulse to 0 mV, τFRAP was increased by a factor of 10, on average (Fig. 1B,C). The increase in τFRAP built up gradually during the depolarizing pulse, as shorter pulses induced smaller changes. The diffusional coupling also changed in response to bursts of backpropagating action potentials. A theta-burst protocol (three trains (0.1 Hz) of 10 bursts (5 Hz) of five bAPs at 100 Hz) induced a 5.4-fold increase, on average (before stimulation: median τFRAP = 30 ms, range, 8–130 ms; after theta-burst: median τFRAP = 162 ms, range, 82–475 ms, n = 16). To exclude possible damage to the spine by the first bleach pulse, we also compared spines on step-depolarized and unstimulated cells in the same slice (Fig. 1D). The difference in τFRAP between the two groups was 12-fold, indicating that the changes were not induced by spine photodamage during the bleaching pulse (before depolarization: median τFRAP = 43 ms, range, 16–159 ms, n = 23; 5–10 min after depolarization: median τFRAP = 524 ms, range, 177–778 ms, n = 22). One hour after step depolarization, spine neck resistances were still significantly increased (median τFRAP = 500 ms, range, 250–650, n = 7). Switching to nominally Ca2+-free saline before depolarization completely prevented the increase in τFRAP, indicating that Ca2+ influx during the step depolarization triggered the change in diffusional coupling (Fig. 1D). The time a dye molecule stays inside a spine depends on spine neck diameter and length, but also on the volume of the spine head (Bloodgood and Sabatini, 2005; Biess et al., 2007). However, we did not detect significant changes in spine head volume after step depolarization (Fig. 1E). Therefore, rapid calcium-induced remodeling of the spine neck seems to be responsible for the dramatic changes in diffusional coupling.
Figure 1.
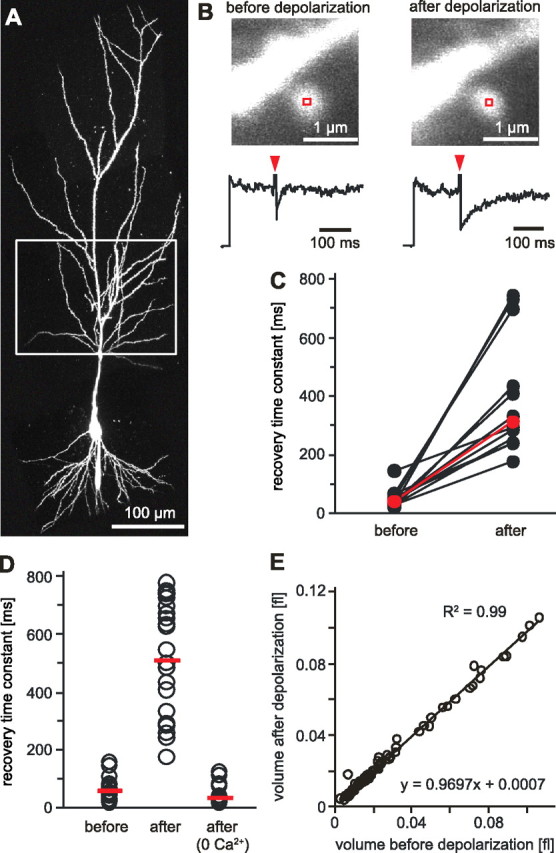
Postsynaptic depolarization reduces diffusional coupling between spine head and dendrite. A, CA1 pyramidal cell filled with Alexa Fluor 594 through a somatic patch pipette. Box indicates oblique dendrites used for FRAP experiments. B, Example of a repeated FRAP experiment before and after a 4 min step depolarization to 0 mV. Line scans across the spine head were used to measure fluorescence recovery. Red arrow heads indicate time of bleaching. C, In individual spines, τFRAP increased by a factor of 10, on average. The median value of τFRAP increased by a factor of 7.8 (before depolarization: median τFRAP = 40 ms, range, 22–146 ms; after depol: median τFRAP = 312 ms, range, 177–743 ms, n = 12). D, Group comparison of τFRAP of CA1 spines in naive slices (median τFRAP = 43 ms, range, 16–159 ms, n = 23), after step depolarization (median τFRAP = 524 ms, range, 177–778 ms, n = 22), and after step depolarization in nominally Ca2+-free saline (median τFRET = 29 ms, range, 14–120 ms, n = 15). E, Step depolarization did not induce changes in spine head volume.
After step depolarization, τFRAP in individual spines ranged from 177 to 778 ms (Fig. 1D). We wanted to test whether the corresponding variability in the electrical resistance of the spine necks had measurable effects on spine head depolarization during the EPSP. To measure spine head depolarization, we made use of the fact that postsynaptic NMDA receptors (NMDARs) are blocked by Mg2+ ions in a strongly voltage-dependent manner (Jahr and Stevens, 1990). NMDARs are highly permeable for Ca2+ and we could monitor NMDAR activation in individual spines by two-photon calcium imaging (Fig. 2A; supplemental Fig. 1, available at www.jneurosci.org as supplemental material). However, there is no simple relation between spine depolarization and spine calcium levels: Number and subunit composition of NMDARs, as well as spine head volume, are heterogeneous, leading to differences in absolute calcium concentrations in individual spines even for identical EPSP amplitudes (Sobczyk et al., 2005). We developed an experimental protocol to compensate for this variability: Synaptically evoked calcium transients (CaTs) were measured under two conditions: Depolarized to the synaptic reversal potential in voltage clamp (here denoted as “0 mV”) and free running (current clamp, denoted as “CC”) (Fig. 2B). The ratio between the calcium signal amplitude in CC and at 0 mV we call the fractional calcium transient (fCaT). The stronger the spine depolarizes during the EPSP, the larger the fCaT will be. In control experiments at 0 mV, we verified that calcium influx was indeed mediated by NMDARs (97% block of CaTs by 10 μm dCPP, n = 3, data not shown). In a sample of 33 synaptically stimulated spines, the amplitude of fCaTs ranged from 0.02 to 0.51, pointing to large differences in spine head depolarization. These differences were not reflected by the somatic EPSP (R2 = 0.12, n = 21) (supplemental Fig. 2, available at www.jneurosci.org as supplemental material). Since we used extracellular stimulation and typically activated more than one synaptic connection, the compound EPSP could not be used as a reporter of depolarization of the spine under scrutiny. If spine depolarization were controlled by the spine neck, we would expect the spines with the largest fCaTs to have the highest neck resistances and the longest diffusion time constants. As a measure of spine neck diffusional resistance, we used the decay time constant of the calcium signal at 0 mV (τdecay) (Fig. 2B). This measure was highly correlated to the FRAP time constant (Fig. 2C) (see also supplemental methods, available at www.jneurosci.org as supplemental material) and was used as a proxy to avoid the additional photodamage caused by FRAP experiments. Indeed, we found a positive correlation between spine head depolarization and diffusional resistance (R2 = 0.42) (Fig. 2D). Spines with fast time constants generated small fCaTs, indicating weak depolarization of the spine head. As discussed in the previous section, diffusion time constants depend both on the geometry of the spine neck and on the volume of the spine head. Spine volumes, however, were not different in fast and slow spines (supplemental Fig. 2, available at www.jneurosci.org as supplemental material). Together, these findings point to the spine neck as the main variable controlling diffusion speed and electrical coupling of spines.
Next, we tested the electrical interactions between different channels pharmacologically. For these experiments, we used synaptically stimulated spines that were identified under depolarized conditions and, in addition, produced sizable CaTs in current clamp. Spines in which the fractional calcium transient was below 0.05 (Ca2+ silent spines; see Fig. 2D) were not further investigated. As expected, blocking NMDARs strongly reduced the spine CaTs in current clamp to 9% of the control amplitude (Fig. 3A). Blocking AMPARs also had a very strong effect on CaTs, reducing them to 16% of the control amplitude, on average. Clearly, AMPAR-mediated depolarization was needed to enable NMDAR-mediated Ca2+ influx. Voltage-gated Ca2+ channels of the R-type have been identified as the main spine Ca2+ source triggered by back-propagating action potentials (Yasuda et al., 2003). We found that blocking R-type channels by SNX-482 reduced CaTs to 44% (Fig. 3B), indicating that EPSP amplitude in most spines was sufficiently high to open these high-voltage activated channels. SNX-482 application did not affect the probability of observing CaTs (pCaT) after presynaptic stimulation (control: pCaT = 0.45 ± 0.19; SNX: pCaT = 0.45 ± 0.21, n = 3), indicating that R-type channels are not involved in the regulation of glutamate release at these synapses. Another commonly used R-type antagonist, Ni2+ ions at low concentration, did affect pCaT in some experiments. Therefore, we did not use wash-in of Ni2+, but compared fCaT amplitudes of spines recorded in ACSF containing 10 μm Ni2+ to fCaTs recorded in standard solution (see supplemental Methods, available at www.jneurosci.org as supplemental material). The group comparison indicated that Ni2+ reduced the amplitude of CaTs to 58% of control (Fig. 3D). Compared with wash-in of SNX-482, this was a slightly weaker effect, but 10 μm Ni2+ is a subsaturating concentration for R-type channel block (Foehring et al., 2000). We used the same group comparison strategy to test for the activation of fast Na+ channels during the EPSP. Blocking Na+ channels in the postsynaptic cell by intracellular loading with QX-314 did not lead to significant suppression of spine Ca2+ signals (Fig. 3D). Sodium channels are known to be present in spines on basal dendrites of mouse neocortical pyramidal cells (Araya et al., 2007), but are either absent or were not activated during the EPSP in the spines we investigated. In summary, we concluded that at least three types of channels contributed to the depolarization of the spine head: AMPARs, NMDARs, and R-type calcium channels.
Figure 3.
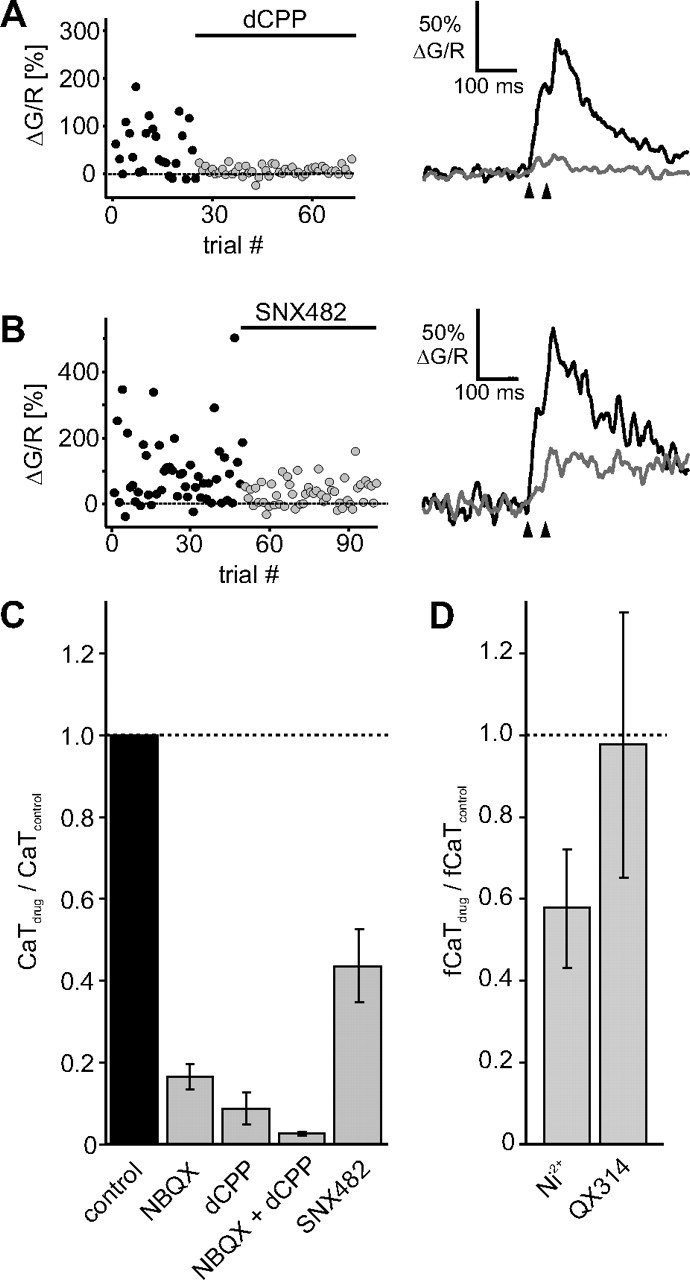
Pharmacology of synaptically evoked spine calcium transients. A, Example of NMDAR blocking experiment using dCPP (10 μm). Paired pulse stimulation was used to increase release probability. B, Example of R-type calcium channel blocking experiment using SNX-482 (0.1 μm). C, Summary of bath application experiments. The calcium transient amplitudes were normalized to the responses in current clamp before drug application. NBQX (10 μm), 0.166 ± 0.029, n = 6; dCPP (10 μm), 0.087 ± 0.040, n = 3; NBQX+dCPP, 0.025 ± 0.003, n = 2; SNX-482 (0.1 μm), 0.437 ± 0.089, n = 4 (mean ± SEM). D, To compensate for potential presynaptic effects of Ni2+, we recorded trials at 0 mV and in current clamp in Ni2+ (10 μm), calculated the fCaT and compared it to the average fCaT in standard ACSF (0.576 ± 0.145, n = 6). The same strategy was used for the intracellular Na+ channel blocker QX-314 (5 mm, 0.976 ± 0.324, n = 4).
In current-clamp experiments, blocking a single type of channel will affect depolarization and thus change the amplitude of all other currents. The best way to dissect the relative contributions of different channels to spine depolarization and spine calcium is biophysical modeling. We used the NEURON simulation environment to set up a model spine equipped with AMPA, NMDA, and R-type channels and connected it to the oblique dendrite of a passive CA1 pyramidal cell model (Hines and Carnevale, 1997; Golding et al., 2001) (Fig. 4B). The voltage-dependent blocking function of synaptic NMDARs was experimentally determined (supplemental Fig. 1, available at www.jneurosci.org as supplemental material) and implemented in the NEURON mechanism (supplemental Methods, available at www.jneurosci.org as supplemental material). Channel densities and spine neck resistance (Rneck) were adjusted to reproduce the relative amplitude of fluorescence transients measured in our pharmacological experiments (Fig. 4A; supplemental Fig. 3 and Table 1, available at www.jneurosci.org as supplemental material). The strong effect of AMPA receptor block on calcium signal amplitude was only reproduced in simulations with Rneck > 1 GΩ. We were pleased to see that not only the amplitude, but also the time course of the calcium transients under various pharmacological conditions was faithfully reproduced in our simulated spine (Fig. 4C), indicating that the simple model captured the essential mechanism of spine calcium transient generation. From the simulation, we could extract the individual currents (Fig. 4D) and the typical EPSP in the spine head (Fig. 4E), which had an amplitude of 55 mV and lasted ∼10 ms (full width at half maximum). Depolarization was actively amplified and prolonged by the joint activation of NMDARs and R-type calcium channels. At the soma, the EPSP was attenuated to ∼1 mV (Fig. 4E, insert; supplemental Table 2, available at www.jneurosci.org as supplemental material).
Figure 4.
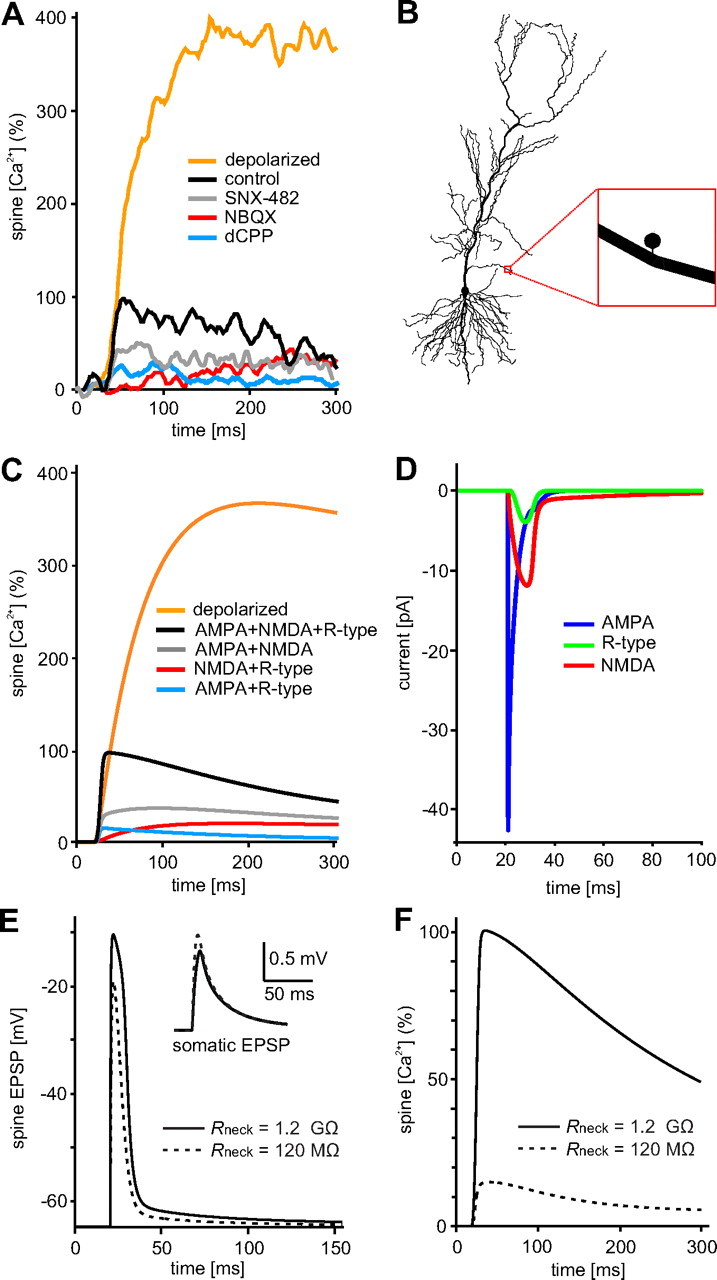
Assessing the functional impact of spine neck resistance by compartmental modeling. A, Experimental data: pharmacological block of R-type calcium channels (gray curve), AMPA receptors (red curve), or NMDA receptors (blue curve) partially blocked spine calcium signals. Traces from three different experiments (average of 40–54 responses each) were normalized to the control response in current clamp (100%; black trace). For comparison, the average response in voltage clamp (0 mV) is also shown (yellow trace). B, NEURON model: Single spine attached to oblique dendrite of CA1 pyramidal cell. C, Model simulation with Rneck = 1.2 GΩ reproduced amplitude and time course of the fluorescence transients under all conditions tested. D, The model reveals the sequence of currents during the EPSP: NMDA and R-type currents lead to a substantial prolongation of the depolarization. E, EPSP in the spine head reached 55 mV in amplitude and lasted ∼10 ms, while somatic depolarization was only ∼1 mV (insert). With Rneck = 120 MΩ, spine EPSP was smaller and shorter while somatic EPSP was slightly larger (dashed lines). F, With Rneck = 120 MΩ, CaT was reduced to 18% (dashed line).
In a second set of simulations, we run the same model with a tenfold lower spine neck resistance (Rneck = 120 MΩ), to simulate spine neck properties before step depolarization (Fig. 1). The EPSP in the spine decreased by ∼20% in peak amplitude and was also much briefer (Fig. 4E, dotted line). As a consequence, only a small fraction of NMDAR became unblocked and no R-type channels were activated in the 120 MΩ spine, leading to a 82% reduction in the simulated CaT (Fig. 4F, dotted line). Expressed as fractional calcium transient, the simulated 120 MΩ spine produced in current clamp only 4.5% of its maximum calcium signal at 0 mV and would have been classified as a “Ca2+ silent” spine in our imaging experiments (see Fig. 2D). In summary, our simulation suggested that an increase in spine neck resistance from 120 MΩ to 1.2 GΩ would lead to a slight reduction (∼20%) of somatic EPSP amplitude (Fig. 4E, insert), but would strongly enhance voltage-gated calcium influx into the spine head, boosting spine calcium transients by a factor of 5.6.
We tested the predictions of our model by measuring EPSPs in CA1 cells evoked by Schaffer collateral stimulation (Fig. 5A). The same step depolarization protocol that induced 10- to 12-fold changes in spine neck resistance had no consistent effect on the EPSP amplitude measured at the soma. This was no surprise given the large body of literature about pairing protocols: postsynaptic depolarization of CA1 pyramidal cells alone has not been reported to induce lasting changes in EPSP amplitude. Thus, spine neck resistance controls local postsynaptic signaling independent of electrical signaling to the soma.
Figure 5.
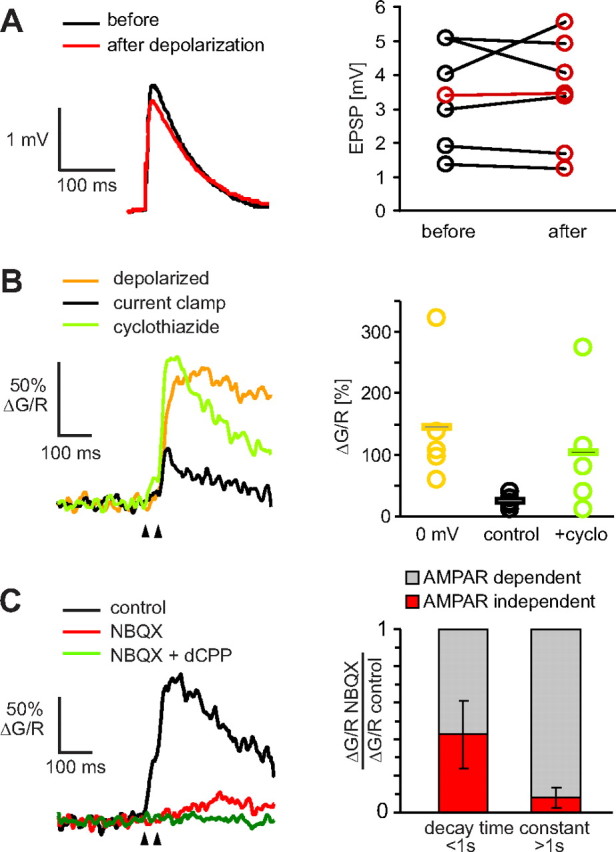
Testing predictions of the model. A, As predicted by the model, EPSP amplitude at the soma was not significantly affected by step depolarization (n = 6). B, Increasing AMPAR affinity by cyclothiazide (40 μm) led to a dramatic boosting of the spine calcium signals in current clamp (green curve). Current-clamp recordings were preceded by recordings at the reversal potential (0 mV, yellow trace). C, Left, AMPAR antagonist NBQX (10 μm) reduced amplitude and changed the time course of spine calcium transients. Remaining calcium transient was NMDAR-dependent (10 μm dCPP). Traces are averages over all trials (failures and successes). Paired-pulse stimulation was used to increase the number of successful synaptic transmission events. C, Right, Sorting NBQX experiments according to spine neck properties (n = 7). Effect of AMPAR block on calcium transients was weaker in spines with low-resistance necks (τdecay< 1 s, residual CaT: 0.43 ± 0.18) than in spines with high-resistance necks (residual CaT: 0.08 ± 0.05).
Our spine model suggested that even in a spine with Rneck = 1.2 GΩ, synaptic activation will not trigger runaway depolarization, i.e., activation of all voltage-gated channels. Increasing the AMPAR current, however, could lead to such a “spine spike” (supplemental Fig. 3, available at www.jneurosci.org as supplemental material). Cyclothiazide is known to increase both amplitude and duration of synaptic AMPA currents. Using the 1.2 GΩ spine model and published measurements of cyclothiazide modulation of AMPA currents (Rammes et al., 1996), we predicted a 4.1-fold increase of CaT amplitude. When we applied cyclothiazide (40 μm) during synaptic stimulation in current clamp, we indeed observed a dramatic increase in the amplitude of spine calcium signals (Fig. 5B). In several spines, calcium transients under cyclothiazide reached or even exceeded the amplitude of transients recorded at the reversal potential, possibly due to the generation of calcium spikes in the spine head. On average, CaT amplitude increased by a factor of 4.2 (Fig. 5B). These experiments also suggest that additional dendritic depolarization, e.g., by coincident backpropagating APs or by simultaneously active neighboring synapses, would strongly boost spine depolarization. The previously reported linear summation of uncaging-evoked potentials on spines (Araya et al., 2006) can be explained by such an active amplification process (supplemental Fig. 3, available at www.jneurosci.org as supplemental material). A third insight from the model was that in low neck resistance spines, EPSPs in the spine head are relatively brief (Fig. 4E). In such spines, AMPAR block should have a weaker effect on postsynaptic calcium transients, since much of the calcium influx is due to the “leakiness” of the NMDA receptor at the resting potential. To test this prediction, we sorted our AMPAR block experiments into two groups: Spine that had a fast decaying calcium signal (τdecay < 1 s) at 0 mV, indicating low-resistance necks, and spines with τdecay> 1 s. In diffusionally isolated spines (τdecay> 1 s), AMPAR block reduced the calcium signal to 8% of the control amplitude, on average, indicating that 92% of the control calcium transient was dependent on AMPAR-mediated depolarization (Fig. 5C). In spines with faster decay of the calcium signal, AMPAR block reduced the calcium signal to 43% of the control amplitude, on average, indicating that 57% of the original calcium signal amplitude was due to AMPAR activity. The remaining Ca2+ influx after AMPAR block was abolished after wash-in of dCPP, consistent with a leak current through NMDARs (Fig. 5C).
Our calcium imaging experiments demonstrate the complex interactions between ligand- and voltage-gated channels in the spine head. However, all functional imaging was preceded by a depolarized period of at least 4 min, which, as we show in Figure 1, alters spine neck properties. To find out how the results of our slice study would compare with the in vivo situation, we performed spine FRAP experiments through the thinned skull of a thy1-YFP mouse (Fig. 6). We found a large range of diffusional time constants (range, 0.27–2.42 s; median, 0.62 s). In acute cortical slices cut from the same transgenic line, we measured much faster time constants in layer I spines (range, 0.01–0.54 s; median, 0.23 s), suggesting lower spine neck resistances. Since the different imaging conditions in vivo and in slices could have introduced a selection bias, we also compared the fluorescence intensity of layer I spines relative to the parent dendrites in vivo and in perfusion fixed slices of thy1-YFP mice. Relative spine head intensity was 1.05 ± 0.04 (n = 124 spines) in vivo and 1.07 ± 0.06 (n = 138 spines) in perfusion fixed slices. Therefore, we can exclude a systematic bias toward larger spines as a reason for the longer time constants measured in vivo.
The activity dependence of spine–dendrite coupling seems to be conserved in mouse neocortical and rat hippocampal pyramidal cells. For a quantitative comparison between YFP and Alexa FRAP experiments, we determined a conversion factor by filling YFP-expressing cells with Alexa Fluor 594 and measuring τFRAP of both fluorophores simultaneously (conversion factor = 4.85) (see supplemental Methods, available at www.jneurosci.org as supplemental material). After this correction for fluorophore size, spine neck time constants were comparable in acute slices from rat hippocampus and from mouse cortex, indicating similar compartmentalization properties (Fig. 6C). Interestingly, the broad distribution of FRAP time constants we found in vivo partially overlapped with the distributions from both naive and depolarized cells in acute slices. This indicates that a subset of spines in vivo is in a state of high neck resistance, possibly reflecting the history of synaptic activity.
Discussion
In this study, we show that the amplitude of postsynaptic calcium transients during the EPSP is correlated with the diffusional resistance of the spine neck. In addition, we demonstrate dramatic changes in spine neck resistance following step depolarization of the postsynaptic cell. For the first time, we integrated the information gained from calcium imaging experiments under various pharmacological conditions in a quantitative biophysical model. The modeling study suggests that after postsynaptic depolarization, spine neck resistance typically exceeds 1 GΩ. Estimates of the ohmic resistance of spine necks have been previously derived from diffusion measurements (Svoboda et al., 1996). However, these estimates depend critically on assumptions about specific resistivity (Ri) and viscosity of the cytoplasm, parameters that are not well known and might even be different inside the thin spine neck and elsewhere in a cell. Here, we used a different approach, relying on voltage-dependent calcium influx as a measure of spine head depolarization. In cells that were depolarized for several minutes, a large fraction of NMDARs became activated during the EPSP in the majority of spines (Fig. 2D). Compartmental modeling of depolarization and diffusion of Ca2+-bound dye pointed to surprisingly high EPSP amplitudes and electrical amplification in spines (Fig. 4).
We provide six lines of evidence for an electrical function of the spine neck. First, we show that spine head depolarization is strongest in spines that are well isolated from the dendrite (Fig. 2D). Second, calcium influx was localized to the spine head, and no fast rising calcium signals were seen in the parent dendrite (Fig. 2A). Since the dendrites of CA1 pyramidal cells are equipped with a variety of voltage-gated calcium channels (Magee et al., 1998; Bloodgood and Sabatini, 2007), the strict localization of the calcium signal can only be explained by a steep voltage drop along the spine neck. Third, in addition to NMDARs, we could detect the activation of high-threshold voltage-gated calcium channels in the spine head during the EPSP (Fig. 3). Fourth, we directly measured the voltage dependence of synaptic NMDARs following the calcium imaging strategy pioneered by (Kovalchuk et al., 2000). In these experiments, we blocked K+ channels and AMPARs to improve voltage clamp (supplemental Fig. 1, available at www.jneurosci.org as supplemental material). The steep voltage dependence we found indicated that significant unblocking of synaptic NMDARs requires a strong and long-lasting depolarization of the spine head (Fig. 4E). Experiments with AMPA receptor antagonists provided a fifth line of evidence for the electrical function of spine necks: NBQX blocked spine calcium transients more effectively in spines with high-resistance necks (Fig. 5C). This is consistent with the idea that spines with a low neck resistance cannot efficiently unblock their NMDARs. In these spines, a large fraction of the calcium influx during the EPSP is due to the imperfect Mg2+ block of NMDARs at rest and is thus less affected by AMPAR block. Finally, the long diffusion time constants we measured after step depolarization are consistent with an electrical neck resistance of 1.2 GΩ, on average (supplemental Methods, available at www.jneurosci.org as supplemental material).
Individual Schaffer collateral synapses have been documented to produce up to 40 pA of current (Conti and Lisman, 2003), but the number of active AMPARs in our model spine (supplemental Table 1, available at www.jneurosci.org as supplemental material) is still higher than most previous estimates (Matsuzaki et al., 2001; Nimchinsky et al., 2004). When we tuned our model, we used only data from spines that did produce sizable calcium transients in current clamp. The “Ca2+ silent” spines that we also frequently encountered in our calcium imaging experiments (Fig. 2D) are likely to have fewer AMPARs. Furthermore, an important difference between our experimental measurements and our single spine model is the frequent stimulation of additional synapses outside the field of view of our imaging experiments, reflected in somatic EPSPs of 4.7 mV, on average (supplemental Fig. 2, available at www.jneurosci.org as supplemental material). Simultaneous activation of multiple synapses leads to local dendritic depolarization, which in turn reduces the number of AMPARs per spine head needed to explain our experimental results. A dendritic EPSP of 10 mV generated by other stimulated synapses, for example, reduced the number of AMPARs needed to generate sufficient depolarization in the spine of interest by a factor of 3. Thus, the absolute number of AMPARs in the spine head cannot be derived from our experiments which were not performed under conditions of minimal stimulation. The interaction of multiple inputs we have only started to explore (supplemental Fig. 3, available at www.jneurosci.org as supplemental material), and it remains a challenge to design experiments to address the complex nonlinear effects resulting from the synchronous activation of multiple synapses (Schiller et al., 2000; Gasparini and Magee, 2006).
In terms of ion channel types, our spine model is intentionally minimalist. Reality is likely to be both more complex and more diverse, with other types of voltage-gated channels contributing to the EPSP in many spines. To aid further refinement of the model as more information becomes available, we have deposited it in the NEURON database. In its current form, the model allowed us to explore functional consequences of the fast and dramatic changes in spine neck resistance we observed experimentally after postsynaptic depolarization (Fig. 1). We show that spine neck resistance controls calcium influx at the spine head, but has little effect on somatic EPSPs, which might explain why this form of structural plasticity has been overlooked for many years.
Understanding the functional impact of activity-induced changes in spine neck resistance might help to resolve several long-standing controversies in the field of synaptic physiology. First, the voltage dependence of postsynaptic calcium signals has been tested in several studies by AMPAR blocking experiments, abolishing the fast component of the EPSP. However, while some laboratories reported a weak effect of AMPAR block on postsynaptic calcium signals (Koester and Sakmann, 1998; Kovalchuk et al., 2000), others studies demonstrated nearly complete block of calcium transients after AMPAR block (Emptage et al., 1999; Yuste et al., 1999; Nevian and Sakmann, 2004). To understand this discrepancy, it is important to point out that in calcium imaging experiments using synaptic stimulation, the search for responsive spines is greatly facilitated by clamping the membrane potential of the postsynaptic cell to 0 mV (Yasuda et al., 2004). This procedure will, as we show here, dramatically alter spine neck properties. Thus, subtle differences in the experimental strategy used by different laboratories could have considerably altered the outcome of AMPAR blocking experiments (Fig. 5C) and thus changed the estimate of NMDAR conductance at the resting potential.
Second, very different diffusion time constants have been reported in different preparations, leading to a debate about the typical electrical resistance of the spine neck (Harris and Stevens, 1989; Svoboda et al., 1996; Majewska et al., 2000; Bloodgood and Sabatini, 2005). Here we show that in nonstimulated acute brain slices, diffusional coupling between spines and dendrites is significantly stronger that in vivo (Fig. 6C). Potential reasons are the formation of novel spines during the incubation period (Kirov et al., 1999) and the absence of spontaneous activity in acute slices. Furthermore, we demonstrate the strong activity dependence of spine neck resistance in acute slices (Fig. 1), consistent with previous reports from organotypic slice cultures (Bloodgood and Sabatini, 2005). From the broad range of spine neck time constants found in vivo (Fig. 6C), we conclude that EPSP amplitude and duration are likely to be highly variable between individual spines, although we studied only 2 examples from this broad spectrum in detailed simulations (Rneck = 120 MΩ and 1.2 GΩ) (Fig. 4E). Nevertheless, it became clear that the biophysical properties of spines reflect the history of neuronal activity and are thus expected to be different in different preparations.
Third, for the activation of multiple inputs on the same dendrite, different modes of integration have been reported: sublinear, linear, and supralinear (Polsky et al., 2004; Araya et al., 2006; Gasparini and Magee, 2006; Sjöström et al., 2008). Integration has been shown to depend on the activation of voltage-gated channels and NMDA receptors and is therefore an active process (Cash and Yuste, 1999; Carter et al., 2007). In simulations of two simultaneously active spine synapses, we could readily reproduce different integration modes just by changing the resistance of the spine necks (supplemental Fig. 3, available at www.jneurosci.org as supplemental material). When we removed NMDARs and R-type channels from the model to simulate “passive” spines, integration of neighboring inputs became sublinear (supplemental Fig. 3, available at www.jneurosci.org as supplemental material). Apparently, dendritic integration of EPSPs depends on the gain of the spine amplifier, which is regulated by the electrical resistance of the spine neck. Taking into account the dynamic changes in spine neck resistance (Fig. 1), this suggests a novel mechanism by which local dendritic calcium spikes could change the dendritic integration mode in a branch-specific manner.
As a fourth point we would like to discuss the potential impact of spine compartmentalization on long-term potentiation (LTP). LTP is classically induced by pairing of presynaptic activity with postsynaptic depolarization. It has been noted, however, that pairing is only effective at the end of a long depolarizing pulse, but not at its beginning (Chen et al., 1999). This finding points to a slow, Ca2+-dependent process in the postsynaptic neuron that is triggered by depolarization and enables functional plasticity. Other stimuli that induce high postsynaptic calcium levels, e.g., dendritic calcium spikes, have also been shown to facilitate LTP induction (Kampa et al., 2006). Could spine neck change be an essential first step in the process of LTP induction? The tenfold change in diffusional resistance we report here leads to increased Ca2+ influx during the EPSP, but will in addition prolong the residence time of Ca2+-activated second messengers, e.g., αCaMKII, in the active spine. We suggest that electrical and chemical isolation induced by high spine neck resistance cooperate to facilitate the induction of long-term plasticity at spine synapses. Therefore, although spine neck changes have little direct impact on EPSP amplitudes at the soma, they could be a key mechanism for synaptic metaplasticity.
Footnotes
This work was supported by the Novartis Research Foundation and the Gebert Rüf Foundation. We thank M. van Rossum for advice on biophysical modeling, D. Gerosa-Erni for technical assistance, and A. Lüthi and R. W. Friedrich for comments on this manuscript.
References
- Araya R, Eisenthal KB, Yuste R. Dendritic spines linearize the summation of excitatory potentials. Proc Natl Acad Sci U S A. 2006;103:18799–18804. doi: 10.1073/pnas.0609225103. [DOI] [PMC free article] [PubMed] [Google Scholar]
- Araya R, Nikolenko V, Eisenthal KB, Yuste R. Sodium channels amplify spine potentials. Proc Natl Acad Sci U S A. 2007;104:12347–12352. doi: 10.1073/pnas.0705282104. [DOI] [PMC free article] [PubMed] [Google Scholar]
- Biess A, Korkotian E, Holcman D. Diffusion in a dendritic spine: the role of geometry. Phys Rev E Stat Nonlin Soft Matter Phys. 2007;76 doi: 10.1103/PhysRevE.76.021922. 021922. [DOI] [PubMed] [Google Scholar]
- Bloodgood BL, Sabatini BL. Neuronal activity regulates diffusion across the neck of dendritic spines. Science. 2005;310:866–869. doi: 10.1126/science.1114816. [DOI] [PubMed] [Google Scholar]
- Bloodgood BL, Sabatini BL. Nonlinear regulation of unitary synaptic signals by CaV(2.3) voltage-sensitive calcium channels located in dendritic spines. Neuron. 2007;53:249–260. doi: 10.1016/j.neuron.2006.12.017. [DOI] [PubMed] [Google Scholar]
- Carter AG, Soler-Llavina GJ, Sabatini BL. Timing and location of synaptic inputs determine modes of subthreshold integration in striatal medium spiny neurons. J Neurosci. 2007;27:8967–8977. doi: 10.1523/JNEUROSCI.2798-07.2007. [DOI] [PMC free article] [PubMed] [Google Scholar]
- Cash S, Yuste R. Linear summation of excitatory inputs by CA1 pyramidal neurons. Neuron. 1999;22:383–394. doi: 10.1016/s0896-6273(00)81098-3. [DOI] [PubMed] [Google Scholar]
- Chen HX, Otmakhov N, Lisman J. Requirements for LTP induction by pairing in hippocampal CA1 pyramidal cells. J Neurophysiol. 1999;82:526–532. doi: 10.1152/jn.1999.82.2.526. [DOI] [PubMed] [Google Scholar]
- Conti R, Lisman J. The high variance of AMPA receptor- and NMDA receptor-mediated responses at single hippocampal synapses: evidence for multiquantal release. Proc Natl Acad Sci U S A. 2003;100:4885–4890. doi: 10.1073/pnas.0630290100. [DOI] [PMC free article] [PubMed] [Google Scholar]
- Emptage N, Bliss TV, Fine A. Single synaptic events evoke NMDA receptor-mediated release of calcium from internal stores in hippocampal dendritic spines. Neuron. 1999;22:115–124. doi: 10.1016/s0896-6273(00)80683-2. [DOI] [PubMed] [Google Scholar]
- Foehring RC, Mermelstein PG, Song WJ, Ulrich S, Surmeier DJ. Unique properties of R-type calcium currents in neocortical and neostriatal neurons. J Neurophysiol. 2000;84:2225–2236. doi: 10.1152/jn.2000.84.5.2225. [DOI] [PubMed] [Google Scholar]
- Gasparini S, Magee JC. State-dependent dendritic computation in hippocampal CA1 pyramidal neurons. J Neurosci. 2006;26:2088–2100. doi: 10.1523/JNEUROSCI.4428-05.2006. [DOI] [PMC free article] [PubMed] [Google Scholar]
- Golding NL, Kath WL, Spruston N. Dichotomy of action-potential backpropagation in CA1 pyramidal neuron dendrites. J Neurophysiol. 2001;86:2998–3010. doi: 10.1152/jn.2001.86.6.2998. [DOI] [PubMed] [Google Scholar]
- Grutzendler J, Kasthuri N, Gan WB. Long-term dendritic spine stability in the adult cortex. Nature. 2002;420:812–816. doi: 10.1038/nature01276. [DOI] [PubMed] [Google Scholar]
- Harris KM, Stevens JK. Dendritic spines of CA 1 pyramidal cells in the rat hippocampus: serial electron microscopy with reference to their biophysical characteristics. J Neurosci. 1989;9:2982–2997. doi: 10.1523/JNEUROSCI.09-08-02982.1989. [DOI] [PMC free article] [PubMed] [Google Scholar]
- Harvey CD, Svoboda K. Locally dynamic synaptic learning rules in pyramidal neuron dendrites. Nature. 2007;450:1195–1200. doi: 10.1038/nature06416. [DOI] [PMC free article] [PubMed] [Google Scholar]
- Hines ML, Carnevale NT. The NEURON simulation environment. Neural Comput. 1997;9:1179–1209. doi: 10.1162/neco.1997.9.6.1179. [DOI] [PubMed] [Google Scholar]
- Jahr CE, Stevens CF. Voltage dependence of NMDA-activated macroscopic conductances predicted by single-channel kinetics. J Neurosci. 1990;10:3178–3182. doi: 10.1523/JNEUROSCI.10-09-03178.1990. [DOI] [PMC free article] [PubMed] [Google Scholar]
- Kampa BM, Letzkus JJ, Stuart GJ. Requirement of dendritic calcium spikes for induction of spike-timing-dependent synaptic plasticity. J Physiol. 2006;574:283–290. doi: 10.1113/jphysiol.2006.111062. [DOI] [PMC free article] [PubMed] [Google Scholar]
- Kirov SA, Sorra KE, Harris KM. Slices have more synapses than perfusion-fixed hippocampus from both young and mature rats. J Neurosci. 1999;19:2876–2886. doi: 10.1523/JNEUROSCI.19-08-02876.1999. [DOI] [PMC free article] [PubMed] [Google Scholar]
- Koch C. Biophysics of computation. New York: Oxford UP; 1999. [Google Scholar]
- Koch C, Poggio T. The biophysical properties of spines as a basis for their electrical function: a comment on Kawato & Tsukahara (1983) J Theor Biol. 1985;113:225–229. doi: 10.1016/s0022-5193(85)80225-3. [DOI] [PubMed] [Google Scholar]
- Koch C, Zador A. The function of dendritic spines: devices subserving biochemical rather than electrical compartmentalization. J Neurosci. 1993;13:413–422. doi: 10.1523/JNEUROSCI.13-02-00413.1993. [DOI] [PMC free article] [PubMed] [Google Scholar]
- Koester HJ, Sakmann B. Calcium dynamics in single spines during coincident pre- and postsynaptic activity depend on relative timing of back-propagating action potentials and subthreshold excitatory postsynaptic potentials. Proc Natl Acad Sci U S A. 1998;95:9596–9601. doi: 10.1073/pnas.95.16.9596. [DOI] [PMC free article] [PubMed] [Google Scholar]
- Kovalchuk Y, Eilers J, Lisman J, Konnerth A. NMDA receptor-mediated subthreshold Ca2+ signals in spines of hippocampal neurons. J Neurosci. 2000;20:1791–1799. doi: 10.1523/JNEUROSCI.20-05-01791.2000. [DOI] [PMC free article] [PubMed] [Google Scholar]
- Magee J, Hoffman D, Colbert C, Johnston D. Electrical and calcium signaling in dendrites of hippocampal pyramidal neurons. Annu Rev Physiol. 1998;60:327–346. doi: 10.1146/annurev.physiol.60.1.327. [DOI] [PubMed] [Google Scholar]
- Majewska A, Tashiro A, Yuste R. Regulation of spine calcium dynamics by rapid spine motility. J Neurosci. 2000;20:8262–8268. doi: 10.1523/JNEUROSCI.20-22-08262.2000. [DOI] [PMC free article] [PubMed] [Google Scholar]
- Matsuzaki M, Ellis-Davies GC, Nemoto T, Miyashita Y, Iino M, Kasai H. Dendritic spine geometry is critical for AMPA receptor expression in hippocampal CA1 pyramidal neurons. Nat Neurosci. 2001;4:1086–1092. doi: 10.1038/nn736. [DOI] [PMC free article] [PubMed] [Google Scholar]
- Matsuzaki M, Honkura N, Ellis-Davies GC, Kasai H. Structural basis of long-term potentiation in single dendritic spines. Nature. 2004;429:761–766. doi: 10.1038/nature02617. [DOI] [PMC free article] [PubMed] [Google Scholar]
- Müller W, Connor JA. Dendritic spines as individual neuronal compartments for synaptic Ca2+ responses. Nature. 1991;354:73–76. doi: 10.1038/354073a0. [DOI] [PubMed] [Google Scholar]
- Nevian T, Sakmann B. Single spine Ca2+ signals evoked by coincident EPSPs and backpropagating action potentials in spiny stellate cells of layer 4 in the juvenile rat somatosensory barrel cortex. J Neurosci. 2004;24:1689–1699. doi: 10.1523/JNEUROSCI.3332-03.2004. [DOI] [PMC free article] [PubMed] [Google Scholar]
- Nimchinsky EA, Yasuda R, Oertner TG, Svoboda K. The number of glutamate receptors opened by synaptic stimulation in single hippocampal spines. J Neurosci. 2004;24:2054–2064. doi: 10.1523/JNEUROSCI.5066-03.2004. [DOI] [PMC free article] [PubMed] [Google Scholar]
- Pologruto TA, Sabatini BL, Svoboda K. ScanImage: Flexible software for operating laser scanning microscopes. Biomed Eng Online. 2003;2:13. doi: 10.1186/1475-925X-2-13. [DOI] [PMC free article] [PubMed] [Google Scholar]
- Polsky A, Mel BW, Schiller J. Computational subunits in thin dendrites of pyramidal cells. Nat Neurosci. 2004;7:621–627. doi: 10.1038/nn1253. [DOI] [PubMed] [Google Scholar]
- Rammes G, Swandulla D, Collingridge GL, Hartmann S, Parsons CG. Interactions of 2,3-benzodiazepines and cyclothiazide at AMPA receptors: patch clamp recordings in cultured neurones and area CA1 in hippocampal slices. Br J Pharmacol. 1996;117:1209–1221. doi: 10.1111/j.1476-5381.1996.tb16718.x. [DOI] [PMC free article] [PubMed] [Google Scholar]
- Schiller J, Major G, Koester HJ, Schiller Y. NMDA spikes in basal dendrites of cortical pyramidal neurons. Nature. 2000;404:285–289. doi: 10.1038/35005094. [DOI] [PubMed] [Google Scholar]
- Segev I, Rall W. Computational study of an excitable dendritic spine. J Neurophysiol. 1988;60:499–523. doi: 10.1152/jn.1988.60.2.499. [DOI] [PubMed] [Google Scholar]
- Sjöström PJ, Rancz EA, Roth A, Häusser M. Dendritic excitability and synaptic plasticity. Physiol Rev. 2008;88:769–840. doi: 10.1152/physrev.00016.2007. [DOI] [PubMed] [Google Scholar]
- Sobczyk A, Scheuss V, Svoboda K. NMDA receptor subunit-dependent [Ca2+] signaling in individual hippocampal dendritic spines. J Neurosci. 2005;25:6037–6046. doi: 10.1523/JNEUROSCI.1221-05.2005. [DOI] [PMC free article] [PubMed] [Google Scholar]
- Svoboda K, Tank DW, Denk W. Direct measurement of coupling between dendritic spines and shafts. Science. 1996;272:716–719. doi: 10.1126/science.272.5262.716. [DOI] [PubMed] [Google Scholar]
- Toni N, Buchs PA, Nikonenko I, Bron CR, Muller D. LTP promotes formation of multiple spine synapses between a single axon terminal and a dendrite. Nature. 1999;402:421–425. doi: 10.1038/46574. [DOI] [PubMed] [Google Scholar]
- Török TL. Electrogenic Na+/Ca2+-exchange of nerve and muscle cells. Prog Neurobiol. 2007;82:287–347. doi: 10.1016/j.pneurobio.2007.06.003. [DOI] [PubMed] [Google Scholar]
- Yasuda R, Sabatini BL, Svoboda K. Plasticity of calcium channels in dendritic spines. Nat Neurosci. 2003;6:948–955. doi: 10.1038/nn1112. [DOI] [PubMed] [Google Scholar]
- Yasuda R, Nimchinsky EA, Scheuss V, Pologruto TA, Oertner TG, Sabatini BL, Svoboda K. Imaging calcium concentration dynamics in small neuronal compartments. Sci STKE. 2004;2004:pl5. doi: 10.1126/stke.2192004pl5. [DOI] [PubMed] [Google Scholar]
- Yuste R, Majewska A, Cash SS, Denk W. Mechanisms of calcium influx into hippocampal spines: heterogeneity among spines, coincidence detection by NMDA receptors, and optical quantal analysis. J Neurosci. 1999;19:1976–1987. doi: 10.1523/JNEUROSCI.19-06-01976.1999. [DOI] [PMC free article] [PubMed] [Google Scholar]
- Zhang YP, Holbro N, Oertner TG. Optical induction of plasticity at single synapses reveals input-specific accumulation of alphaCaMKII. Proc Natl Acad Sci U S A. 2008;105:12039–12044. doi: 10.1073/pnas.0802940105. [DOI] [PMC free article] [PubMed] [Google Scholar]
- Zhou Q, Homma KJ, Poo MM. Shrinkage of dendritic spines associated with long-term depression of hippocampal synapses. Neuron. 2004;44:749–757. doi: 10.1016/j.neuron.2004.11.011. [DOI] [PubMed] [Google Scholar]