

Abstract
Neural plasticity induced by stroke can mediate positive outcomes, such as recovery of function, but can also result in the formation of abnormal connections with negative consequences for perception and cognition. In three experiments using blood-oxygen level dependent (BOLD) functional magnetic resonance imaging, we examined the neural substrates of acquired auditory-tactile synesthesia, in which certain sounds can produce an intense somatosensory tingling sensation in a patient with a thalamic lesion. Compared with nine normal controls, the first experiment showed that the patient had a threefold greater BOLD response to sounds in the parietal operculum, the location of secondary somatosensory cortex. We hypothesized that this abnormal opercular activity might be the neural substrate of the patient's synesthesia. Supporting this hypothesis, the second experiment demonstrated that sounds that produced no somatosensation did not evoke a BOLD response in the operculum, while sounds that produced strong somatosensations evoked large BOLD responses. These abnormal responses may have resulted from plasticity induced by the loss of somatosensory inputs. Consistent with this idea, in the third experiment, BOLD responses to somatosensory stimulation were significantly weaker in the patient's operculum than in normal controls. These experiments demonstrate a double dissociation in the patient's secondary somatosensory cortex (increased responses to auditory stimulation and decreased responses to somatosensory stimulation), and suggest both that stroke-induced plasticity can result in abnormal connections between sensory modalities that are normally separate, and that synesthesia can be caused by inappropriate connections between nearby cortical territories.
Keywords: somatosensory, multisensory integration, auditory, tactile, thalamus, stroke
Introduction
Synesthesia, the confusion of different sensory modalities, has fascinated philosophers and neuroscientists for centuries. Recently, studies examining the neural mechanisms underlying synesthesia have provided tremendous insights into brain function (Cytowic, 1989; Rich and Mattingley, 2002; Hubbard and Ramachandran, 2005). While the somatosensory and auditory modalities share a common feature, they both transduce mechanical vibration, by hair cells in the cochlea in the case of audition, and by skin mechanoreceptors for somatosensation, the two modalities are rarely confused and auditory-tactile synesthesia is one of the rarest forms of synesthesia. Recently, we discovered a patient with acquired auditory-tactile synesthesia: many common sounds produced intense tingling sensations, sometimes so strong that they make her uncomfortable (Ro et al., 2007).
Immediately after her thalamic stroke, this patient reported a loss of sensation on the left (contralateral) half of her body. Approximately 18 months later, she reported the ability to feel sensations in her body in response to certain sounds. Structural MRI and diffusion tensor imaging revealed a small stroke in the ventrolateral nucleus (VLN) that had disrupted white matter pathways from the thalamus to cortex, but the functional mechanisms underlying this acquired synesthesia remained a mystery. Since ischemic damage resulting from stroke is associated with marked changes in brain plasticity (Carmichael, 2006), we hypothesized that brain plasticity after stroke led to the formation of an inappropriate link between two previously independent sensory modalities.
To determine the plastic brain changes that could account for the patient's acquired synesthesia, we performed three separate blood-oxygen level dependent (BOLD) functional magnetic resonance imaging (fMRI) experiments to study the neural substrates of auditory and touch processing in the patient. The patient's brain responses were compared with those of nine normal controls to isolate neural responses specific to the synesthetic brain.
Materials and Methods
Patient SR.
Subjects were recruited and informed consent was obtained in accordance with the University of Texas Committee for the Protection of Human Subjects and the Institutional Review Board at Rice University. The patient was a 40-year-old, right-handed female professor who sustained a lacunar infarct to the right VLN of the thalamus. The patient reported no form of synesthesia before the infarct. However, beginning ∼18 months after the infarct, she reported strong somatosensory percepts, primarily in her left hand and/or arm, in response to auditory stimulation (Ro et al., 2007). These percepts persisted through the time of functional imaging which took place 6 years poststroke, the same time period as the third session of diffusion tensor imaging described by Ro et al. (2007). Nine healthy subjects (5 F, 4 M) who reported no synesthesia or other abnormal sensory percepts and without history of brain trauma or injury (corroborated by neuroradiological examination of T1- and T2-weighted MR scans) were recruited to serve as normal controls.
Experiment 1.
In experiment 1, a block design was used to present auditory stimuli. Each block lasted for 20 s and contained 10 different auditory stimuli consisting of a variety of natural and artificial sound samples, including recordings of animal calls, recordings of man-made objects (both manual and powered), scrambled versions of these recordings, and pure tones (Beauchamp et al., 2004a,b). After each block, there was a 10 s interblock interval with no auditory stimulation. The visual display remained constant at all times and consisted of a centrally presented white crosshairs, which the subject fixated, on a black background without any other behavioral task. In each scan series, there were eight blocks, and four scan series were presented, for a total of 32 blocks.
Experiment 2.
Before the scanning session, two behavioral testing sessions were conducted in which 110 different natural and artificial sounds were presented and the patient's self-reported percepts were recorded. Most sounds (73%) evoked a somatosensory percept with a high degree of consistency (91%) across different testing sessions. A subset of sounds that produced a diverse range of percept intensities were selected for use in the fMRI experiment. A slow event-related design was used to present individual auditory stimuli (see Fig. 2A). Each trial lasted for 14 s and contained four epochs. In the first epoch (duration 6 s), three repetitions of the same auditory stimulus were played in succession while the subject fixated a single, centrally presented white crosshairs. In the second epoch (4 s), the central fixation crosshairs were replaced by a visual choice display containing the words “none,” “hand,” “forearm,” and “whole arm.” The subject fixated one of four crosshairs located above each word to signal the location of the somatosensory percept triggered by the auditory stimulus (or “none” if there was no percept). In the third epoch (4 s), another choice display was presented containing the words “none,” “weak,” “medium,” and “strong,” and the subject fixated one of four crosshairs to signal the intensity of the somatosensory percept. The two choice screens contained different words, and the font color was changed from white to purple between the second and third epochs, to ensure a clear distinction between them. In the fourth epoch (4 s), the subject fixated a white central crosshairs with no auditory stimulus. Each scan series contained 13 trials, and four scan series were presented for a total of 52 trials.
Figure 2.

Correlation of BOLD fMRI signal with perception in synesthesia. A, Stimulus and task paradigm. Each trial contained four epochs. The first epoch consisted of three presentations of the same auditory stimulus (shown by spectrograms in row labeled “Aud”) and a visual fixation screen (row labeled “Vis”) for a duration of 6 s (row labeled “Time”). In the second epoch, the patient fixated a word corresponding to the location of the somatosensory percept (if any). In the third epoch, the patient fixated the intensity of the somatosensory percept. In the fourth epoch, the subject fixated (resting baseline). B, Average response to trials, classified by whether they evoked none or a weak somatosensory percept (left trace, mean response of OP1 and OP4 voxels ±SEM) or a medium or strong somatosensory percept (right trace). C, The amplitude of the fMRI signal to single trials classified by the strength of the evoked somatosensory percepts.
Experiment 3.
In experiment 3, a rapid event-related design was used to present somatosensory stimuli (see Fig. 3A). The somatosensory stimuli were delivered using piezoelectric benders attached with elastic bandages (Beauchamp et al., 2007, 2008). When activated, the benders (67 mm × 32 mm) produced an intense vibrotactile percept similar to that of holding a vibrating pager or cell phone, without any accompanying auditory stimulation. Before the fMRI experiment, the bender driving voltage was individually adjusted using a relay box with potentiometers (in the range of 40–50 V, 0.4–0.5 mm) to equate the perceived intensity across benders. This controlled for differences in efficacy caused by small differences in the placement, attachment or manufacture of individual benders. There was no systematic difference in the stimulation voltage between stimulation sites, and the patient was easily able to detect the stimulation at all sites.
Figure 3.
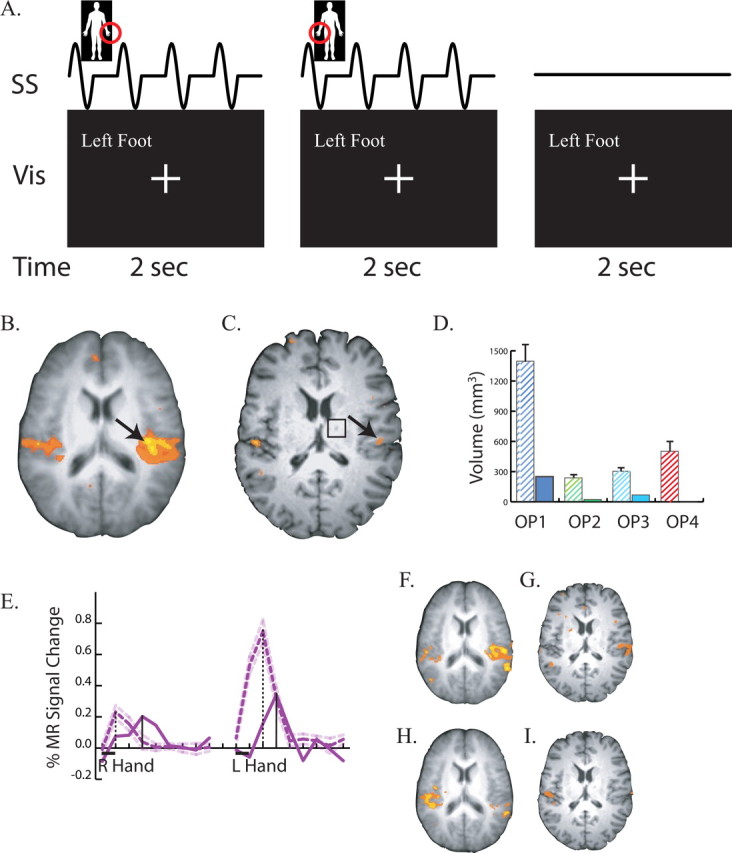
Responses to somatosensory stimulation. A, Stimulus and task paradigm. Three successive 2 s trials are shown. The somatosensory stimulus (row labeled “SS”) consisted of four repetitions of 200 Hz vibrotactile stimulation within a 250 ms ON/250 ms OFF square wave envelope delivered to the body part circled in red (left hand in first trial, right hand in second trial, no stimulation in third trial). The visual stimulus (labeled “Vis”) was identical in all trials. The behavioral task was to fixate the central crosshairs at all times, except when the left foot was stimulated, when the subject fixated the words “Left Foot.” B, An axial slice at the location of secondary somatosensory cortex in the operculum. Underlay shows average anatomical dataset from nine normal controls; colored voxels show significant responses to somatosensory stimulation (p < 0.01 corrected). Black arrow highlights strong opercular activity. C, Responses to somatosensory stimulation in the patient's operculum. Black arrow highlights weak activity. Black square shows location of right thalamic lesion. D, Volume of cortex responding to somatosensory stimulation in four cytoarchitectonic subdivisions of the operculum. The left hatched bar in each pair shows the mean ± SEM volume in nine normal controls; the right solid bar in each pair shows the patient. The label under each pair of bars identifies the subdivision. E, BOLD fMRI time course of the response to somatosensory stimulation. The black bar under the x-axis shows the duration of the 2 s stimulation trial for right hand stimulation (left trace) and left hand stimulation (right trace). Purple lines show the deconvolved event-related time series representing the average response to a single trial. Solid purple line shows the signal change in the peak operculum voxel of the patient (black arrow in C). Dashed purple line shows the peak signal change (mean ± SEM) in nine normal controls. Vertical black lines show the latency of the peak of the response (solid bar for patient, dashed bar for patient). F, Responses to left hand stimulation in the operculum of normal controls. G, Responses to left hand stimulation in the patient. H, Responses to right hand stimulation in the operculum of normal controls. I, Responses to right hand stimulation in the patient.
During the fMRI experiment, each trial lasted for 2 s. During each trial, one of six body parts was stimulated: either the palm of the left hand, the top of the left hand, the palm of the right hand, the top of the right hand, the sole of the left foot, or the sole of the right foot. In each trial, a vibrotactile stimulus was delivered to the appropriate body part by the attached bender with a waveform containing 4 “on/off” cycles. The cycle duration was 500 ms and each 250 ms “on” cycle contained a driving voltage with sinusoidal 200 Hz oscillations. In a seventh type of trial (baseline), no stimulation was delivered. The subject was instructed to fixate a central crosshairs during all trials, except when the left foot was stimulated. During these trials, the subject fixated the words “Left Foot” which were present at all times on the visual display. In each scan series, there were 150 total trials, with 18 trials for each body part and 42 baseline trials. Six scan series were presented, for a total of 108 trials for each body part.
General MRI methods.
The patient was scanned using a 3 tesla whole-body MR scanner (Phillips Medical Systems). Across three scanning session, six repetitions were collected of a magnetization-prepared 180 degrees radio-frequency pulses and rapid gradient-echo (MP-RAGE) sequence optimized for gray-white matter contrast with 1-mm-thick sagittal slices and an in-plane resolution of 0.938 × 0.938 mm. Functional images were collected using a gradient-recalled-echo echo-planar-imaging sequence sensitive to the BOLD signal. Thirty-three axial slices were collected with a repetition time (TR) of 2000 ms, an echo time (TE) of 30 ms and a flip angle of 90°. Slice thickness was 3 mm, and in-plane resolution was 2.75 × 2.75 mm.
Stimuli and eye tracking.
Visual stimuli were back-projected from an LCD projector (Sony Electronics) onto a Lucite screen (Da-Lite) located behind the scanner and viewed through a mirror attached to the MR head coil. Auditory stimuli were delivered using the scanner manufacturer's MR-compatible headphones and amplifier. An MR-compatible eye-tracking system (Applied Science Laboratories) was used to monitor fixation and record behavioral responses.
fMRI experimental design and data analysis.
fMRI data were analyzed using AFNI (Cox, 1996). Cortical surface models were created with FreeSurfer (Fischl et al., 1999) and visualized in SUMA (Argall et al., 2006). After motion correction and slice timing correction, data were smoothed with a spatial Gaussian filter with root-mean-square deviation of 3 mm. Then, the time series data were analyzed with the general linear model; the motion correction estimates were used as regressors of no interest. In experiment 1, a single regressor of interest was used consisting of the duration of auditory stimulation block convolved with a gamma-variate function. In experiment 2, separate gamma-variate functions were used to model the response to the auditory stimulus (first epoch) and each eye-movement response (second and third epochs). There were two regressors for the auditory stimulus: all trials classified as producing none/weak somatosensory percepts, and all trials classified as producing medium/strong somatosensory percepts. Experiment 3 was analyzed with finite impulse response deconvolution (Saad et al., 2006) with nine separate regressors spaced at the TR of 2 s for each trial type modeling the response from 0 to 16 s after stimulus onset. This allowed estimation of the hemodynamic response to each trial type as if it had been presented in isolation in a slow event-related design. All activation maps were threshold at p < 0.01, corrected for false discovery rate (Genovese et al., 2002). Statistical comparisons between the patient and the normal controls were performed using one-sample t tests to test the null hypothesis H0 that μ = μ0 where μ was the population mean and μ0 was the patient observation.
Individual subject brains were normalized to the N27 brain in MNI standard space. Anatomical parcellation of the operculum was performed using an atlas in the N27 space constructed from postmortem cytoarchitectonic analyses of 10 human brains (Eickhoff et al., 2007).
Results
Experiment 1
In the first fMRI experiment, brain responses to blocked auditory stimuli were measured and compared with activations in nine healthy control subjects (Fig. 1). Both normal controls (Fig. 1A) and the patient (Fig. 1B) showed strong auditory responses in planum temporale and Heschl's gyrus, the location of core areas of auditory cortex. Unlike normal controls (Fig. 1C), the patient (Fig. 1D) also showed strong auditory responses bilaterally in the posterior insula and the adjacent parietal operculum, the location of secondary somatosensory cortex.
Figure 1.
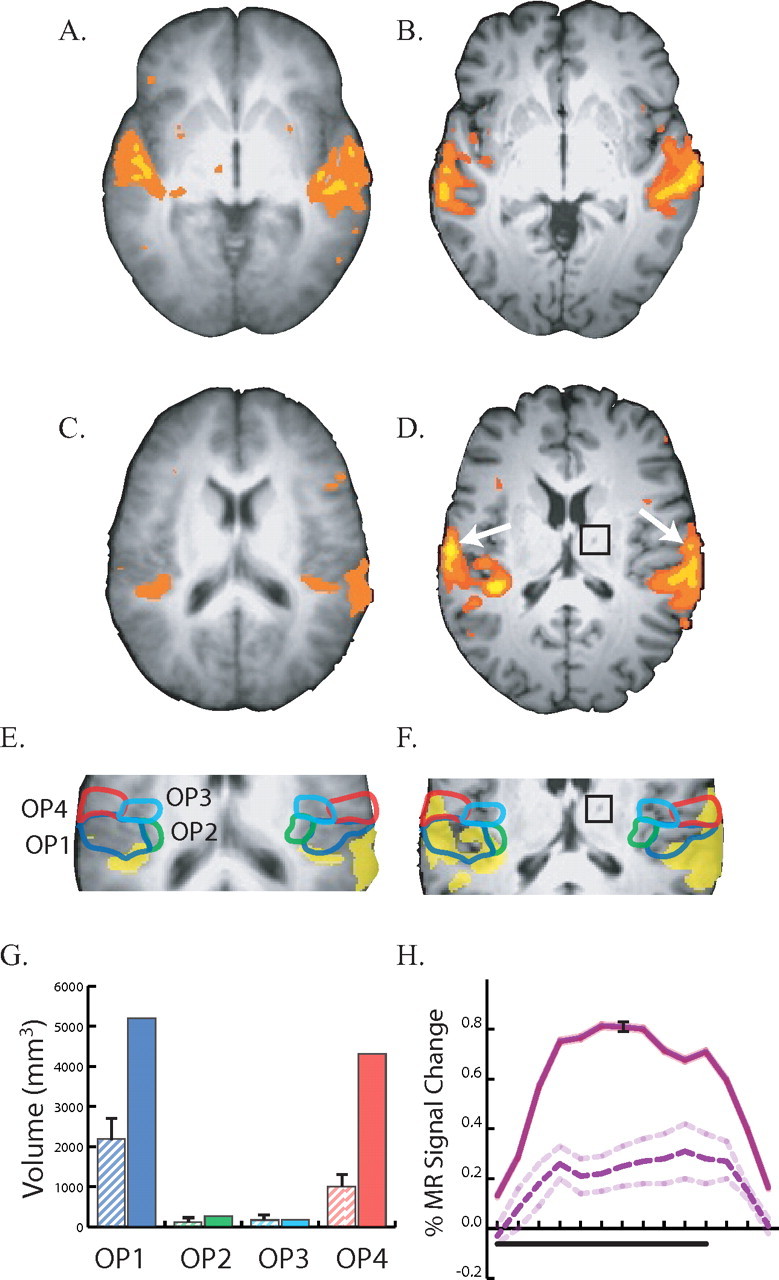
Responses to auditory stimulation in controls (A, C, E) and the patient (B, D, F). A, An axial slice at the location of auditory cortex (z = 0 mm). Underlay shows average anatomical dataset from nine normal controls; colored voxels show significant responses to auditory stimulation (p < 0.01 corrected). Left is left in all figures. B, Responses to auditory stimulation in auditory cortex (z = 0 mm) of the patient. C, An axial slice through secondary somatosensory cortex (z = 17 mm) in the parietal operculum in an average control dataset, showing weak auditory responses. D, Strong auditory responses in the patient's operculum (z = 17 mm), highlighted with white arrows. The black square shows the location of the thalamic lesion in the patient's right thalamus. E, Enlarged view of the operculum in normal controls. Active voxels are colored yellow; colored outlines show cytoarchitectonic subdivisions of the operculum. Blue line, OP1; green line, OP2; cyan line, OP3; red line, OP4. F, Enlarged view of opercular auditory responses in the patient with cytoarchitectonic boundaries (black square shows thalamic lesion). G, Volume of cortex responding to auditory stimulation in four cytoarchitectonic subdivisions of the operculum. The label under each pair of bars identifies the subdivision. The left hatched bar in each pair shows the mean ± SEM volume in nine normals; the right solid bar shows the volume in the patient; bar colors correspond to outline colors in E. H, Evoked response to auditory stimulation. Black bar under x-axis shows duration of a block of 10 different 2 s auditory stimuli. Solid purple line shows mean time series from OP1 and OP4 in the patient (black error bars show SEM). Dashed purple line shows mean time series from OP1 and OP4 in nine normal controls (dashed line shows SEM).
To better characterize this abnormal activity, a cytoarchitectonic atlas was used to parcellate the operculum into four areas (OP1, OP2, OP3 and OP4) in normal controls (Fig. 1E) and in the patient (Fig. 1F). While the patient had a large volume of sound-responsive cortex in OP1 (5195 mm3) and OP4 (4311 mm3), the group map created from normal controls showed much less activity in both OP1 (810 mm3) and OP4 (162 mm3).
Because group maps are created voxel-by-voxel, the reduced activity in the group map could reflect variability in the spatial location of sound-responsive somatosensory cortex across the normal controls, rather than an actual difference in the volume of active cortex between patient and controls. To distinguish these possibilities, we measured the volume of active cortex in the cytoarchitectonic subdivisions of individual normal control subjects. In the patient, the volume of auditory-responsive cortex in OP1 was double the volume observed in individual controls (5195 vs 2198 mm3, p < 0.05) and the volume of active cortex in OP4 was more than four times that observed in controls (4311 vs 1006 mm3, p < 0.0001), as shown in Figure 1G.
To verify that these auditory responses were robust, we plotted the mean BOLD time series from voxels in OP1 and OP4 (Fig. 1H). The time series from the patient showed a hemodynamic response characteristic of those observed in block-design fMRI experiments, with a response that peaked 6 s after stimulus onset and returned to baseline after stimulus offset. The amplitude of the patient's OP1/4 auditory response was threefold stronger than the response in normal controls (0.77 vs 0.26%, p < 0.01).
An earlier study found that smoothing fMRI data with a coarse, 972 mm3 (9 × 9 × 12 mm) Gaussian filter blurred the auditory activation map significantly, such that activity originally confined to Heschl's gyrus was mislocalized in the parietal operculum, across the Sylvian fissure from its true location (Ozcan et al., 2005). All data in our study was smoothed with a fine filter that was 36 times smaller (27 mm3, 3 × 3 × 3 mm) than in that study. Furthermore, robust auditory activity persisted in the patient's operculum even with no smoothing, demonstrating that the opercular auditory activity was not a consequence of a smoothing artifact.
Experiment 2
Previous studies demonstrated that some sounds consistently produced somatosensory percepts in the patient, while others produced little or no somatosensory percepts, with a very high degree of consistency across different testing sessions (Ro et al., 2007). We hypothesized that there might be a relationship between the patient's auditory-evoked responses in somatosensory cortex and her abnormal somatosensory percepts. To test this hypothesis, experiment 2 compared the patient's somatosensory percepts with the degree of somatosensory cortex activation to different sounds. A slow event-related design was used to record responses to individual sounds (Fig. 2A). The patient rated the intensity and location of the somatosensory percept produced by each sound immediately after hearing it. Eye movements instead of manual button presses were used for rating to prevent contamination of abnormal somatosensory cortex activations arising from sounds with normal somatosensory cortex activations from manual responses.
Based on the patient's ratings, we divided the sounds into those that evoked a strong (or medium) somatosensory percept and those that evoked a weak (or no) somatosensory percept. Because of the limited power of the slow event-related design, the fMRI analysis focused on those subdivisions of the operculum (OP1 and OP4) that exhibited a strong auditory response in experiment 1. The BOLD response in OP1/4 was significantly higher for auditory stimuli that evoked a strong somatosensory percept compared with those that evoked a weak percept (0.92 vs 0.51%, p < 0.0001) (Fig. 2B). To determine if this effect was consistent, we plotted the response to individual stimuli (Fig. 2C). Sounds that produced no somatosensory percept evoked no BOLD response (mean 0.0%), while auditory stimuli that produced stronger percepts evoked progressively higher responses, with a mean of 0.6% for weak percepts, 0.7% for medium percepts and 1.1% for strong percepts. A single-factor ANOVA with percept intensity as the fixed factor showed a significant effect (F(3,50) = 5.5, p = 0.003). Coding intensity numerically (0 for none to 4 for strong) confirmed a strong positive correlation between OP1/4 response amplitude and somatosensory percept intensity (r = 0.45, p = 0.0003).
The experimental design required the patient to report the perceived location of each somatosensory percept. The patient reported that most of the somatosensory percepts extended over the whole arm (18), with fewer percepts localized primarily to the forearm or hand (10 total). There was no correlation between the perceived intensity and the perceived locations of the somatosensory percept (mean intensity rating for whole arm stimuli, 1.8; mean intensity rating for forearm and hand stimuli, 1.7).
During behavioral testing, the subject was presented with a recording of the MR scanner gradients during echo-planar data acquisition. The patient reported no tactile sensations. An interview immediately after fMRI data acquisition confirmed that the sound of the scanner itself did not induce tactile sensations.
Experiment 3
When sensory cortex does not receive inputs from its normal sensory receptors, it can reorganize to become responsive to other inputs (Buonomano and Merzenich, 1998). In the initial period after her right thalamic stroke, the patient reported contralateral (left side) numbness. Although the numbness later resolved, the reorganization model predicts that, even after recovery, the patient's operculum should be less responsive to somatosensory stimulation than the operculum of normal controls. To test this prediction, we measured the response of the operculum to somatosensory stimulation in the patient and in nine normal controls (Fig. 3).
The patient reported feeling strong vibrations from the powerful somatosensory stimulators on her hands and feet and successfully detected 100% of the left foot trials. However, there were far fewer active voxels in the patient's secondary somatosensory cortex in parietal operculum (Fig. 3C) than were observed in the group activation map from normal controls (Fig. 3B). To quantify this difference, the volume of active cortex in each cytoarchitectonic subdivision of the right operculum was measured (Fig. 3D). There were significantly fewer active voxels in the patient versus individual controls in each opercular subdivision (p < 0.01 corrected), with the largest difference in OP1 (1397 mm3 vs 250 mm3).
To observe the dynamics of the BOLD fMRI response, we examined the time series in the most responsive voxel in the right operculum (Fig. 3E). The magnitude of the response to ipsilateral (right hand) touch was similar to that of normal controls (0.20 vs 0.23%). However, the amplitude of the BOLD response to contralateral (left hand) touch was less than half the response in normal controls (0.34 vs 0.75%, p < 0.0001). The time course of the response also appeared to be slower in the patient than in normal controls. For left hand touch, the peak response was reached at 6 s after stimulus onset in the patient compared with 4 s after stimulus onset in the normal controls; a similar delay in the peak response was observed for right hand touch.
Separate activation maps were created for left hand and right hand touch in the normal controls (Fig. 3F,H) and in the patient (Fig. 3G,I). In normal controls, activation in secondary somatosensory cortex in the operculum was observed both contralateral and ipsilateral to the stimulated hand for both left and right hand touch. In the patient, contralateral and ipsilateral activity was weaker than controls for both left and right hand touch.
Discussion
Approximately 18 months after a small thalamic stroke, patient SR developed a rare form of auditory-tactile synesthesia, in which sounds produce somatosensory percepts. In experiments 1 and 2, fMRI was used to measure the brain's response to sounds. The patient's secondary somatosensory cortex in the parietal operculum responded strongly to sounds, especially subdivisions OP1 and OP4; normal controls showed only weak opercular responses to sounds. This suggests that the patient's auditory-tactile synesthesia is a result of abnormal auditory activation of somatosensory cortex, which is perceived as a somatosensory stimulus.
In normal subjects, vibrotactile stimulation produces strong brain responses in the parietal operculum (Fox et al., 1987; Seitz and Roland, 1992; Coghill et al., 1994). The parietal operculum has long been known to contain secondary somatosensory cortex (S2), but recent studies suggest that the human parietal operculum contains four distinct areas, termed OP1–4, each with its own somatotopic map (Eickhoff et al., 2007). In experiment 3, we showed that the opercular region responds less to somatosensory stimuli in the patient compared with normal controls. This double dissociation of weaker S2 responses to somatosensory stimuli and stronger responses to auditory stimuli in the patient, compared with normal controls, indicates that the functional organization of this region has been affected by the patient's stroke, and implicates S2 as the underlying neural substrate responsible for the patient's percept of touch in response to sound.
A number of lines of evidence support this idea. Electrical stimulation of human S2 usually produces somatosensory percepts, known as cutaneous paresthesiae: neutral or unpleasant sensations of tingling, light touch, or slight electric current (Penfield and Rasmussen, 1950). These are very similar to the synesthetic percepts described by the patient (Ro et al., 2007). Neurons in S2 have large receptive fields that respond to stimuli presented over extended regions of the body surface (Iwamura, 2000). The synesthetic percepts described by the patient usually extended over her hand and arm, sometimes including the face [as described by Ro et al. (2007)]. Correspondingly, direct electrical stimulation of S2 evokes sensations over a large region of the body surface, with an over-representation of the face and hand (Mazzola et al., 2006). This is in sharp contrast to the focal receptive fields of S1 and the restricted somatosensory percepts evoked by electrical stimulation of S1 (Mazzola et al., 2006).
In previous experiments, we noted that some sounds consistently produced somatosensory percepts in the patient while others did not (Ro et al., 2007). As a direct test of the relationship between S2 activity and the patient's synesthetic percepts, in experiment two BOLD fMRI was used to measure brain response to both types of sounds. Sounds that did not produce synesthetic percepts evoked weak responses in S2, while sounds that produced strong synesthetic percepts evoked strong responses in S2, supporting the idea of a causal link between S2 activity and somatosensory percepts.
Because the patient's synesthesia began after a stroke, functional reorganization seemed like a logical candidate for its source. Consistent with this reorganization account, for ∼2 years after her stroke, the patient had reduced sensitivity to visual and somatosensory stimuli, especially those presented on her contralesional (left) side. As these deficits resolved, the patient began to experience auditory-tactile synesthesia. By the time of her fMRI examinations, ∼6 years poststroke, her visual and auditory deficits were not detectable, and only mild somatosensory deficits and the synesthesia remained.
This timeline suggests that somatosensory cortex slowly reorganized because of deprivation of its normal inputs after the stroke, becoming responsive to auditory stimulation. This model predicts that the patient's operculum should be less responsive to somatosensory stimulation. In experiment 3, this prediction was confirmed by measuring fMRI responses to somatosensory stimulation. The patient showed only weak opercular responses to somatosensory stimulation, with a smaller volume of active cortex across all opercular subdivisions (OP1–4). The amplitude of the patient's right operculum response to contralesional stimulation was half that of normal controls. In addition to the diminished amplitude of response, the time-to-peak of the BOLD signal was also ∼2 s slower in the patient than in normal controls, emphasizing the abnormal nature of opercular somatosensory responses in the patient.
On the cortical surface, opercular somatosensory cortex is adjacent to auditory association areas. Multisensory zones are frequently located on such borders between unisensory cortices (Wallace et al., 2004; Beauchamp et al., 2008). Interactions between auditory and somatosensory modalities in the perisylvian region have been suggested by imaging studies showing overlapping responses to sound and touch in this region (Foxe et al., 2002; Ozcan et al., 2005; Schurmann et al., 2006). Consistent with these studies, Experiment 1 showed weak, but consistent auditory responses in the operculum of normal controls.
Both short-term and long-term plastic changes in connectivity between the auditory and somatosensory cortex could have contributed to patient SR's auditory opercular responses. Anatomical connections between sensory modalities exist at early stages of the cortical processing hierarchy, such as between auditory and visual cortex (Falchier et al., 2002; Rockland and Ojima, 2003; Bizley et al., 2007) and between somatosensory and auditory cortex (Schroeder et al., 2001). Thus, short-term unmasking of connections between adjacent auditory and somatosensory cortex could have contributed to the patient's auditory opercular responses, as observed in patients who experience phantom sensations shortly after limb amputation or mastectomy (Aglioti et al., 1994; Borsook et al., 1998). Because of the delayed and gradual onset of the synesthesia 18 months poststroke, long-term plastic changes such as axonal sprouting may have played a more prominent role than unmasking. This idea is supported by longitudinal data showing continuing changes in thalamo-cortical connections in the years after the stroke that paralleled the patient's behavioral changes (Ro et al., 2007). The time course of the development of patient SR's synesthesia is similar to that of patient PH, who developed visual-tactile synesthesia 2 years after complete loss of vision (Armel and Ramachandran, 1999). Phantom limb sensations also reorganize over the course of years, suggesting the importance of axonal sprouting and cortical plasticity in understanding both phenomena (Ramachandran and Hirstein, 1998).
Representations in secondary somatosensory cortex are bilateral, with responses in each hemisphere to both ipsilateral and contralateral stimulation. Consistent with this finding, the patient's left hemisphere responded to both left and right hand touch, but the lesioned right hemisphere responded only weakly to ipsilateral (right hand) touch. Overall, brain responses to both right hand and left hand touch were weak compared with controls. The overall smaller cortical responses to touch in the patient, coupled with the weak right hemisphere somatosensory response to ipsilateral tactile stimulation, might be a further indication of cortical reorganization after the thalamic stroke. Tactile sensations in the hand can be affected by manipulations of the other hand (Werhahn et al., 2002) or modulation of cortical activity in the ipsilateral hemisphere (Seyal et al., 1995). While the precise nature of thalamo-cortical function in the somatosensory system is still unknown (Sherman, 2007) these results suggest that the thalamus may play a role in modulating and coordinating bilateral, ipsilateral, and contralateral responses in the cortex.
In conclusion, we have shown that the secondary somatosensory cortex is responsive to sounds in a patient with auditory-tactile synesthesia after a thalamic stroke. After ischemic insults, there may be an increase in axonal sprouting, unmasking of existing connections, and other measures of neuronal plasticity. These changes likely created the opportunity for compensatory functional rewiring in the patient leading to the patient's synesthesia (Rouw and Scholte, 2007). These findings suggest that stroke-induced plasticity can be a double-edged sword; prompt rehabilitation may prevent the formation of inappropriate connections (Cramer, 2008). For this patient, intensive somatosensory stimulation and rehabilitation during the period of poststroke numbness might have prevented the formation of inappropriate connections and the development of synesthesia.
Footnotes
We thank the patient for her invaluable cooperation. M.S.B. and T.R. designed the experiments; M.S.B. collected and analyzed the neuroimaging data; M.S.B. and T.R. wrote this manuscript.
References
- Aglioti S, Cortese F, Franchini C. Rapid sensory remapping in the adult human brain as inferred from phantom breast perception. Neuroreport. 1994;5:473–476. doi: 10.1097/00001756-199401120-00026. [DOI] [PubMed] [Google Scholar]
- Argall BD, Saad ZS, Beauchamp MS. Simplified intersubject averaging on the cortical surface using SUMA. Hum Brain Mapp. 2006;27:14–27. doi: 10.1002/hbm.20158. [DOI] [PMC free article] [PubMed] [Google Scholar]
- Armel KC, Ramachandran R. Acquired synesthesia in retinitis pigmentosa. Neurocase. 1999;5:293–296. [Google Scholar]
- Beauchamp MS, Lee KE, Argall BD, Martin A. Integration of auditory and visual information about objects in superior temporal sulcus. Neuron. 2004a;41:809–823. doi: 10.1016/s0896-6273(04)00070-4. [DOI] [PubMed] [Google Scholar]
- Beauchamp MS, Argall BD, Bodurka J, Duyn JH, Martin A. Unraveling multisensory integration: patchy organization within human STS multisensory cortex. Nat Neurosci. 2004b;7:1190–1192. doi: 10.1038/nn1333. [DOI] [PubMed] [Google Scholar]
- Beauchamp MS, Yasar NE, Kishan N, Ro T. Human MST but not MT responds to tactile stimulation. J Neurosci. 2007;27:8261–8267. doi: 10.1523/JNEUROSCI.0754-07.2007. [DOI] [PMC free article] [PubMed] [Google Scholar]
- Beauchamp MS, Yasar NE, Frye RE, Ro T. Touch, sound and vision in human superior temporal sulcus. Neuroimage. 2008;41:1011–1020. doi: 10.1016/j.neuroimage.2008.03.015. [DOI] [PMC free article] [PubMed] [Google Scholar]
- Bizley JK, Nodal FR, Bajo VM, Nelken I, King AJ. Physiological and anatomical evidence for multisensory interactions in auditory cortex. Cereb Cortex. 2007;17:2172–2189. doi: 10.1093/cercor/bhl128. [DOI] [PMC free article] [PubMed] [Google Scholar]
- Borsook D, Becerra L, Fishman S, Edwards A, Jennings CL, Stojanovic M, Papinicolas L, Ramachandran VS, Gonzalez RG, Breiter H. Acute plasticity in the human somatosensory cortex following amputation. Neuroreport. 1998;9:1013–1017. doi: 10.1097/00001756-199804200-00011. [DOI] [PubMed] [Google Scholar]
- Buonomano DV, Merzenich MM. Cortical plasticity: from synapses to maps. Annu Rev Neurosci. 1998;21:149–186. doi: 10.1146/annurev.neuro.21.1.149. [DOI] [PubMed] [Google Scholar]
- Carmichael ST. Cellular and molecular mechanisms of neural repair after stroke: making waves. Ann Neurol. 2006;59:735–742. doi: 10.1002/ana.20845. [DOI] [PubMed] [Google Scholar]
- Coghill RC, Talbot JD, Evans AC, Meyer E, Gjedde A, Bushnell MC, Duncan GH. Distributed processing of pain and vibration by the human brain. J Neurosci. 1994;14:4095–4108. doi: 10.1523/JNEUROSCI.14-07-04095.1994. [DOI] [PMC free article] [PubMed] [Google Scholar]
- Cox RW. AFNI: software for analysis and visualization of functional magnetic resonance neuroimages. Comput Biomed Res. 1996;29:162–173. doi: 10.1006/cbmr.1996.0014. [DOI] [PubMed] [Google Scholar]
- Cramer SC. Repairing the human brain after stroke. II. Restorative therapies. Ann Neurol. 2008;63:549–560. doi: 10.1002/ana.21412. [DOI] [PubMed] [Google Scholar]
- Cytowic RE. New York: Springer; 1989. Synaesthesia: a union of the senses. [Google Scholar]
- Eickhoff SB, Grefkes C, Zilles K, Fink GR. The somatotopic organization of cytoarchitectonic areas on the human parietal operculum. Cereb Cortex. 2007;17:1800–1811. doi: 10.1093/cercor/bhl090. [DOI] [PubMed] [Google Scholar]
- Falchier A, Clavagnier S, Barone P, Kennedy H. Anatomical evidence of multimodal integration in primate striate cortex. J Neurosci. 2002;22:5749–5759. doi: 10.1523/JNEUROSCI.22-13-05749.2002. [DOI] [PMC free article] [PubMed] [Google Scholar]
- Fischl B, Sereno MI, Dale AM. Cortical surface-based analysis. II. Inflation, flattening, and a surface-based coordinate system. Neuroimage. 1999;9:195–207. doi: 10.1006/nimg.1998.0396. [DOI] [PubMed] [Google Scholar]
- Fox PT, Burton H, Raichle ME. Mapping human somatosensory cortex with positron emission tomography. J Neurosurg. 1987;67:34–43. doi: 10.3171/jns.1987.67.1.0034. [DOI] [PubMed] [Google Scholar]
- Foxe JJ, Wylie GR, Martinez A, Schroeder CE, Javitt DC, Guilfoyle D, Ritter W, Murray MM. Auditory-somatosensory multisensory processing in auditory association cortex: an fMRI study. J Neurophysiol. 2002;88:540–543. doi: 10.1152/jn.2002.88.1.540. [DOI] [PubMed] [Google Scholar]
- Genovese CR, Lazar NA, Nichols T. Thresholding of statistical maps in functional neuroimaging using the false discovery rate. Neuroimage. 2002;15:870–878. doi: 10.1006/nimg.2001.1037. [DOI] [PubMed] [Google Scholar]
- Hubbard EM, Ramachandran VS. Neurocognitive mechanisms of synesthesia. Neuron. 2005;48:509–520. doi: 10.1016/j.neuron.2005.10.012. [DOI] [PubMed] [Google Scholar]
- Iwamura Y. Bilateral receptive field neurons and callosal connections in the somatosensory cortex. Philos Trans R Soc Lond B Biol Sci. 2000;355:267–273. doi: 10.1098/rstb.2000.0563. [DOI] [PMC free article] [PubMed] [Google Scholar]
- Mazzola L, Isnard J, Mauguière F. Somatosensory and pain responses to stimulation of the second somatosensory area (SII) in humans. A comparison with SI and insular responses. Cereb Cortex. 2006;16:960–968. doi: 10.1093/cercor/bhj038. [DOI] [PubMed] [Google Scholar]
- Ozcan M, Baumgärtner U, Vucurevic G, Stoeter P, Treede RD. Spatial resolution of fMRI in the human parasylvian cortex: comparison of somatosensory and auditory activation. Neuroimage. 2005;25:877–887. doi: 10.1016/j.neuroimage.2004.11.037. [DOI] [PubMed] [Google Scholar]
- Penfield W, Rasmussen T. New York: Macmillan; 1950. The cerebral cortex of man. A clinical study of localization of function. [Google Scholar]
- Ramachandran VS, Hirstein W. The perception of phantom limbs. The D. O. Hebb lecture. Brain. 1998;121:1603–1630. doi: 10.1093/brain/121.9.1603. [DOI] [PubMed] [Google Scholar]
- Rich AN, Mattingley JB. Anomalous perception in synaesthesia: a cognitive neuroscience perspective. Nat Rev Neurosci. 2002;3:43–52. doi: 10.1038/nrn702. [DOI] [PubMed] [Google Scholar]
- Ro T, Farnè A, Johnson RM, Wedeen V, Chu Z, Wang ZJ, Hunter JV, Beauchamp MS. Feeling sounds after a thalamic lesion. Ann Neurol. 2007;62:433–441. doi: 10.1002/ana.21219. [DOI] [PubMed] [Google Scholar]
- Rockland KS, Ojima H. Multisensory convergence in calcarine visual areas in macaque monkey. Int J Psychophysiol. 2003;50:19–26. doi: 10.1016/s0167-8760(03)00121-1. [DOI] [PubMed] [Google Scholar]
- Rouw R, Scholte HS. Increased structural connectivity in grapheme-color synesthesia. Nat Neurosci. 2007;10:792–797. doi: 10.1038/nn1906. [DOI] [PubMed] [Google Scholar]
- Saad ZS, Chen G, Reynolds RC, Christidis PP, Hammett KR, Bellgowan PS, Cox RW. Functional imaging analysis contest (FIAC) analysis according to AFNI and SUMA. Hum Brain Mapp. 2006;27:417–424. doi: 10.1002/hbm.20247. [DOI] [PMC free article] [PubMed] [Google Scholar]
- Schroeder CE, Lindsley RW, Specht C, Marcovici A, Smiley JF, Javitt DC. Somatosensory input to auditory association cortex in the macaque monkey. J Neurophysiol. 2001;85:1322–1327. doi: 10.1152/jn.2001.85.3.1322. [DOI] [PubMed] [Google Scholar]
- Schürmann M, Caetano G, Hlushchuk Y, Jousmäki V, Hari R. Touch activates human auditory cortex. Neuroimage. 2006;30:1325–1331. doi: 10.1016/j.neuroimage.2005.11.020. [DOI] [PubMed] [Google Scholar]
- Seitz RJ, Roland PE. Vibratory stimulation increases and decreases the regional cerebral blood flow and oxidative metabolism: a positron emission tomography (PET) study. Acta Neurol Scand. 1992;86:60–67. doi: 10.1111/j.1600-0404.1992.tb08055.x. [DOI] [PubMed] [Google Scholar]
- Seyal M, Ro T, Rafal R. Increased sensitivity to ipsilateral cutaneous stimuli following transcranial magnetic stimulation of the parietal lobe. Ann Neurol. 1995;38:264–267. doi: 10.1002/ana.410380221. [DOI] [PubMed] [Google Scholar]
- Sherman SM. The thalamus is more than just a relay. Curr Opin Neurobiol. 2007;17:417–422. doi: 10.1016/j.conb.2007.07.003. [DOI] [PMC free article] [PubMed] [Google Scholar]
- Wallace MT, Ramachandran R, Stein BE. A revised view of sensory cortical parcellation. Proc Natl Acad Sci U S A. 2004;101:2167–2172. doi: 10.1073/pnas.0305697101. [DOI] [PMC free article] [PubMed] [Google Scholar]
- Werhahn KJ, Mortensen J, Van Boven RW, Zeuner KE, Cohen LG. Enhanced tactile spatial acuity and cortical processing during acute hand deafferentation. Nat Neurosci. 2002;5:936–938. doi: 10.1038/nn917. [DOI] [PubMed] [Google Scholar]