

Abstract
Primary cilia are important sites of signal transduction involved in a wide range of developmental and postnatal functions. Proteolytic processing of the transcription factor Gli3, for example, occurs in primary cilia, and defects in intraflagellar transport (IFT), which is crucial for the maintenance of primary cilia, can lead to severe developmental defects and diseases. Here we report an essential role of primary cilia in forebrain development. Uncovered by N-ethyl-N-nitrosourea-mutagenesis, cobblestone is a hypomorphic allele of the IFT gene Ift88, in which Ift88 mRNA and protein levels are reduced by 70–80%. cobblestone mutants are distinguished by subpial heterotopias in the forebrain. Mutants show both severe defects in the formation of dorsomedial telencephalic structures, such as the choroid plexus, cortical hem and hippocampus, and also a relaxation of both dorsal-ventral and rostral-caudal compartmental boundaries. These defects phenocopy many of the abnormalities seen in the Gli3 mutant forebrain, and we show that Gli3 proteolytic processing is reduced, leading to an accumulation of the full-length activator isoform. In addition, we observe an upregulation of canonical Wnt signaling in the neocortex and in the caudal forebrain. Interestingly, the ultrastructure and morphology of ventricular cilia in the cobblestone mutants remains intact. Together, these results indicate a critical role for ciliary function in the developing forebrain.
Keywords: primary cilia, cortex, Gli3, Wnt, Ift88, intraflagellar transport
Introduction
Cilia are microtubule-based organelles protruding from the surface of most cells in the vertebrate body, which are found across the phylogenetic spectrum (Davis et al., 2006). Primary cilia, which lack an innermost microtubule doublet, have recently been implicated in a wide variety of developmental functions, including left-right asymmetry and limb, kidney, pancreas, and skeleton formation (Bisgrove and Yost, 2006). In the developing nervous system, mutants of genes involved in ciliary formation and maintenance display defects in neural tube closure, flexure and neuronal differentiation (Murcia et al., 2000; Huangfu et al., 2003; Huangfu and Anderson, 2005; Liu et al., 2005; May et al., 2005; Houde et al., 2006; Caspary et al., 2007), and perinatal hippocampal (Han et al., 2008) and cerebellar (Chizhikov et al., 2007; Spassky et al., 2008) development. Cilia have been reported to be present in neurons throughout the nervous system (Fuchs and Schwark, 2004) and also in proliferating neuroepithelia that extend cilia into the ventricular space (Nagele and Lee, 1979; Cohen and Meininger, 1987; Huangfu and Anderson, 2005; May et al., 2005). Recently it has been demonstrated that key proteins in the Sonic hedgehog (Shh) signal transduction pathway are localized to primary cilia, including the transmembrane receptor Smoothened and Sufu, a negative regulator of Shh signaling (Scholey and Anderson, 2006). Cilia growth and the transport of protein cargoes occurs through intraflagellar transport (IFT), using the same retro- and anterograde motors found in axonal transport (Rosenbaum and Witman, 2002). Functional IFT machinery has been shown to be critical not only for phenotypically normal Shh signaling (Huangfu et al., 2003) but also for proteolytic processing of the transcription factor Gli3 (Haycraft et al., 2005; Huangfu and Anderson, 2005; Liu et al., 2005; May et al., 2005; Tran et al., 2008), in which the full-length activator form of Gli3 is cleaved to form a transcriptional repressor (Wang et al., 2000).
As Gli3 function is crucial for development of the dorsal telencephalon (Theil et al., 1999; Tole et al., 2000), the question arises as to whether Gli3 processing occurs in primary cilia of forebrain neuroepithelia, and whether defects in IFT could affect this processing and thereby influence forebrain development. Although two ciliary mutants have indicated defects in forebrain development (Herron et al., 2002; May et al., 2005), no thorough analysis of the role of primary cilia in forebrain and midbrain development has yet been published. To answer these questions, we have used a hypomorphic allele of the Ift88 gene called cobblestone. Ift88 is necessary for the formation and maintenance of cilia in a wide range of tissues (Murcia et al., 2000; Banizs et al., 2005; Haycraft et al., 2005; Haycraft et al., 2007) and organisms (Haycraft et al., 2001; Kramer-Zucker et al., 2005). The cobblestone allele has the advantage that embryos live several days longer than the targeted knock-out mutation of Ift88 (Murcia et al., 2000), allowing the analysis of telencephalic development. Here we show that primary cilia control not only the anatomical organization of dorsomedial telencephalon, but also the organization of both dorsal-ventral and rostral-caudal telencephalic boundaries.
Materials and Methods
Transmission and scanning electron microscopy
Transmission electron microscopy.
Embryonic day 12.5 (E12.5) mouse embryos were collected in cold PBS and fixed for 10 min by transcardial perfusion (using a glass micropipette) with 2.5% glutaraldehyde in 0.1 m PIPES buffer, pH 7.6, containing 2% polyvinylpyrrolidone (MW 25000, Merck) for 10 min. After immersion fixation of the embryos for an additional hour in the same fixative, 300 μm-thick coronal sections of the brain were prepared using a vibratome (D.S.K. Microslicer DTK-1000, Dosaka EM). For enhancement of membrane staining, samples were incubated in the alkaline diaminobenzidine hydrochloride medium as described previously (Gorgas, 1984) for 60 min, and postfixed with 1.5% osmium tetroxide containing 1.5% potassium ferrocyanide for one hour followed by an additional one hour osmification with 1.5% osmium tetroxide in 0.1 m sodium cacodylate buffer. Finally, the slices were stained en bloc in 1% uranyl acetate for 30 min, dehydrated through a graded ethanol series and embedded in Epon 812 (Fluka 45345). Series of semithin sections were stained with a modified Richardson methylene blue-azure II solution and used for selection of corresponding areas in wild-type and mutant brains. Ultrathin sections were stained with lead citrate and analyzed by electron microscopy using a Zeiss EM 906E.
Scanning electron microscopy.
Embryonic heads were fixed overnight at 4°C in 2.5% glutaraldehyde/0.1 m PIPES pH 7.4 and subsequently washed 3 times in 0.15 m PIPES, pH 7.4, at 4°C. The fixed samples were then embedded in 3% Agarose and cut into 300 μm coronal slices in PBS with a D.S.K. Microslicer. The slices were treated for 1 h at room temperature with 1% OsO4, washed 3 times with 0.15 m PIPES pH 7.4, and subsequently dehydrated in an ascending ethanol dilution series (50%, 70%, 90%, 100%). The specimens were dried in a CPD 030 critical point dryer (BAL-TEC AG) using CO2 as a transitional medium, followed by sputter coating (BAL-TEC MED 020 sputter coater) of a 20 nm Gold film. For scanning electron microscopy (EM), a LEO 1530 field emission scanning electron microscope with a Schottky cathode was used (LEO Elektronmikroskopie).
N-ethyl-N-nitrosourea mutagenesis and mouse lines
All animal experiments were in compliance with the regulations of Baden-Württemberg. We used the strain Mapttm1(GFP)Klt (tauGFP) (Tucker et al., 2001), backcrossed to wild-type C57BL/6J mice for over 10 generations. tauGFP males were injected intraperitoneally with 150 mg/kg N-ethyl-N-nitrosourea (ENU) and mated to tauGFP females to generate G1 pedigree-founder males. G1 males were mated to their superovulated G2 daughters (supplemental Fig. 1, available at www.jneurosci.org as supplemental material). G3 litters were examined at E11.0–12.5 using epifluorescent microscopy, with E0.5 as noon of the day of the vaginal plug. Identified mutant G2 males were outcrossed to mice of the inbred strain CBA/J for positional cloning. For other experiments, the mouse strains Ift88tm1.1Bky (Haycraft et al., 2007), Ift88Δ2–3βgal (Murcia et al., 2000), and XtJ (Hui and Joyner, 1993) were used and genotyped with standard PCR-based protocols.
Positional cloning
A panel to detect single nucleotide polymorphisms (SNPs) was constructed from primer triplets, spread evenly across the mouse genome, that specifically amplify SNPs between the C57BL/6 and DBA/2 inbred strains. The two SNP-hybridizing primers in each triplet were recognized by fluorescently labeled primers (Amplifluor SNPs HT Genotyping System for FAM-JOE, Millipore) for use in a Stratagene MX3000P real-time PCR device. Segregating cbs embryos were examined using 100 markers covering the 20 murine chromosomes, looking for SNPs in which homozygous cbs mutants were enriched for a homozygous C57BL/6 result. Primer information is available upon request. SNP analysis identified one marker on chromosome 14 that closely cosegregated with the cbs mutants (see Fig. 2G). Fine mapping was performed with chromosome 14 SSLP markers (see Fig. 2G) (Dietrich et al., 1994), which were resolved on 12% acrylamide gels. For Ift88 sequencing, total mRNA was isolated from E12.5 embryonic brain and reverse transcribed with oligo(dT)12–18 and SuperScriptII reverse transcriptase (both Invitrogen). PCRs with Ift88-specific primers were as follows: 5 min 95°C; 39 cycles: 30 s 95°C, 30 s 60°C, 30 s 72°C; 5 min 72°C. Agarose gel-purified PCR products, subcloned into the pCRII-TOPO vector, were sequenced (MWG) with appropriate primers.
Figure 2.
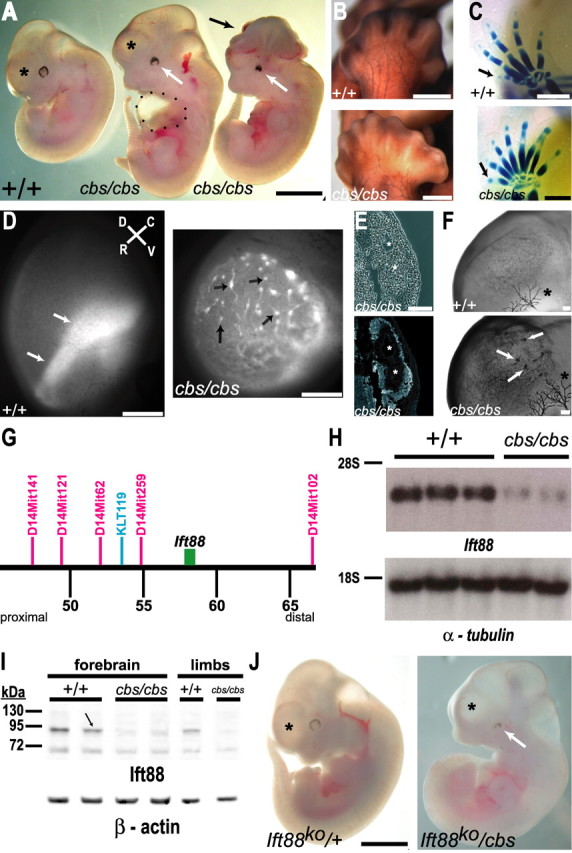
The cobblestone mutant is a hypomorphic allele of the Ift88 gene. A, E11.5 cbs/cbs mutants display a cortex (asterisk) shortened in the rostral-caudal axis (middle embryo), compared with wild-type littermates (left embryo). 10% of cbs/cbs mutants display exencephaly (right embryo, black arrow). cbs/cbs embryos display colobomas (white arrow), and an enlarged pericardial sac is often observed (black dots). B, C, cbs/cbs embryos display bilateral polydactyly on hindlimbs (B) and forelimbs (C). B, E13.5 embryos stained with an anti-165 kDa neurofilament antibody, showing hindlimb innervation. C, Alcian blue-stained E14.5 embryos, showing skeletal formation. Arrow indicates pollex. D, Whole-mount epifluorescence of E12.5 tauGFP cortex, looking down upon the pial surface. A wild-type embryo shows EGFP-signal where the lateral edge of the cortex folds over, allowing multiple layers of newborn neurons to be seen as a broad stripe of signal (left panel, arrow). In cbs/cbs mutants, heterotopias appear as 40–180 μm wide spheres (right panel, arrows), often with long trails of green signal corresponding to outgrowing axon bundles. Rostral (R), caudal (C), dorsal (D), and ventral (V) axes are indicated. E, Cross section of two subpial heterotopias in E11.5 cbs/cbs cortex. Asterisk indicates lumen of each heterotopia. Top, Phase contrast. Bottom, Stained with TuJ1 antibody, indicating newborn neurons in the heterotopia periphery. F, Anti-165 kDa neurofilament antibody staining of E11.5 forebrain. Arrows indicate heterotopias in cbs/cbs cortex. The smaller number of stained heterotopias, compared with (D), is due to reduced antibody penetration. Asterisk indicates Nervus ophthalmicus. G, Positional cloning of cbs. Distance from the centromere in million bp (black), the SNP marker used for rough mapping (blue), SSLP markers used for fine mapping (red), and the Ift88 gene (green box) are indicated. H, Northern blots of whole RNA from whole brain of E12.5 wild-type (+/+) and cbs/cbs embryos. Full-length Ift88 (top) and α-tubulin cDNAs (bottom) were used as probes. Ribosomal RNA markers are indicated (left). I, Western blots of protein from forebrain and fore- and hindlimbs (limbs) of E12.5 wild-type (+/+) and cbs/cbs embryos. An anti-N-terminal-Ift88 antibody (top), and an anti-β-actin antibody (bottom) as a loading control, were used. An arrow indicates the Ift88 band. Protein markers (kDa) are indicated (left). J, E11.5 heterozygous Ift88 knock-out embryos (Ift88ko/+) display a wild-type telencephalon (asterisk) with an elongated rostral-caudal profile (cf. A, +/+ embryo). A compound heterozygote of the Ift88 deletion allele (Ift88ko) and the cbs allele (Ift88ko/cbs) displays coloboma (white arrow) and a rostro-caudally shortened cortex (asterisk). Scale bars: A, J, 1.5 mm; B, C, D, 0.5 mm; E, F, 100 μm.
Whole-mount analysis
Whole-mount staining using the 2H3 monoclonal antibody [Developmental Studies Hybridoma Bank (DSHB), Iowa City, IA] was performed as described (Yamashita et al., 1999). Whole-mount skeletal staining using Alcian blue was performed as described (Brachmann et al., 2007).
Immunohistochemical analysis
Embryos, sections, and stainings were performed as described (Brachmann et al., 2007). Primary antibodies (Ab): rabbit anti-β-galactosidase (clone 55976, ICN/Cappel) 1:2000, mouse anti-nestin (Rat 401 clone; BD PharMingen) 1:500, RC2 (DSHB) 1:10, mouse anti-β tubulin III (TuJ1 clone; Covance) 1:1500, rabbit anti-phospho-histone H3 (Ser10, rabbit 06–570; Upstate) 1:200, and rabbit anti-Pax6 (AB5409, Millipore) 1:3000. Secondary antibodies as described (Brachmann et al., 2007).
Northern blotting
Northern blotting was performed as described (Tucker et al., 1996), using total RNA prepared from the brain and fore- and hindlimb tissue of E12.5 embryos, and hybridized with a full-length murine Ift88 or Gli3 cDNA (RZPD) and an α- tubulin cDNA (Lemischka et al., 1981) as loading control.
Quantitative real time RT-PCR
Whole RNA was extracted from embryonic tissue using the RNeasy Mini Kit (74104 Qiagen) according to the manufacturer's instructions. 1–5 μg of RNA was transcribed into cDNA using oligo(dT)12–18 (0,5 μg/μl, Invitrogen) or random hexamers (50 mm, Applied Biosystems) and SuperScript II RNase H− reverse transcriptase (Invitrogen). Quantitative real time PCRs were performed using the ABI Prism 7000 Detection System (Applied Biosystems) using TaqMan Gene Expression Assays (Applied Biosystems) with 1 μl of cDNA (20 μl of RTase reactions using 1–5 μg of whole RNA input). The following TaqMan Assays were used: Ift88 (Mm00493675_m1), Wnt7b (Mm00437357_m1), Axin2 (Mm01265783_m1), Ptch1 (Mm00436031_m1), and Gli1 (Mm00494654_m1). The standard quantification protocol was applied with the following cycles: 2 min at 50°C, 10 min at 95°C, followed by 45 cycles: 15 s at 95°C and 1 min at 60°C. Each individual reaction was performed in triplicate. GAPDH primers (Mm99999915_g1) were used to normalize results.
Statistical analysis was performed as follows: Relative expression (RE) levels were calculated with the function (RE = 2−ΔΔCt), where ΔΔCt is the normalized difference in threshold cycle (Ct) number between wild-type and cbs/cbs samples, calculated from the mean Ct value of triplicate replicates of any given condition. The mean of RE reported in Figure 7 was calculated from the individual RE values from 4 to 8 independent experiments, and the SEM was calculated from the standard deviation of the 4–8 RE values. Statistical significance was evaluated by applying the Student's t test to the 4–8 RE values, comparing vehicle to TSA treatment. Application of Student's t test to the original ΔΔCt values produced comparable p values.
Figure 7.

Wnt expression and signaling is upregulated in the cbs mutant. A–F, In situ hybridization analysis of 12.5 wild-type and cbs/cbs embryos. For each coronal section from rostral (A, C, E) and caudal (B, D, F) telencephalon, only one telencephalic half is shown, with dorsal to the top, lateral to the right. A, B, Wnt7b. C, D, Wnt8b. E, F, Axin2. A–F, Arrows indicate signal described in text. Scale bars: 300 μm.
Western blotting
Western blotting was performed as described (Tucker et al., 2001) with a rabbit anti-Gli3 antibody (1:1000, s.c.–20688, Santa Cruz Biotechnology), a goat anti-Ift88 antibody [1:1000 (Pazour et al., 2002)], and a mouse anti-β-actin antibody (1:5000; clone AC-15, Sigma). HRP-conjugated secondary antibodies: mouse anti-goat (1:10,000; cs-2354, Santa Cruz Biotechnology), goat anti-rabbit (H+L; 1:10,000, KPL), or goat anti-mouse IgG (H+L; 1:10,000, KPL).
In situ hybridization
For all in situ hybridizations presented in Figures 4–8, a minimum of 12 cbs/cbs and 14 wild-type littermates were examined from the rostralmost cortex through the beginning of the hindbrain, and the relevant sections are presented. In situ hybridization on paraffin sections was performed as described (Theil, 2005) with following probes: Dbx1 (Yun et al., 2001); Foxd1 (Hatini et al., 1996); FoxG1 (Tao and Lai, 1992); Ttr1 (Duan et al., 1989); EphB1 (kind gift from D. Wilkinson, National Institute for Medical Research, London, UK); Lhx2 (Porter et al., 1997); Wnt2b, Pax6, Ngn2, Emx1, Emx2 (Kuschel et al., 2003); Dlx2, Axin2, Reelin, Wnt7b (Theil, 2005); Wnt8b (kind gift from J. Mason, University of Edinburgh, Edinburgh, UK); Shh (kind gift from M. Treier, European Molecular Biology Laboratory, Heidelberg, Germany); Gli3 (kind gift from A. Joyner, Skirball Institute, New York, NY), and Ptch1 (Goodrich et al., 1996).
Figure 4.
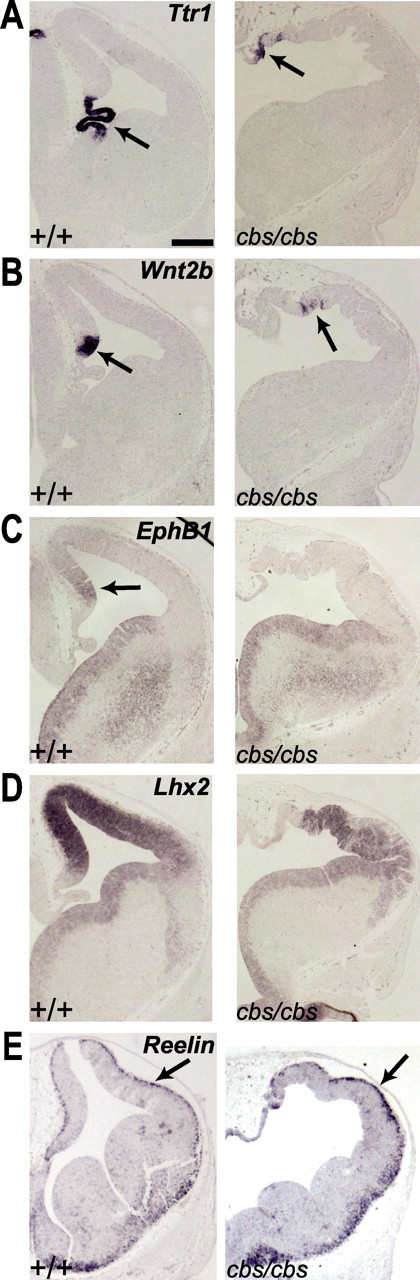
Dorsomedial telencephalic cell types are specified but do not form morphological structures. A–E, In situ hybridization analysis of 12.5 wild-type and cbs/cbs embryos. For each coronal section, one telencephalic half is shown, with dorsal to the top, lateral to the right. Arrows indicate signal described in text. A, Ttr1. B, Wnt2b. C, EphB1. D, Lhx2. E, Reelin. Scale bars: 300 μm.
Figure 5.
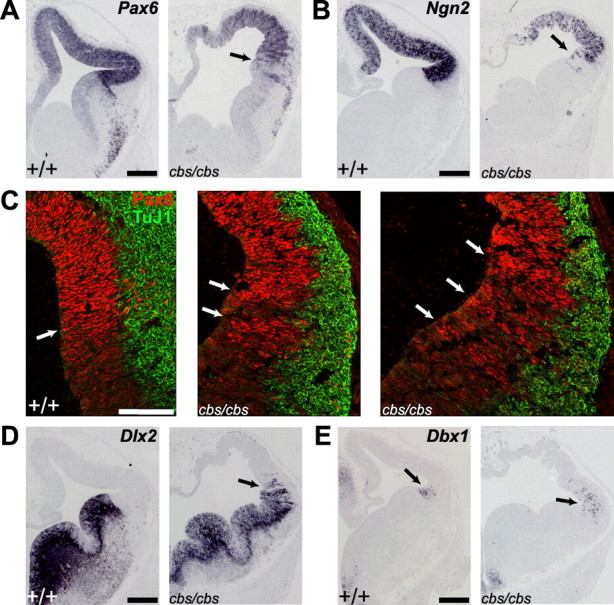
Relaxation of the pallial-subpallial boundary (PSPB) in cbs mutants. In situ hybridization (A, B, D, E) and immunohistofluorescence (C) analysis of 12.5 wild-type and cbs/cbs embryos. For each coronal section, one telencephalic half is shown, with dorsal to the top, lateral to the right. C, Red, Anti-Pax6 antibody; Green, TuJ1 antibody, recognizing newborn neurons. A, B, C, left panel, D, E, Arrows indicate the PSPB. C, Middle, right panels, Arrows indicate radial stripes of Pax6 expression at the PSPB in cbs/cbs mutants. A, Pax6. B, Ngn2. C, Pax6. D, Dlx2. E, Dbx1. Scale bars: A, B, D, E, 300 μm, (C) 100 μm.
Figure 6.

The dorsal telencephalic-diencephalic boundary in the cbs mutant. In situ hybridization analysis of 12.5 wild-type and cbs/cbs embryos. For each coronal section, only one telencephalic half is shown, with dorsal to the top, lateral to the right. A, FoxG1. B, Lhx2. C, Emx2. D, Wnt2b. E, Ttr1. F, Shh. G, Dlx2. H, Foxd1. A–H, Arrows indicate signal described in text. C, Asterisk indicates fold in tissue. Scale bars: 300 μm.
Luciferase assays
Primary fibroblast cultures were prepared from E12.5 embryos as described (Tucker et al., 1997). 2 × 10⁶ cells were electroporated (Amaxa nucleofection device, program A23) with a mixture of 5 μg of a Shh-responsive firefly luciferase-expressing plasmid (Sasaki et al., 1997) and 300 ng of a Renilla luciferase reporter plasmid (pRL-TK, Promega) to control for transfection efficiency. Cells were plated into 20 wells of a 24-well plate and allowed to grow 36–48 h to confluency. Medium was shifted to 0.5% fetal calf serum for 36 h, to allow for the production of cilia, as described (Ocbina and Anderson, 2008). Recombinant murine sonic hedgehog (1 μg/ml, R&D Biosystems) was then added for 12 h, and cells were subsequently lysed for luciferase analysis using the Dual-Luciferase assay system (Promega) with a Veritas Microplate luminometer (Turner BioSystems). All assays were performed at least six times in five-fold replication for each experimental variable; background values were determined with lysates of untransfected cells; and firefly luciferase values were normalized with the Renilla luciferase readouts. Statistical analysis was performed using Student's t test.
Results
Primary cilia project into the ventricle of developing forebrain
Primary cilia, protruding into the ventricles, have been reported to be present on neuroepithelial cells of the developing cortex (Nagele and Lee, 1979; Cohen and Meininger, 1987; May et al., 2005). These observations were confirmed using transmission electron microscopy (TEM) upon coronal sections of E12.5 brain. Cilia, with lengths varying between 0.5–2 μm, projected into the ventricle (Fig. 1A). Transverse sections revealed well defined basal bodies (Fig. 1B) and a “9 + 0” morphology in the proximal cilium, confirming them as primary cilia (Fig. 1C). The cilia displayed a proximal-to-distal reduction in the number of microtubule doublets, coming eventually to a “2 + 0” morphology at the tip (Fig. 1D,E), as reported previously (Cohen and Meininger, 1987). Scanning EM upon E12.5 embryos revealed cilia projecting into the ventricle from dorsal and lateral cortex (Fig. 1H), the hippocampal anlage, choroid plexus, and the ganglionic eminences (GEs), with lengths varying between 0.5–3 μm. To determine whether neural precursor cells expressed components of the intraflagellar transport (IFT) machinery, a mouse line (Ift88Δ2–3βgal) (Murcia et al., 2000) was used in which the lacZ cDNA has been inserted into the locus encoding Ift88, a component of the B complex particles of the IFT machinery (Rosenbaum and Witman, 2002). Examination of E11.5 heterozygous Ift88Δ2–3βgal embryos revealed expression of Ift88::lacZ by nestin-positive (Fig. 1J) and RC2-positive (Fig. 1K) neural precursor cells. Finally, newly born neurons located in the subpial mantle zone, identified using the TuJ1 antibody (Moody et al., 1989), were also shown to express Ift88 (Fig. 1L).
Figure 1.
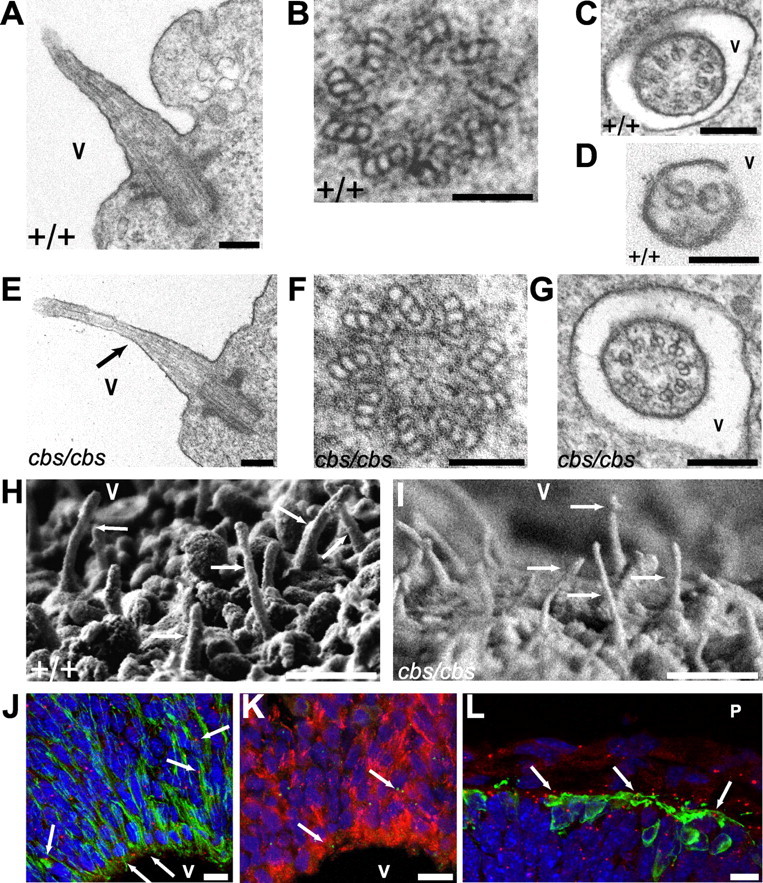
Primary cilia project into the ventricle of embryonic forebrain. A–I, TEM (A–G) and (H, I) scanning EM of cilia projecting into the dorsolateral telencephalic ventricles (V) of E12.5 wild-type (A–D, H) and cbs/cbs (E–G, I) embryos. A, E, Cilium cut longitudinally. B–D, F, G, Cross sections of ventricular cilia, revealing the basal body (B, F), characteristic “9 + 0” ciliary morphology (C, G), and tapering to a “2 + 0” structure (D). E, Proximal-to-distal tapering can clearly be seen (arrow). H, I, Arrows indicate cilia. J–L, Immunofluorescence analysis of Ift88 expression in dorsolateral telencephalon of E11.5 Ift88Δ2–3βgal embryos, using an antibody recognizing β-galactosidase (J, L, red; K, green), which is expressed from the Ift88 locus. The ventricular (V) and pial (P) surface is at bottom (J, K), and top (L) of the panels, respectively. Arrows indicate characteristic somatic β-galactosidase deposits in cells colabeled with the following markers: Nestin- (J, green) and RC2-positive (K, red)VZ cells and newborn neurons (L, green, TuJ1 antibody). J–L, Blue, DAPI-labeled nuclei. Scale bars: A, C, E, G, 200 nm; B, D, F, 100 nm; H, I, 1 μm; J, K, L, 10 μm.
The cobblestone mutant is a hypomorphic allele of the Ift88 gene
The cobblestone (cbs) mutant was generated in a ENU mutagenesis screen to identify defects in nervous system development. A mouse line (tauGFP) was used in which green fluorescent protein (EGFP) expression is restricted to newborn neurons (Tucker et al., 2001). tauGFP males were injected with ENU and used to establish separate G1 pedigrees (supplemental Fig. 1, available at www.jneurosci.org as supplemental material). Each G1 male was treated as a different potential heterozygote carrier and mated to his G2 daughters to uncover recessive mutations. The resulting G3 litters were screened with a fluorescent microscope for defects in neurogenesis and nerve development. The cbs mutation was identified by the presence of EGFP-expressing bulges protruding from the pial surface of the E11.0 forebrain (Fig. 2D), lending the brain surface a resemblance to a cobblestone-paved street. The following criteria were used to classify the heterotopias: In cross-section, these heterotopic structures were (1) 50–150 μm in diameter, (2) “rosette”-shaped, (3) with a central lumen, (4) had an epithelial-like cell layer lining the lumen, whose cells stained positive for the neural precursor marker nestin (Fig. 3I,J), and (5) an outer layer with EGFP-expressing cells (Fig. 2D). The EGFP-expressing cells were confirmed as newborn neurons by their expression of β-tubulin III (Fig. 2E) and the 165 kDa axonal marker neurofilament (Fig. 2F). The telencephalon itself was shortened along its rostral-caudal axis, while the midbrain was elongated (Fig. 2A). cbs segregated as a recessive mutation (225 mutants/1005 embryos, 140 litters) with no heterozygous phenotype. The mutation was not influenced by the presence of the tauGFP locus, as seen after segregation of the tauGFP marker. cbs mutants showed 8% and 70% mortality by E12.5 and E14.5, respectively. 10% of cbs mutants at E12.5 displayed exencephaly (Fig. 2A). In addition, cbs mutants displayed polydactyly on both fore- (Fig. 2C) and both hind-limbs (Fig. 2B), and bilateral coloboma (Fig. 2A). Both of these phenotypes showed 100% penetrance (n = 225). In addition, examination of cardiovascular and pulmonary development between E12.5 and E16.5 uncovered a large number of malformations that may contribute to embryonic lethality, including interventricular and interatrial septal defects, persistent truncus arteriosus, arteria lusoria, and pulmonary aplasia/hypoplasia (described in detail in supplemental Fig. 2, available at www.jneurosci.org as supplemental material).
Figure 3.
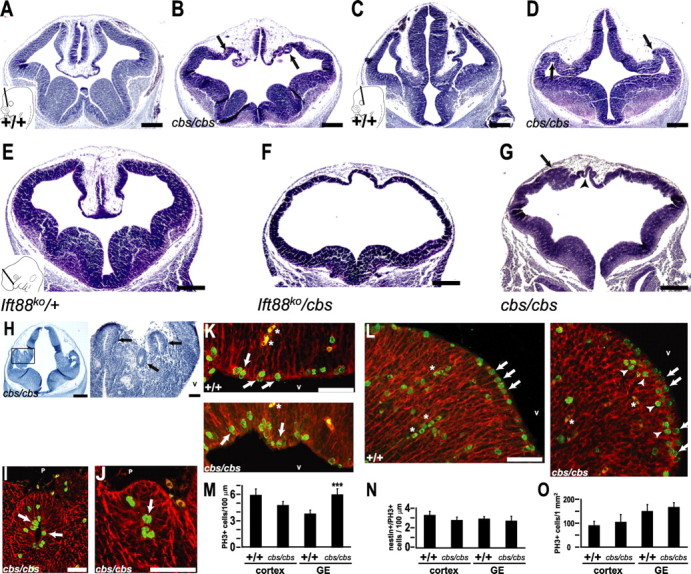
The cbs mutant exhibits a pronounced disorganization of the dorsal telencephalon. A–D, H, Hematoxylin-stained coronal sections of E12.5 wild-type (A, C) and cbs/cbs (B, D, H–J) embryos. A, B, E-G, Rostral and (C, D, H–J) caudal telencephalon. E–G, Hematoxylin-stained coronal sections of a E11.5 Ift88ko/− embryo (E), a Ift88ko/cbs compound heterozygote littermate (F), and a cbs/cbs embryo (G). A, C, E, Inset (lower left) indicates the plane of section for (A, B), (C, D), and (E–G), respectively. H, Caudal-most telencephalon showing lateral heterotopias (left, boxed). Enlargement of the boxed region shows them to have a rosette-like morphology (right). B, D, G, H, Arrows indicate heterotopias. G, Arrowhead indicates VZ. I–L, Mitotic cells revealed with an anti-phosphorylated-histone H3 antibody (green, PH3) in subpial heterotopias (I, J) and VZ of the dorsolateral cortex (K) and the ganglionic eminences (L) in E12.5 wild-type and cbs/cbs embryos. Red = anti-nestin antibody. I–L, Arrows indicate nestin/PH3-double positive cells. Arrowheads indicate sub-VZ mitoses. Asterisks indicate blood cells. M, N, O, Quantitation of PH3 staining in the cortex (cortex) and ganglionic eminences (GE), expressed as the number of PH3-positive (M) and double nestin/PH3-positive (N) cells per 100 μm of VZ, and in the number of basally located (i.e., >30 μm from the ventricular zone) PH3-positive cells per 1 mm2 (O). ***p < 0.001, Student's t test. A–L, Dorsal is to the top. H–L, Lateral is to the left; V, ventricle; P, pial surface. Scale bars: A–G, H (left), 300 μm; H (right), I–L, 50 μm.
To perform positional cloning, the cbs mutant was crossed to wild-type mice of the CBA/J background, F1 progeny were intercrossed, and genomic DNA from the resulting F2 embryos was analyzed with strain-specific SNP primers. This approach identified one marker on chromosome 14 cosegregating with cbs mutants (Fig. 2G). Fine mapping was performed using standard SSLP markers (Dietrich et al., 1994), and thereby positioned the cbs locus 0.5 cM distal to the marker D14Mit259 (Fig. 2G). Examination of candidate genes revealed one, Ift88, that had been previously reported to show both polydactyly (Zhang et al., 2003) and defects in neural tube formation (Murcia et al., 2000) when mutated. Northern blot analysis performed upon RNA isolated from 12.5 d.p.c brain identified a single transcript in both wild-type and cbs/cbs embryos (Fig. 2H). Quantitation revealed a 66.7 ± 2.0% decrease in the levels of Ift88 mRNA in cbs/cbs brain. Western blot analysis of protein levels of Ift88 in whole brain, using an anti-N-terminal-Ift88 antibody, revealed a single band of ∼90 kDa in both wild-type and cbs/cbs embryos (Fig. 2I). Quantitation revealed a 75.0 ± 3.0% decrease in the levels of Ift88 protein in cbs/cbs brain (n = 5, p < 0.01, Student's t test). Analysis of mRNA and protein levels in fore- and hind- limbbuds with Northern blots, quantitative real-time RT-PCR, and Western blots using anti-Ift88 antibodies directed against either the N terminus (Fig. 2I) or the C terminus demonstrated a similar reduction in protein levels (supplemental Fig. 3C, available at www.jneurosci.org as supplemental material).
To determine whether the genetic defect in the cbs mutant is located in the Ift88 gene, we performed a complementation analysis by crossing cbs heterozygotes to mice heterozygous for a targeted deletion of the Ift88 gene (Ift88tm1.1Bky) (Haycraft et al., 2007). 7 compound heterozygotes for both alleles were identified by PCR-based genotyping, and they displayed the morphological characteristics of cbs homozygotes, including bilateral coloboma, a rostro-caudally shortened telencephalon, and an enlarged midbrain (Fig. 2J). Interestingly, compound heterozygotes displayed a rightward-looping heart tube, an indication of situs inversus, in some cases (3/7 cbs/Ift88tm1.1Bky embryos; supplemental Fig. 4, available at www.jneurosci.org as supplemental material). In contrast, cbs/cbs mutants never displayed situs inversus (n = 61). Of 48 littermate embryos genotyped as wild type or heterozygous for either the Ift88 or the cbs mutation, none showed the phenotypes reported above. We conclude from these data that the two mutations do not complement one another and that cbs is a hypomorphic allele of Ift88. As sequencing of the mRNA transcript in the cbs mutant revealed no changes in the ORF or the 5′ and 3′ UTRs, this further indicates a mutation in an intron or a regulatory region.
Cilia are present in the ventricles of cbs mutants
Previous reports of Ift88 mutants (Murcia et al., 2000; Haycraft et al., 2001, 2005, 2007; Kramer-Zucker et al., 2005; Banizs et al., 2005) have shown that cilia are either not formed or not maintained. Surprisingly, TEM on coronal forebrain sections from E12.5 cbs/cbs embryos revealed primary cilia projecting into the ventricle that did not appear to be different from those of the wild type (Fig. 1E–G). The cilia derived from basal bodies (Fig. 1F), demonstrated a “9 + 0” morphology (Fig. 1G), and tapered in a proximal-to-distal manner (Fig. 1E). Using scanning EM, cilia could also be detected projecting into the ventricle from the dorsolateral telencephalon (Fig. 1I) and the GEs of cbs/cbs mutants. The cilia in the dorsolateral telencephalon of the cbs mutant appeared of normal length (wild type: 973 ± 160 nm (n = 26); cbs/cbs: 894 ± 213 nm (n = 33), p = 0.25, Student's t test). Thus, both TEM and scanning EM revealed ultrastructurally normal cilia projecting into the ventricle of cbs/cbs forebrain. In addition, ultrastructurally and morphologically normal cilia were also found in the midbrain (supplemental Fig. 5A,B, available at www.jneurosci.org as supplemental material) and bronchia (supplemental Fig. 5C,D, available at www.jneurosci.org as supplemental material) of E12.5 cbs/cbs embryos.
The cbs mutant exhibits a pronounced disorganization of the dorsal telencephalon
cbs/cbs mutant forebrain demonstrated a major disruption in dorsal telencephalic morphology (Fig. 3A–G). In E12.5 wild-type littermates, the telencephalic midline invaginated and demonstrated development of the choroid plexus, cortical hem, and the hippocampal anlage (Fig. 3A). Although invagination of the telencephalic midline did occur in cbs/cbs mutants, the morphology of the dorsomedial telencephalon was severely affected and the hippocampal primordium and the cortical hem could not be identified morphologically. Instead, cbs/cbs mutants demonstrated a kinked ventricular zone (VZ) that folded in upon itself (Fig. 3B, arrows) to form rosette-like heterotopias (Fig. 3H–J). In contrast, development of the medial and lateral GEs appeared relatively normal (Fig. 3B). At caudal levels, the diencephalon and the dorsal telencephalon are clearly separated in wild-type embryos (Fig. 3C). This distinction is lost in cbs/cbs mutants, where a continuous VZ runs from the dorsal diencephalon to the dorsolateral telencephalon (Fig. 3D). An even more severe phenotype was observed in E11.5 embryos bearing both the cbs and the Ift88 knock-out allele (Fig. 2J). In these embryos, the dorsal telencephalic midline barely invaginated, the cortical VZ was reduced to a very thin strip, and the medial and lateral GEs were also greatly reduced in size (Fig. 3F). Later developmental stages of this complementation cross could not be examined because of an earlier lethality than that seen in cbs/cbs mutants. Similar to E12.5, E11.5 cbs/cbs mutants demonstrated a reduced invagination and disorganization of the dorsal midline, invaginations of the cortical VZ (Fig. 3G, arrowhead), and subpial heterotopias (Fig. 3G, arrow). However, both the cortex and the GEs were thicker than in the cbs/Ift88tm1.1Bky complementation mutant (Fig. 3F).
Intriguingly, in E12.5 cbs/cbs mutants, the number of mitotic cells at the VZ was not significantly altered in the cortex (p = 0.06, n = 5, Student's t test) (Fig. 3M). Many of the mitotic VZ cells were positive for the anti-nestin antibody, indicating them to be neural precursors (Fig. 3K,L, arrows; N). In contrast, the GEs showed a large increase in mitotic cells (Fig. 3M) because of the appearance of cells dividing 10–30 μm away from the VZ, many of which were nestin-negative (Fig. 3L, arrowheads; N). Similar results were seen at E11.5. In addition, mitotic cells at the lumen of heterotopias could also be identified as nestin-positive (Fig. 3I,J). Finally, no change was seen for the number of mitotic cells located basally >30 μm from the ventricular zones of the cortex and GE (Fig. 3O).
Dorsomedial telencephalic cell types are specified but do not form morphological structures in cbs mutants
The dorsomedial telencephalon gives rise to several different cell types including the choroid plexus, the cortical hem, the hippocampus and Cajal-Retzius cells. As histological examination demonstrated a gross disorganization of these structures in cbs/cbs mutants, the determination of these structures was examined with appropriate tissue-specific markers. The choroid plexus forms from the dorsal midline and expresses Ttr1 (Fig. 4A, arrow) (Duan et al., 1989). In cbs/cbs mutants, Ttr1 was expressed but in a patchy pattern and at a considerably lower expression level than wild-type littermates (Fig. 4A). The cortical hem lies directly dorsal to the choroid plexus and is marked by the expression of several Wnt family genes including Wnt2b (Grove et al., 1998). Examination of Wnt2b expression in cbs/cbs mutants revealed a domain of expression in the dorsal telencephalon (Fig. 4B, arrow) lateral to the Ttr1 expression domain seen in an adjacent section (cf. Fig. 4A). Similar to the Ttr1 expression pattern, Wnt2b was expressed at lower levels and in scattered groups of cells (Fig. 4B). The hippocampal anlage lies adjacent to the cortical hem and expresses EphB1 (Tole et al., 2000). In cbs/cbs mutants, however, EphB1 expression was not detected in the dorsal telencephalon, while its expression in the ventral telencephalon was unaffected (Fig. 4C). The hippocampus is further characterized by high level expression of the Lhx2 homeodomain gene (Fig. 4D), which is required for proper hippocampal development (Porter et al., 1997; Bulchand et al., 2001; Monuki et al., 2001; Mangale et al., 2008). In cbs/cbs mutants, however, the high level expression of Lhx2 was diminished (Fig. 4D), suggesting that the hippocampus was not specified correctly. Finally, the cortical hem is a major source of Cajal-Retzius (CR) neurons, the earliest-born cortical neurons, which are characterized by the expression of reelin (Meyer et al., 2002; Takiguchi-Hayashi et al., 2004). In situ hybridization analysis showed a single layer of reelin-expressing cells at the cortical marginal zone of E12.5 wild-type and cbs/cbs mutant embryos (Fig. 4E, arrow). Together, this data indicate that cells characteristic for the dorsomedial telencephalon are formed in the cbs mutant but they fail to form morphologically distinct structures.
The pallial-subpallial boundary does not form properly in cbs mutants
We next analyzed whether dorsal-ventral subdivisions of the telencephalon formed correctly in cbs/cbs mutants. Pax6 (Fig. 5A) and Ngn2 (Fig. 5B) show a lateral-high to medial-low expression gradient in the developing neocortex, with a sharp expression boundary at the pallial-subpallial boundary (PSPB) of the telencephalon (Walther and Gruss, 1991; Gradwohl et al., 1996). In cbs/cbs mutant telencephalon the graded expression of both genes was lost, and their ventral expression domains were not as sharply delineated as in wild-type embryos (Fig. 5A,B). Immunofluorescence analysis for Pax6 also revealed scattered Pax6-positive cells at the boundary region. (Fig. 5C). In situ hybridization on adjacent sections for Dlx2, which marks the medial and lateral GEs (Bulfone et al., 1993), further suggested that scattered Pax6 and Ngn2 expressing cells were located within ventral telencephalic territory (Fig. 5D). Conversely, Dlx2 also showed a diffuse border of expression, and scattered Dlx2-expressing cells were found in neocortical areas (Fig. 5D). Consistent with histological analysis, however, Dlx2 expression in the GEs did not differ substantially from that of wild-type littermates (Fig. 5D). To further define the formation of the PSPB in cbs/cbs mutants, we examined the expression of the Dbx1 homeobox gene in the ventral pallium, located just dorsally to the PSPB (Medina et al., 2004). In cbs/cbs mutants, Dbx1-expressing cells were more dispersed, especially within the neocortex (Fig. 5E). Together, these data indicate that the PSPB does not form properly and that cells expressing dorsal or ventral markers intermingle at the boundary.
The dorsal telencephalic-diencephalic boundary in cbs mutants
As the PSPB does not form correctly in cbs/cbs mutants, it was of interest to see whether the dorsal telencephalic-diencephalic boundary was also affected. Histological analysis had identified a highly abnormal structure in this region containing many of the rosettes (Fig. 3D,H–J), which we have named the caudal rosette-rich area (CRA). Because of the severity of these abnormalities, morphological landmarks could not be used, and so we used developmental marker analysis to define the cellular composition of this structure. Foxg1 is expressed by all telencephalic cells, except for the cortical hem and CR neurons, and shows an expression gradient in the hippocampus with lower expression levels medially (Fig. 6A) (Tao and Lai, 1992; Hanashima et al., 2002). In situ hybridization for Foxg1 revealed a similar pattern in cbs/cbs mutant neocortex, with higher expression levels laterally and weak expression medially, but showed an absence of Foxg1 expression in the CRA except for a small patch of cells located at its lateral margin (Fig. 6A). Because of lower Foxg1 expression levels in developing hippocampus of wild-type embryos we analyzed the expression patterns of Lhx2 and Emx2, which both show an opposite expression gradient to Foxg1 in the cortex (Fig. 6B,C). In addition to their expression in the cbs/cbs neocortex (Lhx2: Fig. 4D; Emx2: Fig. 8C) both Lhx2 and Emx2 showed a scattered expression within the CRA (Fig. 6B,C). Similarly, inspection of Wnt2b and Ttr1 expression, which mark the cortical hem and choroid plexus in wild-type embryos, respectively, revealed the presence of scattered Wnt2b- (Fig. 6D) and Ttr1- (Fig. 6E) positive cells in the lateral-most part of the CRA. These data suggest that telencephalic cells contribute to the CRA.
Figure 8.
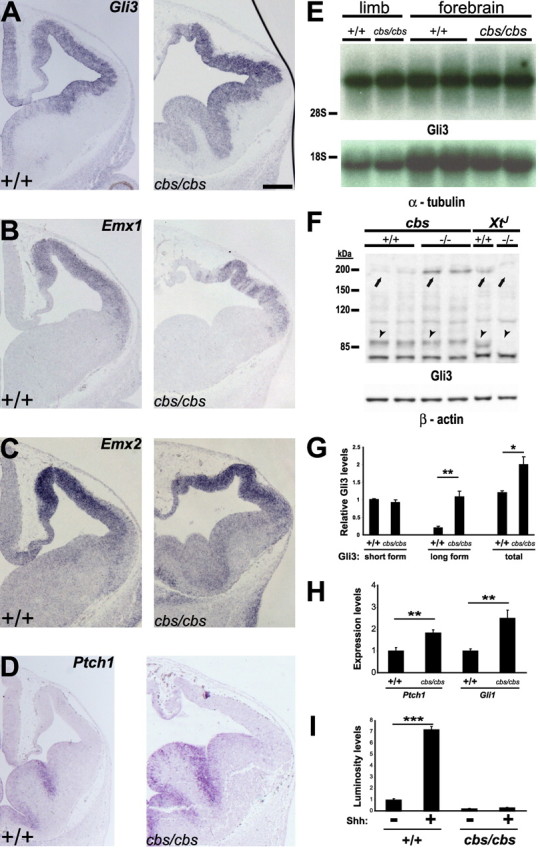
Targets of Shh signaling and Gli3 protein processing are disturbed in the forebrain of cbs mutants. A–D, In situ hybridization analysis of 12.5 wild-type and cbs/cbs embryos. For each coronal section, only one telencephalic half is shown, with dorsal to the top, lateral to the right. Scale bars: 300 μm. A, Gli3. B, Emx1. C, Emx2. D, Ptch1. E, Northern blots of whole RNA from forebrain of E12.5 wild-type and cbs/cbs embryos. Full-length Gli3 (top) and α-tubulin cDNAs (bottom) were used as probes. Ribosomal RNA markers are to the left. F, Western blots of protein from forebrain of E12.5 cbs and XtJ wild-type (+/+) and homozygous mutant (−/−) embryos. An anti-N-terminal-Gli3 antibody (top) and an anti-β-actin antibody (bottom) were used. Specific bands corresponding to the 190 kDa full-length Gli3 isoform (arrows) and the 80 kDa proteolytically processed Gli3 isoform (arrowheads) are indicated. The specificity of the antibody was shown by examining homozygous Gli3 deletion mutants (XtJ), in which neither full-length nor processed Gli3 isoforms are detectable. Protein markers (kDa) are to the left. G, Quantitation of Gli3 Western blots seen in (F), first indicating the amount of the 90 kDa (short form) Gli3 isoform, setting levels in +/+ to 1.0. A quantitative comparison of the 190 kDa (long form) isoform shows 19.4% levels in +/+ embryos, compared with the short form. cbs/cbs mutants show a 5.6-fold increase in the amount of the long form, compared with +/+ embryos, to levels greater than that of the short form in cbs/cbs embryos. The combined amount of short and long isoforms is also indicated (total). H, Quantitative real time RT-PCR was performed upon mRNA extracted from E12.5 telencephalon. Reverse-transcribed cDNA was analyzed using TaqMan probes recognizing Ptch1 and Gli1. cDNA was normalized using probes for GAPDH. I, Luciferase assays using a Gli-responsive luciferase plasmid transiently transfected into fibroblasts prepared from wild-type and cbs/cbs embryos and allowed to reach confluency. Sonic hedgehog (Shh, 1 μg/ml) was added to the cultures for 12 h before lysis and analysis of luciferase levels. Relative luminosity levels relative to Shh-untreated wild-type cells are indicated. G–I, Mean values ± SEM (n = 4–8). ***p < 0.001, **p < 0.01, *p < 0.05, Student's t test.
However, Emx2 and Lhx2 are also expressed in the eminentia thalami (ET) and in the dorsal diencephalon, respectively. We therefore investigated the possibility that the CRA also contains diencephalic cell types. Shh expression at the zona limitans intrathalamica (ZLI) separates the dorsal from the ventral thalamus in both wild-type and cbs/cbs mutant forebrains (Fig. 6F), indicating that the cbs mutant dorsal thalamus does not extend into the CRA. Consistent with this, Dlx2 expression, which marks the ventral thalamus (VT) of wild-type embryos (Bulfone et al., 1993), is found in the CRA of cbs mutants, although in a highly disorganized and patchy manner (Fig. 6G). Finally, Foxd1 is expressed in the ventral diencephalon of wild-type embryos (Fig. 6H). Similar to Dlx2, a group of Foxd1-expressing cells is located within the CRA of cbs/cbs mutants (Fig. 6H). However, neither Dlx2 (Fig. 6G) nor Foxd1 (Fig. 6H) expressions were observed in the dorsal telencephalon. Together, these data suggest that the CRA is mainly composed of VT and ET cells, but also contains some scattered telencephalic cells.
Wnt expression and signaling is upregulated in cbs mutants
Mutations in ciliary and basal body proteins have recently been shown to result in an upregulation of canonical Wnt signaling (Gerdes et al., 2007; Corbit et al., 2008). To examine whether Wnt signaling may play a role in the morphological defects seen in the cbs mutant, we examined the expression of several Wnt genes. In the wild-type E12.5 neocortex, Wnt7b expression can be detected in the cortical hem and hippocampal VZ, and in cortical neurons, but it is absent from the neocortical VZ (Fig. 7A). While cbs/cbs mutants displayed normal Wnt7b expression in cortical neurons, they showed ectopic expression in isolated neocortical progenitor cells, similar to Gli3 mutants (Fig. 7A) (Theil, 2005). Interestingly, at caudal levels of cbs/cbs forebrain, strong Wnt7b expression could be detected in the CRA, which likely corresponds to its expression in the wild-type VT and ET (Fig. 7B). A similar but not as extensive upregulation was also observed for Wnt8b in the CRA (Fig. 7D). This upregulated Wnt gene expression in the CRA prompted us to test for activation of canonical Wnt signaling. Axin2, a direct target of the canonical Wnt signaling pathway (Jho et al., 2002; Lustig et al., 2002), has a graded expression in wild-type dorsomedial telencephalon (Fig. 7E), while cbs/cbs mutants showed a patchy Axin2 activation dorsomedially (Fig. 7E). In contrast, Axin2 was strongly expressed in the CRA of cbs/cbs mutants, especially within heterotopias (Fig. 7F). At this level, Axin2 expression also was found in the dorsal thalamus of both genotypes (Fig. 7F). To quantitate these increases in Wnt signaling, we performed quantitative, real-time RT-PCR upon mRNA extracted from E12.5 cbs/cbs telencephalon, comparing gene expression levels to wild-type littermates. We observed a 1.54 ± 0.25-fold increase in the expression of Axin2 (p < 0.05, n = 5, Student's t test) but curiously not that of Wnt7b (1.25 ± 0.24-fold increase, p = 0.37, n = 6), indicating that the heterotopic expression of Wnt7b is in aggregate not reflective of an increase in total mRNA levels. Together, these data suggest that an ectopic activation of canonical Wnt signaling in the CRA occurs, but it cannot be directly attributed to an upregulation of Wnt7b expression.
Targets of Shh signaling and Gli3 protein processing are disturbed in the forebrain of cbs mutants
Several phenotypes seen in cbs/cbs mutants resemble that seen in the Gli3 deletion mutant XtJ, including polydactyly, defects in the determination of dorsal telencephalic tissue, the formation of rosette-shaped heterotopias in the dorsal cortex, and the relaxation of the telencephalic-diencephalic boundary (Johnson, 1967; Theil et al., 1999; Tole et al., 2000; Fotaki et al., 2006). This prompted us to examine Gli3 expression patterns in the cbs mutant. High levels of Gli3 expression were retained in the telencephalon of cbs/cbs mutants (Fig. 8A). One of the hallmarks of the XtJ mutant is a complete abolishment and a strong downregulation, respectively, in the expression of the transcription factors Emx1 and Emx2 (Theil et al., 1999; Tole et al., 2000). Intriguingly, examination of both of these markers revealed no downregulation in their expression (Fig. 8B,C), rather, a patchy Emx1 expression pattern.
Several laboratories have reported defects in the proteolytic processing of Gli3 in a number of IFT mutants (Haycraft et al., 2005; Huangfu and Anderson, 2005; Liu et al., 2005; May et al., 2005; Tran et al., 2008). To examine the effect upon Gli3 processing in the cbs mutant, we performed Western blotting upon protein extracted from 12.5 d.p.c forebrain tissue. Using an anti-N-terminal-Gli3 antibody, the production of both the full-length, 190 kDa repressor (Fig. 8F, arrows) form of Gli3 and the truncated, 90 kDa activator form of Gli3 could be detected (Fig. 8F, arrowheads). In cbs/cbs mutants, no change was observed in the amount of the cleaved isoform (Fig. 8F, arrowheads), whereas a strong increase was observed in the amount of the full-length isoform (Fig. 8F, arrows). Quantitation revealed a 5.6-fold increase in the amount of the full-length Gli3-isoform in cbs/cbs mutant forebrain, compared with wild type, whereas the amount of processed-Gli3 isoform in the cbs/cbs mutant did not change significantly (Fig. 8G). Together, the total amount of Gli3 protein increases by 67.2% in cbs/cbs forebrain (Fig. 8G). These changes are not explained at the level of transcription, as Northern blot analysis of RNA isolated from the forebrain revealed neither a change in the quantity of Gli3 mRNA nor in transcript size (Fig. 8E).
To examine the potential effect of an overproduction of the full-length Gli3 isoform in cbs/cbs forebrain, in situ analysis of Ptch1, a downstream target of Shh signaling (Goodrich et al., 1996; Marigo et al., 1996; Platt et al., 1997; Agren et al., 2004), was performed. The expression of Ptch1 seemed to increase in the GEs of cbs/cbs mutants (Fig. 8D), but no expression was observed in the dorsal telencephalon. To quantitate these apparent increases in Ptch1 expression, we performed quantitative, real-time RT-PCR upon mRNA extracted from E12.5 cbs/cbs telencephalon, comparing gene expression levels to wild-type littermates. Indeed, we observed a clear increase in the expression of both Ptch1 and Gli1 (Fig. 8H), another downstream target of Shh signaling (Lee et al., 1997). To test whether cells in the cbs/cbs mutant lost their competence to respond to Shh signaling, fibroblast cultures were prepared from decapitated, eviscerated E12.5 wild-type and cbs/cbs embryos. Fibroblasts were electroporated with a Shh-responsive plasmid that expresses the firefly luciferase gene under the control of a minimal promoter and 8 tandem copies of a Gli binding site (Sasaki et al., 1997), using a plasmid expressing Renilla luciferase to control for transfection efficiency. Cells were allowed to reach confluency and the production of cilia was promoted by switching to a low-serum medium (Ocbina and Anderson, 2008), followed by treatment for 12 h with Shh at 1 μg/ml and lysis for quantitation of luciferase activity. In wild-type fibroblasts, Shh was able to induce a sevenfold increase in luciferase expression from the Gli-responsive reporter plasmid (Fig. 8I), but both basal and Shh-induced luciferase expression levels were greatly reduced in the cbs/cbs fibroblasts (Fig. 8I).
Discussion
We have uncovered a hypomorphic allele of the intraflagellar transport (IFT) gene Ift88 and used it to elucidate a critical role for primary cilia in the development of the dorsal telencephalon. cobblestone mutants show severe regionalization defects in the forebrain with a disorganization of the dorsomedial telencephalon including the choroid plexus, the cortical hem and the hippocampus. The mutation also affects the pallial-subpallial boundary and the dorsal telencephalic-diencephalic boundary, major boundaries demarcating the dorsal telencephalon. This forebrain phenotype shows strong resemblance to that of the Gli3 mouse mutant XtJ and indeed, proteolytic processing of the Gli3 protein is altered, shifting the relative ratio of Gli3 activator and repressor forms. In addition, the total amount of Gli3 protein is increased by 67% in the cbs/cbs mutants, explained by the large increase in the full-length, unprocessed isoform (Fig. 8F). Since the levels of Gli3 mRNA are not increased in the cbs/cbs mutants, we speculate that this full-length form is stabler within the cell than the processed isoform. All three Gli family members share two conserved sequences in their C terminals that target them for rapid degradation (Huntzicker et al., 2006). These sequences would also be present in the full-length isoform, and thus the reasons for its potential enhanced stability are unclear, but it is possible that motifs in the N terminus may protect the protein from degradation.
Several lines of evidence indicate that Ift88 is the defective gene in the cbs mutant. First, fine mapping indicated it to lie in a 0.5 cM interval containing Ift88. Second, the Ift88 mRNA and protein are expressed at only 25% of the levels of wild-type embryos. Third, compound cbs/Ift88tm1.1Bky embryos display a forebrain defect very similar to, but even more severe than, cbs/cbs mutants of the same age. The reduced expression and lack of mutation in the Ift88 mRNA in the cbs mutant indicates a novel hypomorphic allele that allows the embryos to live long enough to uncover major defects in dorsal telencephalic development, in contrast to the full knock-out, which dies already at 10.5 d.p.c (Murcia et al., 2000). In contrast to other Ift88 mutations (Murcia et al., 2000; Haycraft et al., 2001, 2005, 2007; Kramer-Zucker et al., 2005; Banizs et al., 2005), ultrastructurally normal primary cilia are still to be found projecting into the telencephalic ventricle of cbs/cbs mutants. We hypothesize that the observed levels of Ift88 protein in the cbs mutant (25% of wild-type levels) are sufficient to generate primary cilia, as demonstrated by TEM and scanning EM in the forebrain (Fig. 1) and elsewhere (supplemental Fig. 5, available at www.jneurosci.org as supplemental material), but are not sufficient to maintain the levels of signal transduction/protein processing necessary for proper development, as demonstrated by a reduction in Gli3 processing (Fig. 8D), as has been reported for a number of IFT mutants (Haycraft et al., 2005; Huangfu and Anderson, 2005; Liu et al., 2005; May et al., 2005; Tran et al., 2008). Another observation suggests that functional cilia are formed in early development in cbs/cbs mutants. In knock-out mutations in IFT genes (Murcia et al., 2000; Liu et al., 2005), situs inversus has been correlated with a loss of cilia at the embryonic node (Murcia et al., 2000; Huangfu et al., 2003; Houde et al., 2006). Although cbs/cbs mutants never displayed situs inversus, compound heterozygotes of the cbs and Ift88 knock-out alleles, in which the protein levels of Ift88 are expected to be reduced further than in cbs/cbs mutants, did display situs inversus. This suggests that the level of Ift88 protein in the cbs/cbs mutant lies just above the limit for ciliary formation, but is not high enough to allow for normal signal transduction. The levels of Ift88 protein are also reduced in the Ift88 hypomorph Tg737orpk, and a postnatal examination of brain ventricles in this mutant indicated that cilia were indeed present, but they were sparser, shorter, and showed altered morphology (Banizs et al., 2005). It could be expected that primary cilia in the cbs/cbs mutants would also show morphological defects over time, but the early lethality of the embryos prevents this issue from being addressed.
The following observations allow us to conclude that the reduction of Ift88 protein levels seen in the cbs/cbs mutants results primarily in a defect in ciliary function. First, a large number of studies have reported the Ift88 protein to be exclusively localized to the base and tips of primary cilia, in a wide variety of tissues (Taulman et al., 2001; Pazour et al., 2002; Haycraft et al., 2005, 2007). Second, Ift88 is well documented to be involved in IFT (Rosenbaum and Witman, 2002). Third, the alterations seen in Gli3 processing (Fig. 8E,F) have also been seen in a number of mutants in IFT proteins that are also known to be localized to primary cilia (Haycraft et al., 2005; Huangfu and Anderson, 2005; Liu et al., 2005; May et al., 2005; Tran et al., 2008). Fourth, two other IFT proteins have been reported to show defects in forebrain development. Null mutations in Dnchc2, a gene encoding the retrograde IFT motor, demonstrate a breakdown in the pallial-subpallial boundary (May et al., 2005), while a null mutant in Thm1, a novel protein that localizes to cilia and regulates retrograde IFT, demonstrates exencephaly and heterotopia-like structures in the cerebral cortex (Herron et al., 2002; Tran et al., 2008). In comparison with Ift88 deletion mutants and other IFT mutants (Huangfu et al., 2003; May et al., 2005; Houde et al., 2006; Tran et al., 2008), cbs is therefore a novel mutation in that it shows no morphological ciliary defect but does indicate a reduction in ciliary function, through its altered processing of Gli3.
The cbs phenotype bears strong resemblance to that of the Gli3 deletion mutant XtJ. Both mutants show abnormal development of the dorsomedial telencephalon and of the boundaries separating the dorsal telencephalon from the ventral telencephalon (Tole et al., 2000; Kuschel et al., 2003) and from the diencephalon (Theil et al., 1999; Fotaki et al., 2006). Both mutants are also characterized by ectopic Wnt7b expression in cortical progenitors (Theil, 2005) and by formation of heterotopias with a rosette structure (Theil et al., 1999; Fotaki et al., 2006). However, there are also important phenotypic differences. In contrast to XtJ mutants, invagination and specification of dorsomedial structures (e.g., choroid plexus, cortical hem) occurs to some extent in the cbs mutant, similar to Gli3 hypomorphic mutants (Kuschel et al., 2003; Friedrichs et al., 2008). Also, Emx1 and Emx2 expression are retained in the neocortex of the cbs mutant (Fig. 8B,C), indicative of a weaker Gli3 mutant phenotype. However, rosette formation starts earlier and is more extensive in the cbs mutant, suggesting a stronger phenotype compared with Gli3 mutants.
We hypothesize that the differences could lie in the nature of the XtJ mutation, a genomic deletion of Gli3 in which both the full-length transcriptional activator as well as the processed transcriptional repressor forms are absent (Maynard et al., 2002). In contrast, cbs/cbs mutants retain both of these protein isoforms, but the relative ratio of the two is shifted toward the activator form by a factor of five. Because of competition between the two isoforms, the effective concentration of Gli3 repressor could be further reduced, and Gli3 target genes which would be repressed in wild-type embryos would be activated in the cbs/cbs forebrain inappropriately. However, the identity of these Gli3 genes targets in the cortex is not well understood. For example, although both Emx1 and Emx2 are downregulated in the XtJ mutant (Theil et al., 1999; Tole et al., 2000), Emx2 is not thought to be a direct transcriptional target of Gli3 (Theil et al., 2002). Therefore, the overproduction of the Gli activator in cbs mutants is probably not directly linked to the expression of Emx2 in the cbs mutant. In contrast, Wnt signaling has been shown to directly regulate the transcriptional activation of Emx2 (Theil et al., 2002). However, the upregulation that we observed of Wnt7b and Wnt8b was strongest in the caudal-most telencephalon, some distance away from the more rostral cortex where Emx1 and Emx2 are expressed, although it is possible that diffusion of these growth factors could in fact induce Emx1/2 transcription. Regardless of their transcriptional control, the maintenance of their expression in the cbs mutant, and the similar cbs and XtJ forebrain phenotypes, suggests that reduced Emx1/2 expression does not provide a major contribution to the XtJ forebrain defects, consistent with the finding that a double Emx1/Emx2 knock-out did not reproduce many aspects of the XtJ phenotype (Shinozaki et al., 2004).
Surprisingly, we observed an upregulation of the Shh-responsive genes Ptch1 and Gli1 in the cbs/cbs ventral telencephalon. This stands in contrast to the reduction of Ptch1 and Gli1 expression reported in the forelimb (Haycraft et al., 2005; Liu et al., 2005), hippocampus (Han et al., 2008), and cerebellum (Spassky et al., 2008) of several mouse mutants in IFT proteins. One possible explanation lies in the fact that cortical cilia are still present in the cbs/cbs mutants, whereas they are not present in the brain (Han et al., 2008; Spassky et al., 2008) or the forelimb (Haycraft et al., 2005) of the mutants reported in three of the studies reported above. In IFT mutants in which cilia are lost, transcriptionally active Gli3 is not produced (Haycraft et al., 2005; Huangfu and Anderson, 2005; Liu et al., 2005), and it has been suggested that the presence of cilia is necessary for the production and release of a transcriptionally activating, full-length Gli3 isoform (Caspary et al., 2007). Interestingly, disruption of the gene encoding the ciliary protein Arl13b also resulted in an expansion of the Ptch1-expressing tissue in the spinal cord, reminiscent to the increase of Ptch1 expression that we see in the GEs of the cbs/cbs mutant (Fig. 8D). We propose that the low levels of Ift88 protein seen in the cbs/cbs mutants, which clearly allow for the establishment of morphologically normal cilia, also allow for the production and accumulation of a transcriptional-activating, full-length Gli3 isoform, which is responsible for the observed upregulation of Ptch1 and Gli1. It is also possible that Gli2 may serve this function; not only has it been localized to cilia, but also its transcriptional-activating properties have been suggested to depend upon cilia (Haycraft et al., 2005). However, the deficiencies in IFT expected to arise from a 75% decrease in Ift88 protein levels prohibit an acute transcriptional response to Shh treatment in vitro, as seen in the luciferase experiments on fibroblast cultures (Fig. 8I) and also reported for other IFT mutants (Ocbina and Anderson, 2008). In any case, altered Shh signaling is unlikely to contribute to the dorsal telencephalic phenotype found in the cbs/cbs mutants, as seen by comparison with the situation in the XtJ mutant. In XtJ/XtJ embryos, as in cbs/cbs embryos, Shh signaling is not ectopically activated in the dorsal telencephalon (Theil et al., 1999). More importantly, the XtJ mutant dorsal telencephalic phenotype is not rescued in XtJ/Shh double mutant embryos (Rash and Grove, 2007).
It must also be kept in mind that other developmentally important proteins, such as Wnt signaling proteins (Corbit et al., 2008), have also been localized to cilia. Interestingly, we observed a clear upregulation of Axin2, a target of canonical Wnt signaling (Fig. 7), and an ectopic expression of Wnt7b and Wnt8b that may account for the Axin2 upregulation Although both Wnt7b and Wnt8b are seen to be upregulated in the XtJ mutant, the upregulation in the caudal rosette-rich area of the cbs mutant is more extensive than seen in the corresponding area of the XtJ mutant brain, suggesting that it may be a direct consequence of ciliary misfunction. Clearly, further investigation is needed to dissect the relative contributions of Gli3 and Wnt family members to cilia-directed telencephalic development, and also to examine other roles that cilia may play at later stages in the differentiation of this complicated structure.
Footnotes
This work was supported by the German Research Foundation (K.L.T., Deutsche Forschungsgemeinschaft, Sonderforschungsbereich 488), the University of Heidelberg (K.L.T.), and the Wellcome Trust (T.T.). We thank Yves-Alain Barde for supporting the ENU screen, Joachim Kirsch for generous scientific support, Andrew Peterson for ENU mutagenesis advice, Bradley Yoder (University of Albama at Birmingham Recessive Polycystic Kidney Disease Research and Translational Core Center 5 P30 DK074038–02) and Venus Roper for mouse lines Ift88tm1.1Bky and Ift88Δ2–3βgal, Ulrich Rüther for the XtJ line, Joseph Besharse for anti-Ift88 antibodies, James Briscoe for the Shh reporter plasmid, David Wilkinson, Alexandra Joyner, John Mason, Ulrich Rüther, and Matthias Treier for in situ probes, Ho Li for in silico SNP primer evaluation, Vassiliki Fotaki for Gli3 Western advice, Sophia Bardehle for setting up real-time RT-PCR, David Lau for help with luciferase assays, and Angela Scuderi, Bernice Pawletta, Xiao Shen, Xiao-Rui Sun, Valentin Evsyukov, and Christina Spassova for excellent technical assistance.
References
- Agren M, Kogerman P, Kleman MI, Wessling M, Toftgård R. Expression of the PTCH1 tumor suppressor gene is regulated by alternative promoters and a single functional Gli-binding site. Gene. 2004;330:101–114. doi: 10.1016/j.gene.2004.01.010. [DOI] [PubMed] [Google Scholar]
- Banizs B, Pike MM, Millican CL, Ferguson WB, Komlosi P, Sheetz J, Bell PD, Schwiebert EM, Yoder BK. Dysfunctional cilia lead to altered ependyma and choroid plexus function, and result in the formation of hydrocephalus. Development. 2005;132:5329–5339. doi: 10.1242/dev.02153. [DOI] [PubMed] [Google Scholar]
- Bisgrove BW, Yost HJ. The roles of cilia in developmental disorders and disease. Development. 2006;133:4131–4143. doi: 10.1242/dev.02595. [DOI] [PubMed] [Google Scholar]
- Brachmann I, Jakubick VC, Shakèd M, Unsicker K, Tucker KL. A simple slice culture system for the imaging of nerve development in embryonic mouse. Dev Dyn. 2007;236:3514–3523. doi: 10.1002/dvdy.21386. [DOI] [PubMed] [Google Scholar]
- Bulchand S, Grove EA, Porter FD, Tole S. LIM-homeodomain gene Lhx2 regulates the formation of the cortical hem. Mech Dev. 2001;100:165–175. doi: 10.1016/s0925-4773(00)00515-3. [DOI] [PubMed] [Google Scholar]
- Bulfone A, Puelles L, Porteus MH, Frohman MA, Martin GR, Rubenstein JL. Spatially restricted expression of Dlx-1, Dlx-2 (Tes-1), Gbx-2, and Wnt-3 in the embryonic day 12.5 mouse forebrain defines potential transverse and longitudinal segmental boundaries. J Neurosci. 1993;13:3155–3172. doi: 10.1523/JNEUROSCI.13-07-03155.1993. [DOI] [PMC free article] [PubMed] [Google Scholar]
- Caspary T, Larkins CE, Anderson KV. The graded response to Sonic Hedgehog depends on cilia architecture. Dev Cell. 2007;12:767–778. doi: 10.1016/j.devcel.2007.03.004. [DOI] [PubMed] [Google Scholar]
- Chizhikov VV, Davenport J, Zhang Q, Shih EK, Cabello OA, Fuchs JL, Yoder BK, Millen KJ. Cilia proteins control cerebellar morphogenesis by promoting expansion of the granule progenitor pool. J Neurosci. 2007;27:9780–9789. doi: 10.1523/JNEUROSCI.5586-06.2007. [DOI] [PMC free article] [PubMed] [Google Scholar]
- Cohen E, Meininger V. Ultrastructural analysis of primary cilium in the embryonic nervous tissue of mouse. Int J Dev Neurosci. 1987;5:43–51. doi: 10.1016/0736-5748(87)90047-5. [DOI] [PubMed] [Google Scholar]
- Corbit KC, Shyer AE, Dowdle WE, Gaulden J, Singla V, Chen MH, Chuang PT, Reiter JF. Kif3a constrains beta-catenin-dependent Wnt signalling through dual ciliary and non-ciliary mechanisms. Nat Cell Biol. 2008;10:70–76. doi: 10.1038/ncb1670. [DOI] [PubMed] [Google Scholar]
- Davis EE, Brueckner M, Katsanis N. The emerging complexity of the vertebrate cilium: new functional roles for an ancient organelle. Dev Cell. 2006;11:9–19. doi: 10.1016/j.devcel.2006.06.009. [DOI] [PubMed] [Google Scholar]
- Dietrich WF, Miller JC, Steen RG, Merchant M, Damron D, Nahf R, Gross A, Joyce DC, Wessel M, Dredge RD, et al. A genetic map of the mouse with 4,006 simple sequence length polymorphisms. Nat Genet. 1994;7:220–245. doi: 10.1038/ng0694supp-220. [DOI] [PubMed] [Google Scholar]
- Duan W, Cole T, Schreiber G. Cloning and nucleotide sequencing of transthyretin (prealbumin) cDNA from rat choroid plexus and liver. Nucleic Acids Res. 1989;17:3979. doi: 10.1093/nar/17.10.3979. [DOI] [PMC free article] [PubMed] [Google Scholar]
- Fotaki V, Yu T, Zaki PA, Mason JO, Price DJ. Abnormal positioning of diencephalic cell types in neocortical tissue in the dorsal telencephalon of mice lacking functional Gli3. J Neurosci. 2006;26:9282–9292. doi: 10.1523/JNEUROSCI.2673-06.2006. [DOI] [PMC free article] [PubMed] [Google Scholar]
- Friedrichs M, Larralde O, Skutella T, Theil T. Lamination of the cerebral cortex is disturbed in Gli3 mutant mice. Dev Biol. 2008;318:203–214. doi: 10.1016/j.ydbio.2008.03.032. [DOI] [PubMed] [Google Scholar]
- Fuchs JL, Schwark HD. Neuronal primary cilia: a review. Cell Biol Int. 2004;28:111–118. doi: 10.1016/j.cellbi.2003.11.008. [DOI] [PubMed] [Google Scholar]
- Gerdes JM, Liu Y, Zaghloul NA, Leitch CC, Lawson SS, Kato M, Beachy PA, Beales PL, DeMartino GN, Fisher S, Badano JL, Katsanis N. Disruption of the basal body compromises proteasomal function and perturbs intracellular Wnt response. Nat Genet. 2007;39:1350–1360. doi: 10.1038/ng.2007.12. [DOI] [PubMed] [Google Scholar]
- Goodrich LV, Johnson RL, Milenkovic L, McMahon JA, Scott MP. Conservation of the hedgehog/patched signaling pathway from flies to mice: induction of a mouse patched gene by Hedgehog. Genes Dev. 1996;10:301–312. doi: 10.1101/gad.10.3.301. [DOI] [PubMed] [Google Scholar]
- Gorgas K. Peroxisomes in sebaceous glands. V. Complex peroxisomes in the mouse preputial gland: serial sectioning and three-dimensional reconstruction studies. Anat Embryol (Berl) 1984;169:261–270. doi: 10.1007/BF00315631. [DOI] [PubMed] [Google Scholar]
- Gradwohl G, Fode C, Guillemot F. Restricted expression of a novel murine atonal-related bHLH protein in undifferentiated neural precursors. Dev Biol. 1996;180:227–241. doi: 10.1006/dbio.1996.0297. [DOI] [PubMed] [Google Scholar]
- Grove EA, Tole S, Limon J, Yip L, Ragsdale CW. The hem of the embryonic cerebral cortex is defined by the expression of multiple Wnt genes and is compromised in Gli3-deficient mice. Development. 1998;125:2315–2325. doi: 10.1242/dev.125.12.2315. [DOI] [PubMed] [Google Scholar]
- Han YG, Spassky N, Romaguera-Ros M, Garcia-Verdugo JM, Aguilar A, Schneider-Maunoury S, Alvarez-Buylla A. Hedgehog signaling and primary cilia are required for the formation of adult neural stem cells. Nat Neurosci. 2008;11:277–284. doi: 10.1038/nn2059. [DOI] [PubMed] [Google Scholar]
- Hanashima C, Shen L, Li SC, Lai E. Brain factor-1 controls the proliferation and differentiation of neocortical progenitor cells through independent mechanisms. J Neurosci. 2002;22:6526–6536. doi: 10.1523/JNEUROSCI.22-15-06526.2002. [DOI] [PMC free article] [PubMed] [Google Scholar]
- Hatini V, Huh SO, Herzlinger D, Soares VC, Lai E. Essential role of stromal mesenchyme in kidney morphogenesis revealed by targeted disruption of Winged Helix transcription factor BF-2. Genes Dev. 1996;10:1467–1478. doi: 10.1101/gad.10.12.1467. [DOI] [PubMed] [Google Scholar]
- Haycraft CJ, Swoboda P, Taulman PD, Thomas JH, Yoder BK. The C. elegans homolog of the murine cystic kidney disease gene Tg737 functions in a ciliogenic pathway and is disrupted in osm-5 mutant worms. Development. 2001;128:1493–1505. doi: 10.1242/dev.128.9.1493. [DOI] [PubMed] [Google Scholar]
- Haycraft CJ, Banizs B, Aydin-Son Y, Zhang Q, Michaud EJ, Yoder BK. Gli2 and Gli3 localize to cilia and require the intraflagellar transport protein polaris for processing and function. PLoS Genet. 2005;1:e53. doi: 10.1371/journal.pgen.0010053. [DOI] [PMC free article] [PubMed] [Google Scholar]
- Haycraft CJ, Zhang Q, Song B, Jackson WS, Detloff PJ, Serra R, Yoder BK. Intraflagellar transport is essential for endochondral bone formation. Development. 2007;134:307–316. doi: 10.1242/dev.02732. [DOI] [PubMed] [Google Scholar]
- Herron BJ, Lu W, Rao C, Liu S, Peters H, Bronson RT, Justice MJ, McDonald JD, Beier DR. Efficient generation and mapping of recessive developmental mutations using ENU mutagenesis. Nat Genet. 2002;30:185–189. doi: 10.1038/ng812. [DOI] [PubMed] [Google Scholar]
- Houde C, Dickinson RJ, Houtzager VM, Cullum R, Montpetit R, Metzler M, Simpson EM, Roy S, Hayden MR, Hoodless PA, Nicholson DW. Hippi is essential for node cilia assembly and Sonic hedgehog signaling. Dev Biol. 2006;300:523–533. doi: 10.1016/j.ydbio.2006.09.001. [DOI] [PMC free article] [PubMed] [Google Scholar]
- Huangfu D, Anderson KV. Cilia and Hedgehog responsiveness in the mouse. Proc Natl Acad Sci U S A. 2005;102:11325–11330. doi: 10.1073/pnas.0505328102. [DOI] [PMC free article] [PubMed] [Google Scholar]
- Huangfu D, Liu A, Rakeman AS, Murcia NS, Niswander L, Anderson KV. Hedgehog signalling in the mouse requires intraflagellar transport proteins. Nature. 2003;426:83–87. doi: 10.1038/nature02061. [DOI] [PubMed] [Google Scholar]
- Hui CC, Joyner AL. A mouse model of greig cephalopolysyndactyly syndrome: the extra-toesJ mutation contains an intragenic deletion of the Gli3 gene. Nat Genet. 1993;3:241–246. doi: 10.1038/ng0393-241. [DOI] [PubMed] [Google Scholar]
- Huntzicker EG, Estay IS, Zhen H, Lokteva LA, Jackson PK, Oro AE. Dual degradation signals control Gli protein stability and tumor formation. Genes Dev. 2006;20:276–281. doi: 10.1101/gad.1380906. [DOI] [PMC free article] [PubMed] [Google Scholar]
- Jho EH, Zhang T, Domon C, Joo CK, Freund JN, Costantini F. Wnt/beta-catenin/Tcf signaling induces the transcription of Axin2, a negative regulator of the signaling pathway. Mol Cell Biol. 2002;22:1172–1183. doi: 10.1128/MCB.22.4.1172-1183.2002. [DOI] [PMC free article] [PubMed] [Google Scholar]
- Johnson DR. Extra-toes: a new mutant gene causing multiple abnormalities in the mouse. J Embryol Exp Morphol. 1967;17:543–581. [PubMed] [Google Scholar]
- Kramer-Zucker AG, Olale F, Haycraft CJ, Yoder BK, Schier AF, Drummond IA. Cilia-driven fluid flow in the zebrafish pronephros, brain and Kupffer's vesicle is required for normal organogenesis. Development. 2005;132:1907–1921. doi: 10.1242/dev.01772. [DOI] [PubMed] [Google Scholar]
- Kuschel S, Rüther U, Theil T. A disrupted balance between Bmp/Wnt and Fgf signaling underlies the ventralization of the Gli3 mutant telencephalon. Dev Biol. 2003;260:484–495. doi: 10.1016/s0012-1606(03)00252-5. [DOI] [PubMed] [Google Scholar]
- Lee J, Platt KA, Censullo P, Ruiz i Altaba A. Gli1 is a target of Sonic hedgehog that induces ventral neural tube development. Development. 1997;124:2537–2552. doi: 10.1242/dev.124.13.2537. [DOI] [PubMed] [Google Scholar]
- Lemischka IR, Farmer S, Racaniello VR, Sharp PA. Nucleotide sequence and evolution of a mammalian alpha-tubulin messenger RNA. J Mol Biol. 1981;151:101–120. doi: 10.1016/0022-2836(81)90223-0. [DOI] [PubMed] [Google Scholar]
- Liu A, Wang B, Niswander LA. Mouse intraflagellar transport proteins regulate both the activator and repressor functions of Gli transcription factors. Development. 2005;132:3103–3111. doi: 10.1242/dev.01894. [DOI] [PubMed] [Google Scholar]
- Lustig B, Jerchow B, Sachs M, Weiler S, Pietsch T, Karsten U, van de Wetering M, Clevers H, Schlag PM, Birchmeier W, Behrens J. Negative feedback loop of Wnt signaling through upregulation of conductin/axin2 in colorectal and liver tumors. Mol Cell Biol. 2002;22:1184–1193. doi: 10.1128/MCB.22.4.1184-1193.2002. [DOI] [PMC free article] [PubMed] [Google Scholar]
- Mangale VS, Hirokawa KE, Satyaki PR, Gokulchandran N, Chikbire S, Subramanian L, Shetty AS, Martynoga B, Paul J, Mai MV, Li Y, Flanagan LA, Tole S, Monuki ES. Lhx2 selector activity specifies cortical identity and suppresses hippocampal organizer fate. Science. 2008;319:304–309. doi: 10.1126/science.1151695. [DOI] [PMC free article] [PubMed] [Google Scholar]
- Marigo V, Davey RA, Zuo Y, Cunningham JM, Tabin CJ. Biochemical evidence that patched is the Hedgehog receptor. Nature. 1996;384:176–179. doi: 10.1038/384176a0. [DOI] [PubMed] [Google Scholar]
- May SR, Ashique AM, Karlen M, Wang B, Shen Y, Zarbalis K, Reiter J, Ericson J, Peterson AS. Loss of the retrograde motor for IFT disrupts localization of Smo to cilia and prevents the expression of both activator and repressor functions of Gli. Dev Biol. 2005;287:378–389. doi: 10.1016/j.ydbio.2005.08.050. [DOI] [PubMed] [Google Scholar]
- Maynard TM, Jain MD, Balmer CW, LaMantia AS. High-resolution mapping of the Gli3 mutation extra-toes reveals a 51.5-kb deletion. Mamm Genome. 2002;13:58–61. doi: 10.1007/s00335-001-2115-x. [DOI] [PubMed] [Google Scholar]
- Medina L, Legaz I, Gonzalez G, De Castro F, Rubenstein JL, Puelles L. Expression of Dbxl, Neurogenin 2, Semaphorin 5A, Cadherin 8, and Emx1 distinguish ventral and laterial pallial histogenetic divisions in the developing mouse claustroamygdaloid complex. J Comp Neurol. 2004;474:504–523. doi: 10.1002/cne.20141. [DOI] [PubMed] [Google Scholar]
- Meyer G, Perez-Garcia CG, Abraham H, Caput D. Expression of p73 and Reelin in the developing human cortex. J Neurosci. 2002;22:4973–4986. doi: 10.1523/JNEUROSCI.22-12-04973.2002. [DOI] [PMC free article] [PubMed] [Google Scholar]
- Monuki ES, Porter FD, Walsh CA. Patterning of the dorsal telencephalon and cerebral cortex by a roof plate-Lhx2 pathway. Neuron. 2001;32:591–604. doi: 10.1016/s0896-6273(01)00504-9. [DOI] [PubMed] [Google Scholar]
- Moody SA, Quigg MS, Frankfurter A. Development of the peripheral trigeminal system in the chick revealed by an isotype-specific anti-beta-tubulin monoclonal antibody. J Comp Neurol. 1989;279:567–580. doi: 10.1002/cne.902790406. [DOI] [PubMed] [Google Scholar]
- Murcia NS, Richards WG, Yoder BK, Mucenski ML, Dunlap JR, Woychik RP. The Oak Ridge Polycystic Kidney (orpk) disease gene is required for left-right axis determination. Development. 2000;127:2347–2355. doi: 10.1242/dev.127.11.2347. [DOI] [PubMed] [Google Scholar]
- Nagele RG, Lee HY. Ultrastructural changes in cells associated with interkinetic nuclear migration in the developing chick neuroepithelium. J Exp Zool. 1979;210:89–106. doi: 10.1002/jez.1402100110. [DOI] [PubMed] [Google Scholar]
- Ocbina PJ, Anderson KV. Intraflagellar transport, cilia, and mammalian Hedgehog signaling: analysis in mouse embryonic fibroblasts. Dev Dyn. 2008;237:2030–2038. doi: 10.1002/dvdy.21551. [DOI] [PMC free article] [PubMed] [Google Scholar]
- Pazour GJ, Baker SA, Deane JA, Cole DG, Dickert BL, Rosenbaum JL, Witman GB, Besharse JC. The intraflagellar transport protein, IFT88, is essential for vertebrate photoreceptor assembly and maintenance. J Cell Biol. 2002;157:103–113. doi: 10.1083/jcb.200107108. [DOI] [PMC free article] [PubMed] [Google Scholar]
- Platt KA, Michaud J, Joyner AL. Expression of the mouse Gli and Ptc genes is adjacent to embryonic sources of hedgehog signals suggesting a conservation of pathways between flies and mice. Mech Dev. 1997;62:121–135. doi: 10.1016/s0925-4773(96)00648-x. [DOI] [PubMed] [Google Scholar]
- Porter FD, Drago J, Xu Y, Cheema SS, Wassif C, Huang SP, Lee E, Grinberg A, Massalas JS, Bodine D, Alt F, Westphal H. Lhx2, a LIM homeobox gene, is required for eye, forebrain, and definitive erythrocyte development. Development. 1997;124:2935–2944. doi: 10.1242/dev.124.15.2935. [DOI] [PubMed] [Google Scholar]
- Rash BG, Grove EA. Patterning the dorsal telencephalon: a role for sonic hedgehog? J Neurosci. 2007;27:11595–11603. doi: 10.1523/JNEUROSCI.3204-07.2007. [DOI] [PMC free article] [PubMed] [Google Scholar]
- Rosenbaum JL, Witman GB. Intraflagellar transport. Nat Rev Mol Cell Biol. 2002;3:813–825. doi: 10.1038/nrm952. [DOI] [PubMed] [Google Scholar]
- Sasaki H, Hui C, Nakafuku M, Kondoh H. A binding site for Gli proteins is essential for HNF-3beta floor plate enhancer activity in transgenics and can respond to Shh in vitro. Development. 1997;124:1313–1322. doi: 10.1242/dev.124.7.1313. [DOI] [PubMed] [Google Scholar]
- Scholey JM, Anderson KV. Intraflagellar transport and cilium-based signaling. Cell. 2006;125:439–442. doi: 10.1016/j.cell.2006.04.013. [DOI] [PubMed] [Google Scholar]
- Shinozaki K, Yoshida M, Nakamura M, Aizawa S, Suda Y. Emx1 and Emx2 cooperate in initial phase of archipallium development. Mech Dev. 2004;121:475–489. doi: 10.1016/j.mod.2004.03.013. [DOI] [PubMed] [Google Scholar]
- Spassky N, Han YG, Aguilar A, Strehl L, Besse L, Laclef C, Ros MR, Garcia-Verdugo JM, Alvarez-Buylla A. Primary cilia are required for cerebellar development and Shh-dependent expansion of progenitor pool. Dev Biol. 2008;317:246–259. doi: 10.1016/j.ydbio.2008.02.026. [DOI] [PMC free article] [PubMed] [Google Scholar]
- Takiguchi-Hayashi K, Sekiguchi M, Ashigaki S, Takamatsu M, Hasegawa H, Suzuki-Migishima R, Yokoyama M, Nakanishi S, Tanabe Y. Generation of reelin-positive marginal zone cells from the caudomedial wall of telencephalic vesicles. J Neurosci. 2004;24:2286–2295. doi: 10.1523/JNEUROSCI.4671-03.2004. [DOI] [PMC free article] [PubMed] [Google Scholar]
- Tao W, Lai E. Telencephalon-restricted expression of BF-1, a new member of the HNF-3/fork head gene family, in the developing rat brain. Neuron. 1992;8:957–966. doi: 10.1016/0896-6273(92)90210-5. [DOI] [PubMed] [Google Scholar]
- Taulman PD, Haycraft CJ, Balkovetz DF, Yoder BK. Polaris, a protein involved in left-right axis patterning, localizes to basal bodies and cilia. Mol Biol Cell. 2001;12:589–599. doi: 10.1091/mbc.12.3.589. [DOI] [PMC free article] [PubMed] [Google Scholar]
- Theil T. Gli3 is required for the specification and differentiation of preplate neurons. Dev Biol. 2005;286:559–571. doi: 10.1016/j.ydbio.2005.08.033. [DOI] [PubMed] [Google Scholar]
- Theil T, Alvarez-Bolado G, Walter A, Rüther U. Gli3 is required for Emx gene expression during dorsal telencephalon development. Development. 1999;126:3561–3571. doi: 10.1242/dev.126.16.3561. [DOI] [PubMed] [Google Scholar]
- Theil T, Aydin S, Koch S, Grotewold L, Rüther U. Wnt and Bmp signalling cooperatively regulate graded Emx2 expression in the dorsal telencephalon. Development. 2002;129:3045–3054. doi: 10.1242/dev.129.13.3045. [DOI] [PubMed] [Google Scholar]
- Tole S, Ragsdale CW, Grove EA. Dorsoventral patterning of the telencephalon is disrupted in the mouse mutant extra-toes(J) Dev Biol. 2000;217:254–265. doi: 10.1006/dbio.1999.9509. [DOI] [PubMed] [Google Scholar]
- Tran PV, Haycraft CJ, Besschetnova TY, Turbe-Doan A, Stottmann RW, Herron BJ, Chesebro AL, Qiu H, Scherz PJ, Shah JV, Yoder BK, Beier DR. THM1 negatively modulates mouse sonic hedgehog signal transduction and affects retrograde intraflagellar transport in cilia. Nat Genet. 2008;40:403–410. doi: 10.1038/ng.105. [DOI] [PMC free article] [PubMed] [Google Scholar]
- Tucker KL, Beard C, Dausmann J, Jackson-Grusby L, Laird PW, Lei H, Li E, Jaenisch R. Germ-line passage is required for establishment of methylation and expression patterns of imprinted but not of nonimprinted genes. Genes Dev. 1996;10:1008–1020. doi: 10.1101/gad.10.8.1008. [DOI] [PubMed] [Google Scholar]
- Tucker KL, Wang Y, Dausman J, Jaenisch R. A transgenic mouse strain expressing four drug-selectable marker genes. Nucleic Acids Res. 1997;25:3745–3746. doi: 10.1093/nar/25.18.3745. [DOI] [PMC free article] [PubMed] [Google Scholar]
- Tucker KL, Meyer M, Barde YA. Neurotrophins are required for nerve growth during development. Nat Neurosci. 2001;4:29–37. doi: 10.1038/82868. [DOI] [PubMed] [Google Scholar]
- Walther C, Gruss P. Pax-6, a murine paired box gene, is expressed in the developing CNS. Development. 1991;113:1435–1449. doi: 10.1242/dev.113.4.1435. [DOI] [PubMed] [Google Scholar]
- Wang B, Fallon JF, Beachy PA. Hedgehog-regulated processing of Gli3 produces an anterior/posterior repressor gradient in the developing vertebrate limb. Cell. 2000;100:423–434. doi: 10.1016/s0092-8674(00)80678-9. [DOI] [PubMed] [Google Scholar]
- Yamashita T, Tucker KL, Barde YA. Neurotrophin binding to the p75 receptor modulates Rho activity and axonal outgrowth. Neuron. 1999;24:585–593. doi: 10.1016/s0896-6273(00)81114-9. [DOI] [PubMed] [Google Scholar]
- Yun K, Potter S, Rubenstein JL. Gsh2 and Pax6 play complementary roles in dorsoventral patterning of the mammalian telencephalon. Development. 2001;128:193–205. doi: 10.1242/dev.128.2.193. [DOI] [PubMed] [Google Scholar]
- Zhang Q, Murcia NS, Chittenden LR, Richards WG, Michaud EJ, Woychik RP, Yoder BK. Loss of the Tg737 protein results in skeletal patterning defects. Dev Dyn. 2003;227:78–90. doi: 10.1002/dvdy.10289. [DOI] [PubMed] [Google Scholar]