

Abstract
Mechanosensory hair cells within the zebrafish lateral line spontaneously regenerate after aminoglycoside-induced death. Exposure of 5-d-old larvae to 400 μm neomycin for 1 h results in death of almost all lateral line hair cells. Regeneration of new hair cells is observed by 24 h after neomycin treatment with nearly complete replacement by 72 h. Using bromodeoxyuridine incorporation, we show that the majority of new hair cells are generated from a transient increase in support cell proliferation that occurs between 12 and 21 h after neomycin damage. Additional observations reveal two distinct subsets of proliferating support cells within the neuromasts that differ in position, morphology, and temporal pattern of proliferation in response to neomycin exposure. We hypothesize that proliferative hair cell progenitors are located centrally within the neuromasts, whereas peripheral support cells may have a separate function. Expression of Notch signaling pathway members notch3, deltaA, and atoh1a transcripts are all upregulated within the first 24 h after neomycin treatment, during the time of maximum proliferation of support cells and hair cell progenitor formation. Treatment with a γ-secretase inhibitor results in excess regenerated hair cells by 48 h after neomycin-induced death but has no effect without previous damage. Excess hair cells result from increased support cell proliferation. These results suggest a model where Notch signaling limits the number of hair cells produced during regeneration by regulating support cell proliferation.
Keywords: lateral line, Notch, hair cell regeneration, support cell proliferation, zebrafish, aminoglycoside
Introduction
Loss of inner ear mechanosensory hair cells (HCs) from exposure to noise or ototoxic drugs causes hearing loss and balance disorders in humans (Forge and Schacht, 2000; Petit et al., 2001; Seidman et al., 2002; Chen and Fechter, 2003; Matsui and Cotanche, 2004). Although HC loss is irreversible in humans and other mammals, regeneration is widespread in nonmammalian vertebrates (Stone and Rubel, 2000; Warchol et al., 2001; Matsui et al., 2004).
In zebrafish, Danio rerio, HCs are also found within neuromasts of the lateral line, superficial sensory organs that detect differential water movements (Montgomery et al., 2000). Each neuromast contains a cluster of HCs surrounded by nonsensory supporting cells (Metcalfe et al., 1985; Raible and Kruse, 2000; Gompel et al., 2001). Lateral line HCs share structural, functional, and molecular similarities with those in the inner ear (Whitfield, 2002; Nicolson, 2005). Similarly, they are hypersensitive to damage from ototoxic drugs such as aminoglycosides and antineoplastic drugs (Song et al., 1995; Williams and Holder, 2000; Harris et al., 2003; Murakami et al., 2003; Ton and Parng, 2005; Santos et al., 2006; Ou et al., 2007; Owens et al., 2007) as well as agents such as copper (Hernandez et al., 2006, 2007; Linbo et al., 2006). Regeneration of lateral line HCs have been studied after laser ablation in axolotls (Balak et al., 1990; Jones and Corwin, 1996) and aminoglycoside or copper treatments in fish (Song et al., 1995; Williams and Holder, 2000; Harris et al., 2003; Lopez-Schier and Hudspeth, 2006; Hernandez et al., 2007).
In the avian inner ear and the axolotl lateral line, support cells (SCs) proliferate after HC damage to renew both HCs and SCs (Girod et al., 1989; Raphael, 1992; Hashino and Salvi, 1993; Stone and Cotanche, 1994; Jones and Corwin, 1996). Support cells have also been shown to directly convert into new HCs (Roberson and Rubel, 1994; Baird et al., 1996; Steyger et al., 1997; Roberson et al., 2004; Taylor and Forge, 2005). These studies suggest that signaling interactions between HCs and SCs regulate proliferation and differentiation of new replacement cells.
The Notch signaling pathway is well established as regulating interactions among cells in many developing systems, including HC and SC fate determination (Haddon et al., 1998a; Lanford et al., 1999; Zheng et al., 2000; Zine et al., 2000, 2001; Itoh and Chitnis, 2001; Kiernan et al., 2001; Kiernan et al., 2005; Takebayashi et al., 2007). Expression of Notch signaling components are also upregulated during regeneration in the avian ear (Stone and Rubel, 1999; Cafaro et al., 2007). These studies suggest that Notch signals would be good candidates for regulators of HC regeneration.
In this paper, we analyze HC regeneration and SC proliferation in the zebrafish lateral line after neomycin-induced death. We also investigate Notch signaling and discover its function in limiting SC proliferation during regeneration. In contrast, disruption of Notch signaling without previous damage does not initiate the production of HCs, suggesting that some other signal maintains SCs in a quiescent state.
Materials and Methods
Zebrafish maintenance and neomycin treatments.
Adult wild-type AB zebrafish were maintained at 28.5°C as described by Westerfield (1994). Embryos were produced by paired matings and raised in embryo media (EM; 1 mm MgSO4, 120 μm KH2PO4, 74 μm Na2HPO4, 1 mm CaCl2, 500 μm KCl, 15 μm NaCl, and 500 μm NaHCO3 in dH2O) at 28.5°C. Embryos and larvae were maintained at a density of 50–60 per 100 mm2 dish. Beginning at 4 d postfertilization (dpf), larvae were fed live paramecia as well as dry plant food. Histone-2az-green fluorescent protein (H2AZ-GFP) transgenic zebrafish (Pauls et al., 2001) were obtained from the Zebrafish International Resource Center (Eugene, OR) [Tg(h2afv:GFP)] and used for imaging experiments to visualize cell nuclei. The University of Washington Institutional Animal Care and Use Committee approved all animal procedures.
Neomycin treatments were performed on 5–6 dpf larvae because of the relative insensitivity of zebrafish to neomycin before 5 dpf (Murakami et al., 2003; Santos et al., 2006). Neomycin sulfate, acquired as a 10 mg/ml stock solution in dH2O (Sigma, St. Louis, MO), was diluted in EM to a final concentration of 400 μm. Free-swimming larvae were transferred into the 400 μm neomycin solution for 1 h, rinsed three times, and allowed to recover in fresh EM at 28.5°C (Harris et al., 2003; Murakami et al., 2003; Santos et al., 2006). Sibling fish were mock-treated by transferring into neomycin-free EM and served as controls.
Hair cell labeling and immunohistochemistry.
Functional mechanotransducing HCs were labeled with the vital dye FM1–43FX (Molecular Probes, Eugene, OR), a fixable version of FM1–43 [N-(3-triethyl-ammoniumpropyl)-4-(4-(dibutylamino)-styryl) pyridinium dibromide]. The ability of this dye to be retained in HCs after fixation facilitates the counting process. Larvae were placed in EM containing 3 μm FM1–43FX for 30 s and rinsed three times in fresh EM (Seiler and Nicolson, 1999). Fish were then anesthetized with 0.02% Tricaine (MS-222; Sigma) and fixed in 4% paraformaldehyde (PFA) in PBS, pH 7.2, for 2 h at room temperature (RT) or overnight at 4°C. After fixation, samples were washed three times with PBST (PBS/0.1% Triton X-100) and stored in 50% glycerol/PBS at 4°C before visualization.
Rabbit anti-myosin-VI (1:500; Proteus Biosciences, Ramona, CA) (Hasson and Mooseker, 1994; Hasson et al., 1997; Coffin et al., 2007), mouse anti-HCS-1 (hair cell-specific antigen; 1:200; a gift from Jeff Corwin; University of Virginia, Charlottesville, VA) (Gale et al., 2002), and mouse anti-acetylated tubulin (1:1000; Sigma) (Raible and Kruse, 2000; Harris et al., 2003) immunohistochemistry were also used to visualize lateral line HCs. After three washes of PBST for 20 min each, larvae were washed in distilled water for 30 min. Samples were then placed in block solution [1% bovine serum albumin, 1% dimethyl sufoxide (DMSO), and 0.02% sodium azide in PBST] containing 5% normal goat serum for 1 h before primary antibody incubation overnight at 4°C. After three washes in PBST for 20 min each, samples were incubated with either Alexa 488-conjugated goat anti-rabbit or anti-mouse secondary antibodies (1:500; Invitrogen, Eugene, OR) for 5 h at RT or overnight at 4°C. Fish were washed three times in PBST before storing at 4°C in 50% glycerol/PBS.
Cell proliferation assays.
Larvae were incubated in EM containing 10 mm bromodeoxyuridine (BrdU; Sigma) with 1% DMSO for 1 h at 28.5°C. Animals were then rinsed and either immediately anesthetized and fixed (pulse-fix) or allowed to recover for an extended period of time in fresh EM (pulse-chase). For continuous BrdU experiments, larvae were immediately transferred into the 10 mm BrdU solution after the 1 h neomycin (or mock) treatment. Fish were then fixed in 4% PFA for 2 h at RT or overnight at 4°C, washed several times in PBST, and stored at 4°C before being processed for immunohistochemistry.
BrdU immunohistochemistry procedures mainly followed those described by Harris et al. (2003) with a few modifications. Fixed samples were washed three times in PBDT (PBS, 1% DMSO, and 0.1% Tween 20) and dehydrated in 100% methanol for 1 h at −20°C. Samples were then rehydrated in a graded methanol series (75%, 50%, 25%; 20 min each), washed in PBDT, and incubated in 10 μg/ml proteinase K (in PBDT) for 20 min at RT. After rinsing three times in PBDT (5 min each), samples were refixed in 4% PFA solution for 20 min, washed again in PBDT (20 min), and incubated in 1N hydrochloric acid (in PBDT) for 1 h. After three more rinses in PBDT, samples were incubated in 10% block solution (10% normal goat serum in PBDT) for 1 h at RT before primary and secondary antibody incubation per immunohistochemistry protocol. Mouse anti-BrdU (BD PharMingen, San Jose, CA) and rat anti-BrdU (Abcam, Cambridge, MA) primary antibodies were both used at 1:100 dilution in 10% block, and Alexa 568-conjugated goat anti-mouse or anti-rat (Invitrogen) were used at 1:500 dilution (in 10% block) as secondary antibodies, respectively. To visualize the neuromasts under fluorescence, fish were counterstained with the pan-nuclear dye SYTOX Green (1:10,000 in PBST; Invitrogen) for 5 min, followed by several washes of PBST before storing in 50% glycerol/PBS and imaging.
For visualizing HCs concurrently with the BrdU label, samples were first immunostained for myosin-VI or acetylated tubulin as described previously. After the secondary antibody incubation, larvae were washed three times in PBST and refixed in 4% PFA for 20 min before proceeding with the BrdU immunohistochemistry protocol.
To detect cells in M-phase, rabbit anti-phosphohistone (H3) (1:200; Upstate Biotechnolgy, Lake Placid, NY) was used as a second marker for proliferating cells. Whole mount immunohistochemistry was performed as described previously.
Whole mount RNA in situ hybridization.
Whole mount RNA in situ hybridization was performed at 65°C following standard protocol (Grant et al., 2005). Samples were fixed in 4% PFA for 3 h at RT or 1 h at RT and overnight at 4°C. After rinsing several times in PBS/0.1% Tween 20, samples were dehydrated in 100% methanol and stored at −20°C for up to several months. Larvae were rehydrated in a graded methanol series (66%, 33%) for 5 min in each concentration and incubated in 10 μg/ml proteinase K (in PBS/0.1% Tween 20) for 10 min at 37°C. Fluorescent in situ hybridization (FISH) was performed at 55°C as published previously (Julich et al., 2005), followed by myosin-VI immunostaining and counterstaining with 4′,6′-diamidino-2-phenylindole (DAPI) (Invitrogen). Plasmids were cut and transcribed with the following for generating antisense digoxigenin-labeled RNA probes: Pme1/T7 for atoh1a (a gift from Bruce Riley, Texas A&M University, College Station, TX) (Millimaki et al., 2007); SalI/T7 for notch3 (clone NAA32G11; Open Biosystems, Huntsville, AL); XbaI/T7 for notch1a (a gift from Jose Campos-Ortega; University of Cologne, Cologne, Germany) (Bierkamp and Campos-Ortega, 1993); SmaI/T3 for notch1b [cDNA in pBS-SK plasmid (Addgene, Cambridge, MA)] (Kortschak et al., 2001); EcoRI/T7 for deltaA and deltaD (a gift from Bruce Appel, Vanderbilt University, Nashville, TN) (Haddon et al., 1998b); ApaI/Sp6 for jagged1a; EcoRV/Sp6 for jagged1b; and SpeI/T7 for jagged2 (all jagged plasmids were gifts from Natasha Tiso, University of Padua, Padua, Italy) (Zecchin et al., 2005).
Notch inhibitor studies.
Downstream Notch signaling was inhibited using the pharmacological inhibitor DAPT (N-[N-(3,5-difluorophenacetyl)-l-alanyl]-S-phenylglycine t-butyl ester), which blocks γ-secretase activity (Geling et al., 2002). Solid DAPT (Calbiochem, La Jolla, CA) was reconstituted in DMSO to make a stock concentration of 10 mm and diluted in EM to achieve its final concentration. We performed a dose–response analysis on HC regeneration (supplemental Fig. S1, available at www.jneurosci.org as supplemental material) and established that optimal results were yielded using higher concentrations of DAPT (Geling et al., 2002). All DAPT results reported here were obtained with 50 μm DAPT, with 0.5% DMSO in EM serving as vehicle control unless otherwise noted. After neomycin or mock treatment for 1 h, larvae were rinsed in fresh EM and immediately transferred into the 50 μm DAPT solution or the 0.5% DMSO solution.
For BrdU pulse-fix studies, animals were removed from the DAPT or DMSO-alone solutions, rinsed, and placed in the 10 mm BrdU solution for 1 h before anesthesia and fixation. For continuous BrdU incorporation experiments, larvae were incubated in a solution containing 10 mm BrdU and 1% DMSO in EM, with or without 50 μm DAPT.
Imaging and data analysis.
Labeled HCs and SCs were counted under epifluorescent illumination using a 40× objective on a Zeiss (Thornwood, NY) Axioplan 2 microscope. Samples stained by in situ hybridization were observed under bright-field illumination on the same system. Bright-field images were taken with the SlideBook application (SciTech, Preston, Australia) and processed with Adobe Photoshop 7.0 (Adobe Systems, San Jose, CA) to adjust brightness, contrast, and color balance on the whole image. Confocal images were taken on a Zeiss LSM 5 Pascal confocal microscope (two-color) and an Olympus Optical (Tokyo, Japan) FV-1000 confocal microscope with Kalman averaging (three-color). Images were processed using the Pascal or Olympus software, ImageJ, and Adobe Photoshop 7.0.
Cell counts were performed and recorded for neuromasts of the otic (O1 and O2), infraorbital (IO4), mandibular (M2), middle (MI1, MI2), and opercular (OP1) lateral lines around the head where indicated (Raible and Kruse, 2000). Neuromasts from 4 to 10 fish were counted for each condition. Data were graphed in Microsoft (Redmond, WA) Excel as either average cell numbers per neuromast per fish, or normalized to the control for each specific neuromast and graphed as percentages. Where appropriate, t tests and ANOVA (one- and two-way) were used to calculate significance (α = 0.05).
Results
Lateral line hair cell regeneration after neomycin-induced death
To visualize and image all cells within the neuromasts, we used the H2AZ-GFP transgenic zebrafish (Pauls et al., 2001) that expresses GFP in all cell nuclei. Mature HCs were stained with FM1–43FX, the fixable version of FM1–43, which enters mature HCs through mechanotransduction-dependent activity (Seiler and Nicolson, 1999; Gale et al., 2001; Meyers et al., 2003; Santos et al., 2006). Neuromasts in control larvae at 5 dpf exhibited organized, centrally clustered HCs (Fig. 1A). We treated 5 dpf zebrafish larvae with 400 μm neomycin for 1 h to kill mature HCs (Fig. 1B). After rinsing with fresh medium, the fish were allowed to recover before staining with FM1–43FX. New HCs were observed centrally within the neuromast by 24 h (Fig. 1C) and increased in numbers by 48 h (Fig. 1D) (Harris et al., 2003).
Figure 1.
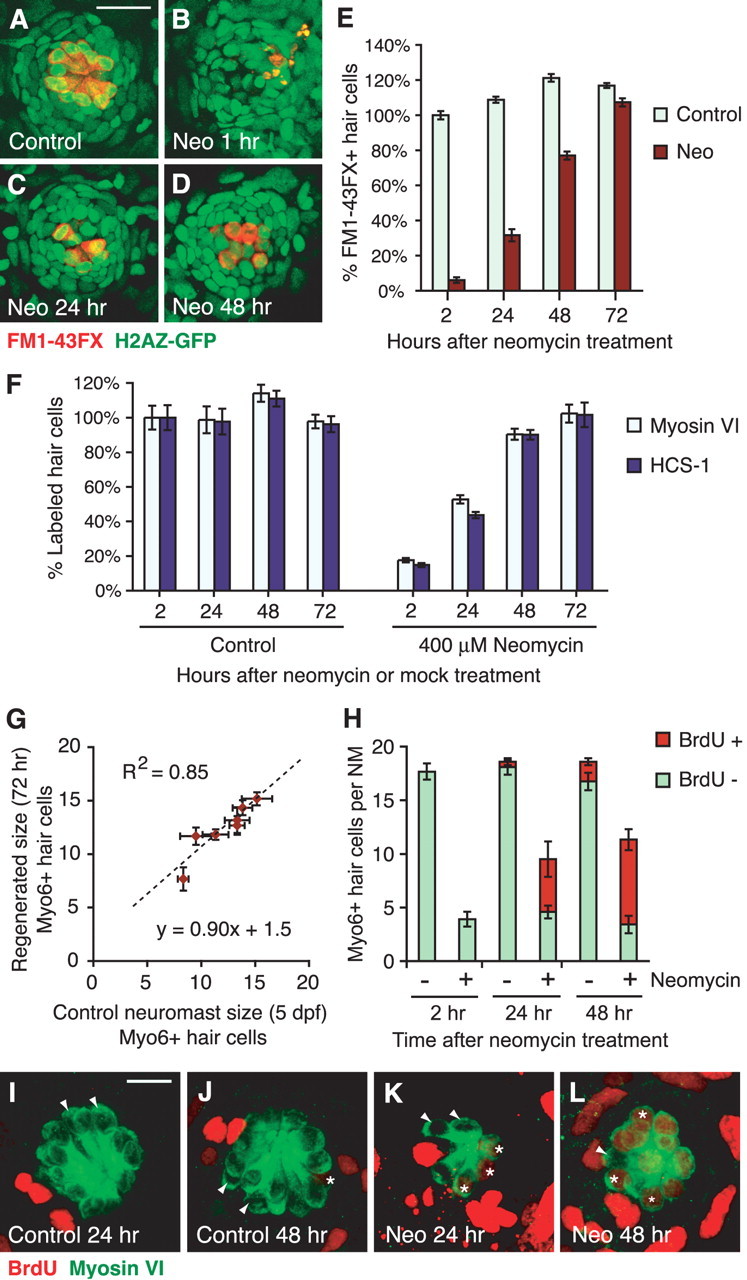
Hair cell regeneration in the zebrafish lateral line after neomycin-induced death. A–D, Confocal maximum projections of representative neuromasts of H2AZ-GFP transgenic zebrafish. GFP (green) was expressed in all nuclei, whereas mature HCs were labeled with FM1–43FX (red). Scale bar, 20 μm. Larvae 5 dpf (A) were treated with 400 μm neomycin (Neo) for 1 h (B) to kill HCs, rinsed, and left to recover. New HCs were observed at 24 h (C) and increased in number by 48 h (D). E, Graph of HC regeneration as seen with FM1–43FX. Results are graphed as mean percentages of HCs (± 1 SEM) normalized to the control at 5 dpf. n = 6 fish per condition, 7 neuromasts per fish; p < 0.001 (ANOVA). F, Graph of HC regeneration assayed with myosin VI and HCS-1 antibodies. Fish were concurrently labeled and counted for both HC markers. Results are normalized to 5 dpf controls for each neuromast for the specific marker. Error bars represent ±1 SEM (n = 6 fish per condition, 7 neuromasts per fish). G, Number of regenerated HCs correlates with the original size of the neuromast. Mean HC numbers (±1 SEM) for seven neuromasts, as labeled with myosin-VI, at 72 h after neomycin exposure are plotted relative to the 5 dpf control siblings. The line of best fit and correlation coefficient was calculated and drawn. H–L, New HCs mainly originate from proliferative progenitors. Continuous exposure to BrdU after neomycin exposure was used to label all proliferating cells and their progeny. Fish were colabeled for both BrdU (red) and myosin-VI (green) (I–L). H, Stacked graph of mean (±1 SEM) myosin-VI-labeled HCs per neuromast either colabeled with BrdU (red) or BrdU-negative (green). n = 4 fish per condition, 3 neuromasts per fish. I–L, Confocal maximum projections of representative neuromasts continuously exposed to BrdU, collected at 24 and 48 h after initial neomycin exposure. BrdU-positive (asterisks) and BrdU-negative (arrowheads) HCs were observed. Scale bar, 10 μm.
To quantify changes in HC numbers, seven identified neuromasts of six fish were counted per condition and time. Data were normalized to 5 dpf controls for each neuromast to compensate for size differences, averaged, and graphed in Figure 1E. Actual mean HC numbers are listed in supplemental Table S1 (available at www.jneurosci.org as supplemental material). After neomycin treatment (2 h), only one or two HCs remained per neuromast (supplemental Table S1, available at www.jneurosci.org as supplemental material), representing 6% of the initial HCs in 5 dpf controls (Fig. 1E). These persisting HCs were likely immature HCs resistant to neomycin (Harris et al., 2003; Murakami et al., 2003; Santos et al., 2006). Regeneration of lateral line HCs was rapid, with one-third of the initial HC population renewed by 24 h, and almost 80% renewal by 48 h after neomycin treatment (Fig. 1E). Complete regeneration of the initial 5 dpf HC population was observed by 72 h, although there were still slightly fewer HCs than their respective 72 h control siblings (Fig. 1E). In mock-treated controls, a small increase in FM1–43FX hair cells was observed in the first 48 h, probably because of the developmental addition or maturation of HCs as the fish ages. Analysis of these data with two-way ANOVA revealed significant main effects of time and treatment (control vs neomycin exposure) and a significant interaction effect (p < 0.001).
We also assessed regeneration with the antibody-based HC markers myosin-VI (Hasson and Mooseker, 1994; Hasson et al., 1997; Coffin et al., 2007) and HCS-1 (Gale et al., 2000; Lopez-Schier and Hudspeth, 2006). Hair cells were concurrently immunostained and counted for both markers. Data were normalized and graphed in Figure 1F, with mean HC numbers listed in supplemental Table S2 (available at www.jneurosci.org as supplemental material). Control animals showed similar HC numbers within the neuromasts for both myosin-VI and HCS-1, with one or two fewer cells consistently observed with HCS-1 (supplemental Table S2, available at www.jneurosci.org as supplemental material). These HC numbers were also comparable with those identified by FM1–43FX vital dye labeling (compare supplemental Tables S1 and S2, available at www.jneurosci.org as supplemental material). A higher percentage of HCs labeled with myosin-VI (15%) and HCS-1 (18%) persisted after neomycin treatment compared with those labeled with FM1–43FX (6%) (Fig. 1E,F). One explanation for this difference is that myosin-VI and HCS-1 are expressed in young HCs before they are able to take up FM1–43FX; hence, more labeled immature HCs persist after neomycin treatment. This idea is consistent with the more rapid rate of regeneration observed with these antibodies. By 24 h, ∼53% myosin-VI-labeled HCs had regenerated, whereas HCS-1 showed HC renewal at 44% (Fig. 1F). By 48 h, both markers showed near complete regeneration (90%) with full renewal by 72 h (Fig. 1F).
The number of HCs restored by regeneration correlates with the initial size of the neuromast before neomycin treatment. Different identified neuromasts vary in HC number, ranging from a mean of 8.33 HCs in the IO4 neuromast to 15.17 HCs in the OP1 neuromast as seen with myosin-VI at 5 dpf (supplemental Table S2, available at www.jneurosci.org as supplemental material). When HCs regenerate, initially larger neuromasts generate more cells than smaller neuromasts (Fig. 1G). This observation suggests that mechanisms persist in the epithelium following loss of HCs to regulate the number of regenerating HCs. Where this information lies continues to be a mystery.
New hair cells primarily arise from proliferating cells
To study the origin of the regenerated HCs, we continuously incubated larvae in 10 mm BrdU for extended times under control conditions or after neomycin treatment. This method would incorporate BrdU into all dividing cells, and the BrdU label would persist in the progeny. Subsequent immunohistochemistry with myosin-VI and BrdU antibodies were performed to detect both HCs and the BrdU. Myosin-VI-positive HCs were analyzed for BrdU colabeling and counted from confocal stacks of three neuromasts (MI1, O1, and OP1) in four fish per time and condition. Figure 1H shows average HC numbers per neuromast, where the two colors depict BrdU labeling, and the bar heights represent the total number of HCs present.
BrdU labeling of mock-treated control animals suggests that there is a slow mitotic addition of new HCs in larvae under normal conditions (Fig. 1H). Initially, HCs in control larvae were not labeled with BrdU. After 23 h of continuous BrdU incorporation (24 h time point), an occasional BrdU-positive HC was sometimes observed (Fig. 1H,I), whereas by 48 h, approximately two HCs per neuromast were labeled with BrdU (Fig. 1H,J). The addition of new HCs to neuromasts might represent the final stages of neuromast maturation. However, because we do not see an increase in overall HC number over the time of the experiment, we hypothesize that BrdU-positive HCs represent continuous mitotic HC replacement, a process that occurs in sensory epithelia of several species, including zebrafish neuromasts (Corwin, 1985; Weisleder and Rubel, 1993; Williams and Holder, 2000).
During regeneration, most replacement HCs are generated from proliferative cells that have incorporated BrdU (Fig. 1H,K,L). At 24 h after neomycin treatment, approximately half of the HCs present in the neuromast were colabeled with BrdU (Fig. 1H). By 48 h, BrdU-labeled HCs had increased to 70% of the total number of HCs (Fig. 1H). In addition, we also observed approximately three to five HCs in the regenerating neuromasts that had not incorporated BrdU at 2, 24, and 48 h after neomycin exposure, with no significant change over time (ANOVA; p > 0.5). These cells likely represent immature HCs not killed by neomycin (Murakami et al., 2003; Santos et al., 2006), as well as new HCs added from postmitotic HC precursors at later times. Because the contribution of BrdU-negative cells to the regeneration response is small, direct phenotypic conversion of SCs to HCs is unlikely occurring in the zebrafish lateral line; however, the possibility cannot be ruled out completely.
Support cell proliferation increases during regeneration
Because new HCs are generated primarily from mitotic events, we characterized SC proliferation and analyzed its timing during HC regeneration. Previous work had shown an increase in BrdU-labeled cells at 12 h after neomycin damage with a subsequent decrease by 24 h (Harris et al., 2003). Thus, we decided to focus on the time between 12 and 24 h to detail the pattern of proliferation. We exposed larvae to 10 mm BrdU to label S-phase cells for 1 h before collecting and fixing every 3 h as schematized in Figure 2A. BrdU-positive cells were counted and averaged in seven neuromasts for each of 10 fish per time and condition. The mean number of cells per neuromast is graphed in Figure 2B.
Figure 2.
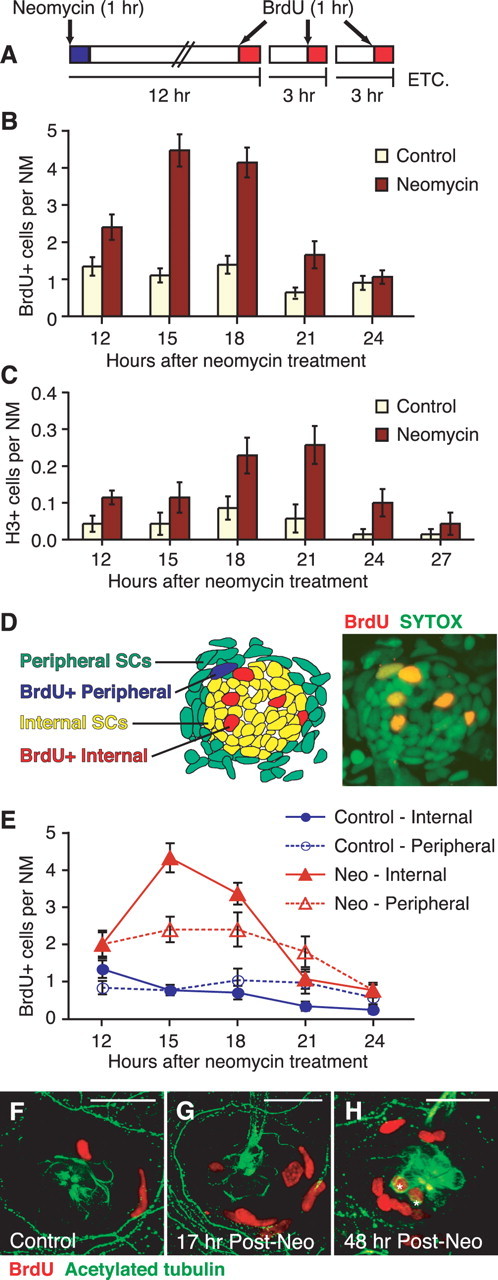
Support cell proliferation temporarily increases after neomycin exposure. A, Experimental protocol for BrdU pulse-fix time course. Larvae were pulsed with 10 mm BrdU for 1 h before fixing. B, C, Time course graphs of SC proliferation showing neuromast cells in S-phase (B) as assayed with BrdU pulse fix, and M-phase (C) as seen with anti-phosphohistone (H3) antibody labeling. A significant transient increase in proliferation occurring after neomycin exposure was seen with both proliferation markers (ANOVA; p < 0.001). Error bars represent ±1 SEM (n = 10 fish per condition; 7 neuromasts per fish). D, Schematic showing the internal (yellow) and peripheral (green) SC subpopulations within a representative neuromast. The schematic was drawn from the confocal image on the right, a neuromast labeled with 1 h of BrdU (red) at 15 h after neomycin treatment and counterstained with SYTOX (green). E, BrdU pulse-fix time course graph of SC proliferation after mock (blue, circle) or neomycin (red, triangle) treatment, subdivided as internal (solid lines, solid shape) or peripheral (dotted lines, open shape) based on neuromast cell position. Error bars represent ±1 SEM (n = 10 fish per condition; 3 neuromasts per fish). F–H, Confocal maximum projections of representative neuromasts at 17 h after mock treatment (F) or neomycin exposure (Post-Neo) (G) incubated with BrdU (1 h) before fixing. A subset of the neomycin-treated BrdU-pulsed fish were then rinsed and left to recover in fresh EM for an additional 31 h (48 h time point) (H). Immunohistochemistry was performed for both BrdU (red) and acetylated tubulin (green), another HC marker. BrdU label was present in a subset of HCs (asterisks) after additional recovery (H), indicating that these new HCs were generated from proliferating SCs at 17 h after neomycin exposure. Scale bar, 20 μm.
Control sibling larvae exhibited a low level of BrdU-positive cells over time (Fig. 2B), consistent with both the slow addition of HCs because of growth of the neuromasts and possible normal turnover of HCs. After neomycin exposure, a significant increase in BrdU-labeled SCs is observed between 12 and 21 h after initial treatment (ANOVA; p < 0.001) (Fig. 2B). An elevated number of proliferating SCs was observed at 12 h, which further increased and peaked at 15–18 h, followed by a decrease by 21 h. By 24 h after neomycin treatment, the number of SCs in S-phase had returned to control levels.
To evaluate cells in M-phase, larvae from control or neomycin-treated groups were collected between 12 and 27 h after treatment and immunostained with the phosphohistone (H3) antibody. Results are graphed in Figure 2C. Cells labeled with H3 were rare in both groups, with only an occasional labeled cell observed per neuromast (Fig. 2C). However, a significant increase was observed in H3-labeled SCs at ∼18–21 h after neomycin exposure (ANOVA; p < 0.001). These data suggest that cells enter M-phase between 3 and 6 h after S-phase and confirm the transient increase of SC proliferation that occurs after neomycin-induced HC death.
Two separate subpopulations of support cells exist within the neuromast
We next sought to determine whether SCs in different positions within the neuromast had altered rates of proliferation. With the aid of the SYTOX nuclear counterstain, BrdU-positive cells in three neuromasts (MI1, O1, and OP1) were subdivided as either internal or peripheral SCs based on their position within the neuromast (Fig. 2D) (Jones and Corwin, 1993; Williams and Holder, 2000). Internal SCs are centrally located within the neuromast, whereas peripheral SCs lie along the periphery. We designated the peripheral SC subpopulation to include the outermost layer of cells of the neuromast, as well as ∼2–3 cell layers past the neuromast border, where many BrdU-positive cells were often observed during regeneration (Fig. 2D). The majority of the BrdU-labeled peripheral SCs also exhibited elongated nuclei, a characteristic not observed with the internal SCs (Fig. 2D,F,G). Cell counts were averaged and graphed in Figure 2E.
Interestingly, analysis of the two subpopulations revealed different temporal patterns of proliferation after neomycin exposure, although only slight variations were observed under control conditions. In mock-treated control siblings, the internal BrdU-positive cells revealed a small but reliable decrease over time (ANOVA; p < 0.001), whereas no significant change is observed in peripheral SC proliferation (ANOVA; p > 0.5) (Fig. 2E). Two-way ANOVA analysis showed no statistical significance between these two SC subpopulations in control animals (p > 0.1).
After neomycin-induced HC death, increases in proliferation were observed in both internal and peripheral SCs starting at 12 h after neomycin exposure (Fig. 2E). A strong peak at 15 h was observed in the BrdU-labeled internal SCs followed by a decrease by 21–24 h back to control levels. Peripheral SC proliferation also increased, although more variation in numbers of BrdU-positive cells was observed. This increase remained elevated over 12–21 h and decreased to control levels by 24 h (Fig. 2E). Based on two-way ANOVA, a main effect of time (p < 0.001) and subpopulation (p < 0.05) was found to be significant. More importantly, the interaction effect between SC subpopulation proliferation and time was also significant (p < 0.01), indicating that the internal and peripheral subpopulations of SCs possess distinct proliferation patterns, suggesting possibly that they may have separate functions.
Support cell proliferation gives rise to new hair cells
Because we determined that the majority of new HCs were mitotically generated, we wanted to verify that the transient increase in SC proliferation before 24 h was responsible for the generation of new replacement HCs seen at 48 h after neomycin treatment. We labeled cells with 10 mm BrdU for 1 h at 16 h after neomycin exposure during the peak of SC proliferation (Fig. 2B,E). The BrdU was washed out, and the fish were left to recover for an additional 31 h (48 h after neomycin exposure). Larvae were collected and fixed both immediately after the 1 h BrdU pulse (Fig. 2F,G) and after recovery at 48 h after neomycin treatment (Fig. 2H). Samples were immunostained for acetylated tubulin in addition to BrdU to label HCs and the neuromast border (Raible and Kruse, 2000).
Figure 2, F and G, shows neuromasts of control and neomycin-treated larvae fixed immediately after the 1 h BrdU pulse. An increased number of BrdU-labeled SCs, internal and peripheral, were present at 17 h after neomycin exposure (Fig. 2G) compared with the control (Fig. 2F). After 31 h of recovery, the BrdU label was detected in a subset of HCs as seen in Figure 2H. These data are consistent with the pulse-chase experiment performed by Harris et al. (2003) and verify that new HCs arise from the transient increase in SC proliferation.
notch3, deltaA, and atoh1a expression are elevated during regeneration
During lateral line and inner ear development, Notch signaling through lateral inhibition blocks HC specification by inhibiting expression of atonal homologs (Lanford et al., 1999), basic helix-loop-helix transcription factors necessary for HC differentiation (Bermingham et al., 1999; Zheng and Gao, 2000; Chen et al., 2002). Notch signaling has also been suggested to regulate proliferation of precursor cells in the developing mammalian inner ear (Kiernan et al., 2005; Takebayashi et al., 2007), and Notch signaling components had been observed to be upregulated during regeneration in avian auditory and vestibular epithelia (Stone and Rubel, 1999).
We performed whole-mount RNA in situ hybridization to evaluate the expression of notch3, deltaA, and atoh1a during regeneration at 12, 16, 24, and 48 h after neomycin treatment along with their sibling mock-treated control fish. These notch signaling components are expressed in developing neuromasts and are known to correlate with selection of HC fate (Itoh and Chitnis, 2001; Millimaki et al., 2007). Developing lateral line HCs also express the notch ligands deltaB and deltaC, which we did not investigate in this study (Smithers et al., 2000; Itoh and Chitnis, 2001).
Lateral line HC precursors express atoh1a before differentiation (Itoh and Chitnis, 2001). In the mock-treated controls at 5 dpf (Control 12 h), atoh1a was expressed centrally within the neuromasts (Fig. 3A). By 7 dpf (Control 48 h), atoh1a expression had decreased to lower levels (Fig. 3B). Because HCs are continuously replaced thereafter in neuromasts, the presence of a few atoh1a-positive HC precursors is expected. The higher atoh1a expression at 5 dpf is most likely caused by developmental HC addition and maturation still occurring at that age (Fig. 1E). After neomycin treatment, atoh1a expression was highly upregulated within the first 24 h (Fig. 3C–E). This observation is consistent with the generation of new HC precursors to replace the lost HCs (Fig. 3C–E). By 48 h, atoh1a expression had decreased to control levels (Fig. 3B,F).
Figure 3.
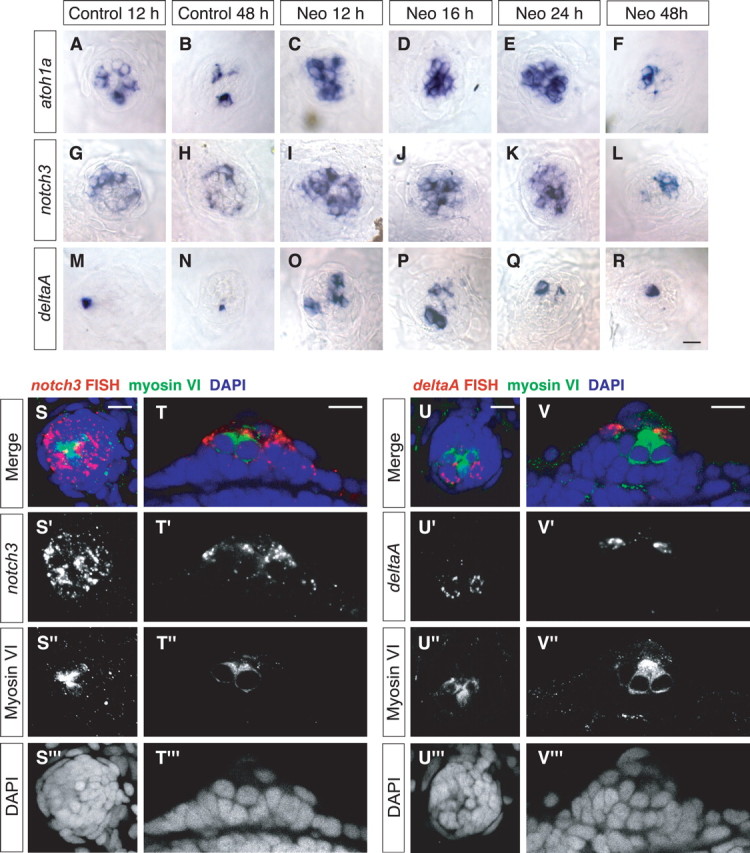
Expression of atoh1a, notch3, and deltaA are elevated in neuromasts during HC regeneration. Whole-mount RNA in situ hybridizations were performed to assess atoh1a (A–F), notch3 (G–L), and deltaA (M, N) expression within regenerating neuromasts. A–R, Bright-field images of representative O1 neuromasts are shown. In sibling mock-treated controls, moderate levels of atoh1a (A, B) and notch3 (G, H) were observed at 5 dpf (12 h) and decreased over time. Little deltaA expression (M, N) was detected, which also decreased slightly with time. During HC regeneration, all three transcripts were upregulated between 12 and 24 h (C–E, I–K, O–Q), correlating with the peak of SC proliferation. Expression returned to control levels by 48 h (F, L, R). FISHs of notch3 (S, T) and deltaA (U, V) were performed on regenerating neuromasts 17 h after neomycin treatment to evaluate expression localization. Samples were immunostained with myosin-VI to label HCs (green) and counterstained with DAPI (blue) to visualize cell nuclei. Confocal images of a surface view projection (S, U) and an optical section (T, U) are shown for representative neuromasts. Both notch3 and deltaA were not expressed in HCs (S–V). notch3 was mainly expressed throughout the internal SCs, with little to no expression in the peripheral cells (S, T). Expression of deltaA was localized in a few cells adjacent to the HCs within the internal SC population (U, V), which we hypothesize to be HC precursors. Scale bar, 10 μm.
Expression of notch3 has been correlated with SC fate during lateral line development (Itoh and Chitnis, 2001). We observed moderate levels of notch3 in the 5 dpf controls, which often exhibited a pattern of two patches on opposite sides within the neuromast (Fig. 3G). This expression was still present by 48 h but had decreased to lower levels (Fig. 3H). After neomycin-induced HC death, notch3 transcript expression was highly elevated at 12–24 h (Fig. 3I–K). By 48 h after initial neomycin treatment, expression of notch3 had decreased to the level of the control larvae at the same age (Fig. 3L).
Changes in deltaA expression levels during regeneration correlated with the increase in SC proliferation. In mock-treated control larvae, little deltaA expression was observed in 5 dpf neuromasts (Fig. 3M). This low level decreased slightly over time with little to no deltaA observed by 48 h, at the most a single cell is labeled (Fig. 3N). After the addition of neomycin, deltaA transcripts were upregulated at 12–24 h (Fig. 3O–Q), with the highest levels observed between 12 and 16 h after treatment. This expression pattern appears to be highly correlated to the transient increase in SC proliferation that occurs during that time (Fig. 2B,D). Expression of deltaA had returned to around control levels by 48 h (Fig. 3R).
To further investigate expression localization of the Notch pathway components, we performed fluorescent in situ hybridizations for notch3 and deltaA in neomycin-treated larvae during peak SC proliferation (17 h after neomycin) (Fig. 2B,D). Hair cells were immunostained with myosin-VI, and cell nuclei were labeled with DAPI. Both notch3 and deltaA do not colocalize with myosin-VI and, hence, are not expressed in HCs (Fig. 3S–V). notch3 was mainly expressed throughout the internal SCs, with little to no expression in the peripheral cells (Fig. 3S,T). Expression of deltaA was localized in a few cells directly adjacent to the HCs within the internal SC population (Fig. 3U,V). Because deltaA is progressively restricted to cells obtaining an HC fate during lateral line development (Itoh and Chitnis, 2001), we hypothesize that these cells expressing deltaA are HC precursors.
We also investigated expression of two other receptors (notch1a, notch1b) and four ligands (deltaD, jagged1a, jagged1b, jagged2), some of which are expressed in the developing zebrafish ear, but which expression in neuromasts have not been reported (Haddon et al., 1998a; Zecchin et al., 2005). The three jagged ligand genes, jagged1a, jagged1b, and jagged2, were not expressed in neuromasts 5–7 dpf both with and without neomycin exposure (data not shown). No expression of notch1a, notch1b, and deltaD was observed in neuromasts of 5 dpf larvae under control conditions (supplemental Fig. S2A,F,K, available at www.jneurosci.org as supplemental material). However, all three transcripts were upregulated at 12–16 h after neomycin treatment (supplemental Fig. S2B,C,G,H,L,M, available at www.jneurosci.org as supplemental material). Expression decreased by 24 h. Little notch1a expression was observed, and notch1b was nearly undetectable (supplemental Fig. S2D,I, available at www.jneurosci.org as supplemental material). Expression of deltaD had decreased to low levels and was still present in a cell or two (supplemental Fig. S2N, available at www.jneurosci.org as supplemental material). By 48 h, no expression was observed with all three transcripts (supplemental Fig. S2E,J,O, available at www.jneurosci.org as supplemental material), same as the control (supplemental Fig. S2A,F,K, available at www.jneurosci.org as supplemental material).
Notch inhibition results in excess regenerated hair cells
To evaluate the role of Notch signaling in zebrafish HC regeneration, we used the γ-secretase inhibitor DAPT to block the Notch pathway. DAPT prevents Notch receptor cleavage and subsequent nuclear translocation of the Notch intracellular domain to inhibit downstream signaling (Geling et al., 2002). Zebrafish larvae were incubated in 50 μm DAPT or 0.5% DMSO, its vehicle control, in EM for various times after neomycin or mock treatment. Larvae were then labeled with FM1–43FX to observe any effects on mature HC numbers. Percentages normalized to the 24 h 0.5% DMSO vehicle control were calculated and graphed in Figure 4A. Average HC numbers are reported in supplemental Table S3 (available at www.jneurosci.org as supplemental material).
Figure 4.
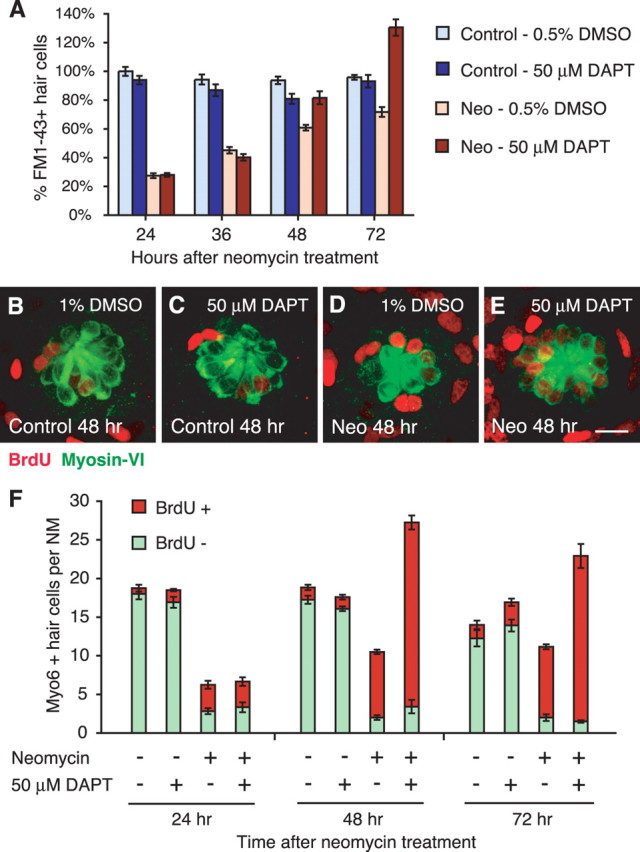
Notch inhibition results in excess regenerated hair cells. A, Graph of HC regeneration after 400 μm neomycin (Neo) exposure as seen with FM1–43FX in larvae with 50 μm DAPT incubation, a Notch inhibitor, or 0.5% DMSO vehicle control. Results are graphed as mean percentages of HCs (±1 SEM) normalized to the control at 5 dpf (n = 8 fish per condition; 6 neuromasts per fish). B–E, Confocal maximum projections of representative neuromasts under continuous BrdU incorporation for 48 h, with and without 50 μm DAPT. Hair cells were labeled with myosin-VI (green), and BrdU-labeled cells are red. Scale bar, 10 μm. F, Stacked graph of average myosin-VI-labeled HCs per neuromast either colabeled with BrdU (red) or are BrdU-negative (green). Excess HCs with 50 μm DAPT incubation all contained the BrdU label, indicating mitotic origin. Error bars represent ±1 SEM (n = 4 fish per condition; 3 neuromasts per fish).
In mock-treated control fish not exposed to neomycin, a slight decrease was observed in HC numbers after treatment with DAPT (ANOVA; p < 0.01) (Fig. 4A). After neomycin treatment, an increase in the number of mature regenerated HCs was observed at 48 h with DAPT incubation. This increase was magnified by 72 h, with HC numbers significantly exceeding that of the vehicle-treated controls (ANOVA; p < 0.001) (Fig. 4A). Interestingly, this DAPT effect on HC regeneration is also dose dependent (supplemental Fig. S1, Table S4, available at www.jneurosci.org as supplemental material). Increases in myosin-VI-positive HCs were observed at 48 h, with as little as 1 μm DAPT (p < 0.01), and increased with higher concentrations (ANOVA; p < 0.001).
We continuously incubated larvae in BrdU in the presence of 50 μm DAPT after neomycin treatment. Larvae were then immunostained for both BrdU and myosin-VI (Fig. 4B–E). Average myosin-VI-positive HC counts for three neuromasts (MI1, M2, and OP1) in four fish per time and condition are graphed in Figure 4F. In mock-treated controls, no significant differences in HC numbers were seen with the presence of DAPT compared with the vehicle control for both BrdU-positive (ANOVA; p > 0.05) and BrdU-negative (ANOVA; p > 0.1) HCs (Fig. 4B,C,F).
With neomycin exposure, differences in BrdU-labeled HC numbers between DAPT- and DMSO-treated fish were not significant at 24 h (p > 0.1) (Fig. 4D). However, by 48 h with DAPT, the number of BrdU-positive HCs had increased to more than twice that of its respective vehicle control (p < 0.001) (Fig. 4D–F). Because myosin-VI expression is an earlier marker of HC regeneration than FM1–43FX uptake (Fig. 1E), larger numbers of excess myosin-VI-positive HCs were observed at 48 h compared with those found with FM1–43FX (Fig. 4A,F). The excess BrdU-positive HCs slightly decreased by 72 h, but levels are still significantly elevated over the vehicle control (p < 0.01) (Fig. 4F). No difference in BrdU-negative HC numbers was observed between DAPT and DMSO treatment groups (ANOVA; p > 0.1) (Fig. 4F). The ratio of BrdU-labeled HCs to unlabeled HCs after neomycin and DAPT treatment is 6.98 compared with 4.25 with neomycin alone at 48 h regeneration. From these data, we conclude that Notch inhibition by DAPT results in excess mitotic production of replacement HCs only after previous HC damage.
Notch inhibition with DAPT increases deltaA expression during regeneration
Experiments in the zebrafish mind bomb (mib) mutant have shown that when Notch-mediated signaling is inhibited during development, an overproduction of HCs occurs at the expense of SCs in both the lateral line and inner ear (Haddon et al., 1998a, 1999; Itoh and Chitnis, 2001; Itoh et al., 2003). Expression of deltaA, deltaB, and atoh1a are all upregulated in the developing lateral line of mib mutant embryos, correlating with the increase in production of HCs (Itoh and Chitnis, 2001). We therefore tested whether the expression of deltaA, which is transiently upregulated after neomycin treatment (Fig. 3G–R), is altered by DAPT treatment (supplemental Fig. S3, available at www.jneurosci.org as supplemental material). Larvae with undamaged HCs showed little deltaA expression at all times examined with or without DAPT incubation (supplemental Fig. S3A–C,G–I, available at www.jneurosci.org as supplemental material). When HCs were killed with neomycin, neuromasts treated with DMSO vehicle control exhibited the same pattern as seen previously (Fig. 3P–R), where deltaA expression was upregulated at 16 h, decreased slightly by 24 h, and then returned to the baseline levels by 48 h (supplemental Fig. S3D–F, available at www.jneurosci.org as supplemental material). After DAPT treatment, deltaA expression followed the same pattern of increased and then decreased expression (supplemental Fig. S3J–L, available at www.jneurosci.org as supplemental material). However, deltaA was expressed in many more cells overall with DAPT treatment than after neomycin alone. This pattern of expression corresponds to the increased deltaA expression observed during the initial development of neuromasts when Notch signaling is disrupted in mib mutants. Thus, we conclude that 50 μm DAPT inhibits the Notch pathway during HC regeneration in a similar manner.
Support cell subpopulations differentially respond under Notch inhibition
Because inhibition of Notch signaling increases mitotically generated HCs, we evaluated SC proliferation under the influence of DAPT. After neomycin treatment, larvae were incubated in 50 μm DAPT or 0.5% DMSO solutions and collected every 4 h between 12 and 36 h after a 1 h BrdU pulse just before fixation. BrdU-labeled cells in seven neuromasts were counted in 10 fish per time and condition. Results are graphed in Figure 5A.
Figure 5.
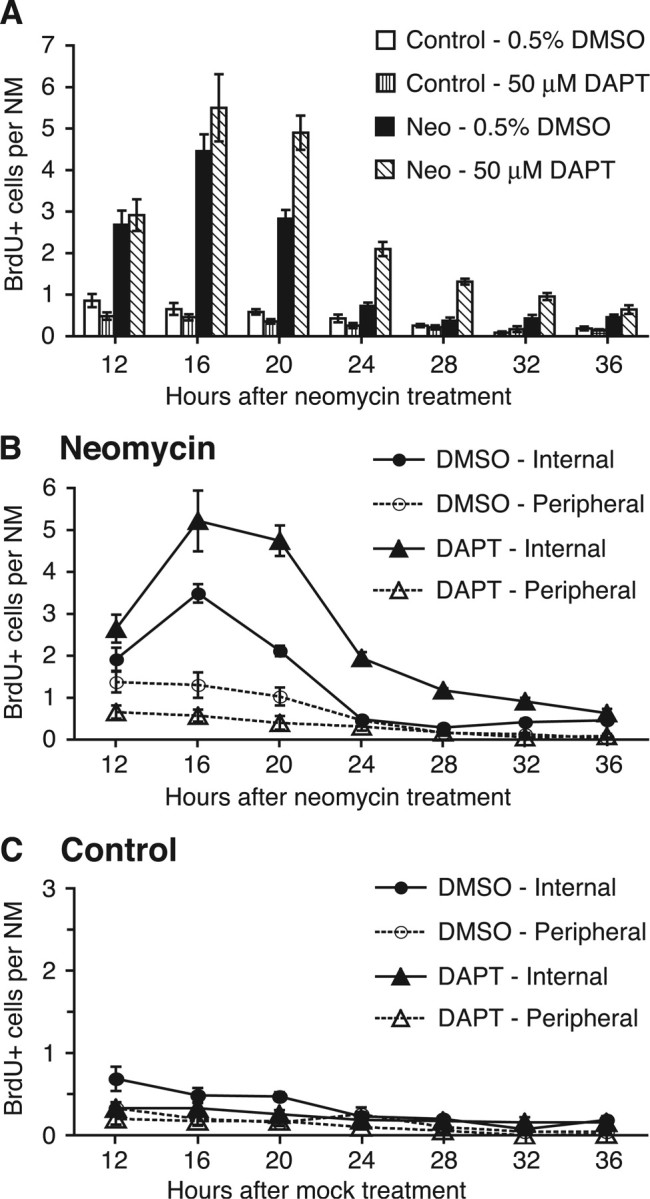
Proliferation of support cell subpopulations is differentially affected by Notch inhibition. A, BrdU pulse-fix time course graph of SC proliferation in control and regenerating neuromasts with 50 μm DAPT or 0.5% DMSO vehicle incubation. B, BrdU pulse-fix time course graph after 400 μm neomycin treatment with 50 μm DAPT (triangle) or 0.5% DMSO (circle) vehicle incubation. BrdU-labeled SCs were subdivided as internal (solid lines, solid shape) or peripheral (dotted lines, open shape) based on neuromast cell position. DAPT incubation increased the number and duration of internal SC proliferation, whereas peripheral cells decreased in proliferation. C, BrdU pulse-fix time course graph of mock-treated control siblings with 50 μm DAPT (triangle) or 0.5% DMSO (circle) vehicle incubation. Both internal (solid lines, solid shape) and peripheral (dotted lines, open shape) SC proliferation decreased with DAPT incubation compared with the vehicle control, but effects were difficult to interpret because of the small numbers of BrdU-positive cells observed. Error bars represent ±1 SEM (n = 10 fish per condition, 7 neuromasts per fish for all 3 graphs) (A–C).
In the mock-treated controls, SC proliferation was at a low level overall for both DMSO- and DAPT-treated larvae, with only an occasional labeled cell or two observed per neuromast (Fig. 5A). Cell counts of BrdU-labeled SCs were slightly decreased with DAPT treatment compared with its DMSO vehicle control (ANOVA; p < 0.001) (Fig. 5A). After neomycin treatment, incubation with DAPT significantly increased overall numbers of BrdU-labeled SCs over the vehicle control levels, starting at 16 h and continued through 32 h after neomycin treatment (ANOVA; p < 0.001) (Fig. 5A).
BrdU-labeled SCs were also scored for neuromast position to differentiate and analyze the effect of DAPT on the internal and peripheral SC subpopulations. Data are graphed in Figure 5, B and C, for neomycin-treated larvae and mock-treated controls, respectively. In neomycin-treated fish (Fig. 5B), under DMSO vehicle control conditions, internal SC proliferation peaked at 16 h after neomycin treatment, decreased by 24 h, and remained at low levels throughout the remaining time points. Peripheral BrdU-positive SC numbers were lower than that of the internal SCs, and decreased slowly over time (Fig. 5B). These data are consistent with the previous BrdU pulse-fix time course experiment in Figure 2E.
When treated with DAPT, significant differences were observed in both the internal and peripheral SC subpopulations compared with the vehicle control (Fig. 5B). BrdU-labeled internal SC numbers were highly elevated with DAPT incubation, with an extended peak observed between 16 and 20 h after neomycin treatment. The duration of this increase was also prolonged, with a decrease at 24 h and reaching vehicle control levels by 36 h. Conversely, peripheral SCs decreased in proliferation after DAPT incubation and gradually decreased over time (Fig. 5B). Two-way ANOVA testing between the DMSO and DAPT treatment groups for both SC subpopulations revealed significant main effects of time (p < 0.001) and treatment (p < 0.001). Interactions between treatment group and time were also significant for both internal (p < 0.001) and peripheral (p < 0.01) SCs, indicating that DAPT incubation affected the pattern of SC proliferation over time compared with that of the vehicle control.
In mock-treated control siblings not exposed to neomycin (Fig. 5C), BrdU-positive SC numbers exhibited small but reliable decreases over time under DMSO vehicle control conditions for both internal (ANOVA; p < 0.001) and peripheral (ANOVA; p < 0.01) SCs. After incubation in DAPT, a slight but significant decrease in internal SC proliferation was observed (ANOVA; p < 0.01), with a small decrease in the peripheral SCs as well (ANOVA; p < 0.05). However, numbers were small and thus difficult to interpret.
Together, these data further support the idea that the internal and peripheral SCs are two separate subpopulations with different functions. With Notch inhibition by DAPT, internal SC proliferation significantly increases, resulting in the generation of excess HCs. This observation leads us to hypothesize that the internal SCs are the proliferative HC precursors that are directly responsible for HC renewal. Peripheral SC proliferation, in contrast, decreases after Notch inhibition. Additional experiments are required to elucidate the involvement of the peripheral SC population in HC regeneration, but we hypothesize that proliferation of the peripheral SCs may be required to renew the internal SCs and/or for structural maintenance and growth of the neuromast.
Discussion
Lateral line hair cell regeneration is primarily mitotic
Hair cell regeneration in lateral line neuromasts has both similarities and differences with other systems where HC regeneration has been studied extensively. In the avian auditory epithelium [basilar papilla (BP)], both mitotic and nonmitotic regeneration occurs. After aminoglycoside exposure, underlying SCs divide to form both HCs and SCs (Lippe et al., 1991; Weisleder and Rubel, 1993; Tsue et al., 1994; Bhave et al., 1995; Stone and Rubel, 2000). Direct conversion of SCs into HCs without an intervening mitosis also contributes significantly to HC renewal (Baird et al., 1993; Adler and Raphael, 1996; Roberson et al., 1996; Roberson et al., 2004; Cafaro et al., 2007). We find that HC replacement in the larval zebrafish lateral line is primarily from proliferative progenitors. Our results are consistent with previous studies of lateral line HC regeneration. Increases in SC proliferation and retention of BrdU within HCs were reported previously by Harris et al. (2003), and proliferative HC renewal was observed in time-lapse imaging studies of HCs (Lopez-Schier and Hudspeth, 2006). Proliferative addition was also observed after laser ablation of lateral line HCs in axolotl (Jones and Corwin, 1996). We observed a small number of HCs that were not derived from dividing precursors. Notably, these cells were detected within the first 24 h after HC death and did not increase in number as new cells were added through proliferation over the following 48 h. These HCs likely include the small population of neomycin-resistant HCs (Murakami et al., 2003; Santos et al., 2006). In pulse-chase experiments, we found that the few HCs remaining after neomycin treatment were not labeled with BrdU (Fig. 2G) (Harris et al., 2003). Although these observations suggest that mature HCs do not re-enter the cell cycle, this possibility cannot be completely ruled out.
Neuromasts exposed to copper showed both mitotic and nonmitotic regeneration depending on the severity of damage (Hernandez et al., 2007). Exposure of 3 dpf larvae to 1 μm CuSO4 resulted in mostly nonmitotic renewal, although treatment with a higher concentration (10 μm) resulted in mostly proliferative replacement (Hernandez et al., 2007). There are several possibilities to explain the differences in the level of nonmitotic regeneration after low-dose copper compared with that seen after high copper or with neomycin treatment. Hernandez et al. (2007) proposed the existence of a postmitotic precursor population resistant to low levels of copper, but sensitive to high levels, and a proliferative progenitor population resistant to both doses. Following this notion, the putative postmitotic precursors would also be sensitive to neomycin. However, active mechanotransduction is thought to be a prerequisite for neomycin-induced HC death in zebrafish and other animals (Richardson et al., 1997; Seiler and Nicolson, 1999), and HCs preferentially accumulate aminoglycosides compared with SCs (Steyger et al., 2003), suggesting that only fully differentiated HCs would be sensitive. A second possibility is that postmitotic precursors are still abundant in immature neuromasts at 3 dpf (the stage at which the copper studies were performed) but primarily absent by 5 dpf (our study). Additional studies will be needed to clarify these issues.
Two subpopulations of proliferating cells have separate functions
Tissues that undergo cell turnover require a regulated source of new progenitors, which includes a dedicated population of stem cells (Weissman et al., 2001; Fuchs et al., 2004; Molofsky et al., 2004; Cotsarelis, 2006; Crosnier et al., 2006). In the nervous system, stem cells give rise to proliferating progenitors called transient amplifying cells, the progeny of which then differentiate (Alvarez-Buylla et al., 2001; Doetsch, 2003). In this study, we provide evidence for two distinct subpopulations of proliferating neuromast cells, designated as internal and peripheral SCs (Jones and Corwin, 1993; Williams and Holder, 2000). We suggest that internal SCs act as transient amplifying cells that give rise to new HCs during regeneration, whereas peripheral SCs may include a dedicated population of progenitor cells responsible for renewing the internal SC population.
In the lateral line, regeneration occurs not only to renew lost HCs but also to renew whole neuromasts after they are removed, such as after tail amputation (Stone, 1937; Jones and Corwin, 1993; Dufourcq et al., 2006). In these instances, cells bud from the edge of existing neuromasts, proliferate, coalesce, and migrate to a new location to form new neuromasts in a manner recapitulating their development. We hypothesize that peripheral SCs may be the source of these new neuromast progenitors. These progenitors likely have stem cell characteristics: the ability to self-renew and to give rise to multiple cell types. They may also share properties with interneuromast cells that generate new intercalary neuromasts through proliferative expansion (Grant et al., 2005). Additional investigation is needed to elucidate these possible functions of peripheral cells.
Notch signaling differentially regulates proliferation of support cell subpopulations
Our experiments demonstrate that during HC regeneration, treatment with the γ-secretase inhibitor DAPT results in the overproduction of HCs. DAPT treatment phenocopies mind bomb mutants, which inactivate an E3 ubiquitin ligase necessary for efficient Notch signaling (Itoh et al., 2003) and is reversed by expression of processed Notch (Geling et al., 2002). Although DAPT blocks processing of other γ-secretase targets such as ErbB4 (Sardi et al., 2006), amyloid precursor protein (Dovey et al., 2001), or sodium channel β subunit (Kim et al., 2005), the similarities in its effect on HC production after Notch loss of function leads us to conclude that DAPT is most likely affecting this pathway. Although DAPT appears to have no differential specificity to different forms of presenilin (Zhao et al., 2008), there may be other γ-secretases still functioning to modulate lateral line development after DAPT treatment. Additional studies will be needed to address these possibilities.
We also observe upregulation of Notch signaling components and atoh1 expression in neuromasts after neomycin damage, paralleling previous studies in the avian inner ear (Stone and Rubel, 1999; Cafaro et al., 2007). After aminoglycoside-induced HC damage, Delta1 is highly upregulated in proliferating cells in both the avian utricle and the BP, which later persists in the newly generated HCs but decreases in cells that did not acquire the HC fate (Stone and Rubel, 1999). Atoh1 expression is observed in cells that re-entered the cell cycle in the BP after damage shortly after their division and is confined to HCs after their differentiation (Cafaro et al., 2007). Notch1, which is normally expressed only in SCs, increases in the postmitotic pairs during regeneration (Stone and Rubel, 1999). These data suggest that some aspects of Notch regulation of HC regeneration may be conserved among species.
Notch signaling during development has been interpreted to be involved in lateral inhibition, affecting cell fate choice between HCs and SCs, in both mice (Lanford et al., 1999; Kiernan et al., 2001, 2005; Brooker et al., 2006) and zebrafish (Haddon et al., 1998a, 1999; Itoh and Chitnis, 2001; Itoh et al., 2003). Recent studies provide evidence for an additional role in regulating proliferation in inner ear development (Kiernan et al., 2005; Takebayashi et al., 2007). Although we see an increase in HCs when blocking Notch signaling after neomycin damage, we do not know whether there is a concomitant loss of SCs. Moreover, we do not know whether SCs that give rise to regenerating HCs are themselves replaced. These questions will require the development of new markers that distinguish lateral line SC types.
Model for Notch signaling in HC regeneration
Our data suggest that there are at least two signals that govern HC regeneration: a “maintenance” signal that is disrupted to initiate regeneration and a “braking” signal that promotes the return to quiescence. We hypothesize that the maintenance signal is independent of the Notch pathway, because very few cells express Notch ligands in functionally mature neuromasts, and blocking Notch signaling with DAPT does not initiate HC addition in the absence of neomycin damage. Maintenance signaling between mature HCs and internal SCs keeps cells quiescent (Fig. 6A). After HC damage, inhibition is lifted and internal SCs divide to either self-renew or form precursors that are committed to differentiate into new HCs, possibly after expression of atoh1a. We propose that deltaA expressed in the newly formed HC precursors signals to the adjacent internal SCs, which upregulate notch3 after HC death (Fig. 6A). This Delta-Notch signaling inhibits adjacent cells from proliferating, hence putting a brake on regeneration. DAPT treatment overrides that brake, resulting in increased SC division and excess HCs (Fig. 6B). We note, however, that even in the presence of DAPT, proliferation eventually ceases, suggesting that the unidentified maintenance signal is restored as HCs mature. Our model suggests that Notch signaling is one component that limits the amount of internal SC proliferation to keep HC numbers in check. This type of feedback inhibition provides a mechanism for regulating the size of regenerating neuromasts and may provide the basis for our observation that the number of regenerated HCs correlates with the number present before neomycin exposure. Additional characterization of the signals that start and stop HC regeneration may help in promoting the regeneration of hair cells in humans.
Figure 6.

Working models of HC regeneration. A, In undamaged neuromasts, local signaling between mature HCs and internal SCs keeps cells quiescent. This process is not Notch dependent, and the inhibitory signal from the mature HCs is still unknown. After neomycin-induced death, internal SCs (IS) divide and give rise to two postmitotic HC precursors (HP). These HC precursors then differentiate into two new HCs. A second signal from the HC precursors signals to the adjacent internal SCs to inhibit proliferation and limit HC production. This second inhibitory signal is via Delta-Notch, which regulates and limits the number of regenerated HCs. B, When Notch signaling is inhibited with DAPT during regeneration, an increased number of internal SCs enter the cell cycle caused by no inhibition, resulting in an overproduction of HCs.
Footnotes
This work was supported by National Institutes of Health Grants DC008743, DC005361, DC04661, and DC008973. We thank members of the Raible and Rubel laboratories for their invaluable advice and support, David White and the University of Washington fish facility staff, and the Molecular and Cellular Biology Program staff. We also thank our colleagues within the zebrafish community for generously providing us with reagents (see Materials and Methods). Finally, we thank Jennifer Stone and Olivia Bermingham-McDonough for their thoughtful comments on this manuscript.
References
- Adler HJ, Raphael Y. New hair cells arise from supporting cell conversion in the acoustically damaged chick inner ear. Neurosci Lett. 1996;205:17–20. doi: 10.1016/0304-3940(96)12367-3. [DOI] [PubMed] [Google Scholar]
- Alvarez-Buylla A, Garcia-Verdugo JM, Tramontin AD. A unified hypothesis on the lineage of neural stem cells. Nat Rev Neurosci. 2001;2:287–293. doi: 10.1038/35067582. [DOI] [PubMed] [Google Scholar]
- Baird RA, Torres MA, Schuff NR. Hair cell regeneration in the bullfrog vestibular otolith organs following aminoglycoside toxicity. Hear Res. 1993;65:164–174. doi: 10.1016/0378-5955(93)90211-i. [DOI] [PubMed] [Google Scholar]
- Baird RA, Steyger PS, Schuff NR. Mitotic and nonmitotic hair cell regeneration in the bullfrog vestibular otolith organs. Ann NY Acad Sci. 1996;781:59–70. doi: 10.1111/j.1749-6632.1996.tb15693.x. [DOI] [PubMed] [Google Scholar]
- Balak KJ, Corwin JT, Jones JE. Regenerated hair cells can originate from supporting cell progeny: evidence from phototoxicity and laser ablation experiments in the lateral line system. J Neurosci. 1990;10:2502–2512. doi: 10.1523/JNEUROSCI.10-08-02502.1990. [DOI] [PMC free article] [PubMed] [Google Scholar]
- Bermingham NA, Hassan BA, Price SD, Vollrath MA, Ben-Arie N, Eatock RA, Bellen HJ, Lysakowski A, Zoghbi HY. Math1: an essential gene for the generation of inner ear hair cells. Science. 1999;284:1837–1841. doi: 10.1126/science.284.5421.1837. [DOI] [PubMed] [Google Scholar]
- Bhave SA, Stone JS, Rubel EW, Coltrera MD. Cell cycle progression in gentamicin-damaged avian cochleas. J Neurosci. 1995;15:4618–4628. doi: 10.1523/JNEUROSCI.15-06-04618.1995. [DOI] [PMC free article] [PubMed] [Google Scholar]
- Bierkamp C, Campos-Ortega JA. A zebrafish homologue of the Drosophila neurogenic gene Notch and its pattern of transcription during early embryogenesis. Mech Dev. 1993;43:87–100. doi: 10.1016/0925-4773(93)90027-u. [DOI] [PubMed] [Google Scholar]
- Brooker R, Hozumi K, Lewis J. Notch ligands with contrasting functions: Jagged1 and Delta1 in the mouse inner ear. Development. 2006;133:1277–1286. doi: 10.1242/dev.02284. [DOI] [PubMed] [Google Scholar]
- Cafaro J, Lee GS, Stone JS. Atoh1 expression defines activated progenitors and differentiating hair cells during avian hair cell regeneration. Dev Dyn. 2007;236:156–170. doi: 10.1002/dvdy.21023. [DOI] [PubMed] [Google Scholar]
- Chen GD, Fechter LD. The relationship between noise-induced hearing loss and hair cell loss in rats. Hear Res. 2003;177:81–90. doi: 10.1016/s0378-5955(02)00802-x. [DOI] [PubMed] [Google Scholar]
- Chen P, Johnson JE, Zoghbi HY, Segil N. The role of Math1 in inner ear development: uncoupling the establishment of the sensory primordium from hair cell fate determination. Development. 2002;129:2495–2505. doi: 10.1242/dev.129.10.2495. [DOI] [PubMed] [Google Scholar]
- Coffin AB, Dabdoub A, Kelley MW, Popper AN. Myosin VI and VIIa distribution among inner ear epithelia in diverse fishes. Hear Res. 2007;224:15–26. doi: 10.1016/j.heares.2006.11.004. [DOI] [PMC free article] [PubMed] [Google Scholar]
- Corwin JT. Perpetual production of hair cells and maturational changes in hair cell ultrastructure accompany postembryonic growth in an amphibian ear. Proc Natl Acad Sci USA. 1985;82:3911–3915. doi: 10.1073/pnas.82.11.3911. [DOI] [PMC free article] [PubMed] [Google Scholar]
- Cotsarelis G. Epithelial stem cells: a folliculocentric view. J Invest Dermatol. 2006;126:1459–1468. doi: 10.1038/sj.jid.5700376. [DOI] [PubMed] [Google Scholar]
- Crosnier C, Stamataki D, Lewis J. Organizing cell renewal in the intestine: stem cells, signals and combinatorial control. Nat Rev Genet. 2006;7:349–359. doi: 10.1038/nrg1840. [DOI] [PubMed] [Google Scholar]
- Doetsch F. A niche for adult neural stem cells. Curr Opin Genet Dev. 2003;13:543–550. doi: 10.1016/j.gde.2003.08.012. [DOI] [PubMed] [Google Scholar]
- Dovey HF, John V, Anderson JP, Chen LZ, de Saint Andrieu P, Fang LY, Freedman SB, Folmer B, Goldbach E, Holsztynska EJ, Hu KL, Johnson-Wood KL, Kennedy SL, Kholodenko D, Knops JE, Latimer LH, Lee M, Liao Z, Lieberburg IM, Motter RN, et al. Functional gamma-secretase inhibitors reduce beta-amyloid peptide levels in brain. J Neurochem. 2001;76:173–181. doi: 10.1046/j.1471-4159.2001.00012.x. [DOI] [PubMed] [Google Scholar]
- Dufourcq P, Roussigne M, Blader P, Rosa F, Peyrieras N, Vriz S. Mechano-sensory organ regeneration in adults: the zebrafish lateral line as a model. Mol Cell Neurosci. 2006;33:180–187. doi: 10.1016/j.mcn.2006.07.005. [DOI] [PubMed] [Google Scholar]
- Forge A, Schacht J. Aminoglycoside antibiotics. Audiol Neurootol. 2000;5:3–22. doi: 10.1159/000013861. [DOI] [PubMed] [Google Scholar]
- Fuchs E, Tumbar T, Guasch G. Socializing with the neighbors: stem cells and their niche. Cell. 2004;116:769–778. doi: 10.1016/s0092-8674(04)00255-7. [DOI] [PubMed] [Google Scholar]
- Gale JE, Meyers JR, Corwin JT. Solitary hair cells are distributed throughout the extramacular epithelium in the bullfrog's saccule. J Assoc Res Otolaryngol. 2000;1:172–182. doi: 10.1007/s101620010037. [DOI] [PMC free article] [PubMed] [Google Scholar]
- Gale JE, Marcotti W, Kennedy HJ, Kros CJ, Richardson GP. FM1-43 dye behaves as a permeant blocker of the hair-cell mechanotransducer channel. J Neurosci. 2001;21:7013–7025. doi: 10.1523/JNEUROSCI.21-18-07013.2001. [DOI] [PMC free article] [PubMed] [Google Scholar]
- Gale JE, Meyers JR, Periasamy A, Corwin JT. Survival of bundleless hair cells and subsequent bundle replacement in the bullfrog's saccule. J Neurobiol. 2002;50:81–92. doi: 10.1002/neu.10002. [DOI] [PubMed] [Google Scholar]
- Geling A, Steiner H, Willem M, Bally-Cuif L, Haass C. A gamma-secretase inhibitor blocks Notch signaling in vivo and causes a severe neurogenic phenotype in zebrafish. EMBO Rep. 2002;3:688–694. doi: 10.1093/embo-reports/kvf124. [DOI] [PMC free article] [PubMed] [Google Scholar]
- Girod DA, Duckert LG, Rubel EW. Possible precursors of regenerated hair cells in the avian cochlea following acoustic trauma. Hear Res. 1989;42:175–194. doi: 10.1016/0378-5955(89)90143-3. [DOI] [PubMed] [Google Scholar]
- Gompel N, Cubedo N, Thisse C, Thisse B, Dambly-Chaudiere C, Ghysen A. Pattern formation in the lateral line of zebrafish. Mech Dev. 2001;105:69–77. doi: 10.1016/s0925-4773(01)00382-3. [DOI] [PubMed] [Google Scholar]
- Grant KA, Raible DW, Piotrowski T. Regulation of latent sensory hair cell precursors by glia in the zebrafish lateral line. Neuron. 2005;45:69–80. doi: 10.1016/j.neuron.2004.12.020. [DOI] [PubMed] [Google Scholar]
- Haddon C, Jiang YJ, Smithers L, Lewis J. Delta-Notch signalling and the patterning of sensory cell differentiation in the zebrafish ear: evidence from the mind bomb mutant. Development. 1998a;125:4637–4644. doi: 10.1242/dev.125.23.4637. [DOI] [PubMed] [Google Scholar]
- Haddon C, Smithers L, Schneider-Maunoury S, Coche T, Henrique D, Lewis J. Multiple delta genes and lateral inhibition in zebrafish primary neurogenesis. Development. 1998b;125:359–370. doi: 10.1242/dev.125.3.359. [DOI] [PubMed] [Google Scholar]
- Haddon C, Mowbray C, Whitfield T, Jones D, Gschmeissner S, Lewis J. Hair cells without supporting cells: further studies in the ear of the zebrafish mind bomb mutant. J Neurocytol. 1999;28:837–850. doi: 10.1023/a:1007013904913. [DOI] [PubMed] [Google Scholar]
- Harris JA, Cheng AG, Cunningham LL, MacDonald G, Raible DW, Rubel EW. Neomycin-induced hair cell death and rapid regeneration in the lateral line of zebrafish (Danio rerio) J Assoc Res Otolaryngol. 2003;4:219–234. doi: 10.1007/s10162-002-3022-x. [DOI] [PMC free article] [PubMed] [Google Scholar]
- Hashino E, Salvi RJ. Changing spatial patterns of DNA replication in the noise-damaged chick cochlea. J Cell Sci. 1993;105:23–31. doi: 10.1242/jcs.105.1.23. [DOI] [PubMed] [Google Scholar]
- Hasson T, Mooseker MS. Porcine myosin-VI: characterization of a new mammalian unconventional myosin. J Cell Biol. 1994;127:425–440. doi: 10.1083/jcb.127.2.425. [DOI] [PMC free article] [PubMed] [Google Scholar]
- Hasson T, Gillespie PG, Garcia JA, MacDonald RB, Zhao Y, Yee AG, Mooseker MS, Corey DP. Unconventional myosins in inner-ear sensory epithelia. J Cell Biol. 1997;137:1287–1307. doi: 10.1083/jcb.137.6.1287. [DOI] [PMC free article] [PubMed] [Google Scholar]
- Hernandez PP, Moreno V, Olivari FA, Allende ML. Sub-lethal concentrations of waterborne copper are toxic to lateral line neuromasts in zebrafish (Danio rerio) Hear Res. 2006;213:1–10. doi: 10.1016/j.heares.2005.10.015. [DOI] [PubMed] [Google Scholar]
- Hernandez PP, Olivari FA, Sarrazin AF, Sandoval PC, Allende ML. Regeneration in zebrafish lateral line neuromasts: expression of the neural progenitor cell marker sox2 and proliferation-dependent and -independent mechanisms of hair cell renewal. Dev Neurobiol. 2007;67:637–654. doi: 10.1002/dneu.20386. [DOI] [PubMed] [Google Scholar]
- Itoh M, Chitnis AB. Expression of proneural and neurogenic genes in the zebrafish lateral line primordium correlates with selection of hair cell fate in neuromasts. Mech Dev. 2001;102:263–266. doi: 10.1016/s0925-4773(01)00308-2. [DOI] [PubMed] [Google Scholar]
- Itoh M, Kim CH, Palardy G, Oda T, Jiang YJ, Maust D, Yeo SY, Lorick K, Wright GJ, Ariza-McNaughton L, Weissman AM, Lewis J, Chandrasekharappa SC, Chitnis AB. Mind bomb is a ubiquitin ligase that is essential for efficient activation of Notch signaling by Delta. Dev Cell. 2003;4:67–82. doi: 10.1016/s1534-5807(02)00409-4. [DOI] [PubMed] [Google Scholar]
- Jones JE, Corwin JT. Replacement of lateral line sensory organs during tail regeneration in salamanders: identification of progenitor cells and analysis of leukocyte activity. J Neurosci. 1993;13:1022–1034. doi: 10.1523/JNEUROSCI.13-03-01022.1993. [DOI] [PMC free article] [PubMed] [Google Scholar]
- Jones JE, Corwin JT. Regeneration of sensory cells after laser ablation in the lateral line system: hair cell lineage and macrophage behavior revealed by time-lapse video microscopy. J Neurosci. 1996;16:649–662. doi: 10.1523/JNEUROSCI.16-02-00649.1996. [DOI] [PMC free article] [PubMed] [Google Scholar]
- Julich D, Hwee Lim C, Round J, Nicolaije C, Schroeder J, Davies A, Geisler R, Lewis J, Jiang YJ, Holley SA. beamter/deltaC and the role of Notch ligands in the zebrafish somite segmentation, hindbrain neurogenesis and hypochord differentiation. Dev Biol. 2005;286:391–404. doi: 10.1016/j.ydbio.2005.06.040. [DOI] [PubMed] [Google Scholar]
- Kiernan AE, Ahituv N, Fuchs H, Balling R, Avraham KB, Steel KP, Hrabe de Angelis M. The Notch ligand Jagged1 is required for inner ear sensory development. Proc Natl Acad Sci USA. 2001;98:3873–3878. doi: 10.1073/pnas.071496998. [DOI] [PMC free article] [PubMed] [Google Scholar]
- Kiernan AE, Cordes R, Kopan R, Gossler A, Gridley T. The Notch ligands DLL1 and JAG2 act synergistically to regulate hair cell development in the mammalian inner ear. Development. 2005;132:4353–4362. doi: 10.1242/dev.02002. [DOI] [PubMed] [Google Scholar]
- Kim DY, Ingano LA, Carey BW, Pettingell WH, Kovacs DM. Presenilin/gamma-secretase-mediated cleavage of the voltage-gated sodium channel beta2-subunit regulates cell adhesion and migration. J Biol Chem. 2005;280:23251–23261. doi: 10.1074/jbc.M412938200. [DOI] [PubMed] [Google Scholar]
- Kortschak RD, Tamme R, Lardelli M. Evolutionary analysis of vertebrate Notch genes. Dev Genes Evol. 2001;211:350–354. doi: 10.1007/s004270100159. [DOI] [PubMed] [Google Scholar]
- Lanford PJ, Lan Y, Jiang R, Lindsell C, Weinmaster G, Gridley T, Kelley MW. Notch signalling pathway mediates hair cell development in mammalian cochlea. Nat Genet. 1999;21:289–292. doi: 10.1038/6804. [DOI] [PubMed] [Google Scholar]
- Linbo TL, Stehr CM, Incardona JP, Scholz NL. Dissolved copper triggers cell death in the peripheral mechanosensory system of larval fish. Environ Toxicol Chem. 2006;25:597–603. doi: 10.1897/05-241r.1. [DOI] [PubMed] [Google Scholar]
- Lippe WR, Westbrook EW, Ryals BM. Hair cell regeneration in the chicken cochlea following aminoglycoside toxicity. Hear Res. 1991;56:203–210. doi: 10.1016/0378-5955(91)90171-5. [DOI] [PubMed] [Google Scholar]
- Lopez-Schier H, Hudspeth AJ. A two-step mechanism underlies the planar polarization of regenerating sensory hair cells. Proc Natl Acad Sci USA. 2006;103:18615–18620. doi: 10.1073/pnas.0608536103. [DOI] [PMC free article] [PubMed] [Google Scholar]
- Matsui JI, Cotanche DA. Sensory hair cell death and regeneration: two halves of the same equation. Curr Opin Otolaryngol Head Neck Surg. 2004;12:418–425. doi: 10.1097/01.moo.0000136873.56878.56. [DOI] [PubMed] [Google Scholar]
- Metcalfe WK, Kimmel CB, Schabtach E. Anatomy of the posterior lateral line system in young larvae of the zebrafish. J Comp Neurol. 1985;233:377–389. doi: 10.1002/cne.902330307. [DOI] [PubMed] [Google Scholar]
- Meyers JR, MacDonald RB, Duggan A, Lenzi D, Standaert DG, Corwin JT, Corey DP. Lighting up the senses: FM1-43 loading of sensory cells through nonselective ion channels. J Neurosci. 2003;23:4054–4065. doi: 10.1523/JNEUROSCI.23-10-04054.2003. [DOI] [PMC free article] [PubMed] [Google Scholar]
- Millimaki BB, Sweet EM, Dhason MS, Riley BB. Zebrafish atoh1 genes: classic proneural activity in the inner ear and regulation by Fgf and Notch. Development. 2007;134:295–305. doi: 10.1242/dev.02734. [DOI] [PubMed] [Google Scholar]
- Molofsky AV, Pardal R, Morrison SJ. Diverse mechanisms regulate stem cell self-renewal. Curr Opin Cell Biol. 2004;16:700–707. doi: 10.1016/j.ceb.2004.09.004. [DOI] [PubMed] [Google Scholar]
- Montgomery J, Carton G, Voigt R, Baker C, Diebel C. Sensory processing of water currents by fishes. Philos Trans R Soc Lond B Biol Sci. 2000;355:1325–1327. doi: 10.1098/rstb.2000.0693. [DOI] [PMC free article] [PubMed] [Google Scholar]
- Murakami SL, Cunningham LL, Werner LA, Bauer E, Pujol R, Raible DW, Rubel EW. Developmental differences in susceptibility to neomycin-induced hair cell death in the lateral line neuromasts of zebrafish (Danio rerio) Hear Res. 2003;186:47–56. doi: 10.1016/s0378-5955(03)00259-4. [DOI] [PubMed] [Google Scholar]
- Nicolson T. The genetics of hearing and balance in zebrafish. Annu Rev Genet. 2005;39:9–22. doi: 10.1146/annurev.genet.39.073003.105049. [DOI] [PubMed] [Google Scholar]
- Ou HC, Raible DW, Rubel EW. Cisplatin-induced hair cell loss in zebrafish (Danio rerio) lateral line. Hear Res. 2007;233:46–53. doi: 10.1016/j.heares.2007.07.003. [DOI] [PMC free article] [PubMed] [Google Scholar]
- Owens KN, Cunningham DE, Macdonald G, Rubel EW, Raible DW, Pujol R. Ultrastructural analysis of aminoglycoside-induced hair cell death in the zebrafish lateral line reveals an early mitochondrial response. J Comp Neurol. 2007;502:522–543. doi: 10.1002/cne.21345. [DOI] [PubMed] [Google Scholar]
- Pauls S, Geldmacher-Voss B, Campos-Ortega JA. A zebrafish histone variant H2A.F/Z and a transgenic H2A.F/Z:GFP fusion protein for in vivo studies of embryonic development. Dev Genes Evol. 2001;211:603–610. doi: 10.1007/s00427-001-0196-x. [DOI] [PubMed] [Google Scholar]
- Petit C, Levilliers J, Hardelin JP. Molecular genetics of hearing loss. Annu Rev Genet. 2001;35:589–646. doi: 10.1146/annurev.genet.35.102401.091224. [DOI] [PubMed] [Google Scholar]
- Raible DW, Kruse GJ. Organization of the lateral line system in embryonic zebrafish. J Comp Neurol. 2000;421:189–198. [PubMed] [Google Scholar]
- Raphael Y. Evidence for supporting cell mitosis in response to acoustic trauma in the avian inner ear. J Neurocytol. 1992;21:663–671. doi: 10.1007/BF01191727. [DOI] [PubMed] [Google Scholar]
- Richardson GP, Forge A, Kros CJ, Fleming J, Brown SD, Steel KP. Myosin VIIA is required for aminoglycoside accumulation in cochlear hair cells. J Neurosci. 1997;17:9506–9519. doi: 10.1523/JNEUROSCI.17-24-09506.1997. [DOI] [PMC free article] [PubMed] [Google Scholar]
- Roberson DW, Rubel EW. Cell division in the gerbil cochlea after acoustic trauma. Am J Otol. 1994;15:28–34. [PubMed] [Google Scholar]
- Roberson DW, Kreig CS, Rubel EW. Light microscopic evidence that direct transdifferentiation gives rise to new hair cells in regenerating avian auditory epithelium. Aud Neurosci. 1996;2:195–205. doi: 10.1002/jnr.20271. [DOI] [PubMed] [Google Scholar]
- Roberson DW, Alosi JA, Cotanche DA. Direct transdifferentiation gives rise to the earliest new hair cells in regenerating avian auditory epithelium. J Neurosci Res. 2004;78:461–471. doi: 10.1002/jnr.20271. [DOI] [PubMed] [Google Scholar]
- Santos F, MacDonald G, Rubel EW, Raible DW. Lateral line hair cell maturation is a determinant of aminoglycoside susceptibility in zebrafish (Danio rerio) Hear Res. 2006;213:25–33. doi: 10.1016/j.heares.2005.12.009. [DOI] [PubMed] [Google Scholar]
- Sardi SP, Murtie J, Koirala S, Patten BA, Corfas G. Presenilin-dependent ErbB4 nuclear signaling regulates the timing of astrogenesis in the developing brain. Cell. 2006;127:185–197. doi: 10.1016/j.cell.2006.07.037. [DOI] [PubMed] [Google Scholar]
- Seidman MD, Ahmad N, Bai U. Molecular mechanisms of age-related hearing loss. Ageing Res Rev. 2002;1:331–343. doi: 10.1016/s1568-1637(02)00004-1. [DOI] [PubMed] [Google Scholar]
- Seiler C, Nicolson T. Defective calmodulin-dependent rapid apical endocytosis in zebrafish sensory hair cell mutants. J Neurobiol. 1999;41:424–434. [PubMed] [Google Scholar]
- Smithers L, Haddon C, Jiang YJ, Lewis J. Sequence and embryonic expression of deltaC in the zebrafish. Mech Dev. 2000;90:119–123. doi: 10.1016/s0925-4773(99)00231-2. [DOI] [PubMed] [Google Scholar]
- Song J, Yan HY, Popper AN. Damage and recovery of hair cells in fish canal (but not superficial) neuromasts after gentamicin exposure. Hear Res. 1995;91:63–71. doi: 10.1016/0378-5955(95)00170-0. [DOI] [PubMed] [Google Scholar]
- Steyger PS, Burton M, Hawkins JR, Schuff NR, Baird RA. Calbindin and parvalbumin are early markers of non-mitotically regenerating hair cells in the bullfrog vestibular otolith organs. Int J Dev Neurosci. 1997;15:417–432. doi: 10.1016/s0736-5748(96)00101-3. [DOI] [PubMed] [Google Scholar]
- Steyger PS, Peters SL, Rehling J, Hordichok A, Dai CF. Uptake of gentamicin by bullfrog saccular hair cells in vitro. J Assoc Res Otolaryngol. 2003;4:565–578. doi: 10.1007/s10162-003-4002-5. [DOI] [PMC free article] [PubMed] [Google Scholar]
- Stone JS, Cotanche DA. Identification of the timing of S phase and the patterns of cell proliferation during hair cell regeneration in the chick cochlea. J Comp Neurol. 1994;341:50–67. doi: 10.1002/cne.903410106. [DOI] [PubMed] [Google Scholar]
- Stone JS, Rubel EW. Delta1 expression during avian hair cell regeneration. Development. 1999;126:961–973. doi: 10.1242/dev.126.5.961. [DOI] [PubMed] [Google Scholar]
- Stone JS, Rubel EW. Cellular studies of auditory hair cell regeneration in birds. Proc Natl Acad Sci USA. 2000;97:11714–11721. doi: 10.1073/pnas.97.22.11714. [DOI] [PMC free article] [PubMed] [Google Scholar]
- Stone LS. Further experimental studies of the development of lateral line sense organs in amphibians observed in living preparations. J Comp Neurol. 1937;68:83–115. [Google Scholar]
- Takebayashi S, Yamamoto N, Yabe D, Fukuda H, Kojima K, Ito J, Honjo T. Multiple roles of Notch signaling in cochlear development. Dev Biol. 2007;307:165–178. doi: 10.1016/j.ydbio.2007.04.035. [DOI] [PubMed] [Google Scholar]
- Taylor RR, Forge A. Hair cell regeneration in sensory epithelia from the inner ear of a urodele amphibian. J Comp Neurol. 2005;484:105–120. doi: 10.1002/cne.20450. [DOI] [PubMed] [Google Scholar]
- Ton C, Parng C. The use of zebrafish for assessing ototoxic and otoprotective agents. Hear Res. 2005;208:79–88. doi: 10.1016/j.heares.2005.05.005. [DOI] [PubMed] [Google Scholar]
- Tsue TT, Watling DL, Weisleder P, Coltrera MD, Rubel EW. Identification of hair cell progenitors and intermitotic migration of their nuclei in the normal and regenerating avian inner ear. J Neurosci. 1994;14:140–152. doi: 10.1523/JNEUROSCI.14-01-00140.1994. [DOI] [PMC free article] [PubMed] [Google Scholar]
- Warchol ME, Matsui JI, Simkus EL, Ogilive JM. Ongoing cell death and immune influences on regeneration in the vestibular sensory organs. Ann NY Acad Sci. 2001;942:34–45. doi: 10.1111/j.1749-6632.2001.tb03733.x. [DOI] [PubMed] [Google Scholar]
- Weisleder P, Rubel EW. Hair cell regeneration after streptomycin toxicity in the avian vestibular epithelium. J Comp Neurol. 1993;331:97–110. doi: 10.1002/cne.903310106. [DOI] [PubMed] [Google Scholar]
- Weissman IL, Anderson DJ, Gage F. Stem and progenitor cells: origins, phenotypes, lineage commitments, and transdifferentiations. Annu Rev Cell Dev Biol. 2001;17:387–403. doi: 10.1146/annurev.cellbio.17.1.387. [DOI] [PubMed] [Google Scholar]
- Westerfield M. A guide for the laboratory use of zebrafish (Danio rerio) Eugene, OR: University of Oregon; 1994. The zebrafish book. [Google Scholar]
- Whitfield TT. Zebrafish as a model for hearing and deafness. J Neurobiol. 2002;53:157–171. doi: 10.1002/neu.10123. [DOI] [PubMed] [Google Scholar]
- Williams JA, Holder N. Cell turnover in neuromasts of zebrafish larvae. Hear Res. 2000;143:171–181. doi: 10.1016/s0378-5955(00)00039-3. [DOI] [PubMed] [Google Scholar]
- Zecchin E, Conigliaro A, Tiso N, Argenton F, Bortolussi M. Expression analysis of jagged genes in zebrafish embryos. Dev Dyn. 2005;233:638–645. doi: 10.1002/dvdy.20366. [DOI] [PubMed] [Google Scholar]
- Zhao B, Yu M, Neitzel M, Marugg J, Jagodzinski J, Lee M, Hu K, Schenk D, Yednock T, Basi G. Identification of gamma-secretase inhibitor potency determinants on Presenilin. J Biol Chem. 2008;283:2927–2938. doi: 10.1074/jbc.M708870200. [DOI] [PubMed] [Google Scholar]
- Zheng JL, Gao WQ. Overexpression of Math1 induces robust production of extra hair cells in postnatal rat inner ears. Nat Neurosci. 2000;3:580–586. doi: 10.1038/75753. [DOI] [PubMed] [Google Scholar]
- Zheng JL, Shou J, Guillemot F, Kageyama R, Gao WQ. Hes1 is a negative regulator of inner ear hair cell differentiation. Development. 2000;127:4551–4560. doi: 10.1242/dev.127.21.4551. [DOI] [PubMed] [Google Scholar]
- Zine A, Van De Water TR, de Ribaupierre F. Notch signaling regulates the pattern of auditory hair cell differentiation in mammals. Development. 2000;127:3373–3383. doi: 10.1242/dev.127.15.3373. [DOI] [PubMed] [Google Scholar]
- Zine A, Aubert A, Qiu J, Therianos S, Guillemot F, Kageyama R, de Ribaupierre F. Hes1 and Hes5 activities are required for the normal development of the hair cells in the mammalian inner ear. J Neurosci. 2001;21:4712–4720. doi: 10.1523/JNEUROSCI.21-13-04712.2001. [DOI] [PMC free article] [PubMed] [Google Scholar]