Abstract
Nonalcoholic fatty liver disease (NAFLD) involves development of hepatic steatosis, fibrosis, and steatohepatitis. Because hepatic steatosis appears first in NAFLD animal models, the current therapy development focuses on inhibition of hepatic steatosis, suggesting that further steps of NAFLD will be also inhibited. In this report, we show that the first event of NAFLD is liver proliferation, which drives fibrosis in NAFLD. We have deleted a strong driver of liver proliferation, gankyrin (Gank), and examined development of NAFLD in this animal model under conditions of a high‐fat diet (HFD). We found that proliferating livers of wild‐type mice develop fibrosis; however, livers of Gank liver‐specific knockout (GLKO) mice with reduced proliferation show no fibrosis. Interestingly, an HFD causes the development of strong macrovesicular steatosis in GLKO mice and is surprisingly associated with improvements in animal health. We observed that key regulators of liver biology CCAAT/enhancer binding protein α (C/EBPα), hepatocyte nuclear factor 4α (HNF4α), p53, and CUG repeat binding protein 1 (CUGBP1) are elevated due to the deletion of Gank and that these proteins support liver functions leading to healthy conditions in GLKO mice under an HFD. To examine the role of one of these proteins in the protection of liver from fibrosis, we used CUGBP1‐S302A knockin mice, which have a reduction of CUGBP1 due to increased degradation of this mutant by Gank. These studies show that reduction of CUGBP1 inhibits steatosis and facilitates liver proliferation, leading to fibrosis and the development of liver tumors. Conclusion: Liver proliferation drives fibrosis, while steatosis might play a protective role. Therapy for NAFLD should include inhibition of proliferation rather than inhibition of steatosis.
Abbreviations
- ALT
alanine aminotransferase
- C/EBPα
CCAAT/enhancer binding protein α
- cdc2
cyclin‐dependent kinase 1
- cdk4
cyclin‐dependent kinase 4
- CoA
coenzyme A
- Co‐IP
co‐immunoprecipitation
- Col1a1
collagen type I alpha 1
- CUGBP1
CUG repeat binding protein 1
- DGAT
diacylglycerol O‐acyltransferase
- FAS
fatty acid synthase
- Gank
gankyrin
- GLKO
gankyrin liver‐specific knockout
- GPAT1
glycerol‐3‐phosphate acyltransferase
- HCC
hepatocellular carcinoma
- HFD
high‐fat diet
- HNF4α
hepatocyte nuclear factor 4α
- KI
knockin
- Loxl2
lysyl oxidase‐like 2
- MDM2
E3 ubiquitin‐protein ligase
- mRNA
messenger RNA
- NAFLD
nonalcoholic fatty liver disease
- NASH
nonalcoholic steatohepatitis
- ND
normal diet
- ph
phosphorylated
- qRT‐PCR
real‐time quantitative reverse‐transcription polymerase chain reaction
- Rb
retinoblastoma
- RNA‐Seq
RNA sequencing
- SCD1
stearoyl‐coenzyme A desaturase 1
- TG
triglyceride
- TIMP1
tissue inhibitor of metalloproteinase 1
- TUNEL
terminal deoxynucleotidyl transferase–mediated deoxyuridine triphosphate nick‐end labeling
- WT
wild type
Nonalcoholic fatty liver disease (NAFLD) is a dangerous liver disease that affects many people worldwide and recently became the second cause of liver resections.1 Until recently, it was recognized that the primary event of NAFLD is hepatic steatosis or nonalcoholic fatty liver, which causes disease progression leading to cell damage, fibrosis, and nonalcoholic steatohepatitis (NASH).1 However, our studies of NAFLD under a high‐fat diet (HFD) protocol found that the earliest event of NAFLD is the initiation of liver proliferation, which takes place prior to steatosis, suggesting this event might be involved in liver injury.2 In agreement, it has recently been shown that some strong initiators of liver proliferation and oncogenes are elevated in human liver biopsies from patients and in animal models with NAFLD. These proliferative markers include the elevation of gankyrin (Gank),2, 3, 4, 5 cyclin‐dependent kinase 4 (cdk4), and cyclin D32, 6 and activation of the E2F1 pathway.7 Several recent reports showed that inhibition of cdk4 prevented and reversed the NAFLD phenotype.2, 8, 9 Patients with NASH also show elevated cdk4, and the level of elevation correlates with severity of the disease.9 These observations suggest that liver proliferation is a critical stage of NAFLD.
Gank is a non‐adenosine triphosphatase dependent subunit of the 26S proteasome and an oncogene that is expressed in several types of cancer.10, 11 Gank causes cancer by several cancer‐promoting activities, one of which is the elimination of tumor suppressor proteins, such as retinoblastoma (Rb), CCAAT/enhancer binding protein α (C/EBPα), and hepatocyte nuclear factor 4α (HNF4α).10, 11, 12 Several recent reports demonstrated that Gank might be a critical driver of NAFLD. It has been shown that the Gank transgenic zebrafish model spontaneously develops hepatic steatosis, fibrosis, and hepatocellular carcinoma (HCC).4 Gank is elevated in mice with HFD‐mediated NASH2 and in patients with NASH.5 One downstream target of Gank is the RNA‐binding protein CUG repeat binding protein 1 (CUGBP1). CUGBP1 was originally discovered as an important player of myotonic dystrophy13 and as a regulator of skeletal muscle, heart, and brain functions.14 However, several reports have shown that CUGBP1 is a key protein that regulates liver biology.2, 15, 16
Because Gank promotes liver proliferation and CUGBP1 promotes steatosis, we generated mice with a liver‐specific deletion of Gank (Gank liver‐specific knockout [GLKO] mice)17 and CUGBP1‐S302A knockin (KI) mice, which have reduced levels of CUGBP1 and increased proliferation.3 Using these animal models, we examined the role of proliferation and steatosis in HFD‐mediated NAFLD. These studies revealed that liver proliferation is a critical event that is required for the development of fibrosis. Moreover, the increased fat accumulation resulted in inhibition of fibrosis and dramatic improvements of health under conditions of the HFD protocol.
Materials and Methods
Antibodies and Reagents
Antibodies to C/EBPα (14AA), diacylglycerol O‐acyltransferase 1 (DGAT1; H‐255), DGAT2 (H‐70), p53 (sc‐6243), CUGBP1 (3B1), Rb (IF‐8), HNF4α (C‐19), cyclin D1 (H‐295), cdk4 (C‐22), sterol regulatory element‐binding protein 1 (C‐20; sc‐366) were from Santa Cruz Biotechnology (Dallas, TX). Antibodies to fatty acid synthase (FAS), stearoyl‐coenzyme A (CoA) desaturase 1 (SCD1), and acetyl‐CoA carboxylase were from Cell Signaling (Danvers, MA). E3 ubiquitin‐protein ligase (MDM2; ab38618) antibody was from Abcam (Cambridge, United Kingdom). Monoclonal anti‐β‐actin antibody was from Sigma (St. Louis, MO). Co‐immunoprecipitation (Co‐IP) studies were performed using TrueBlot reagents as described.2, 3, 6, 9
Animal Work
Experiments with animals were approved by the Institutional Animal Care and Use Committee (IACUC) at Cincinnati Children's Hospital (protocol IACUC2017‐0041). Young (2 months old) C57Bl6 mice were purchased from the Jackson Laboratory (Bar Harbor, ME). Liver‐specific GLKO mice were generated by crossing Cre‐Alb mice with LoxP‐Gank mice. These GLKO mice have been characterized.17 CUGBP1‐S302A KI mice have also been described.(3) Mice were fed regular chow and an HFD as described.6, 9 In experiments with HFD‐treated mice, we used 10 wild‐type (WT) and 10 GLKO mice for controls and 10 WT and 10 GLKO mice for HFD treatments. In the studies of spontaneous liver tumor and fibrosis, we analyzed 20 WT and 17 CUGBP1‐S302A mice.
Histology and Oil Red O Staining
Livers were fixed overnight in 4% paraformaldehyde, embedded in paraffin, and sectioned at a thickness of 6 μm. For Oil Red O staining, 10‐µm liver cryosections were stained with commercially available kits (Oil Red O color solution, Cat# 1.20419.0250; Merck, Germany). Terminal deoxynucleotidyl transferase–mediated deoxyuridine triphosphate nick‐end labeling (TUNEL) staining was performed using the ApopTag Peroxidase In Situ Apoptosis Detection Kit (S7100; Millipore, Temecula, CA).
Liver Triglyceride Quantification Assay
Livers (100 mg) were homogenized in 1 mL of 20 mM Tris–HCl buffer (pH 7.5) with protease inhibitors. Three to four animals were used per group. We then added 200 μL triglyceride (TG) reagent (Pointe Scientific, Inc., Canton, MI) to each well containing 10 μL sample, incubated the samples, and read them at 500 nM. Liver TG levels were represented as mg/dL per 100 mg wet liver weight.
Real‐Time Quantitative Reverse‐Transcription Polymerase Chain Reaction
Total RNA was isolated as described.2, 9 The following TaqMan probes were purchased from Applied Biosystems (Foster City, CA): β‐actin, Mm02619580_g1; HNF4α, Mm01247712_m1; RB1, Mm00485586_m1; TP53, Mm01731290_g1; CUGBP elav‐like family member 1 (CELF1), Mm04279608_m1; C/EBPα, Mm00514283_s1; CDK1, Mm01149140_m1; collagen type I alpha 1 (Col1a1), Mm00801666_g1; lysyl oxidase‐like 2 (Loxl2), Mm01321306_m1; tissue inhibitor of metalloproteinase 1 (TIMP1), Mm01341361_m1; DGAT1, Mm00515643_m1; DGAT2, Mm00499536_m1; 1‐acylglycerol‐3‐phosphate O‐acyltransferase 1 (AGPAT1), Mm00479699_g1; FAS, Mm04206620_m1; actin alpha 2, smooth muscle (ACTA2), Mm00725412_s; cyclin D1 (CCND1), Mm00432359_m1; CCND3, Mm01612362_m1; and cdk4, Mm00726334_s1.
Protein Isolation and Western Blot
Cytoplasmic and nuclear extracts were isolated from livers as described.2, 3, 6, 9 Proteins (30‐50 μg) were loaded on gradient (4%‐20%) polyacrylamide gels, transferred onto nitrocellulose membranes, and probed with antibodies against proteins of interest. To verify protein loading, each filter was reprobed with antibodies to β‐actin. Full images of gels are shown in Supporting Figs. [Link], [Link], [Link], [Link], [Link], [Link], [Link].
Co‐Immunoprecipitation
Nuclear extracts were used for Co‐IP as described.2, 16 Proteins from immunoprecipitation were resuspended in 30 µl of loading buffer containing 2% sodium dodecyl sulfate (SDS) and 5% β‐mercaptoethanol and boiled for 40 minutes. The 10‐µl samples were run in SDS gels (4%‐20% gradient; Bio‐Rad). True‐Blot mouse and rabbit beads and secondary antibodies were used.
RNA Sequencing Analyses
RNA sequencing (RNA‐Seq) analysis was performed with livers of HFD‐treated GLKO and CUGBP1 KI mice of different ages. RNA was isolated from three mice per group. RNA‐Seq libraries were prepared using the Illumina TruSeq RNA preparation kit and were sequenced on the Illumina HiSeq 2500 using paired‐end 100‐base pair reads (Illumina, San Diego, CA). Reads were aligned using mm10 annotations produced by the University of California Santa Cruz and were quantified using Kallisto, which accurately quantifies read abundances (in transcripts per million) through pseudo‐alignment. Statistical analysis was performed in GeneSpring 13.0. Raw counts were thresholded at 1, normalized using the quantile normalization procedure, and baselined to the median of all samples (n = 25,240 transcripts). Ontological analysis of significantly differential genes was performed in the ToppGene Suite.
Statistical Analysis
All continuous values are presented as mean ± SEM using Microsoft Excel and GraphPad Prism 5.0. Student t tests, one‐way analysis of variance (ANOVA), and two‐way ANOVA analysis were performed as appropriate. The difference between groups was determined using Fisher's least significant difference post hoc test by setting the significance level at P < 0.05.
Results
GLKO Mice do not Develop Sicknesses Associated with NAFLD
Our previous work found that the HFD protocol initiates liver proliferation at very early stages.2 Because livers of GLKO mice have reduced capabilities to proliferate,17 we used this animal model to examine the role of proliferation in NAFLD and show a strategy for these studies in Fig. 1A. WT and GLKO mice were treated with a normal and an HFD for 32 weeks (7 months); development of different stages of NAFLD was examined at 4‐8 weeks and 6‐7 months. These time points were selected based on results of mouse weight gain. We found that the weight gain of WT and GLKO mice did not differ significantly within 6 months of treatments; however, GLKO mice showed a significant weight loss at 7 months (Fig. 1A). Although a reason for the loss of weight is not known, it is possible that other tissues are indirectly inhibited in HFD‐treated GLKO mice. Most importantly, GLKO mice showed a striking difference in overall phenotype starting from 12 weeks. While HFD‐fed WT mice huddled together and were scruffy with hair loss, the HFD‐fed GLKO mice remained active, had a smooth coat, and showed no hair loss (Fig. 1A; Supporting Fig. S1). We first investigated early time points (4‐8 weeks) with the goal of finding alterations that further led to a healthy phenotype of GLKO mice at 6‐7 months. We found that at 4‐8 weeks, liver to body weight ratios and levels of serum cholesterol did not differ significantly in WT mice compared to GLKO mice (Supporting Fig. S2A‐C). Slightly higher levels of serum TGs were observed in GLKO mice at 4 and 8 weeks with the HFD protocol (Supporting Fig. S2B,C). We also found that despite healthy conditions, levels of alanine aminotransferase (ALT) were significantly increased in serum of GLKO mice (Supporting Fig. S2C). Because the elevation of ALT usually reflects hepatocyte damage, we examined apoptosis using TUNEL staining and found an increase in apoptotic hepatocytes in HFD‐treated GLKO mice (Supporting Fig. S2D). Although a molecular basis for the hepatocyte damage in GLKO mice needs to be investigated, it might be associated with reduced functions of the proteasome as our previous studies showed a reduction in other components of proteasome signaling.17 Thus, these studies showed that despite healthy conditions at 8 weeks, there is detectable, but not significant, hepatocyte damage in HFD‐treated GLKO mice that disappeared at later time points (see below).
Figure 1.
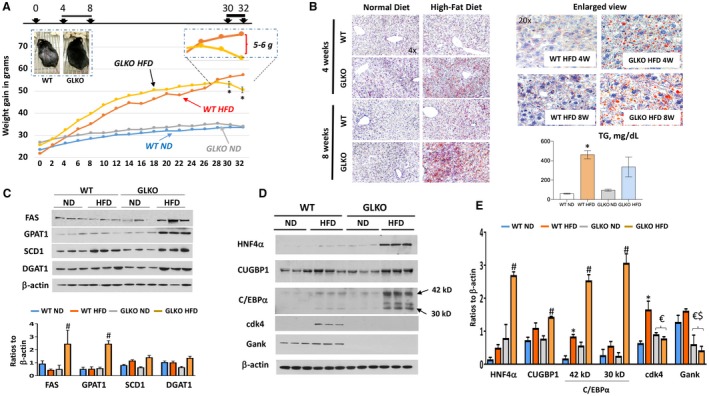
GLKO mice show a healthy appearance under the HFD protocol and have more steatosis. The data of line and bar graphs represent mean ± SEM. (A) Study time course of HFD versus ND in GLKO and WT mice, *P < 0.05 WT HFD versus GLKO HFD. Inserted images show pictures of WT and GLKO mice at 12 weeks of the HFD protocol (left image) and enlarged section of HFD WT and GLKO mice at 30‐32 weeks (right image). Images were taken using a camera with size 12.2 Megapixel, 1.4 micropixel. (B) Oil Red‐O staining of WT and GLKO mouse livers at 4 and 8 weeks of the HFD protocol. Right images show enlarged view of staining at Magnification 20×. Bar graph shows levels of hepatic TGs after 8 weeks of the HFD, *P < 0.05 WT ND versus WT HFD. (C) Expression of the enzymes of fatty liver development in WT and GLKO mice treated with an ND and an HFD. Bar graph shows ratios of the proteins to loading control, #P < 0.05 GLKO ND versus GLKO HFD. (D) Levels of CUGBP1, HNF4α, C/EBPα, and cdk4 proteins by western blot. (E) Bar graph shows quantification of protein levels of proteins on D relative to β‐actin, *P < 0.05 WT ND versus WT HFD; #P < 0.05 GLKO ND versus GLKO HFD; $P < 0.05 WT ND versus GLKO ND or GLKO HFD; €P < 0.05 WT HFD versus GLKO ND or GLKO HFD. Abbreviation: W, weeks.
HFD‐Treated GLKO MICE at 8 Weeks have Severe Steatosis, Reduced Proliferation, and Higher Levels of HNF4α, CUGBP1, and C/EBPα
We next examined hepatic steatosis in WT and GLKO mice at 4 and 8 weeks with the HFD protocol. Surprisingly, Oil Red O staining revealed that livers of GLKO mice have higher steatosis compared to livers of WT mice at both 4 and 8 weeks with the HFD protocol (Fig. 1B). Interestingly, levels of hepatic TGs were elevated in both WT and GLKO HFD‐treated mice with a slightly lower elevation in GLKO mice (Fig. 2B, bar graphs). We next examined expression of key enzymes of the fatty liver phenotype (FAS), enzymes of TG synthesis (glycerol‐3‐phosphate acyltransferase [GPAT1] and DGAT1), and SCD1 by western blotting (Fig. 1C). We found that FAS, GPAT1, and DGAT1 were elevated in HFD‐treated GLKO mice to a much higher degree than in HFD‐WT mice. Because Gank triggers degradation of important regulators of liver functions, such as HNF4α,12 C/EBPα,12, 18 and CUGBP1,2, 17 we compared the levels of these proteins in 8‐week HFD‐treated WT and GLKO mice. Real‐time quantitative reverse‐transcription polymerase chain reaction (qRT‐PCR) examination of corresponding messenger RNAs (mRNAs) did not show significant differences between WT and GLKO mice or between normal diet (ND) and HFD‐treated mice (Supporting Fig. S3). However, western blotting revealed significant differences (Fig. 1D,E). The levels of these proteins were much higher in GLKO HFD‐treated mice (Fig. 1E). While examining the proliferation status of livers, we saw increased expression of proliferation marker cdk4 in HFD‐treated WT mice, but this was not detectable in livers of GLKO mice (Fig. 1D). qRT‐PCR also revealed that levels of cyclin D1 were lower in GLKO mice with an ND and an HFD (Supporting Fig. S3). These results demonstrate that livers of WT mice proliferate at 8 weeks with the HFD protocol, while livers of GLKO mice do not proliferate. The elevation of CUGBP1, C/EBPα, and HNF4α proteins but not mRNAs in HFD‐treated GLKO mice suggests stabilization due to deletion of Gank. Co‐IP studies confirmed this and showed no interactions of these proteins with Gank in GLKO mice (Supporting Fig. S4). Taken together, studies of WT and GLKO mice at 4‐8 weeks with the HFD protocol showed that livers of GLKO mice have increased steatosis, reduced liver proliferation, and elevation of C/EBPα, HNF4α, and CUGBP1.
Figure 2.
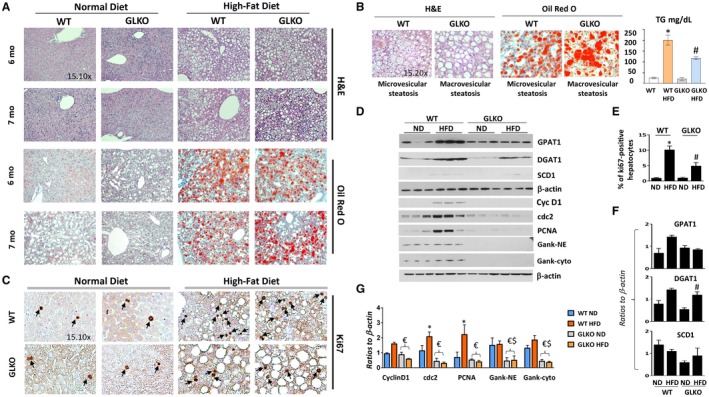
GLKO mice have developed strong macrovesicular steatosis and have reduced liver proliferation at 7 months of the HFD. All the bar graphs represent mean ± SEM. (A) H&E and Oil Red O staining of livers of WT and GLKO mice at 6 and 7 months of the HFD protocol. (B) A typical image of H&E and Oil Red O staining under high magnifications shows different types of steatosis: predominantly microvesicular steatosis in WT mice and predominantly macrovesicular steatosis in GLKO mice. Bar graph shows levels of hepatic TGs in livers of WT and GLKO mice after 32 weeks of HFD treatments, *P < 0.05 WT ND versus WT HFD, #P < 0.05 GLKO ND versus GLKO HFD. (C) ki67 staining of livers of WT and GLKO mice at 7 months of the HFD. Arrows show Ki67 positive hepatocyte staining. (D) Examination of protein expressions by western blotting. (E) Bar graph shows number of ki67‐positive hepatocytes, *P < 0.05 WT ND versus WT HFD; #P < 0.05 GLKO ND versus GLKO HFD; (F,G) Levels of cell‐cycle proteins as ratios to β‐actin, *P < 0.05 WT ND versus WT HFD; #P < 0.05 GLKO ND versus GLKO HFD; $P < 0.05 WT ND versus GLKO ND or GLKO HFD; €P < 0.05 WT HFD versus GLKO ND or GLKO HFD. Abbreviations: Cyc D1, cyclin D1; Gank cyto, Gankyrin in Cytoplasmic Extracts; Gank NE, Gankyrin in Nuclear Extracts; H&E, hematoxylin and eosin; PCNA, proliferating cell nuclear antigen.
Healthy Conditions of 7‐Month HFD‐Treated GLKO Mice are Associated with Strong Macrovesicular Steatosis and Inhibition of Proliferation
We next investigated the liver in WT and GLKO mice at 6‐7 months with the HFD protocol when GLKO mice have a striking difference in health conditions compared to WT mice. Although Oil Red O staining was slightly lower in GLKO mice (Fig. 2A) than in WT mice, we observed a strong difference in the type of steatosis. While WT mice had predominantly microvesicular steatosis, GLKO mice had mixed steatosis with the majority being macrovesicular steatosis (Fig. 2B). Quantitation of steatosis revealed that macrovesicular steatosis was 2.5‐fold higher in GLKO mice compared to WT mice (Supporting Fig. S5). Consistent with hematoxylin and eosin staining and Oil Red O staining, examination of TGs in the liver showed a slightly lower elevation of TGs in livers of HFD‐treated GLKO mice compared to livers of WT HFD mice (Fig. 2B, bar graphs). We examined expression of the enzymes of the fatty liver phenotype and found that the overall levels of enzymes of fatty liver were high in both WT and GLKO HFD‐treated mice (Fig. 2D,G,F). Thus, GLKO mice had an abundance of fat accumulation in the form of macrovesicular steatosis after 7 months of HFD treatments. Examination of liver proliferation in WT and GLKO mice showed that up to 11%‐12% of hepatocytes were ki67 positive in WT HFD‐treated mice while only 4% of hepatocytes in GLKO mice were ki67 positive (Fig. 2C,E). Western blotting revealed that cyclin D1, cyclin‐dependent kinase 1 (cdc2), and proliferating cell nuclear antigen were increased in WT mice treated with the HFD. However, a weak elevation of these proteins and mRNAs was observed in livers of HFD‐treated GLKO mice (Supporting Fig. S6).
GLKO Mice do not Develop Fibrosis under the HFD Protocol of NAFLD
We examined global alterations of gene expression using RNA‐Seq. The heat map showed multiple differences in gene expressions between untreated and HFD‐treated WT and GLKO mice (Fig. 3A). Compared to mice treated with an ND, HFD‐treated WT mice had 407 genes with altered expression while HFD‐treated GLKO mice had 285 genes with an alteration (Fig. 3B; Supporting Fig. S7). Among these genes, only 96 genes had identical changes; the remaining genes represented different signaling pathways (Fig. 3B). Most importantly, we found alterations involving liver fibrosis and cirrhosis in Gank‐dependent pathways (Fig. 3C; Supporting Fig. S7). Notably, the steatohepatitis pathway was elevated in WT mice but there was no elevation in GLKO mice. To further compare fibrosis in HFD‐treated WT and GLKO mice, we stained livers of HFD‐treated WT and GLKO mice with sirius red. This staining showed perisinusoidal focal fibrosis in livers of WT mice. In contrast, HFD‐GLKO mice did not have fibrosis (Fig. 4A). Among four examined GLKO mice, we detected one mouse with very weak perisinusoidal fibrosis. However, this mouse had microvesicular steatosis while other fibrosis‐negative GLKO mice had more fat accumulation in the form of macrovesicular steatosis. Sirius red staining showed that GLKO mice with severe macrovesicular steatosis did not develop fibrosis. To obtain more evidence for this conclusion, we examined the expression of three markers of fibrosis: Loxl2, TIMP1, and Col1a1. These markers were elevated in WT mice treated with the HFD; however, weak to no activation was observed in HFD‐treated GLKO mice (Fig. 4B).
Figure 3.
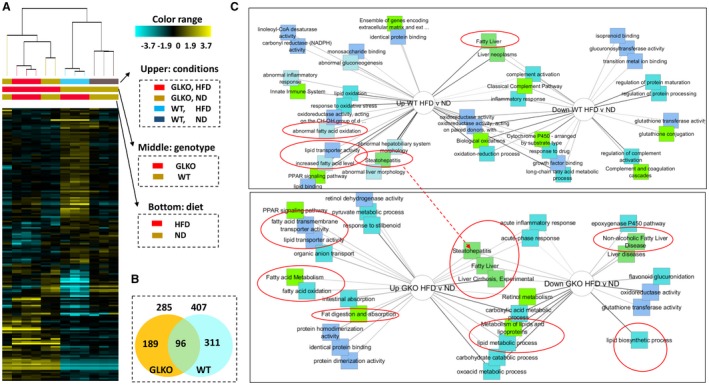
Multiple pathways of HFD‐mediated steatosis are down‐regulated in livers of GLKO mice. (A) Heat map of the RNA‐Seq analyses of gene expression in livers of WT and GLKO mice untreated and treated with the HFD. Right image shows labels of conditions, genotype, and diet. (B) Numbers and overlap of genes that are changed in WT and GLKO mice by an HFD. (C) Comparisons of signaling pathways that are up‐ or down‐regulated by an HFD in WT (upper) and GLKO mice (bottom). Red circles show pathways associated with NAFLD. Abbreviations: Down, down‐regulated; NADPH, nicotinamide adenine dinucleotide phosphate (reduced); PPAR, peroxisome proliferator‐activated receptor; Up, up‐regulated.
Figure 4.
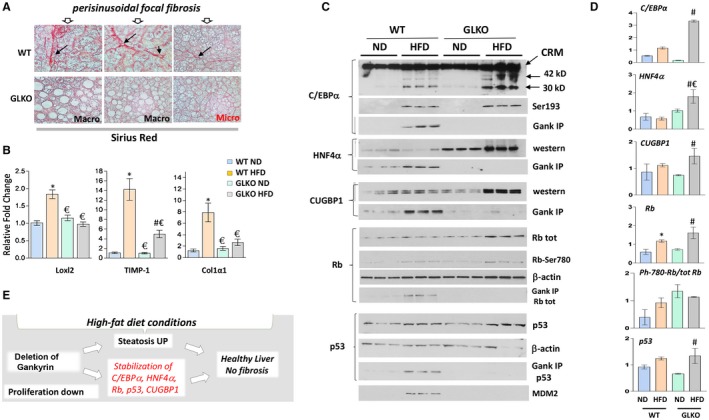
GLKO mice do not develop fibrosis under conditions of an HFD. All the bar graphs represent mean ± SEM. (A) Sirius red staining of livers of HFD‐treated WT and GLKO mice. Perisinusoidal focal fibrosis shown by arrows. (B) mRNA levels of markers of fibrosis were examined by qRT‐PCR, *P < 0.05 WT ND versus WT HFD; #P < 0.05 GLKO ND versus GLKO HFD; €P < 0.05 WT HFD versus GLKO HFD. (C) Inhibitors of proliferation and key regulators of liver biology C/EBPα, CUGBP1, HNF4α, Rb, and p53 are increased in HFD‐treated GLKO mice. Protein levels of C/EBPα, ph‐S193‐ C/EBPα, CUGBP1, HNF4α, Rb, Rb‐S780‐ph, p53, and MDM2 were determined in nuclear extracts isolated from livers of HFD‐treated GLKO mice by western blotting. For Gank IP, Gank was immunoprecipitated and levels of C/EBPα, CUGBP1, HNF4α, Rb, and p53 were determined from these immunoprecipitations. (D) Protein levels C/EBPα, CUGBP1, HNF4α, Rb, ph‐Rb, and p53 were calculated as ratios to β‐actin, *P < 0.05 WT ND versus WT HFD; #P < 0.05 GLKO ND versus GLKO HFD; €P < 0.05 WT HFD versus GLKO HFD. (E) Hypothesis for the molecular basis of the improvements of health in GLKO mice treated with an HFD. Abbreviations: CRM, Cross reactive molecule; tot, total; UP, up‐regulated.
Key Regulators of Liver Biology C/EBPα, HNF4α, CUGBP1, Rb, and p53 are Increased in Livers of HFD‐Treated GLKO Mice at 7 Months
RNA‐Seq results represent alterations of mRNAs, but because Gank regulates the stability of proteins, direct Gank‐dependent alterations might exist mainly at the protein level. Therefore, we examined the known targets of Gank in WT and GLKO mice at 7 months of HFD treatments. Because Gank promotes liver proliferation by triggering the degradation of inhibitors of liver proliferation (C/EBPα, HNF4α, CUGBP1, Rb, and p53)2, 17 and given the reduction of liver proliferation in GLKO mice treated with an HFD, these proteins were examined. Analyses of mRNAs for these proteins showed no elevation in livers of HFD‐treated WT and GLKO mice (Supporting Fig. S6); however, we found a significant increase of the proteins (Fig. 4C,D). The Co‐IP approach showed interactions of all these proteins with Gank in WT mice, with stronger interactions in HFD‐treated mice, suggesting that these proteins are partially degraded in WT mice by the Gank–proteasome system (Fig. 4C,D). No interaction of these proteins with Gank was found in GLKO mice, strongly suggesting that the elevation of C/EBPα, HNF4α, p53, CUGBP1, and Rb proteins in GLKO mice is due to stabilization. To address this possibility, we examined Gank‐dependent mechanisms that might be involved in the partial reduction of these proteins in HFD‐treated WT mice and might be inhibited in GLKO mice. It has been shown that Gank triggers a degradation of C/EBPα and Rb when these proteins are phosphorylated (ph) at ph‐insulin receptor substrate 1 (Ser302) and ph‐Rb (Ser780), respectively.2, 17 Therefore, we examined the phosphorylation status of these proteins using specific antibodies. These studies revealed that phosphorylation of C/EBPα and Rb was increased by an HFD in both WT and GLKO mice; however, amounts of these proteins were higher in GLKO mice, perhaps due to a lack of degradation by Gank (Fig. 4C,D). Because ph‐S193‐C/EBPα is a strong inhibitor of liver proliferation, the higher levels of ph‐S193‐C/EBPα provide an additional possible mechanism of inhibition of proliferation in HFD‐treated GLKO mice. We next examined levels of MDM2 ligase, which Gank stabilizes and reduces levels of p53. These studies revealed that MDM2 is increased in WT HFD‐treated mice but not in GLKO HFD‐treated mice (Fig. 4C). Taken together, these studies strongly suggest that C/EBPα, Rb, and p53 are stabilized in GLKO mice under the HFD protocol.
The elevation of these key regulators of liver biology in HFD‐treated GLKO mice also suggested that the “healthy” phenotype of GLKO mice and the inhibition of fibrosis might be associated with the positive effects of these proteins on liver functions. To test this suggestion, we compared blood parameters of WT and GLKO mice and found that GLKO mice had lower ALT/aspartate aminotransferase levels and levels of ALP while TG and cholesterol did not differ (Supporting Fig. S8A). Because HFD‐treated GLKO mice showed hepatocyte damage at 8 weeks (see Supporting Fig. S2B,C), we performed TUNEL staining with livers of GLKO mice at 7 months after HFD treatments. These studies demonstrated no differences in damage of hepatocytes in GLKO mice compared to WT mice (Supporting Fig. S8B). Taken together, these findings and data for HFD‐treated mice at 8 weeks (Figs. 1 and 2) led us to conclude that increased protein levels of the key regulators of liver biology (C/EBPα, HNF4α, CUGBP1, p53, and Rb) in GLKO mice provide healthy conditions and inhibit development of fibrosis under an HFD protocol (Fig. 4E).
CUGBP1 S302A KI Mice have Reduced Levels of CUGBP1, Reduced Steatosis, and Increased Liver Proliferation under Temperature‐Stressed Housing Conditions
One of the key proteins that provides resistance to fibrosis in GLKO mice is the RNA‐binding protein CUGBP1. Therefore, we examined steatosis in CUGBP1‐S302A mice in which the mutant CUGBP1 is reduced by Gank‐mediated degradation.3 It has been recently shown that housing temperature controls development of NAFLD.19 Because our previous investigations of these mice were conducted at the Baylor College of Medicine under thermoneutral housing conditions (30°C)3 and because housing conditions at the Cincinnati Children's Hospital Medical Center have a temperature of 22°C, we initially performed examination of global changes of signaling pathways in CUGBP1 KI mice under 22°C housing using RNA‐Seq. In agreement with previous studies,3 levels of mutant CUGBP1 were reduced in livers of CUGBP1 KI mice (Fig. 5A, top). RNA‐Seq analysis showed a dramatic difference in the transcriptome profile of age‐matched WT and CUGBP1‐S302A mice. A comparison of differentially activated pathways identified a reduction of several pathways that promote steatosis, including synthesis of TGs, cholesterol metabolism, and cellular response to oxidative stress (Fig. 5B; Supporting Fig. S9). Therefore, we examined hepatic steatosis in 3‐month‐old WT and CUGBP1 KI mice. Oil Red O staining revealed that hepatic steatosis was reduced in CUGBP1 KI mice and that this difference was maintained at 12 months (Fig. 5C). qRT‐PCR and western blotting of enzymes of fatty liver confirmed that DGAT1/2, AGPAT1, and FAS were lower in CUGBP1‐S302A mice (Figs. 5D and 6A,B). We next examined proliferation in CUGBP1 KI mice and found that up to 4% of CUGBP1‐S302A hepatocytes but less than 0.5% of hepatocytes in WT mice were ki67 positive (Fig. 5C,D). Western blotting showed a 3‐fold to 5‐fold elevation of cyclin D1, confirming the increase of liver proliferation in young CUGBP1‐S302A mice (Fig. 6A,B). Thus, these studies revealed that young CUGBP1‐S302A mice have reduced steatosis and increased liver proliferation.
Figure 5.
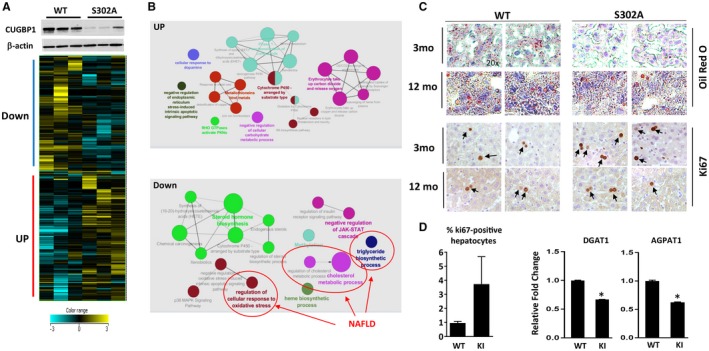
CUGBP1‐S302A mice at 2 months of age have reduced steatosis and increased liver proliferation. All the bar graphs represent mean ± SEM. (A) Heat map of the RNA‐Seq analyses of three WT and three CUGBP1‐S302A mice. Upper image shows levels of CUGBP1 in the analyzed mice determined by western blotting. (B) Network of pathways which are up‐ and down‐regulated in S302A mice compared to WT mice. Down‐regulated pathways involved in the development of NAFLD are shown. (C) Oil Red O and ki67 staining of livers of WT and S302A mice. Arrows show ki67‐positive hepatocytes; magnification at 20×. (D) Bar graphs show percentage of ki67‐positive hepatocytes and mRNA levels coding for enzymes involved in fatty liver development, *P < 0.05 WT versus S302A KI. Abbreviations: Down, down‐regulated; JAK‐STAT, Janus kinase/signal transducer and activator of transcription; mo, months; UP, up‐regulated.
Figure 6.
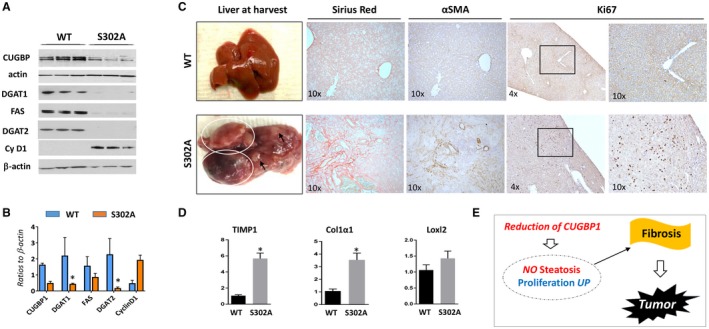
CUGBP1‐S302A mice develop fibrosis and liver tumors at the age of 17‐22 months. All the bar graphs represent mean ± SEM. All the bar graphs represent mean ± SEM. (A) Levels of fatty liver markers and cyclin D1 in 2‐month‐old WT and S302A mice were examined by western blotting. (B) Levels of proteins in section A were calculated as ratios to β‐actin, *P < 0.05 WT versus S302A KI. (C) (Left) Typical pictures of livers of WT (control) and S302A mice that develop tumors. (Right) Sirius red, αSMA, and Ki67 staining of the livers shown on the left. (D) mRNA levels of markers of fibrosis were determined by qRT‐PCR in WT and CUGBP1‐S302A mice, *P < 0.05 WT versus S302A KI. (E) Hypothesis for the role of steatosis and proliferation in the development of fibrosis and tumors in CUGBP1 S302A mice. Abbreviations: αSMA, α smooth muscle actin; Cy D1, cyclin D1; UP, up‐regulated.
Reduction of Steatosis and Increased Proliferation in CUGBP1 KI Mice Lead to Spontaneous Development of Fibrosis and Liver Tumor
We next examined the consequences of reduced steatosis in young CUGBP1 KI mice. We aged out the CUGBP1 KI mouse colony and sacrificed mice at 18‐20 months and 22‐26 months. CUGBP1 KI mice present with spontaneous tumors as they age, and the highest prevalence of tumors was found in the 18‐20‐month age group (CUGBP1 KI 29% compared to WT 12%). WT mice had the highest prevalence of spontaneous tumors at 22‐26 months at 33% compared to 25% in CUGBP1 KI mice of the same age. These data showed that CUGBP1 KI had accelerated development of spontaneous tumors compared to WT mice and that CUGBP1 KI mice were already sick due to tumors by 22‐26 months. This explains why WT mice had increased tumor prevalence at the later stage. Among 17 CUGBP1 KI mice examined, seven animals developed spontaneous liver tumors at age 18‐20 months while 10 mice did not show liver tumors. None of the WT mice developed tumors at age 18‐20 months. Livers of WT mice and liver tumors of CUGBP1 KI mice are shown in Fig. 6C. We next assessed liver proliferation and found a dramatic elevation of ki67‐positive hepatocytes in all seven CUGBP1‐KI mice with liver tumors that we examined. We also found that levels of cdc2 were elevated in CUGBP1 KI mice with liver tumors (Fig. 7E). Three approaches (sirius red staining; α‐smooth muscle actin staining; and examination of levels of markers of fibrosis TIMP1, Col1a1, and Loxl2) identified fibrosis in all examined CUGBP1 KI mice with tumors (Fig. 6C,D). In summary, investigations of old CUGBP1 KI mice showed that the reduction of steatosis and the increased proliferation in these mice at a young age resulted in development of fibrosis and acceleration of liver tumor development at 17‐22 months of age (Fig. 6E).
Figure 7.
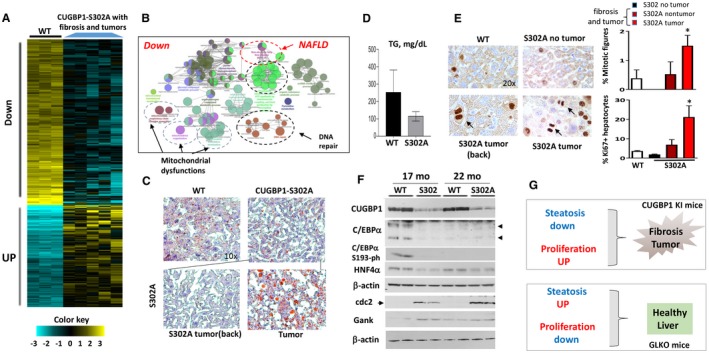
Development of liver fibrosis and tumors in CUGBP1‐S302A mice is associated with down‐regulation of pathways of NAFLD, mitochondrial dysfunctions, and reduction of CUGBP1, C/EBPα, and HNF4α. All the bar graphs represent mean ± SEM. (A) Heat map of RNA‐Seq analysis of livers of five CUGBP1 KI mice and three WT mice. (B) Signaling pathways that are down‐regulated in CUGBP1‐S302A mice that developed fibrosis and tumors. (C) Representative Oil Red O staining of WT mice and CUGBP1 S302A mouse livers. Nontumor and tumor sections of CUGBP1 KI mice are shown. Image magnifications are at 10×. (D) Levels of hepatic TGs were calculated in livers of age‐matched WT and CUGBP1 KI mice with liver tumors. (E) (Left) ki67 staining of livers of WT mice, CUGBP KI mice without tumors, and CUGBP1 KI mice with fibrosis and tumors. Arrows show mitotic figures in the left panel. (Right; bar graphs) Calculations of percentage of mitotic figures and ki6‐positive hepatocytes. * represents P < 0.05 WT Versus CUGBP1 KI mice with fibrosis and tumors. (F) Western blot analysis shows reduction of CUGBP1, C/EBPα, C/EBPα‐S193‐ph, and HNF4α in livers of 17‐ and 22‐month‐old CUGBP1‐S302A mice. cdc2 and Gank were examined as markers of liver proliferation. (G) Hypothesis for the role of steatosis and proliferation in NAFLD and liver diseases. Abbreviations: Down, down‐regulated; mo, months; UP, up‐regulated.
Development of Fibrosis and Liver Tumor in CUGBP1 KI Mice is Associated with Multiple Changes in Signaling Pathways, Including Reduction of CUGBP1, C/EBPα, AND HNF4α
To examine if additional CUGBP1‐dependent pathways might be involved in the development of fibrosis and liver tumors, we performed RNA‐Seq of five CUGBP1 KI mice with fibrosis and tumors and three control WT mice of the same age. Comparison of the differentially expressed genes is shown in Fig. 7A, and comparison of the altered pathways is shown in Fig. 7B and Supporting Figs. S10 and S11. The most dramatic differences were observed in the list of down‐regulated pathways. Those included NAFLD pathways, mitochondrial dysfunctions, and pathways of DNA repair (Fig. 7B). To confirm RNA‐Seq results for NAFLD, we performed qRT‐PCR for key enzymes of fatty liver (FAS and DGAT2) and found that both were reduced 3‐fold to 5‐fold in CUGBP1 KI mice (Supporting Fig. S12A).
We next examined steatosis and proliferation in different areas of livers of CUGBP1 KI mice that developed fibrosis and tumors. Oil Red O staining showed reduced steatosis in whole livers of CUGBP1 KI mice (Fig. 7C). A similar reduction of steatosis was observed in nontumor regions of mice with tumors. However, the tumor regions of CUGBP1 KI livers showed elevation of mild steatosis (Fig. 7C) and a high rate of proliferation (Fig. 7E). Examination of hepatic TGs showed a reduction of TGs in livers of CUGBP1 KI mice that had developed tumors (Fig. 7D). Given the elevation of C/EBPα and HNF4α in GLKO mice and a possible role of these proteins in the prevention of fibrosis, we examined their expression in CUGBP1 KI mice. These studies showed that in addition to CUGBP1, C/EBPα and HNF4α were reduced in livers of CUGBP1 KI mice with fibrosis and tumors (Fig. 7F; Supporting Fig. S12B). Examination of phosphorylation of C/EBPα at Ser193 revealed that this growth inhibitory isoform was not detected in CUGBP1‐S302A mice (Fig. 7F), which have increased proliferation, developed fibrosis, and tumors. Examination of cdc2 and Gank showed that these proteins were elevated in livers of CUGBP1 KI mice with fibrosis and tumors. Thus, examination of CUGBP1 KI mice showed that reduced steatosis and increased proliferation in whole livers led to development of fibrosis and tumors and that a mild increase in steatosis in tumor sections was not sufficient for inhibition of fibrosis. These results are summarized in Fig. 7G.
Discussion
Hepatic steatosis is characterized by accumulation of fat in hepatocytes without liver injury and has been considered to be the first step of NAFLD, leading to more severe stages of fibrosis and NASH.1 However, our current work challenges this assumption and presents evidence that the development of drugs for inhibition of steatosis might not be sufficient and that therapeutic approaches for NAFLD should include drugs that inhibit liver proliferation. As many other groups, we initially focused our work on the pathways that lead to hepatic steatosis and on a search for small molecules that might inhibit steatosis.2, 6, 8, 9 In the course of these studies, we found that cyclin D3–cdk4 phosphorylates C/EBPα at Ser193 and increases formation of C/EBPα‐p300 complexes, which in turn activate enzymes of TG synthesis and cause hepatic steatosis.2 In addition to cdk4, several recent papers provide evidence that a number of strong initiators of liver proliferation and oncogenes are elevated in human liver biopsies from patients with NAFLD and in animal models of NAFLD at early stages of the disease.2, 4, 5, 7 Previous studies suggested that hepatic steatosis causes further steps of NAFLD. However, we have surprisingly found that despite a higher degree of hepatic steatosis, HFD‐treated GLKO mice appeared much healthier than HFD‐treated WT mice and did not develop fibrosis at 6‐7 months. In agreement with the protective role of steatosis, Diehl's group20 reported that the inhibition of a key enzyme of TG synthesis, DGAT2, inhibits steatosis but increases fibrosis. It is interesting to note that not all GLKO mice with predominant macrovesicular steatosis developed fibrosis. We suggest that advanced macrovesicular steatosis protects liver from fibrosis and that liver proliferation may cause fibrosis.
Searching for molecular mechanisms, we found that stabilization of key regulators of liver biology (C/EBPα, HNF4α, CUGBP1, Rb, and p53) under conditions of an HFD contributes to inhibition of steatosis. In agreement with this, several reports from Habib's group21 showed that the elevation of C/EBPα by a short‐activating RNA causes inhibition of liver cancer, metastasis,22, 23 cirrhosis, fibrosis, and hepatosteatosis.24 In agreement with these observations, HFD‐treated GLKO mice and C/EBPα‐S193A mice have reduced C/EBPα and increased proliferation and spontaneously develop fibrosis and HCC,25 a situation observed in CUGBP1‐S302A mice. These published results strongly support the hypothesis that the elevation of C/EBPα in GLKO mice and a reduction of C/EBPα in CUGBP1 KI mice are involved in development of the healthy or sick phenotypes, respectively, of these mice. Our findings and published observations are summarized in Fig. 8. Identification of liver proliferation as an essential driver of fibrosis in NAFLD but steatosis as a neutral or possible protective event could change strategies for development of therapies. We suggest that, similar to the healthy conditions of HFD‐treated GLKO mice, new approaches to inhibit the proliferation in patients with NAFLD will provide higher quality of life conditions.
Figure 8.
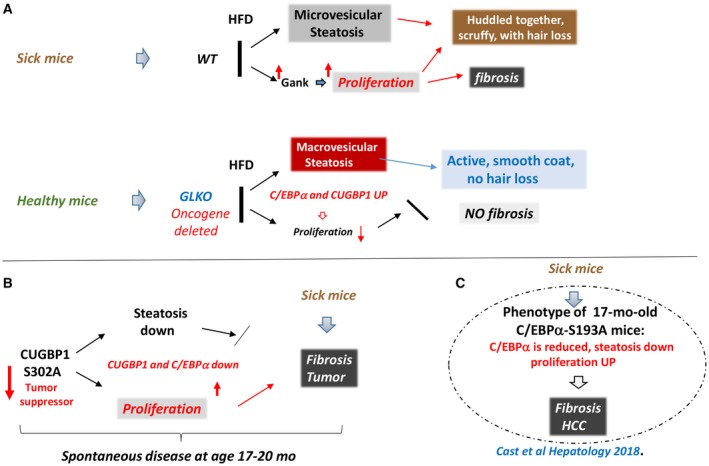
Summary of our work with genetically modified animal models demonstrating a critical role of proliferation in HFD‐mediated spontaneous fibrosis and liver cancer. (A) Summary of WT and GLKO mice on an ND versus an HFD study conclusions. (B) Data summary of aging CUGBP1 KI mice. (C) Summary of recent work25 with C/EBPα‐S193A mice demonstrating similar mechanisms. Abbreviations: Down, down‐regulated; mo, months; UP, up‐regulated.
Supporting information
Supported by the National Institutes of Health (grants R01DK102597 and R01CA159942 to N.T.) and Cincinnati Children's Hospital Medical Center Internal Development Funds (to N.T.).
Potential conflict of interest: Nothing to report.
References
Author names in bold designate shared co‐first authorship.
- 1. Benedict M, Zhang X. Non‐alcoholic fatty liver disease: an expanded review. World J Hepatol 2017;9:715‐732. [DOI] [PMC free article] [PubMed] [Google Scholar]
- 2. Jin J, Valanejad L, Nguyen TP, Lewis K, Wright M, Cast A, et al. Activation of CDK4 triggers development of non‐alcoholic fatty liver diseases. Cell Rep 2016;16:744‐756. [DOI] [PMC free article] [PubMed] [Google Scholar]
- 3. Lewis K, Valanejad L, Cast A, Wright M, Wei C, Iakova P, et al. RNA binding protein CUGBP1 inhibits liver cancer in a phosphorylation‐dependent manner. Mol Cell Biol 2017;37:pii:e00128‐17. [DOI] [PMC free article] [PubMed] [Google Scholar]
- 4. Huang SJ, Cheng CL, Chen JR, Gong HY, Liu W, Wu JL, et al. Inducible liver‐specific overexpression of gankyrin in zebrafish results in spontaneous intrahepatic cholangiocarcinoma and hepatocellular carcinoma formation. Biochem Biophys Res Commun 2017;490:1052‐1058. [DOI] [PubMed] [Google Scholar]
- 5. Sakurai T, Yada N, Hagiwara S, Arizumi T, Minaga K, Kamata K, et al. Gankyrin induces STAT3 activation in tumor microenvironment and sorafenib resistance in hepatocellular carcinoma. Cancer Sci 2017;108:1996‐2003. [DOI] [PMC free article] [PubMed] [Google Scholar]
- 6. Jin J, Iakova P, Breaux M, Sullivan E, Jawanmardi N, Chen D, et al. Increased expression of enzymes of triglyceride synthesis plays is essential for the development of hepatic steatosis. Cell Rep 2013;3:831‐843. [DOI] [PMC free article] [PubMed] [Google Scholar]
- 7. Denechaud PD, Lopez‐Mejia IC, Giralt A, Lai Q, Blanchet E, Delacuisine B, et al. E2F1 mediates sustained lipogenesis and contributes to hepatic steatosis. J Clin Invest 2016;126:137‐150. [DOI] [PMC free article] [PubMed] [Google Scholar]
- 8. Guillory B, Jawanmardi N, Iakova P, Anderson B, Zang P, Timchenko NA, et al. Ghrelin deletion protects against age‐associated hepatic steatosis by downregulating the C/EBPα‐p300/DGAT1 pathway. Aging Cell 2018;17. [DOI] [PMC free article] [PubMed] [Google Scholar]
- 9. Nguyen P, Valanejad L, Cast A, Wright M, Garcia JM, El‐Serag HB, et al. Elimination of age‐associated hepatic steatosis and correction of aging phenotype by inhibition of cdk4‐C/EBPα‐p300 axis. Cell Rep 2018;24:1597‐1609. [DOI] [PMC free article] [PubMed] [Google Scholar]
- 10. Li J, Tsai MD. Novel insights into the INK4‐CDK4/6‐Rb pathway: counter action of gankyrin against INK4 proteins regulates the CDK4‐mediated phosphorylation of Rb. Biochemistry 2002;41:3977‐3983. [DOI] [PubMed] [Google Scholar]
- 11. Qian YW, Chen Y, Yang W, Fu J, Cao J, Ren YB, et al. p28(GANK) prevents degradation of Oct4 and promotes expansion of tumor‐initiating cells in hepatocarcinogenesis. Gastroenterology 2012;142:1547‐1558. [DOI] [PubMed] [Google Scholar]
- 12. Jiang Y, Iakova P, Jin J, Sullivan E, Sharin V, Hong IH, et al. Farnesoid X receptor inhibits gankyrin in mouse livers and prevents development of liver cancer. Hepatology 2013;57:1098‐1106. [DOI] [PMC free article] [PubMed] [Google Scholar]
- 13. Timchenko LT, Miller JW, Timhenko NA, DeVore DR, Datar KV, Lin L, et al. Identification of a (CUG)n triplet repeat RNA‐binding protein and its expression in myotonic dystrophy. Nucleic Acids Res 1996;24:4407‐4414. [DOI] [PMC free article] [PubMed] [Google Scholar]
- 14. Meola G, Jones K, Wei C, Timchenko LT. Dysfunction of protein homeostasis in myotonic dystrophies. Histol Histopathol 2013;28:1089‐1098. [DOI] [PubMed] [Google Scholar]
- 15. Jones K, Timchenko L, Timchenko NA. The role of CUGBP1 in age‐dependent changes of liver functions. Ageing Res Rev 2012;11:442‐449. [DOI] [PMC free article] [PubMed] [Google Scholar]
- 16. Valanejad L, Lewis K, Wright M, Jiang Y, D'Souza A, Karns R, et al. FXR‐Gankyrin axis is involved in development of pediatric liver cancer. Carcinogenesis 2017;38:738‐747. [DOI] [PMC free article] [PubMed] [Google Scholar]
- 17. D'Souza AM, Jiang Y, Cast A, Valanejad L, Wright M, Lewis K, et al. Gankyrin promotes tumor‐suppressor protein degradation to drive hepatocyte proliferation. Cell Mol Gastroenterol Hepatol 2018;6:239‐255. [DOI] [PMC free article] [PubMed] [Google Scholar]
- 18. Wang GL, Shi X, Haefliger S, Jin J, Major A, Iakova P, et al. Elimination of C/EBPalpha through the ubiquitin‐proteasome system promotes the development of liver cancer in mice. J Clin Invest 2010;120:2549‐2562. [DOI] [PMC free article] [PubMed] [Google Scholar]
- 19. Giles DA, Moreno‐Fernandez ME, Stankiewicz TE, Graspeuntner S, Cappelletti M, Wu D, et al. Thermoneutral housing exacerbates nonalcoholic fatty liver disease in mice and allows for sex‐independent disease modeling. Nat Med 2017;23:829‐838. Erratum. In: Nat Med 2017;23:1241. [DOI] [PMC free article] [PubMed] [Google Scholar]
- 20. Yamaguchi K, Yang L, McCall S, Huang J, Yu XX, Pandey SK, et al. Inhibiting triglyceride synthesis improves hepatic steatosis but exacerbates liver damage and fibrosis in obese mice with nonalcoholic steatohepatitis. Hepatology 2007;45:1366‐1374. [DOI] [PubMed] [Google Scholar]
- 21. Reebye V, Sætrom P, Mintz PJ, Huang KW, Swiderski P, Peng L, et al. Novel RNA oligonucleotide improves liver function and inhibits liver carcinogenesis in vivo. Hepatology 2014;59:216‐227. [DOI] [PMC free article] [PubMed] [Google Scholar]
- 22. Huan H, Wen X, Chen X, Wu L, Liu W, Habib NA, et al. c/ebpα short‐activating rna suppresses metastasis of hepatocellular carcinoma through inhibiting EGFR/β‐catenin signaling mediated EMT. PLoS ONE 2016;11:e0153117. [DOI] [PMC free article] [PubMed] [Google Scholar]
- 23. Voutila J, Reebye V, Roberts TC, Protopapa P, Andrikakou P, Blakey DC, et al. Development and mechanism of small activating RNA targeting CEBPA, a novel therapeutic in clinical trials for liver cancer. Mol Ther 2017;25:2705‐2714. [DOI] [PMC free article] [PubMed] [Google Scholar]
- 24. Reebye V, Huang KW, Lin V, Jarvis S, Cutilas P, Dorman S, et al. Gene activation of CEBPA using saRNA: preclinical studies of the first in human saRNA drug candidate for liver cancer. Oncogene 2018;37:3216‐3228. [DOI] [PMC free article] [PubMed] [Google Scholar]
- 25. Cast A, Valanejad L, Wright M, Nguyen Ph, Gupta A, Zhu L, et al. C/EBPα‐dependent preneoplastic tumor foci are the origin of hepatocellular carcinoma and aggressive pediatric liver cancer. Hepatology 2018;67:1857‐1871. [DOI] [PMC free article] [PubMed] [Google Scholar]
Associated Data
This section collects any data citations, data availability statements, or supplementary materials included in this article.
Supplementary Materials


