

Abstract
Expectations about the environment influence motor behavior. In simple tasks, for example, prior knowledge about which stimulus event will likely occur or which response will likely be rewarded induces a tendency to take the favored action (i.e., a motor or response bias), especially when sensory information is sparse or ambiguous. Models of choice behavior account for this bias by weighting decision alternatives unequally, either at an early sensory-input stage or at a downstream motor-output stage. These two alternatives can be distinguished empirically; the former predicts an altered percept that correlates with motor bias, the latter predicts no perceptual effect. By varying the prior probability of target or reward location, we induced biased oculomotor responses in a brightness selection task with human subjects. We found that the induced motor bias was correlated with an amplification of both the sensory signals and internal noise underlying brightness perception, without a systematic change in perceived overall brightness. We also found that the magnitude of the sensory amplification was correlated with the amount of noise in the brightness percept, consistent with a multiplicative weighting factor located downstream from the limiting internal sensory noise. Our data demonstrate that prior knowledge (about target location or reward) shapes visual signals for perception and action in parallel but does not improve the quality (i.e., signal-to-noise ratio) of sensory processing.
Keywords: saccade, attention, basal ganglia, superior colliculus, frontal eye field, lateral intraparietal area
Introduction
Manipulating behavioral context changes how animals respond to sensory stimuli. For example, behavior-shaping paradigms can reliably induce a motor bias (i.e., a tendency to favor one alternative action over another) favoring the alternative more likely to be correct (Tanner et al., 1956; Terman and Terman, 1972; McCarthy and Davison, 1984; Kustov and Robinson, 1996) or rewarded (McCarthy and Davison, 1984; Lauwereyns et al., 2002; Sugrue et al., 2004; Bendiksby and Platt, 2006; Ding and Hikosaka, 2006; Milstein and Dorris, 2007). In this study, we reproduced this classic response bias using saccadic eye movements: a ballistic, short-latency (∼200–250 ms) eye-movement response (Leigh and Zee, 2006). It is, however, unclear whether the observed motor bias reflects a modulation of sensory processing (which would also alter perception) or of downstream decision or motor-output mechanisms. Although previous observations (Green and Swets, 1966; McCarthy and Davison, 1984) are consistent with either mechanism, we performed an experiment to distinguish between the two (Fig. 1).
Figure 1.

Candidate loci for bias effect. Models of choice behavior account for bias in motor responses by weighting the alternatives, at either the level of sensory processing (w1 and w2), consistent with an “attentional” interpretation, or a downstream motor-response stage (w3), consistent with statistical theories that maintain a clear distinction between sensory and decision variables. The two possible attentional weights are placed before and after the performance-limiting additive internal noise (σv), representing early and late modulations of visual processing, respectively. A weight placed before the noise (w1) would enhance sensory processing by preferentially scaling signal with respect to internal noise, whereas a weight placed after the noise (w2) would scale both equally; both predict effects on perception. A weight acting exclusively downstream from the sensory processing supporting perception (w3) predicts that perception would remain unaltered.
Output explanations for response bias predominate (Fig. 1, w3). Signal detection theorists posit that sensory evidence remains fixed, whereas an altered response criterion induces bias (Swets, 1961; Green and Swets, 1966). Choice theory allows alternative signals to be weighted differently but again downstream of a fixed sensory input (Luce, 1986). Either way, bias arises from modulation at a decision or motor stage (w3), leaving sensory inputs veridical and perception thus unchanged. Conversely, although earlier weights (Fig. 1, w1 and w2) that alter sensory processing (Torgerson, 1958) have not been generally implicated in mechanisms of response bias, an early sensory weight is indeed possible and consistent with models of attentional modulation of perception. A weight before the addition of internal noise (w1) predicts an increase in the signal-to-noise ratio (SNR) of visual processing (Reynolds et al., 2000; Carrasco et al., 2004), whereas a weight after the addition of internal noise (w2) predicts no change in the signal-to-noise ratio (McAdams and Maunsell, 1999; Williford and Maunsell, 2006).
In the present study, we used a two-stage sequential motor-perceptual task to induce bias in saccade choices and to measure the associated percept. The first stage required observers to make a saccadic response, which we biased by varying the a priori probability of target location or the probability of reward based on location. This induced saccadic bias was correlated with changes in perceptual responses to sensory signals and internal noise, but we observed no systematic change in perceived overall brightness. Our study demonstrates that prior knowledge (about target location or reward) shapes perception and action in parallel, ruling out neural mechanisms that place the modulation either (1) exclusively downstream from the sensory processing supporting perception or (2) upstream from the performance-limiting source of internal noise. These results are consistent with a sensory weighting factor that scales both sensory signals and internal noise to guide both perception and motor behavior using an amplification mechanism (McAdams and Maunsell, 1999) followed in contrast normalization (Heeger, 1992, 1993), rather than an increased sensitivity mechanism (Reynolds et al., 2000; Carrasco et al., 2004).
Materials and Methods
Task.
On each trial, subjects fixated a central cross for a randomized duration drawn from a truncated exponential distribution (Luce, 1986; Palmer et al., 2005) (mean, 700 ms; minimum, 200 ms; maximum, 5000 ms) to defeat possible temporal expectation of stimulus onset. Subjects were instructed to perform a two-stage task requiring a moderately difficult saccadic decision followed by a perceptual decision (Fig. 2). In the first stage, two bright disks appeared on a background of pixel noise, 6° to the left and right of fixation, and subjects were instructed to make a saccade to the brighter of the two disks in a simultaneous two-alternative forced-choice (2AFC) motor task. They did so with a median latency of 247 ± 52 ms (mean ± SD across observers of median latency), indicating that the oculometric decisions in our task resulted from normal short-latency saccadic processes (Carpenter, 1981; Carpenter and Williams, 1995; Leigh and Zee, 2006). These open-loop saccades (see below) tended to be hypometric, with average amplitude of 3.0 ± 1.1° (mean ± SD across observers; range, 1.2–4.4°). Even within subjects, saccade amplitude varied considerably across trials, with an average SD of 0.6° (range, 0.5–1.0°). However, independent of this variability in saccade metrics, a binary “oculometric” saccadic choice was deemed “correct” if its horizontal component (leftward or rightward direction) was toward the brighter disk (Eckstein et al., 2001). The proportion of correct saccades in the 2AFC motor task was 0.69, averaged across subjects and bias conditions (range, 0.62–0.79).
Figure 2.

Two-stage task. The three images depict the three intervals of a trial, with eye position shown as a transparent red circle. After fixating a central cross for a randomized duration (leftmost image), two disks (the target and distractor) appeared on either side of fixation (±6°) added to a noisy background (middle image). Subjects were first asked to make a 2AFC saccadic choice (e.g., rightward-pointing red arrow) to the brighter disk (the target). After saccade onset, the saccade-target stimulus and central cross were extinguished and replaced by a test disk visible for 250 ms (rightmost image). Subjects were then asked to report via a button-press response whether the earlier saccadic choice (the peripherally selected right-hand disk in the middle image) or the later test disk (the peripherally viewed central disk in the rightmost image) appeared brighter in a 2IFC perceptual choice. The spatial eccentricity and exposure duration were thus approximately matched for the 2AFC motor choice and the 2IFC perceptual choice.
In the second stage, after initiation of the saccade (detected using a 1° position threshold during the online analysis), the two disks and central cross were extinguished and the latter was replaced by a test disk visible for only 250 ms. Thus, saccades were made without the benefit of visual feedback about localization accuracy (i.e., were open-loop), and we grossly matched the visual processing time and stimulus eccentricity for the motor and perceptual discriminations (Eckstein et al., 2001; Beutter et al., 2003). Observers were then asked to report whether the disk selected by the saccadic choice or the later test disk was brighter in a sequential two-interval forced-choice (2IFC) perceptual task, using a button press to indicate their perceptual choice.
We used the traditional psychophysical methodology of button-press responses to report a 2IFC perceptual decision (Thurstone, 1927; Fechner et al., 1966; Green and Swets, 1966). Why do we consider the mouse click a perceptual response and the saccade a motor response? The saccadic response is a short latency (∼250 ms), ballistic action whose continuous spatial metrics are naturally linked to the spatial properties of the stimulus and not necessarily linked to any conscious decision (indeed, one's subjective impression is often that the eyes do not always go where one wants them to). The mouse click is a longer latency (∼750 ms), thoughtful action that one can delay pending a deliberate decision and whose binary spatial metrics are arbitrarily mapped to encode a temporal 2IFC decision. These qualitative differences allow us to categorize the latter decision as “perceptual” as opposed to “motor.”
Behavioral paradigms and bias conditions.
We used two different contextual paradigms to induce oculomotor response bias: asymmetric prior probability and asymmetric reward schedule. Within each behavioral paradigm, there were three conditions: one favoring the right location, one favoring the left, and one neutral condition.
The prior-probability paradigm manipulated the probability that the brighter stimulus would appear in a particular location, giving the subject some prior knowledge about target location. Data for this paradigm were collected in six experimental sessions for each observer (except one, for whom only four experimental sessions were run), each consisting of the three conditions (75% rightward, 50% rightward, and 25% rightward in random order) in blocks of 200 trials. The observers were explicitly told of these prior probabilities before running each block, and all correct saccadic choices were deterministically (probability of 1.0) rewarded with an auditory tone during the intertrial interval.
The reward-schedule paradigm kept equal the prior probability that the brighter stimulus would appear at either of the two locations but differentially rewarded choices at the two locations according to a predetermined reward ratio. Using a reinforcement schedule developed in pigeon experiments (McCarthy and Davison, 1984), we randomly assigned one of the two targets as “rewardable” with a fixed probability of 10, 50, or 90% (reinforcement ratios of 1:9, 1:1, and 9:1), depending on the condition. A reward was dispensed when the rewardable target was correctly chosen, and the randomization proceeded anew. This reinforcement schedule never rewards an incorrect saccade, guarantees that the obtained ratio of rewards for the two locations will be nearly equal to the predetermined reward ratio (within binomial error), and has the unique property that the obtained reward ratio cannot covary with the performance bias (McCarthy and Davison, 1984). The data for the reward paradigm were collected in nine sessions consisting of six blocks of 200 trials (two for each of three reward conditions: 90% rightward, 50% rightward, and 10% rightward, in random order). Again, the subjects were explicitly informed of the bias condition before each block, and stochastically rewarded saccades were reinforced with auditory tones during the intertrial interval as described above.
Observers were trained to asymptotic performance (no systematic increase in performance on the 2AFC motor task from the previous session) before experimental data were collected. Two subjects were trained partially and then excluded from the experiment: one subject failed to perform above chance for perceptual discriminations in one visual hemisphere, another subject showed square-wave jerk eye movements, which generated an unacceptable level of false alarms with the saccade-contingent display.
Human subjects.
We report data from five human subjects (three naive to the purpose of the experiment), all of whom gave informed consent for their participation in the studies. For the prior-probability paradigm, we collected data from all five subjects, and, for the reward-schedule paradigm, we collected data from three (one naive) of these same five subjects, for a total of eight cases. A human use protocol was approved for this research by the NASA Ames Institutional Review Board (protocol HRII-06-25). Naive subjects were paid hourly for their participation ($10/h) and were paid an additional monetary incentive (maximum of $15.00) corresponding to rewards accumulated during the course of a session. Subjects were informed as to the prior probability or reward ratio before each block of trials and were encouraged to maximize their take-home pay (Green and Swets, 1966).
Experimental setup and eye-movement recording.
The experiment was executed using a Linux personal computer running custom-built software that controlled the timing of the experiment, displayed the stimuli, acquired the eye-position data, and saved it to disk. All display events were recorded in the output data file, allowing precise (1 ms) registration with the eye-position data. Stimuli were displayed on an EIZO FlexScan T966 monitor with 1024 × 768 resolution, calibrated to have maximum luminance of 80.0 cd/m2, gamma-corrected using a lookup table.
We sampled eye position at 240 Hz with a custom-built ISCAN eye-tracker, synchronized with the vertical refresh of our 60 Hz monitor. The eye-position traces were calibrated with six parameters (gain, offset, and cross-terms for horizontal and vertical) (Beutter and Stone, 1998) fit to the raw digital values for fixations at nine screen locations, which yielded a sample precision of better than 0.3° (SD of eye-position while fixating) and a fixation precision of ∼0.01° (SEM eye-position across a fixation). In the offline analysis, saccades were detected by taking the correlation between a saccade-shaped velocity template and the horizontal eye-velocity trace (Krukowski et al., 2003). We defined the binary oculometric decision and latency to be sign of the amplitude and onset time, respectively, of the first saccade larger than 0.5°. Trials containing back-to-back saccades to both locations (i.e., two saccades occurring within 200 ms of one another, or movements that turned around in midflight) were discarded. We also measured the horizontal location of eye position at the end of the fixation interval to determine whether the presaccadic fixation position varied across bias conditions. There was no systematic tendency across subjects to “lean” either toward or away from the favored location (p > 0.05, paired t test across subjects).
Stochastic signal strength.
We used stochastic, noisy stimuli in this study. To create each stimulus image, we started with a full-field background of Gaussian pixel noise (37.6 ± 8.2 cd/m2). For the 2AFC motor task, two Gaussian-blurred (σ = 1 pixel) disks of diameter 0.6° (15 pixels) were added to the background, 6° to the right and left of the central fixation cross, each framed by a black bounding box. Both disks were brightness-scaled versions of one original “signal template” that was normalized so as to have unit energy with respect to the background noise (i.e., d′ for the ideal observer was 1.0); the “target” disk was scaled by a factor of 5.5 (a peak luminance of 6.3 cd/m2 above the background), and the “distractor” disk was scaled by a factor of 4.2 (peak luminance of 4.7 cd/m2 above the background). For each stochastic stimulus created, the signal strength for each specific instantiation (Gaussian-blurred disk plus background noise) was computed by calculating its detectability in d′ units (Green and Swets, 1966). This d′ value is the square root of the energy in each stimulus instance (the magnitude of the projection of the signal template onto the stimulus) divided by the SD of the background pixel noise (Burgess et al., 1981; Eckstein et al., 2001). The target and distractor disks were both easily detectable above the background noise, with distribution means reflecting the scaling (i.e., the signal strength ±SD of target disks was 5.5 ± 1.0 d′ units and that of distractor disks was 4.2 ± 1.0 d′ units so the overall discriminability for the 2AFC motor choice task was only 1.3).
The test stimuli for the 2IFC perceptual choice were created and quantified in the same way as those for the 2AFC motor choice. In the prior-probability paradigm, the signal strength of the test disk was drawn at random from 10 Gaussian-distributed levels (range, 4.0–7.0 ± 1.0 d′ units) and presented according to the method of constant stimuli. In the reward-schedule paradigm, the signal levels of the test disk varied over a large range (across five SNR levels ranging from 0.0 to 14.1 ± 1.0 d′ units) and were presented within a one-up-one-down staircase. Given that the signal strength in both paradigms was stochastic, after the experiment, all trials were rebinned according the actual sample signal strength as described above.
Data analysis.
The eye-position traces for each trial were visually inspected. Trials with blinks, saccades that turned around in midflight, or back-to-back saccades to both locations were eliminated (6–11% of total trials across subjects). Furthermore, to guarantee that the perceptual judgments were based on peripheral viewing, we only included trials for which the saccade-contingent display change occurred within one frame (16 ms) of the saccade end (culling an additional 6–9% of trials) in the data presented. A worst-case control analysis of the data for which the display change occurred before the end of the saccade was noisier (6–37% of trials had to be discarded) but yielded qualitatively similar results.
Oculometric analysis.
Oculometric analysis treats eye movements as discrete choices, which allows us to quantify precision and bias as with a psychometric function (Beutter et al., 2003; Stone and Krauzlis, 2003). In Figure 3A–C, we quantify oculometric bias by plotting the proportion of leftward saccadic responses as a function of the difference in signal strength between the left and right disks (ΔS). Thus, the probability of a leftward saccadic choice as a function of the difference in d′ between the left and right disks (ΔS) is given by the following:
 |
The oculometric functions shown in Figure 3 are cumulative Gaussian fits to Equation 1 with two free parameters, μ and σ, using a Probit analysis (Finney, 1971). The mean of this function (μ) provides an objective measure of overall saccadic response bias.
Figure 3.

Oculometric functions for one naive subject. A–C, Each plot the proportion of leftward saccades (±1 binomial SEM) as a function of the difference in stimulus strength between the left and right disks, for the indicated prior probability condition. The smooth functions are cumulative Gaussian fits to the data using Equation 1, with the saccade bias (μ in Eq. 1) indicated by the vertical dashed line.
The above oculometric analysis was used to compute quantitatively the effect of our experimental conditions on the statistics of discrete saccadic decisions (the binary choice between a leftward or rightward stimulus) and to relate them to those of discrete perceptual decisions (quantified using the psychometric and signal-detection-theory analyses described below). However, to confirm that our “discrete” oculometric analysis (Eckstein et al., 2001) captured the impact of our experimental manipulations on oculomotor behavior, we also examined the effect of our bias conditions on “continuous” saccadic metrics within our motor task. We found only small, inconsistent changes in saccade amplitude across bias condition (see Fig. 8A,B), despite the dramatic and systematic changes in saccade decision behavior documented by our oculometric analysis (see Figs. 3, 4). We also confirmed the well known effect of behavioral bias on response time (see Fig. 8C,D).
Figure 8.

Analysis of saccade metrics. A compares the mean amplitude of saccades made to the favored and unfavored locations. Each circle represents data from one case (1 subject in 1 bias paradigm), and the 95% confidence interval is smaller than the circle in all cases. B compares the median latency of saccades made to the favored and unfavored locations (same conventions as A). Again, the 95% confidence interval is smaller than the circle in all cases. C shows the average saccade amplitude, normalized within subject (by dividing by the subject's average amplitude across conditions and saccade directions) plotted as a function of bias condition (U, unfavored; N, neutral; F, favored; p = 0.44, one-way ANOVA). Error bars represent SEM across cases and saccade directions. D shows the average saccade latency, normalized within subject (by dividing by the subject's average latency across conditions and saccade directions) plotted as a function of bias condition (p < 0.0001, one-way ANOVA).
Figure 4.

Saccade bias. A shows the average saccade bias (±SEM across 5 subjects) for the three prior-probability conditions. B shows the average saccade bias (±SEM across 3 subjects) for the three reward conditions.
Psychometric analysis.
The perceptual task allowed us to quantify three aspects of an observer's perception: perceived overall brightness, perceptual gain, and perceptual noise. Perceived overall brightness is defined as the perceived brightness averaged over all trials (PSE in Eq. 2). Perceptual gain (G in Eq. 4) is defined as the slope of the function relating subjective perceived brightness to objective physical signal level. Perceptual noise (σ in Eqs. 3 and 4) is defined as the amount of uncertainty in the percept (i.e., the SD of the psychometric curve).
For a given condition, we first pooled the psychophysical data across all trials for each subject (collapsing across all d′ values, correct and incorrect responses, sessions, etc.) and fit the resulting the overall psychometric curve with a cumulative Gaussian (see Fig. 6A,B). The probability that a test disk of brightness T appeared brighter than the saccade-target is then given by the following:
 |
The overall psychometric functions shown in the top row of Figure 6 are cumulative Gaussian fits to Equation 2 with two free parameters, PSE and σ. Although the mean of this function (i.e., the classic point of subjective equality or PSE) gives a reliable measure of perceived overall brightness, these fits collapse across the variability in the signal strength of the saccadic target.
Figure 6.
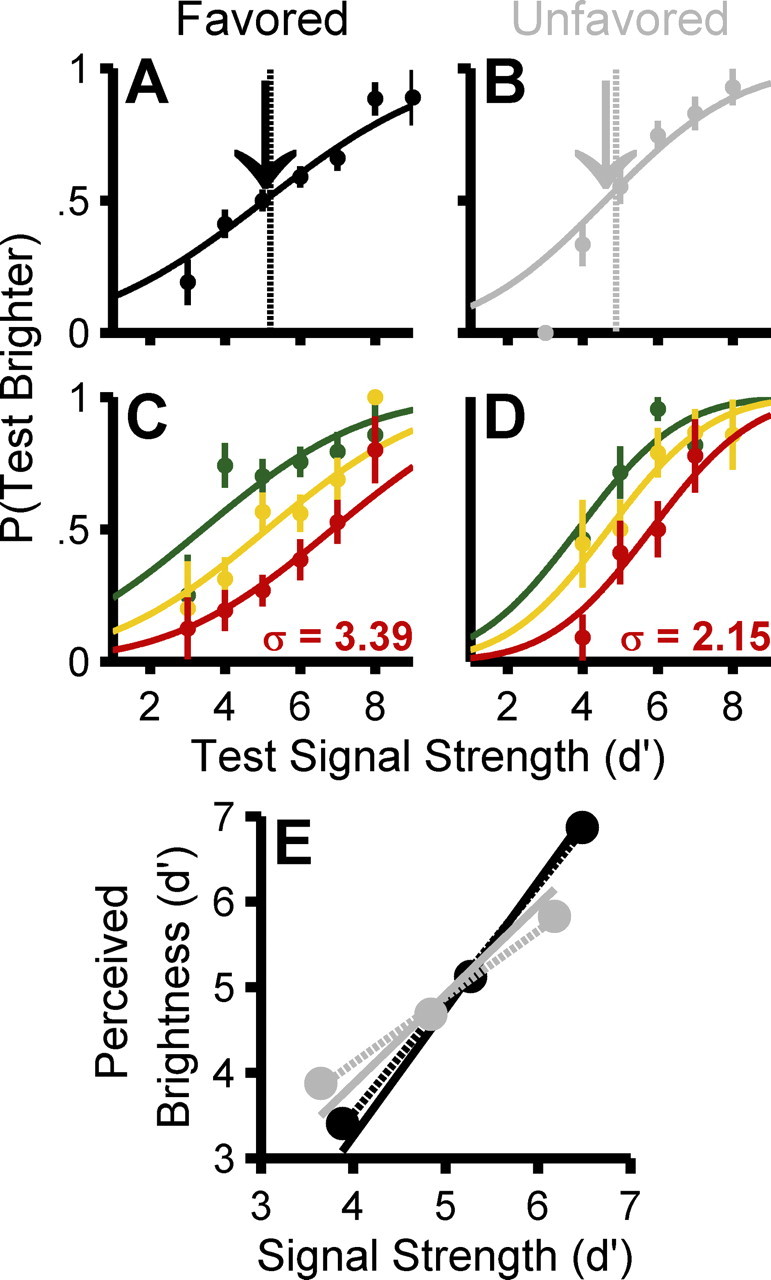
Example raw psychometric data for one naive subject from two experimental runs. Top panels show “saccade-choice-triggered” psychometric functions plotting the proportion of “test brighter” responses as a function of the signal strength of the test stimulus at the favored (A) and unfavored (B) locations (±1 binomial SEM). The vertical dashed line indicates the mean objective signal strength; the arrow shows the PSE of the cumulative Gaussian fit to the data from Equation 2 (perceived overall brightness). C and D show psychometric functions with the luminance distribution of the saccadic-target strength subdivided into thirds. The shift between these functions shows the change in perceived brightness as a function of the physical signal strength of the chosen stimulus increased (perceptual gain). The shallowness of these functions quantifies the amount of uncertainty in the perceptual response (perceptual noise). For clarity, all psychometric functions (A–D) only plot points derived from at least four trials. In E, the filled circles plot perceived brightness (PSEs of the 3 psychometric curves from Eq. 3) as a function of signal strength at the favored (black) and unfavored (gray) locations. Dashed lines show a linear regression across these three points (favored slope, 1.33; unfavored slope, 0.77); solid lines show a continuous fit to the psychophysical data using Equation 4 (favored slope, 1.49; unfavored slope, 1.05). Both methods indicate higher perceptual gain at the favored location. All subsequent figures report quantitative measures of perceptual gain using the continuous measure, but the results are qualitatively similar using the binned method.
To take advantage of this variability and thus determine the perceptual gain, we first binned the distribution of chosen signal strengths into thirds, constructing psychometric functions for each bin (see Fig. 6C,D). We then fit the three curves using Equation 3 with three independent PSEs but a single σ for each condition. These fits were then be used to quantify perceptual gain (G) by linear regression of the relationship between the three PSEbin parameters and the average stimulus brightness of the bin (Sbin), i.e., by fitting PSEbin = G * Sbin + Δ. However, this approach still has the disadvantage of collapsing across all signal strengths within each of the three bins:
 |
To maximize power in our dataset, we performed a continuous fit to Equation 4, effectively giving each point its own “bin,” using a three-parameter fit that again assumes a fixed perceptual noise within each condition (σ) and a linear relationship between perceived brightness (B) and the actual brightness (S) of the disk chosen by a saccade such that B = G * S + Δ for each particular instance of S:
 |
To quantify the variability in our estimates of perceptual gain and noise for favored and unfavored choices, we made 1000 bootstrapped measurements of each. To make a bootstrapped measurement, we sampled N trials with replacement from the original dataset of N trials (i.e., some trials did not occur in the sampled set, other trials occurred multiple times). The added power and lower degrees of freedom of the continuous fit over the linear regression across three separate binned fits yielded ∼20% less variability, based on the SD of the bootstrapped measurements (11% decrease for perceptual gain, 34% decrease for perceptual noise). The best-fitting estimates of G (perceptual gain) and σ (perceptual noise) for the three-bin and continuous fits were, however, similar (see Fig. 6E) and well correlated (gain, r = 0.93; noise, r = 0.83).
Results
Induced motor bias in saccade responses
To examine the relationship between the neural signals shaping oculomotor responses and those modulating visual perception, we induced a response bias in saccadic eye-movement behavior and measured the associated brightness percept using a two-stage task. The first stage consisted of a motor selection; subjects were required to saccade to the brighter of two Gaussian disks of different brightness (Fig. 2, middle). The median saccadic latency across observers ranged from 179 to 309 ms, typical of normal, short-latency, ballistic saccades (Carpenter, 1981; Carpenter and Williams, 1995; Leigh and Zee, 2006). Using standard asymmetric probability and reward paradigms (see Materials and Methods), we shaped behavior by inducing a preference for one saccadic response, illustrated by the systematically shifted oculometric functions (Eckstein et al., 2001; Beutter et al., 2003) in Figure 3. This classic behavioral effect (Green and Swets, 1966; Terman and Terman, 1972; McCarthy and Davison, 1984) was significant in all cases (p < 0.001, within-subject ANOVA), with similar results for the asymmetric-probability and asymmetric-reward paradigms. Figure 4 shows the well behaved average trend in saccade bias as a function of prior probability of target location (Fig. 4A) and reward schedule (Fig. 4B).
Model predictions
Monte Carlo simulations of the three hypotheses (Fig. 1) are shown in Figure 5. A mechanism that alters motor-output signals (Fig. 5A) to achieve bias predicts no change in perception (Fig. 5, compare D, G), whereas sensory-input mechanisms (Fig. 5B,C) that modulate visual processing predict perceptual changes (Fig. 5, compare E, H; F, G, respectively), with important changes evident in visual accuracy and precision (Fig. 5J–L). First, we quantified the gain of perception by measuring the change in perceived brightness as a function of changes in physical signal strength (i.e., the perceptual response to increments in sensory signals). For example, by subdividing the distribution of chosen signal strengths into thirds (Fig. 5D–I), three separate psychometric functions can be generated to quantify the perceived brightness for binned levels of stimulus brightness. The perceptual gain (i.e., the ratio of the shift between the psychometric means to the actual shift in mean signal strength) quantifies the relationship between perceived brightness and physical signal strength (an accuracy metric). The perceptual noise (i.e., the shallowness of psychometric curves) quantifies the performance-limiting internal neural noise (a precision metric).
Figure 5.

Simulations of candidate mechanisms. A–C illustrate three possible perceptual pathways shown in Figure 1, each representing a putative location for the modulation. The middle rows (D–I) show predicted perceptual responses for each of these models, for a simulated psychophysical choice for a favored stimulus (D–F, weighted by a factor of 2.0) or an unfavored stimulus (G–I, weighted by a factor of 0.75). In each case, the simulated observer compares the weighted sensory signal with a neutral test stimulus and chooses the “brighter” of the two. For each model, three psychometric curves were constructed from trials using the dimmest, middle, and brightest third of the stimulus luminance distribution, respectively. These three curves illustrate the effect of hypothetical weighting factors on input sensory signals and internal noise: weighting factors that scale sensory signals amplify the shift between the means of the psychometric functions (E vs H, F vs I), but the motor weighting model (D vs G) does not; weighting factors that occur downstream of internal sensory noise decrease the slopes of the psychometric curves (F vs I), but the early visual weighting (E vs H) or motor weighting (D vs G) models do not. The bottom row of J–L shows the predicted relationship between perceptual noise (i.e., SD of the cumulative Gaussian fits) and perceptual gain (i.e., shift between the means of the cumulative Gaussians for the 3 curves) for 20 uniformly distributed weight levels (0.5–2.0) for each model. For the motor model, perceptual gain and noise vary stochastically around a single fixed value (J). For the two visual weighting models, perceptual gain converges to w and perceptual noise varies around a fixed value (K); for the late visual weighting model, perceptual gain and noise covary (L).
The three models make distinct predictions about perceptual gain and noise effects. A modulation of motor-output pathways (Fig. 5A) leaves perceptual processing unaltered and serves as a useful comparison because perception remains veridical. An early visual modulation (Fig. 5B) directly amplifies the sensory signal before the addition of internal noise. A late visual modulation (Fig. 5C) also amplifies the sensory signal but downstream of the limiting internal noise. A–C show explicit simulations of the relationship between perceptual gain and perceptual noise for the three candidate mechanisms. Changes in a motor weight downstream of perceptual processes (Fig. 5A) predict no systematic changes in either perceptual gain or noise (Fig. 5J). Changes in an early visual weight (Fig. 5B) amplify sensory signals but not internal noise, predicting changes in perceptual gain but no change in perceptual noise (Fig. 5K). Changes in a late visual weight (Fig. 5C) amplify sensory signals and internal noise together, predicting correlated changes in perceptual gain and noise (Fig. 5L). Note that, although both sensory mechanisms predict variation in perceptual gain, only the late visual mechanism predicts covariation of perceptual gain and perceptual noise.
Modulation of the associated percept
The second stage of our task (Fig. 2, right panel) consisted of a perceptual discrimination requiring subjects to decide whether a test disk was brighter or dimmer than the disk chosen in the first interval (i.e., the stimulus targeted by the saccade). By using a two-stage choice task, we were able to measure a subject's perception of the target disk independent of the distractor, because the target was compared with a third, neutral, test stimulus. From each subject's data, we performed three perceptual analyses (see Materials and Methods). First, we measured overall perceived brightness at the favored and unfavored location as the mean of the psychometric function constructed from all trials. In Figure 6, A and B, for this subject, the mean at favored (black arrow) and unfavored (gray arrow) locations were indistinguishable from each other (p > 0.05, bootstrap test), indicating no difference in perceived overall brightness between the two locations. Second, we quantified the perceptual response to increases in sensory signal strength by plotting separate psychometric curves for the dimmest, middle, and brightest third of saccade targets (Fig. 6C,D). These binned curves illustrate the two perceptual effects: (1) the horizontal shifts in PSEs were greater in C than in D (i.e., perceptual gain increased), and (2) the psychometric functions were shallower in C than in D (i.e., perceptual noise increased). Linear regression of the three PSE measures was then used to calculate perceptual gain (Fig. 6E, dashed lines). Third, for each condition and location, we directly computed the perceptual intensity function relating the subjective psychometric response to the objective physical luminance for each presentation and used the best-fitting linear slope parameter (G) to quantify perceptual gain (Fig. 6E, solid lines) and the best-fitting uncertainty parameter (σ) to quantify perceptual noise, by performing a continuous fit to the data using Equation 4 (see Materials and Methods).
To assess the robustness of these effects, we compiled the three perceptual measures across observers and conditions (Fig. 7A–C). First, perceived overall brightness at favored and unfavored locations did not differ (p = 0.81, paired t test across all eight cases). To reduce the blurring caused by averaging across the brightness of the saccade choices and thus to increase our statistical power to detect small effects, we repeated this analysis as a function of the brightness difference between the test and saccade-chosen stimulus instead of the test brightness alone, but the difference between the overall perceived brightness at the favored and unfavored locations remained indistinguishable (p = 0.46, paired t test across cases). Second, perceptual gain was significantly higher at favored locations, with a mean difference of 0.18 (range, 0.02–0.30; p < 0.001, paired t test). Third, perceptual noise was also greater at favored locations, with a mean increase of 0.22 d′ units (range, −0.08 to 0.65; p < 0.05, paired t test across cases). Thus, both the responsiveness to sensory signals and the level of internal noise were elevated for percepts at the favored location relative to the unfavored location. To compensate for the large variability across subjects, we normalized the data for each subject (by dividing by the subject's average measurement across the three bias conditions and two saccade directions) and plotted the normalized perceptual measurements as a function of bias condition (Fig. 7D–F). We observed significant correlations between bias condition and normalized perceptual gain (p < 0.01, Pearson's R, r = 0.35) and perceptual noise (p < 0.01, Pearson's R, r = 0.35) but not overall brightness (p = 0.44, Pearson's R, r = 0.02).
Figure 7.

Perceptual effects. The top row compares three perceptual metrics at the favored and unfavored locations (A, overall perceived brightness; B, perceptual gain; C, perceptual noise) by plotting their means across all eight cases (5 subjects in asymmetric prior-probability paradigm, and 3 in the asymmetric reward paradigm). Error bars represent the one-tailed 95% confidence intervals of the bootstrapped measurements, justified by the a priori hypothesis that the favored condition would yield higher values. For perceptual gain, these increases were significant in seven of eight individual cases (p < 0.05, bootstrap test). For perceptual noise, these increases were significant in three of eight individual cases (p < 0.05, bootstrap test). The bottom row (D–F) shows the average perceptual measures, normalized within each subject's data, plotted as a function of bias condition (U, unfavored; N, neutral; F, favored). Error bars represent SEM across cases and directions (8 cases × 2 directions). Whereas bias condition has significant effects on normalized perceptual gain (p < 0.05, one-way ANOVA) and normalized perceptual noise (p < 0.05, one-way ANOVA), there were no such effects on normalized overall brightness (p = 0.80, one-way ANOVA). The raw measures of overall brightness and perceptual noise have the units of the stimulus (d′), perceptual gain and the normalized measures are unitless. A contains two data points that very nearly overlap (at 6,6).
Control for changes in saccade metrics
The 2AFC motor task required the subjects to make saccadic responses to visual targets about which they would later make perceptual discriminations. Given the systematic changes in perceptual responses (Fig. 7), we plotted saccade amplitude and latency on the same sets of axes to determine whether saccade metrics showed similar systematic changes. As shown in Figure 8A, the amplitudes of saccades to the favored location were not significantly different from those to unfavored locations (mean difference, −0.08°; range, −0.22 to + 0.12°; p > 0.05, paired t test across cases). We did, however, observe significant within-subject correlations (p < 0.05, Pearson's R) between bias condition and saccade amplitude in 11 of 16 instances (8 cases × 2 saccade directions), but these significant correlations had an average r of only 0.14 (range, −0.13 to +0.24), and the small within-subject amplitude differences between favored and unfavored condition (typically only a few tenths of a degree) were nearly evenly split between increases and decreases. Furthermore, the −0.08° average amplitude difference across cases was nearly an order of magnitude smaller than the within-subject variability in saccade amplitude (0.6°). Thus, an across-subject correlation analysis of saccade amplitude (normalized within subject by dividing by the average amplitude across conditions and saccade directions) shows no significant effect of bias condition (p = 0.19, Pearson's R, r = −0.13) (Fig. 8C).
It could, however, be argued that we had insufficient measurement or statistical power to resolve eye-position effects at or below of a degree, so we performed an additional control analysis. To further test the possibility that small differences in saccade amplitude across conditions might somehow have given rise to the observed perceptual modulations, we subdivided the saccade amplitude distribution into halves and examined perceptual gain increases (favored minus unfavored) for different pairings of the data subsets to examine the effect of post hoc imposed systematic differences in saccade amplitude. In the original dataset, we observed, on average, a perceptual gain increase of 0.18 and a noise increase of 0.22 d′ units with the amplitude of saccades to favored locations, on average, 0.08° smaller than those to unfavored locations. When the subset of trials associated with small-amplitude favored saccades was compared with that with large-amplitude unfavored saccades, the saccades to favored locations were, on average, 0.90° smaller than those to unfavored locations, but the perceptual gain effect of 0.15 and noise effect of 0.31 d′ units were indistinguishable from those obtained from all trials (gain, p = 0.68, paired t test across cases; noise, p = 0.52, paired t test across cases). When the subset of trials associated with large favored saccades were compared with that with small unfavored saccades, the saccades to favored locations were, on average, 0.90° larger than those to unfavored locations, but the perceptual gain effect of 0.21 and noise effect of 0.12 d′ units were again indistinguishable from those obtained with all trials (gain, p = 0.78, paired t test across cases; noise, p = 0.68, paired t test across cases). Thus, even if one artificially imposes systematic differences in saccade amplitudes between bias conditions, our main findings remain unchanged.
We did, as expected, observe significant changes in latency associated with favored choices. As shown in Figure 8B, saccades to the favored location occur with shorter latency than saccades to unfavored locations, with an average difference of 33 ms across observers (range, 19–55 ms; p < 0.0001, paired t test across cases). An analysis of saccade latency across observers (normalized within subject by dividing by the average latency across conditions and saccade directions) shows the well known effect of bias condition on response time (p < 0.0001, Pearson's R, r = −0.72) (Laming, 1969; Carpenter and Williams, 1995). Thus, response times for favored movements are shorter than for unfavored movements, ruling out the possibility that observed perceptual enhancement of favored stimuli resulted from a longer period of visual processing (i.e., the observed gain increase at favored locations cannot be attributable to a speed–accuracy tradeoff).
Correlation between perceptual and motor effects
The observed perceptual effects (Fig. 7) are directly related to the independently measured saccade response bias (Fig. 4). As shown in Figure 9, the correlation between the differences in the perceptual measures and the saccadic motor bias was significant for both perceptual gain (p < 0.01, Pearson's R, r = 0.54) and noise (p < 0.01, Pearson's R, r = 0.58) but not for perceived overall brightness (p > 0.05, Pearson's R, r = 0.30). We repeated this analysis by taking the ratios of the perceptual measures and found similar qualitative results (overall brightness, r = 0.34, p > 0.05; perceptual gain, r = 0.42, p < 0.05; perceptual noise, r = 0.61, p < 0.01).
Figure 9.

Linking changes in perceptual gain and noise with saccade bias. A–C each plot the change in these three perceptual measures (right minus left) as a function of saccade bias in the 2AFC motor task for the leftward (black), symmetrical (blue), and rightward (red) biased conditions for all eight cases (24 points in each panel); each symbol represents data from one case. Overall perceived brightness, perceptual noise, and saccade bias have the units of the stimulus (d′), perceptual gain is unitless.
Correlated changes in perceptual gain and noise
We also found a highly significant (p < 0.0001, Pearson's R, r = 0.68) relationship between perceptual gain and noise (Fig. 10A). As model predictions illustrate (Fig. 5L), this strong correlation is consistent with an early weighting factor that scales both the sensory signal and internal noise (but does not rule out additional weighting in motor-output pathways). The linear asymptotic slope at high perceptual gain is consistent with a sensory-processing mechanism that maintains a fixed signal-to-noise ratio. The non-zero asymptotic offset at low perceptual gain is inconsistent with a single source of visual internal noise (σv) but is consistent with additional additive perceptual noise (σp) downstream (Stone and Krauzlis, 2003). The addition of a downstream noise source (σp) significantly improves the fit (slope parameter only, reduced χ2 = 6.1; slope and offset parameters, reduced χ2 = 2.8; p < 0.0001).
Figure 10.

Linked perceptual gain and noise constrains the locus of bias weighting. A plots perceptual noise as a function of perceptual gain for both leftward (open symbols) and rightward (filled symbols) choices, all three biased conditions, and all eight cases (48 points). Each symbol shape represents data from one case. Across subjects, this correlation was significant (Pearson's R, r = 0.68, p < 0.0001); within subjects, the correlation was significant in five individual cases (p < 0.05). Perceptual noise has the units of the stimulus (d′); perceptual gain is unitless. B is a schematic of a mechanism that can account for all of our observations. An input sensory signal is perturbed by visual internal noise (σv). Both are then scaled by an extraretinal weighting factor (w) before the split between perceptual and motor-output pathways, thus accounting for the correlation between the gain and noise of the percept and between both of these and saccade bias. Additional sources of output noise (σp and σm) are then added to the scaled signal, introducing unshared variability into the percept and saccadic choices, predicting an overall perceptual noise of (solid black line in A). Last, a normalization process prevents the attentional weight from causing a change in perceived overall brightness.
Discussion
Our two-stage task requiring back-to-back motor and perceptual decisions reveals that standard manipulations known to induce a motor “response” bias (Figs. 3, 4) also generate changes in the accuracy and precision of the associated percept (Figs. 6, 7). Furthermore, the observed changes in perceptual gain and noise are correlated with the observed bias in motor choices (Fig. 9). Last, perceptual gain and noise covary across conditions (Fig. 10A). This ensemble of findings indicates that the neural modulation that shapes oculomotor behavior is implemented at a visual-processing stage shared with perception, yet after the dominant internal noise source (Fig. 5C, 10B). Signals related to saccade response bias have been reported in various visuomotor areas, including supplementary motor area (Coe et al., 2002), lateral interparietal area (Coe et al., 2002; Sugrue et al., 2004; Bendiksby and Platt, 2006), frontal eye fields (Coe et al., 2002; Thompson et al., 2005; Ding and Hikosaka, 2006), caudate nucleus (Lauwereyns et al., 2002; Ding and Hikosaka, 2006; Lau and Glimcher, 2007), and the superior colliculus (Kustov and Robinson, 1996; Basso and Wurtz, 1998; Dorris and Munoz, 1998; Horwitz and Newsome, 1999; Ikeda and Hikosaka, 2003; Fecteau et al., 2004; Milstein and Dorris, 2007), but our observed effect likely arises within earlier circuits in visual cortical areas (McAdams and Maunsell, 1999; Treue and Martinez Trujillo, 1999; Reynolds et al., 2000; Williford and Maunsell, 2006) that support brightness perception (Huang et al., 2002; Murphey and Maunsell, 2007).
Isn't this just a saccade-coupled shift in spatial attention?
The design of our experimental paradigm ensures that the visual stimulus we probed with psychophysics was always the target of an executed saccadic eye movement. As numerous reports have related, the mechanisms underlying eye movements and attention are fundamentally interconnected (Goldberg and Wurtz, 1972; Kowler et al., 1995; Gee et al., 2008), and it has even been suggested that motor circuits supported the evolution of attentional mechanisms (Rizzolatti et al., 1987; Sheliga et al., 1994; Kustov and Robinson, 1996). Given this interconnection, it could be argued that the observed perceptual effects would be expected from attentional modulations caused by, or linked to, the occurrence of the saccade.
Differences in the shifts of spatial attention driven by, or associated with, saccade occurrence, however, cannot explain our findings. First, saccade occurrence per se (and any saccade-coupled shift in spatial attention) cannot explain the differential nature of the observed perceptual effects because our perceptual measures were always made with respect to favored and unfavored locations targeted by a saccade. Second, the systematic difference in perceptual gain and noise (Fig. 7) at the favored and unfavored location were not associated with any systematic difference in the amplitude of the associated saccadic eye movement (Fig. 8). Together, our results argue that the differential perceptual modulation at favored and unfavored locations is related to differences in a priori probability of saccade occurrence to these locations but is not linked to either the occurrence itself or the size of the movement.
Our perceptual results likely arise from magnitude differences in modulations of visual responses within shared perceptual and oculomotor pathways, as opposed to differences in the magnitude of shifts in the spatial locus of attention. Although a clear distinction between the magnitude of attentional weighting and the spatial locus of attention can and should be made, these two properties do not exist in isolation. Thus, we are not arguing for two independent mechanisms, but the absence of any difference in the amplitude of saccades made to the favored and unfavored locations (Fig. 8) argues that differences in spatial attention shifts cannot account for our main finding (Fig. 7). Furthermore, the categorical dissociation of our main findings and saccade size in our control analysis rules out the idea that the observed perceptual differences between favored and unfavored locations arose from systematic differences in either saccade amplitude or the retinal eccentricity of the test stimulus, although additional studies will be needed to tease out any subtle interactions between saccade metrics, saccade timing, and perceptual performance. Regardless of any such extraneous effects, the present study allows one to constrain where and how the biasing modulation occurs in the cascade of sensorimotor processes.
Localizing the neural mechanism
Attentional modulations of neuronal activity in visual area V4, for example, have been modeled using a gain element directly amplifying the stimulus (Reynolds et al., 2000) or located downstream (McAdams and Maunsell, 1999; Williford and Maunsell, 2006) of the contrast-response (Reynolds et al., 2000; Williford and Maunsell, 2006) and orientation-tuning (McAdams and Maunsell, 1999) functions. If attention amplifies the sensory signal before the performance-limiting noise source (Fig. 1, w1), it would afford the observer better viewing of the attended stimulus by preferentially amplifying the input signal with respect to subsequent additive internal noise, thereby enhancing the signal-to-noise ratio (Reynolds et al., 2000; Carrasco et al., 2004). If attention amplifies the sensory signal after the performance-limiting noise source (Fig. 1, w2), both sensory signals and internal noise will increase, thereby maintaining a constant signal-to-noise ratio (Eckstein et al., 2007).
Surprisingly, the perceptual effect we observed does not improve signal-to-noise ratio. Psychometric functions for favored locations are actually shallower (Fig. 6C,D) such that perceptual noise increases linearly with gain (Fig. 10A), consistent with a weight that scales noise as well as signal, keeping signal-to-noise ratio constant (Fig. 5C,L). Rather than enhancing signal-to-noise ratio (Prinzmetal et al., 1997; Reynolds et al., 2000; Carrasco et al., 2004) or lowering a motor-output threshold (Swets, 1961; Green and Swets, 1966; Luce, 1986), our data are consistent with a mechanism that uses a sensory weighting (Fig. 10B, w) to shape human motor action by making sensory percepts “louder” (i.e., both more intense and noisier) but not “clearer” (i.e., no increase in the signal-to-noise ratio) (Krauzlis et al., 2005; Eckstein et al., 2007). These findings seem to echo William James's classic introspective observations that attention “makes a sense-impression more intense”, but that “clearness … is not attention's immediate fruit” (James, 1890). More specifically, our data rule out an increased sensitivity (i.e., contrast-gain) mechanism (Fig. 1, w1) in favor of an amplification (i.e., response-gain) mechanism (Fig. 1, w2).
This conclusion differs from a recent study by Carrasco et al. (2004), who argued that shifted psychometric functions (with no apparent change in precision) are consistent with an enhancement of visual signal-to-noise ratio. Unfortunately, their task did not allow independent measurement of the precision at attended and unattended locations. By making a single psychophysical comparison between two modulated locations, the two potentially different precisions were blurred into a single average precision, which would act to conceal any differential effect. For example, the 0.18 difference that we observed in the weights measured independently at the favored and unfavored locations would generate less than a 4% change in precision, if measured together, which would be difficult to detect. Contrary to their results, we also did not observe a bias in perceived overall brightness at either favored or unfavored locations (Prinzmetal et al., 1997), indicating that some normalization process (Heeger, 1992, 1993) follows the weighting mechanism in our task (Fig. 10B). This discrepancy, however, may be attributable to the fact that their task compared two simultaneously presented stimuli, whereas our perceptual task was sequential. Indeed, our 2AFC motor choice task and their perceptual task both required simultaneous discriminations and both showed overall biases. Perhaps, the normalization requires time, as has been previously suggested (Heeger, 1993), which could make it less effective in simultaneous paradigms (i.e., our 2AFC motor task and the 2AFC perceptual task by Carrasco et al. but not our 2IFC perceptual task). In addition, the normalization could occur late in sensorimotor processing and be specific to perceptual pathways only (as shown in Fig. 10), which would allow for motor behavior to be driven by an un-normalized, weighted sensory signal (and explain the large overall oculometric bias). The present data are consistent with a sluggish normalization, but additional experiments will be necessary to pin down the location and dynamics of this normalization process.
We conclude that prior knowledge (about target or reward location) shapes perception and action in parallel (Gold and Shadlen, 2000). This linkage is consistent with a multiplicative weight located before the split between perceptual and motor pathways, yet after the limiting visual noise, consistent with amplification models of attention (McAdams and Maunsell, 1999; Williford and Maunsell, 2006). Thus, a shared sensory weight amplifies perceptual experience while biasing motor action, driven by signals related to attention (Rizzolatti et al., 1987; Maunsell, 2004) and expected value (i.e., prior probability × reward magnitude) (Glimcher and Rustichini, 2004; Bendiksby and Platt, 2006; Milstein and Dorris, 2007). Interestingly, this mechanism suggests that signals related to economic concepts of “value” actively shape both perception and motor choice behavior. When these internal weights are matched to the probability and reward structure of the external environment, the induced biases would serve to increase the frequency of appropriately adapted behaviors and thus fitness to survive; when the weights are mismatched to the environment, the induced perceptual and behavioral biases would become maladaptive (Geisler and Diehl, 2002). Although the probability and feedback structure of the external environment primarily shape these weights, higher-order signals (Evarts and Wise, 1984) may also contribute (e.g., long-term knowledge, immediate expectations, beliefs, etc.), which would extend the range of values that shape perception and action.
Footnotes
This work was supported by NASA's Space Human Factors Engineering Program. We are grateful to Al Ahumada for suggesting the continuous analysis and to Miguel Eckstein, Brent Beutter, and Barbara Chapman for helpful feedback on a previous draft of this manuscript. We also thank the two anonymous reviewers for their insightful feedback and helpful suggestions and Rami Ersheid for technical support.
References
- Basso MA, Wurtz RH. Modulation of neuronal activity in superior colliculus by changes in target probability. J Neurosci. 1998;18:7519–7534. doi: 10.1523/JNEUROSCI.18-18-07519.1998. [DOI] [PMC free article] [PubMed] [Google Scholar]
- Bendiksby MS, Platt ML. Neural correlates of reward and attention in macaque area LIP. Neuropsychologia. 2006;44:2411–2420. doi: 10.1016/j.neuropsychologia.2006.04.011. [DOI] [PubMed] [Google Scholar]
- Beutter BR, Stone LS. Human motion perception and smooth eye movements show similar directional biases for elongated apertures. Vision Res. 1998;38:1273–1286. doi: 10.1016/s0042-6989(97)00276-9. [DOI] [PubMed] [Google Scholar]
- Beutter BR, Eckstein MP, Stone LS. Saccadic and perceptual performance in visual search tasks. I. Contrast detection and discrimination. J Opt Soc Am A Opt Image Sci Vis. 2003;20:1341–1355. doi: 10.1364/josaa.20.001341. [DOI] [PubMed] [Google Scholar]
- Burgess AE, Wagner RF, Jennings RJ, Barlow HB. Efficiency of human visual signal discrimination. Science. 1981;214:93–94. doi: 10.1126/science.7280685. [DOI] [PubMed] [Google Scholar]
- Carpenter RH, Williams ML. Neural computation of log likelihood in control of saccadic eye movements. Nature. 1995;377:59–62. doi: 10.1038/377059a0. [DOI] [PubMed] [Google Scholar]
- Carpenter RHS. Oculomotor procrastination. In: Fisher DF, Monty RA, Senders JW, editors. Eye movements: cognition and visual perception. Hillsdale, NJ: Erlbaum Associates; 1981. [Google Scholar]
- Carrasco M, Ling S, Read S. Attention alters appearance. Nat Neurosci. 2004;7:308–313. doi: 10.1038/nn1194. [DOI] [PMC free article] [PubMed] [Google Scholar]
- Coe B, Tomihara K, Matsuzawa M, Hikosaka O. Visual and anticipatory bias in three cortical eye fields of the monkey during an adaptive decision-making task. J Neurosci. 2002;22:5081–5090. doi: 10.1523/JNEUROSCI.22-12-05081.2002. [DOI] [PMC free article] [PubMed] [Google Scholar]
- Ding L, Hikosaka O. Comparison of reward modulation in the frontal eye field and caudate of the macaque. J Neurosci. 2006;26:6695–6703. doi: 10.1523/JNEUROSCI.0836-06.2006. [DOI] [PMC free article] [PubMed] [Google Scholar]
- Dorris MC, Munoz DP. Saccadic probability influences motor preparation signals and time to saccadic initiation. J Neurosci. 1998;18:7015–7026. doi: 10.1523/JNEUROSCI.18-17-07015.1998. [DOI] [PMC free article] [PubMed] [Google Scholar]
- Eckstein M, Liston D, Krauzlis R. Non-equivalence between attentional modulation and increases in signal contrast for superior colliculus neurons [abstract] J Vision. 2007;7:342. http://journalofvision.org/7/9/342/ [Google Scholar]
- Eckstein MP, Beutter BR, Stone LS. Quantifying the performance limits of human saccadic targeting during visual search. Perception. 2001;30:1389–1401. doi: 10.1068/p3128. [DOI] [PubMed] [Google Scholar]
- Evarts EV, Wise SP. Basal ganglia outputs and motor control. Ciba Found Symp. 1984;107:83–102. doi: 10.1002/9780470720882.ch6. [DOI] [PubMed] [Google Scholar]
- Fechner GT, Adler HE, Howes DH, Boring EG. Elements of psychophysics. New York: Holt; 1966. [Google Scholar]
- Fecteau JH, Bell AH, Munoz DP. Neural correlates of the automatic and goal-driven biases in orienting spatial attention. J Neurophysiol. 2004;92:1728–1737. doi: 10.1152/jn.00184.2004. [DOI] [PubMed] [Google Scholar]
- Finney DJ. Probit analysis. Ed 3d. Cambridge, UK: Cambridge UP; 1971. [Google Scholar]
- Gee AL, Ipata AE, Gottlieb J, Bisley JW, Goldberg ME. Neural enhancement and pre-emptive perception: the genesis of attention and the attentional maintenance of the cortical salience map. Perception. 2008;37:389–400. doi: 10.1068/p5874. [DOI] [PubMed] [Google Scholar]
- Geisler WS, Diehl RL. Bayesian natural selection and the evolution of perceptual systems. Philos Trans R Soc Lond B Biol Sci. 2002;357:419–448. doi: 10.1098/rstb.2001.1055. [DOI] [PMC free article] [PubMed] [Google Scholar]
- Glimcher PW, Rustichini A. Neuroeconomics: the consilience of brain and decision. Science. 2004;306:447–452. doi: 10.1126/science.1102566. [DOI] [PubMed] [Google Scholar]
- Gold JI, Shadlen MN. Representation of a perceptual decision in developing oculomotor commands. Nature. 2000;404:390–394. doi: 10.1038/35006062. [DOI] [PubMed] [Google Scholar]
- Goldberg ME, Wurtz RH. Activity of superior colliculus in behaving monkey. II. Effect of attention on neuronal responses. J Neurophysiol. 1972;35:560–574. doi: 10.1152/jn.1972.35.4.560. [DOI] [PubMed] [Google Scholar]
- Green DM, Swets JA. Signal detection theory and psychophysics. New York: Wiley; 1966. [Google Scholar]
- Heeger DJ. Normalization of cell responses in cat striate cortex. Vis Neurosci. 1992;9:181–197. doi: 10.1017/s0952523800009640. [DOI] [PubMed] [Google Scholar]
- Heeger DJ. Modeling simple-cell direction selectivity with normalized, half-squared, linear operators. J Neurophysiol. 1993;70:1885–1898. doi: 10.1152/jn.1993.70.5.1885. [DOI] [PubMed] [Google Scholar]
- Horwitz GD, Newsome WT. Separate signals for target selection and movement specification in the superior colliculus. Science. 1999;284:1158–1161. doi: 10.1126/science.284.5417.1158. [DOI] [PubMed] [Google Scholar]
- Huang X, MacEvoy SP, Paradiso MA. Perception of brightness and brightness illusions in the macaque monkey. J Neurosci. 2002;22:9618–9625. doi: 10.1523/JNEUROSCI.22-21-09618.2002. [DOI] [PMC free article] [PubMed] [Google Scholar]
- Ikeda T, Hikosaka O. Reward-dependent gain and bias of visual responses in primate superior colliculus. Neuron. 2003;39:693–700. doi: 10.1016/s0896-6273(03)00464-1. [DOI] [PubMed] [Google Scholar]
- James W. The principles of psychology. New York: Holt; 1890. [Google Scholar]
- Kowler E, Anderson E, Dosher B, Blaser E. The role of attention in the programming of saccades. Vision Res. 1995;35:1897–1916. doi: 10.1016/0042-6989(94)00279-u. [DOI] [PubMed] [Google Scholar]
- Krauzlis R, Liston D, Eckstein M. Cueing effects on superior colliculus neurons: increased sensitivity or weighted evidence? Soc Neurosci Abstr. 2005;35:857–821. [Google Scholar]
- Krukowski AE, Pirog KA, Beutter BR, Brooks KR, Stone LS. Human discrimination of visual direction of motion with and without smooth pursuit eye movements. J Vis. 2003;3:831–840. doi: 10.1167/3.11.16. [DOI] [PubMed] [Google Scholar]
- Kustov AA, Robinson DL. Shared neural control of attentional shifts and eye movements. Nature. 1996;384:74–77. doi: 10.1038/384074a0. [DOI] [PubMed] [Google Scholar]
- Laming D. Subjective probability in choice-reaction experiments. J Math Psychol. 1969;6:81–120. [Google Scholar]
- Lau B, Glimcher PW. Action and outcome encoding in the primate caudate nucleus. J Neurosci. 2007;27:14502–14514. doi: 10.1523/JNEUROSCI.3060-07.2007. [DOI] [PMC free article] [PubMed] [Google Scholar]
- Lauwereyns J, Watanabe K, Coe B, Hikosaka O. A neural correlate of response bias in monkey caudate nucleus. Nature. 2002;418:413–417. doi: 10.1038/nature00892. [DOI] [PubMed] [Google Scholar]
- Leigh RJ, Zee DS. Contemporary neurology series. Ed 4. Vol. 70. New York: Oxford UP; 2006. The neurology of eye movements; pp. 113–114. [Google Scholar]
- Luce RD. Response times: their role in inferring elementary mental organization. New York: Oxford UP; 1986. [Google Scholar]
- Maunsell JH. Neuronal representations of cognitive state: reward or attention? Trends Cogn Sci. 2004;8:261–265. doi: 10.1016/j.tics.2004.04.003. [DOI] [PubMed] [Google Scholar]
- McAdams CJ, Maunsell JH. Effects of attention on orientation-tuning functions of single neurons in macaque cortical area V4. J Neurosci. 1999;19:431–441. doi: 10.1523/JNEUROSCI.19-01-00431.1999. [DOI] [PMC free article] [PubMed] [Google Scholar]
- McCarthy D, Davison M. Isobias and alloiobias functions in animal psycophysics. J Exp Psychol Anim Behav Process. 1984;10:390–409. [PubMed] [Google Scholar]
- Milstein DM, Dorris MC. The influence of expected value on saccadic preparation. J Neurosci. 2007;27:4810–4818. doi: 10.1523/JNEUROSCI.0577-07.2007. [DOI] [PMC free article] [PubMed] [Google Scholar]
- Murphey DK, Maunsell JH. Behavioral detection of electrical microstimulation in different cortical visual areas. Curr Biol. 2007;17:862–867. doi: 10.1016/j.cub.2007.03.066. [DOI] [PMC free article] [PubMed] [Google Scholar]
- Palmer J, Huk AC, Shadlen MN. The effect of stimulus strength on the speed and accuracy of a perceptual decision. J Vis. 2005;5:376–404. doi: 10.1167/5.5.1. [DOI] [PubMed] [Google Scholar]
- Prinzmetal W, Nwachuku I, Bodanski L, Blumenfeld L, Shimizu N. The phenomenology of attention. 2. Brightness and contrast. Conscious Cogn. 1997;6:372–412. [PubMed] [Google Scholar]
- Reynolds JH, Pasternak T, Desimone R. Attention increases sensitivity of V4 neurons. Neuron. 2000;26:703–714. doi: 10.1016/s0896-6273(00)81206-4. [DOI] [PubMed] [Google Scholar]
- Rizzolatti G, Riggio L, Dascola I, Umiltá C. Reorienting attention across the horizontal and vertical meridians: evidence in favor of a premotor theory of attention. Neuropsychologia. 1987;25:31–40. doi: 10.1016/0028-3932(87)90041-8. [DOI] [PubMed] [Google Scholar]
- Sheliga BM, Riggio L, Rizzolatti G. Orienting of attention and eye movements. Exp Brain Res. 1994;98:507–522. doi: 10.1007/BF00233988. [DOI] [PubMed] [Google Scholar]
- Stone LS, Krauzlis RJ. Shared motion signals for human perceptual decisions and oculomotor actions. J Vis. 2003;3:725–736. doi: 10.1167/3.11.7. [DOI] [PubMed] [Google Scholar]
- Sugrue LP, Corrado GS, Newsome WT. Matching behavior and the representation of value in the parietal cortex. Science. 2004;304:1782–1787. doi: 10.1126/science.1094765. [DOI] [PubMed] [Google Scholar]
- Swets JA. Is there a sensory threshold? Science. 1961;134:168–177. doi: 10.1126/science.134.3473.168. [DOI] [PubMed] [Google Scholar]
- Tanner WP, Swets JA, Green DM, Macnee AB. University of Michigan. Electronic Defense Group. Some general properties of the hearing mechanism. Ann Arbor, MI: Engineering Research Institute, University of Michigan; 1956. p. vi. [Google Scholar]
- Terman M, Terman JS. Concurrent variation of response bias and sensitivity in an operant-psychophysical test. Percept Psychophys. 1972;11:428–432. [Google Scholar]
- Thompson KG, Biscoe KL, Sato TR. Neuronal basis of covert spatial attention in the frontal eye field. J Neurosci. 2005;25:9479–9487. doi: 10.1523/JNEUROSCI.0741-05.2005. [DOI] [PMC free article] [PubMed] [Google Scholar]
- Thurstone LL. A law of comparative judgment. Psychol Rev. 1927;34:273–287. [Google Scholar]
- Torgerson WS. Theory and methods of scaling. New York: Wiley; 1958. [Google Scholar]
- Treue S, Martínez Trujillo JC. Feature-based attention influences motion processing gain in macaque visual cortex. Nature. 1999;399:575–579. doi: 10.1038/21176. [DOI] [PubMed] [Google Scholar]
- Williford T, Maunsell JH. Effects of spatial attention on contrast response functions in macaque area V4. J Neurophysiol. 2006;96:40–54. doi: 10.1152/jn.01207.2005. [DOI] [PubMed] [Google Scholar]