

Abstract
Calcium currents via low-voltage-activated T-type channels mediate burst firing, particularly in thalamic neurons. Considerable evidence supports the hypothesis that overactive T-channels may contribute to thalamocortical dysrhythmia, including absence epilepsy. Single nucleotide polymorphisms in one of the T-channel genes (CACNA1H, which encodes Cav3.2) are associated with childhood absence epilepsy in a Chinese population. Because only a fraction of these polymorphisms are predicted to increase channel activity and neuronal firing, we hypothesized that other channel properties may be affected. Here we describe that all the polymorphisms clustered in the intracellular loop connecting repeats I and II (I–II loop) increase the surface expression of extracellularly tagged Cav3.2 channels. The functional domains within the I–II loop were then mapped by deletion analysis. The first 62 amino acids of the loop (post IS6) are involved in regulating the voltage dependence of channel gating and inactivation. Similarly, the last 15 amino acids of the loop (pre IIS1) are involved in channel inactivation. In contrast, the central region of I–II loop regulates surface expression, with no significant effect on channel biophysics. Electrophysiology, luminometry, fluorescence-activated cell sorting measurements, and confocal microscopy studies demonstrate that deletion of this central region leads to enhanced surface expression of channels from intracellular compartments to the plasma membrane. These results provide novel insights into how CACNA1H polymorphisms may contribute to CaV3.2 channel overactivity and consequently to absence epilepsy and establish the I–II loop as an important regulator of CaV3.2 channel function and expression.
Keywords: calcium channels, T-type, epilepsy, single nucleotide polymorphisms, electrophysiology, ion channel gating, luminometry, FACS, confocal microscopy
Introduction
Low-voltage-activated T-type calcium channels (LVA T-channels) play important roles in neuronal excitability, particularly in oscillatory rhythms of the thalamus. The α1 subunit of T-channels (Cav3) are encoded on three distinct genes (Perez-Reyes, 2003). These genes are expressed throughout the CNS, displaying both overlapping and complementary expression (Talley et al., 1999). For example, in the thalamus, CACNA1H and CACNA1I mRNAs are expressed in the reticular nucleus, whereas CACNA1G is abundantly expressed in the relay nuclei. Therefore, single nucleotide polymorphisms (SNPs) in these genes may underlie neurological disorders characterized by thalamocortical dysrhythmia (Llinás et al., 2001). This hypothesis was tested by Chen et al. (2003a,b) who sequenced two T-channel genes in Chinese patients with childhood absence epilepsy (CAE). Twelve SNPs in CACNA1H were found exclusively in these patients. Many, but not all, of these SNPs altered the biophysical properties of the recombinant channel expressed in human embryonic kidney (HEK) 293 cells (Vitko et al., 2005). Computer modeling predicts that some of these SNPs would lead to increased neuronal firing, supporting in part the hypothesis that they contribute to the pathogenesis of this polygenic disorder.
Because many channelopathies are attributable to mutations that alter trafficking, we hypothesized that the CACNA1H SNPs may also affect this property. Seven of the 12 CAE-specific SNPs alter the amino acid sequence of the intracellular loop that connects repeats I and II (I–II loop) in Cav3.2. In this study, we analyzed six of these SNPs, three that had a large effect on firing in the NEURON model [C456S, P648L, and G773D (Vitko et al., 2005)], two that caused little or no effect [G499S and A748V (Peloquin et al., 2006)], and one that decreased firing (G784S). We also included the common SNP R788C that was found in all three patients harboring the G773D SNP, because it alters channel activity and has a more widespread frequency in the human population. In high-voltage-activated (HVA) channels, this loop is known to play critical roles in channel function and regulation and most notably contains the binding site (AID for alpha-interacting domain) for β subunits (Pragnell et al., 1994). Although there are multiple lines of evidence indicating that the I–II loop in HVA channels is implicated in both trafficking of α1 subunits to the plasma membrane and channel gating (for review, see Richards et al., 2004), no evidence are yet available supporting that this linker plays a similar role in LVA channels. Recently, we showed that transfer of this loop from an HVA channel to a CaV3 channel conferred some of these aspects of β subunit regulation and created a chimera that gated at even lower voltages (Arias et al., 2005). Considering that the I–II loop of CaV3 channels may play important roles in channel gating, and possibly channel trafficking, we developed a structure–function analysis of this intracellular region using deletion mutants. Using a combination of luminometry, fluorescence-activated cell sorting (FACS), confocal microscopy, and electrophysiology, we demonstrate the role of this intracellular loop in regulating the surface expression of channels and its ability to regulate channel gating. Of interest, these experiments provide a likely explanation for a “gain of function” property of the CAE mutations that are clustered in the I–II loop of CaV3.2 channels.
Materials and Methods
Site-directed mutagenesis.
A fragment of human Cav3.2a cDNA (GenBank accession number AF051946) contained in pUC-18 was mutated using oligonucleotide primers and Pfu Ultra DNA polymerase (Stratagene, La Jolla, CA). Primers were obtained from either Operon (Alameda, CA) or Invitrogen (Carlsbad, CA) and used without purification. A silent mutation was introduced to create a second BspEI, thereby allowing full-length constructs to be regenerated by moving a BspEI (880)/BspEI (2638) fragment. All restriction enzymes were purchased from New England Biolabs (Ipswich, MA). The sequence of the BspEI fragment was verified for each mutant by automated sequencing at the University of Virginia Biomolecular Research Facility. The full-length cDNA was reassembled in the bicistronic vector phosphorylated internal ribosomal entry site–enhanced green fluorescent protein (EGFP) (Clontech, Mountain View, CA). For the luminometry experiments, a BsmBI (1344)/EcoRI (2265) fragment was moved into the hemagglutinin (HA)–GFP-tagged Ca v3.2 construct contained in phosphorylated EGFPC1 (Clontech), whose construction was described previously (Dubel et al., 2004). The amino acids deleted in each of the constructs were as follows: D1, 429–452; D2, 453–491; D3, 493–539; D1–D3, 429–539; D4, 540–618; D5, 619–772; D3–D5, 493–772; and D6, 773–788 (schematic shown in Fig. 1).
Figure 1.
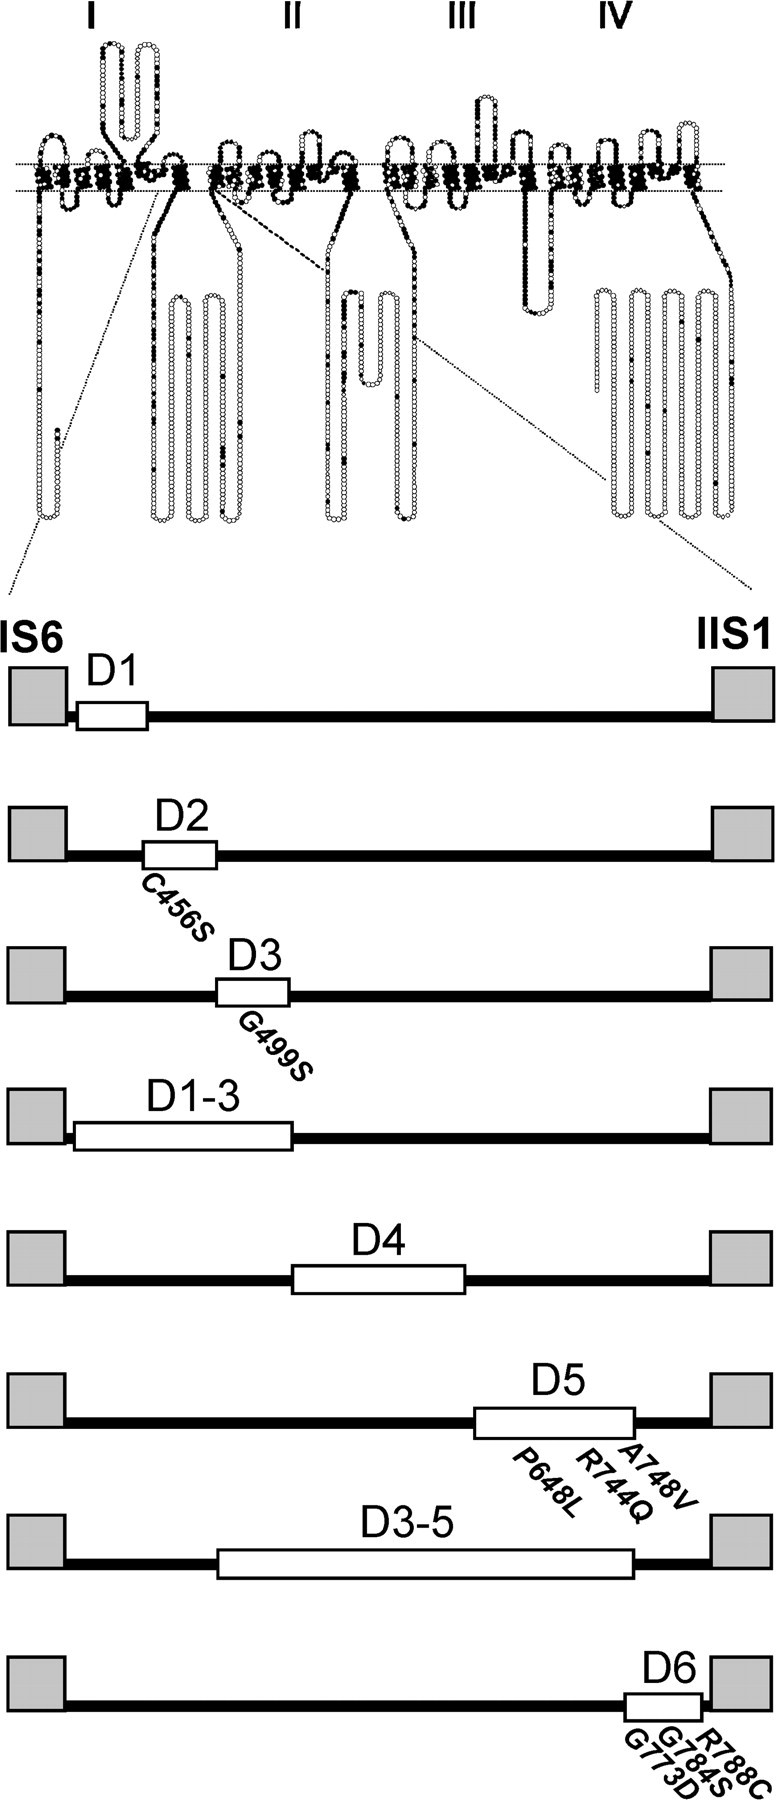
Schematic diagram of the deletion constructs of Cav3.2 calcium channel. A schematic membrane topology of the Cav3.2 channels is shown. Each amino acid is represented by a circle and with a filled circle if the residue is conserved in all three Cav3 subunits. Roman numerals indicate the four homologous repeats. The representation of the loop connecting the repeat IS6 to repeat IIS1 is expanded below. Deleted regions are shown as open boxes. SNPs are indicated by the number of the affected amino acid.
Transfections.
HEK 293 cells (CRL-1573; American Type Culture Collection, Manassas, VA) were grown in DMEM/F-12 (Invitrogen) supplemented with 10% fetal calf serum, penicillin G (100 U/ml), and streptomycin (0.1 mg/ml). Cells were transiently transfected with plasmid DNAs encoding each Cav3.2 variant using JET-PEI (Polyplus, Illkirch, France). After ∼24 h, GFP-positive cells were selected for electrophysiological recordings.
Electrophysiology.
Electrophysiological experiments were performed using the whole-cell configuration of the patch-clamp technique. Recordings were obtained using an Axopatch 200A amplifier equipped with a CV201A head stage. The amplifier was connected to a computer (Dell Computer Company, Round Rock, TX) through a Digidata 1200 analog-to-digital converter and controlled using pClamp 9.0 software (Molecular Devices, Palo Alto, CA). Data were filtered at 2 kHz and digitized at 5 kHz. Whole-cell Ca2+ currents were recorded using the following external solution (in m m): 5 CaCl2, 166 tetraethylammonium (TEA) chloride, and 10 HEPES, pH adjusted to 7.4 with TEA-OH. The internal pipette solution contained the following (in m m): 125 CsCl, 10 EGTA, 2 CaCl2, 1 MgCl2, 4 Mg-ATP, 0.3 Na3GTP, and 10 HEPES, pH adjusted to 7.2 with CsOH. Pipettes were made from TW-150-3 capillary tubing (World Precision Instruments, Sarasota, FL). There was no correction of the −9.4 mV junction potential. Under these solution conditions, the pipette resistance was typically 2–3 MΩ. Access resistance and cell capacitance were measured using on-line exponential fits to a capacitance transient (Membrane Test, Clampex; Molecular Devices). Cell capacitance averaged 10 pF. Access resistance averaged 4.2 MΩ. Data from cells in which the access resistance exceeded 5.5 MΩ were discarded. Series resistance was compensated between protocols to 70% (prediction and correction; 10 μs lag), resulting in maximal residual voltage error below 1.6 mV during measurement of the current–voltage (I–V) relationship. Data were collected at room temperature.
Activation and inactivation kinetics were calculated simultaneously using double-exponential fits to the current trace using Clampfit 9.0 software (Molecular Devices). Peak currents (I) at each voltage step (Vm) were used to calculate the voltage dependence of activation (V0.5 and k) using the following equation:
 |
where Vrev was the reversal potential, and Gmax was the maximal conductance.
The voltage dependence of steady-state inactivation (SSI) was estimated using 15 s prepulses to varying potentials followed by a test pulse to −20 mV to measure channel availability (h). The current elicited during each test pulse was normalized to that observed when the holding potential was −110 mV (I/Imax), and the data from each cell were fit with the following Boltzmann equation using Prism software (GraphPad Software, San Diego, CA):
 |
We also calculated conductance at each test potential because some of the deletion mutants shifted the voltage dependence of activation to more negative potentials at which the driving force for Ca2+ ions is larger. To allow comparisons of current density, conductance K was normalized to cell size (F). The currents in some cells (especially those expressing the D1–D3 or D3–D5) saturated the amplifier (I >20 nA), requiring the use of slightly depolarized holding potentials to inactivate a fraction of the channels. Because this led to an underestimation of current density, we also included a correction for inactivation. Therefore, a corrected conductance (Gcorr) was calculated with the following equation:
 |
Results are presented as mean ± SEM. Significant differences in the average data were analyzed using one-way ANOVA, followed by Tukey's multiple comparison test (GraphPad Prism).
Luminometry analysis.
HEK 293 cells were cultured in 24-well plates and transfected using Fugene 6 (Roche Diagnostics, Basel, Switzerland) with 0.5 μg of DNA per well, using the various CAE and deletion mutants of the CaV3.2–HA–GFP construct. The luminometric measurements were performed 48 h after transfection. Briefly, cells were rinsed and fixed for 5 min in 4% paraformaldehyde and then washed three times for 5 min with PBS. Half of the wells were permeabilized with 0.1% Triton X-100 for 5 min and rinsed three times with PBS. Cells were then incubated for 30 min in blocking solution (PBS plus 1% FBS). The CaV3.2–HA–GFP protein was detected using a monoclonal rat anti-HA antibody (1:1000, clone 3F10; Roche Diagnostics) after incubation for 1 h at room temperature. After extensive washes (four times for 10 min in PBS plus 1% FBS), cells were incubated for 30 min with the secondary goat anti-rat antibody coupled to horseradish peroxidase (1:1000; Jackson ImmunoResearch, West Grove, PA). Cells were rinsed four times for 10 min with PBS before addition of SuperSignal enzyme-linked immunosorbent assay femto maximum sensitivity substrate (Pierce, Rockford, IL). The luminescence was measured using a Victor 2 luminometer (PerkinElmer, Wellesley, MA), and then protein amount in each well was measured with a BCA assay (Pierce) to normalize the measurements. The data were also normalized to the level of signal obtained for the wild-type (WT) CaV3.2–HA–GFP protein in nonpermeabilized condition. Seven to 12 independent sets of transfections were performed for each condition, and the results are presented as mean ± SEM.
Flow cytometry analysis.
Transfected HEK 293 cells were washed twice in PBS and resuspended with PBS–EDTA (5 m m). Cells were incubated for 30 min in PBS–EDTA containing 2% FCS for blocking nonspecific sites. Cells were incubated with the primary antibody (rat anti-HA antibody, 1:100, clone 3F10; Roche Diagnostics) for 30 min in PBS–EDTA plus 2% FCS and then with the secondary anti-rat Alexa Fluor 594 antibody (1:500; Invitrogen). Labeled living cells were then analyzed by flow cytometry using an EPICS XL (Beckman Coulter, Fullerton, CA). Data were analyzed with the Expo32 software (Beckman Coulter).
Confocal microscopy.
Images of live cells were collected using a Cooke (Romulus, MI) Sensicam QE mounted on an Olympus Optical (Melville, NY) BX61WI equipped with an Olympus Optical confocal spinning disk unit. Channel localization was visualized by measuring the green fluorescent signal from GFP fused to the N terminus. Nuclei were labeled with Hoechst 33258 for 30 min at 37°C in normal growth media (described above). Plasma membranes were labeled with FM 4-64 [N-(3-triethylammoniumpropyl)-4-(6-(4- diethylamino)phenyl)hexatrienyl)pyridinium dibromide] by adding the dye directly to the recording chamber. Cells were imaged at 10–15°C to minimize internalization of FM 4-64. Recordings were made in HBSS without Mg2+ or Ca2+. Fluorescent signals were acquired (Z stack of 10 images separated by 1 μm) and analyzed using IPLab 3.7 (Scanalytics, Fairfax, VA). Fluorescent intensity was measured in a Z slice corresponding to the center of the cell. The contour of the cell was mapped using the autosegmentation function on the FM 4-64 signal. This mask was transferred to the GFP channel, and the total amount of fluorescent signal was measured. The cell interior was mapped by shrinking the mask to exclude the FM 4-64 signal at the surface membrane (erode function). This mask was transferred to GFP channel, allowing quantification of the amount of signal within the cell. The signal at the plasma membrane was then calculated by subtracting the amount within the cell from the total. Applying this analysis to cells transfected with a plasmid containing wild-type GFP indicated that 90% of the signal could be correctly identified as cytosolic (Kain et al., 1995). The data were corrected for the residual 10% bleedthrough and for background fluorescence obtained from a region without cells.
Results
Twelve SNPs in the gene encoding the Cav3.2 T-type calcium channel were found recently in the Chinese population of childhood absence patients (Chen et al., 2003b), and most of them are clustered in the intracellular I–II loop (Fig. 1). Our previous electrophysiological study predicted that some of these CAE SNPs might contribute to increased firing of neurons, thereby providing a plausible mechanism for their involvement in absence epilepsy (Vitko et al., 2005). However, not all of the SNPs produced a clear gain-of-function phenotype. Because altered trafficking of channels has been implicated in various kinds of channelopathies (Delisle et al., 2004) and increased T-current density is predicted to trigger thalamic oscillations such as those observed in absence epilepsy (McCormick and Huguenard, 1992), we asked whether these SNPs altered the surface expression of Cav3.2 channels. Several CAE SNPs of I–II loop were introduced into a modified human Cav3.2a channel construct containing GFP fused to the intracellular N terminus and an extracellular HA (located in IS5-pore loop) tag to measure their surface (nonpermeabilized) and total expression (permeabilized) in mammalian cells. All of the SNPs tested significantly increased expression of HA-tagged channels at the plasma membrane of HEK 293 cells (Fig. 2A). Most SNPs did not change total expression (Fig. 2B), except G748S and G773D, as well as G773D/R788C (double), which increased it and P648L, which decreased it. More importantly, all except G499S (p = 0.07) increased the ratio of membrane expression over total expression, which was 12.5% for WT channels (Fig. 2C), indicating that the SNPs increased surface expression of Cav3.2 channels. Plotting these results as fold increase over control (Fig. 2D) revealed that the CAE SNPs increased the fraction of channels at the plasma membrane by 20–60%.
Figure 2.

Quantification by ELISA/luminometry of the expression levels of HA-tagged CaV3.2 channel CAE SNPs. A, B, The histograms represent relative light unit (RLU) normalized toward the nonpermeabilized WT signal (100% in A). The various CAE SNPs are presented as by Vitko et al. (2005). One construct harboring two SNPs, G773D and R788C (Chen et al., 2003b; Vitko et al., 2005), is labeled Double. A, Surface expression measured in nonpermeabilized condition. B, Total expression measured after Triton X-100 permeabilization. C, Ratio of surface/total expression identifies an increase in membrane expression for all but G499S SNP. D, Same results as in C except presented as fold increase over the control (WT). Statistically significant differences are indicated (*p < 0.05; **p < 0.01; ***p < 0.001).
Within the I–II loop, the SNPs are clustered with most occurring in the region encoding amino acids 640–788. To identify functional regions of the loop, we constructed a series of deletion mutants (Fig. 1). To guide the selection of the junctions, we analyzed the sequence using secondary structure prediction programs (e.g., SOPMA, for Self Optimized Prediction Method from Alignment) (Geourjon and Deleage, 1995), avoiding regions predicted to form either α helices or β sheets, and joined where the structure is predicted to be random coils.
The first two deletions, D1 and D2, remove highly conserved amino acids that occur close to the final transmembrane segment of the first repeat (IS6). The voltage-dependent gating of these channels was severely shifted to more negative potentials (Table 1); the I–V curves were shifted 16–20 mV (Fig. 3), and the SSI curves were shifted 10–12 mV (Fig. 4). The deletion mutants were also more sensitive to voltage changes as evidenced by a decrease in the slope factors that describe the activation and inactivation curves (Table 1). The currents recorded from cells transiently transfected with these channels were larger than WT. Because these channels open at more negative potentials, we calculated the apparent conductance to take into account the increased driving force for Ca2+ entry (Fig. 3E). These calculations show that there was a twofold to threefold increase in open channels. These deletions also affected channel kinetics. A hallmark of T-channel kinetics is that they display a crisscrossing pattern of traces recorded during an I–V protocol (Randall and Tsien, 1997), which arises because the rate of both activation and inactivation accelerate as the test potential is increased, eventually approaching a voltage-independent value ∼0 mV. Both D1 and D2 accelerated activation kinetics and altered the way these kinetics change as a function of test potential (Fig. 5). D2 channels continued to open faster even in the voltage-independent range of test potentials (Fig. 5C, Table 1). Despite their similarities, the deletion mutants could be distinguished by their inactivation kinetics, with D1 inactivating much slower than wild-type channels (Fig. 5D, Table 1). The shifts in gating and channel kinetics were similar in the D1–D3 mutant, which deletes both regions deleted in D1 and D2, as well as the region deleted in D3 (Table 1).
Table 1.
Biophysical properties of Cav3.2 variants
| Activation |
Inactivation |
Kinetics at −20 mV |
|||||||
|---|---|---|---|---|---|---|---|---|---|
| V50(mV) | k (mV) | n | V50(mV) | k (mV) | n | τact(ms) | τinact(ms) | n | |
| WT | −43.8 ± 0.8 | 6.3 ± 0.1 | 12 | −78.1 ± 1.2 | −5.7 ± 0.1 | 7 | 2.9 ± 0.1 | 17.4 ± 0.9 | 12 |
| D1 | −64.7 ± 0.8*** | 5.2 ± 0.1** | 22 | −90.0 ± 0.8*** | −4.4 ± 0.1*** | 8 | 2.2 ± 0.2** | 27.8 ± 2.5*** | 15 |
| D2 | −60.4 ± 1.0*** | 5.4 ± 0.2* | 22 | −88.2 ± 0.8*** | −4.5 ± 0.2* | 5 | 1.7 ± 0.1*** | 18.3 ± 0.6 | 18 |
| D3 | −45.3 ± 0.6 | 6.1 ± 0.3 | 15 | −78.8 ± 1.4 | −5.1 ± 0.2 | 7 | 3.0 ± 0.1 | 15.8 ± 0.8 | 13 |
| D1–D3 | −63.8 ± 1.4*** | 4.6 ± 0.2*** | 16 | −92.0 ± 0.9*** | −3.8 ± 0.1*** | 9 | 1.5 ± 0.1*** | 14.0 ± 0.8 | 14 |
| D4 | −47.0 ± 0.9 | 6.1 ± 0.1 | 16 | −78.8 ± 1.4 | −4.9 ± 0.1 | 6 | 3.1 ± 0.1 | 15.7 ± 0.6 | 15 |
| D5 | −47.2 ± 0.6 | 6.0 ± 0.2 | 16 | −79.7 ± 1.0 | −5.3 ± 0.2 | 9 | 2.8 ± 0.2 | 16.0 ± 0.4 | 13 |
| D3–D5 | −59.5 ± 0.7*** | 4.3 ± 0.2*** | 14 | −85.8 ± 0.7*** | −4.7 ± 0.2* | 7 | 1.8 ± 0.1*** | 16.1 ± 0.5 | 12 |
| D6 | −41.4 ± 1.0 | 7.0 ± 0.3 | 9 | −81.4 ± 1.7 | −6.8 ± 0.6* | 5 | 3.3 ± 0.2 | 26.5 ± 1.7*** | 9 |
Data shown are mean ± SEM from the number of cells shown in parentheses. Statistically significant differences are indicted (*p < 0.05; **p < 0.01; ***p < 0.001).
Figure 3.

Effect of deletions on the voltage dependence of channel activation. A, B, Representative normalized current traces recorded during depolarizing voltage steps from −90 to +40 mV (holding potential, −100 mV) in WT (A) and D1 (B). Thick gray lines represent the current at −50 mV, demonstrating the negative shift in voltage dependence of activation caused by D1. Calibration applies to both sets of traces. C, D, Average peak current versus voltage plots. Currents have been normalized to cell capacitance. Smooth curves represent fits to the average data using a Boltzmann–Ohm equation (see Materials and Methods). These curves are shown as examples of the fits obtained. The data in Table 1 show the average obtained from fits to the raw current data from each individual cell. These two methods yield similar V50 values (−45 vs −44 mV) and slope factors (6.0 vs 6.3). E, F, To illustrate the increase in current densities caused by deletions, activation is represented by conductance normalized to current densities. As noted in Materials and Methods, the currents with some deletions such as D3–D5 were too large to clamp adequately when the holding potential was −110 mV, requiring the use of a less negative holding potential to inactivate a portion of the channels. The data were then corrected for the extent of inactivation to estimate current density. Note how this analysis reveals a much larger increase in current expression for D3–D5 than illustrated in the I–V curves. Data represent mean ± SEM. Smooth curves represent Boltzmann fits to the average data.
Figure 4.

Effect of deletions on steady-state inactivation. A, B, Representative current traces obtained during a 20 ms test pulse to −20 mV preceded by incremental hyperpolarizing pulses (15 s) from −110 mV. Calibration applies to both sets of traces. Thick gray lines represent the current at −80 mV, demonstrating the negative shift in steady-state inactivation in D1 channels. C, D, The mean normalized amplitude of the current is expressed as a function of the membrane potential and fit with a Boltzmann equation (smooth curves). Averages of the fits to data from individual cells are reported in Table 1.
Figure 5.

Effect on activation and inactivation kinetics. A, B, Representative activation (A) and inactivation (B) traces for WT and D1 recorded during test pulses to −20 mV. The current traces were simultaneously fit with two exponentials, in which one describes the kinetics of activation and the other inactivation (represented by the dashed lines). C, D, Average activation (C) and inactivation (D) kinetics. As expected from the shift in the voltage dependence of activation, D1 channel activation kinetics are shifted a similar amount and approach the same voltage-independent value. D2 activates faster than WT at all voltages but inactivates with similar kinetics. Conversely, D1 and D6 activate with similar kinetics as WT but inactivate much slower.
Deletions in the central region of the I–II loop (D3, D4, and D5) had only small effects on the I–V and SSI curves (Figs. 3, 4) and no significant effect on channel kinetics (Table 1). In contrast, these deletions had very large effects on current density, increasing maximal conductance almost threefold (Fig. 3F). The effect of deleting all three regions at once was much greater (D3–D5), producing a 6.7-fold increase in maximal conductance. Similarly, simultaneous deletion of regions 1, 2, and 3 (D1–D3) produced nearly additive effects on current density, resulting in 6.1-fold larger currents than wild type. Finally, deletion of 16 amino acids immediately proximal to the S1 transmembrane segment of repeat II (D6) produced a channel that expressed small but measurable currents (∼100 pA). The I–V and SSI curves for D6 channels were similar to wild type, as were its activation kinetics. In contrast, D6 channels inactivated much more slowly and with a different change in rate as a function of voltage (Fig. 5).
We next asked whether the effects on maximal conductance could be explained by changes in the surface expression of channels. The deletions were moved into the plasmid vector containing the HA- and GFP-tagged Cav3.2a channel, and their surface expression level was determined by luminometry as described above. With the exception of D1 and D6, the deletions caused a large increase in the amount of channel protein expressed at the plasma membrane, ranging from a twofold increase with D2 and D5 to a sixfold increase with D4 (Fig. 6A). Permeabilization of the membrane with 0.1% Triton X-100 allowed measurement of total channel expression (Fig. 6B), which was significantly increased in the case of D5 and D4. It should be noted that none of the deletions resulted in increased intracellular expression (data not shown), indicating that the increase in total expression was attributable to an increased expression at the plasma membrane. The ratio of surface-to-total expression of channel protein indicates that D1 and D6 deletions did not alter channel surface expression, whereas all of the other deletions led to increased surface expression to the plasma membrane from 2- to 3.5-fold (Fig. 6C,D). Notably, deletion of multiple regions produced nearly additive effects in the case of D1–D3 but not in the case of D3–D5, which did not increase expression beyond that observed with either D3 or D4 alone (3.2-, 3.5-, 1.8-, and 3.7-fold increase for D3, D4, D5, and D3–D5, respectively).
Figure 6.

Quantification by ELISA/luminometry of the expression levels of HA-tagged CaV3.2 channel deletion mutants. A, Surface expression measured in nonpermeabilized condition for D1 to D6, as well as D1–D3 and D3–D5 deletion mutants. B, Total expression measured in Triton X-100 permeabilized condition. C, Ratio of surface/total expression that identifies an increase in membrane expression for all except D1 and D6 deletion mutants. D, Same results as in C, except presented as fold increase over the WT HA-tagged CaV3.2 channel values. Statistically significant differences are indicated (*p < 0.05; **p < 0.01; ***p < 0.001). RLU, Relative light unit.
FACS can be used to analyze individual cells expressing surface accessible HA epitope and intracellular GFP, thereby providing an independent method to concomitantly measure the percentage of cells expressing the channel at the surface and the level of surface expression. FACS analysis revealed that the increase in CaV3.2 channel surface expression, as detected by HA labeling, was correlated to channel total expression (GFP signal) for all of the constructs tested (Fig. 7). In good agreement with the luminometry data, FACS experiments showed that HA intensity was proportionally higher for GFP-positive D1–D3 than for WT and D1 (Fig. 7A–C). As illustrated in Figure 7D, the change in surface expression of the various deletion mutants of CaV3.2 channels was best estimated by the number of positive cells, ranging from ∼10% (for WT D1 and D6) to ∼30% (for D1–D3 and D3–D5).
Figure 7.

Effects of the I–II loop deletions on CaV3.2 surface expression measured by FACS analysis. Flow cytometry analysis was performed on living cells expressing GFP–HA CaV3.2 channel constructs. A–C, Representative dot plot analysis of cells transfected with WT, D1, and D1–D3 channels, respectively. Axes representing the GFP and HA fluorescence measurements are presented in A. D, Histogram plots correspond to the percentage of double-positive cells for WT, D1, D4, D6, D1–D3, and D3–D5 CaV3.2 deletion mutants obtained from three independent set of transfections (statistically significant difference, ***p < 0.001).
We also measured the subcellular localization of WT and D4 HA–GFP-tagged channels using confocal microscopy (Fig. 8, green signal). Plasma membranes were labeled with FM 4-64 (red signal), and nuclei were labeled with Hoechst 33258 (blue signal). Wild-type channels display a perinuclear distribution, with the majority of the channels remaining in intracellular compartments. In contrast, D4 and D3–D5 (data not shown) channels show a lower intracellular expression and a clear increase in plasma membrane expression. To quantitate surface expression, we localized the edges of the plasma membrane with FM 4-64 and then measured the amount of GFP-tagged channels contained within both regions (Fig. 8B). Surface expression was obtained by subtracting the amount of signal within the cell from the total and expressed as a percentage of the total (Fig. 8G). Using this technique, we measured a 2.3-fold increase in surface expression of the D4 mutant over wild-type channels (WT, 5.8 ± 1.0, n = 7; D4, 12.8 ± 3.5, n = 5; p < 0.05). Altogether, by using complementary molecular and functional approaches, we described here that the loop between repeat I and II of CaV3.2 channels regulates the membrane expression of these channels and that its disruption by either single amino acid changes (CAE SNPs) or large sequence removal (deletion mutants) significantly enhances membrane expression of CaV3.2 channels.
Figure 8.

Effect of the deletions on channel localization. Subcellular localization of GFP-tagged WT (A, B) and D4 (C, D) channels. Images represent a central Z slice of the cell as determined from imaging 10 Z stacks that begin below the cells and ended above them. A, C, Overlay of the GFP fluorescence image and nuclear staining with Hoechst 33342 for WT (A) and D4-transfected (C) cells. B, D, Membrane staining of WT (B) and D4 (D) with FM 4-64.
Discussion
In this study, we show that SNPs found to be associated with childhood absence epilepsy increase the surface expression of Cav3.2 channels. Because most of these polymorphisms alter the sequence of the intracellular loop connecting repeats I and II, we performed a functional analysis of this loop using a set of deletion mutants. These studies revealed that both the biophysical properties and the membrane targeting of Cav3.2 channels critically depend on the molecular makeup of loop I—II, with some domains (D1 and D6) involved mainly in setting up the electrophysiological properties and others (D3 and D4) playing a significant role in the membrane targeting of Cav3.2 channels. The first 62 amino acids of the loop (amino acids 429–491) play a key role in the voltage dependence of both activation and inactivation. Deletions between residues 453–772 led to large increases in surface expression as measured by either whole-cell current or luminometry but had no statistically significant effect on voltage dependence or channel kinetics. Deletion of the final stretch before IIS1 (amino acids 773–788) had little effect on either the voltage dependence or surface expression, but it did slow inactivation. Altogether, these results define two roles for this intracellular loop: (1) as an intracellular gating factor that controls the voltage dependence of channel gating and (2) as a regulator of channel surface expression.
Previous studies have shown that the polymorphisms associated with CAE are capable of altering channel function (Khosravani et al., 2004; Vitko et al., 2005). The effects of the polymorphisms were modest, and the only common finding was that they led to an increase in persistent currents. Modeling studies predicted that only half of the polymorphisms would increase neuronal firing, whereas others would have either no effect or decrease firing (Vitko et al., 2005). We documented previously the utility of tagged channels for measuring expression of channels in intracellular compartments and at the cell surface (Dubel et al., 2004). This assay relies on immunochemical detection of an HA epitope that was introduced into the extracellular loop connecting IS5 to the pore loop. By comparing the accessibility of the epitope in permeabilized and nonpermeabilized cells, we can quantitate changes in both total and surface expression of the channels. Introduction of CAE polymorphisms into the tagged channels led a 20–50% increase in the surface expression over control. This result was not seen previously because of study design, which, because of the large sample size, did not include matched controls that would allow comparisons of current densities (Vitko et al., 2005). Because of the role of T-channels in shaping the firing properties of thalamic neurons, an increase in T-current is predicted to trigger thalamic oscillations as observed in absence epilepsy (McCormick and Huguenard, 1992). Supporting this notion are studies in animal models of absence epilepsy, which all show an increase in T-current density (Zhang et al., 2002) and block of T-currents at clinically relevant concentrations of the anti-absence drug ethosuximide (Coulter et al., 1989; Gomora et al., 2001). Therefore, the present results provide a unifying mechanism by which polymorphisms cause a gain in T-channel function that would contribute to seizure susceptibility. The corollary may also be important: polymorphisms in CACNA1H that decrease channel activity were found in patients with autism spectrum disorders (ASD) (Splawski et al., 2006). As observed in CAE patients, some SNPs found only in affected patients were always found in conjunction with neighboring SNPs found in control patients (in CAE, G773D with R778C; in ASD, A1874V with R1871Q). This result is consistent with the polygenic inheritance of these disorders, the modest effects most SNPs have on channel activity, and the hypothesis that common SNPs that also alter channel activity may contribute to human disease.
Our study first identifies that the I–II loop of the Cav3.2 channel contributes to its gating properties. This loop in high-voltage-activated Ca2+ channels is known to play a major role in channel function. It contains the binding site for its β subunits, which increase trafficking of the Cav1 and Cav2 families to the plasma membrane, increase channel Po, and modulate the time and voltage dependence of channel gating. The amino acid sequence of this loop is poorly conserved in the Cav3 family, and Cav3 channels have lost the ability to bind β subunits with high affinity (Dubel et al., 2004). Replacement of this loop in Cav3.1 with that from Cav2.2 conferred some aspects of β regulation but unexpectedly resulted in channels that gated at extremely low voltages (Arias et al., 2005). Replacement of the Cav3.1 loop with that from Cav3.3 (or vice versa) did not alter the voltage dependence of either activation or inactivation (J. M. Arias and E. Perez-Reyes, unpublished observations). Sequence alignments show that the first 62 amino acids after IS6 are highly conserved in all three human Cav3 channels (Perez-Reyes, 2003), leading to the attractive hypothesis that this region may contain a gating particle. Indeed, by showing that deletions within the I–II loop region of Cav3.2 channels produce large 20 mV shifts in gating to more negative voltages, we provide novel evidence that this intracellular region contributes to the gating properties of Cav3 channels. The entire conserved region is involved in regulation of gating, because similar gating shifts were found with deletion of either the first 23 amino acids (D1), the next 39 amino acids (D2), or both in combination (D1–D3). These deletions did not produce identical phenotypes, because D2 inactivated like wild-type channels, whereas D1 inactivated slower. We conclude that all 62 amino acids of the conserved stretch form an intracellular gating particle and that the first 23 amino acids play an additional role in inactivation from the open state. This gating particle appears to act like a brake, with removal of the brake allowing channels to open at more negative voltages. A similar model was invoked to explain how mutations in hydrophobic residues in the S4 voltage sensor of K+ channels shifted their voltage dependence; mutations that shifted gating to more negative voltages appeared to destabilize the closed state (Liman et al., 1991). T-channels open after small depolarizations of the resting membrane potential, when most of the charge movements associated with its voltage sensors have not occurred (Lacinova et al., 2002). This suggests that the resting state of T-channels is close to the open state, and we propose that channels are stabilized in closed states by the I–II loop. Deletion of the gating particle also led to faster channel opening and increased iPo as predicted by this model. Inactivation of Cav3.2 channels is primarily voltage independent, and its apparent voltage dependence arises from the voltage dependence of activation (Burgess et al., 2002). Therefore, the 10–14 mV shift in steady-state inactivation in D1 and D2 channels can primarily be accounted for by the 16–21 mV shift in activation. In light of the fact that gating of D3, D4, and D5 was similar to wild type, it is surprising that gating of D3–D5 was shifted. Perhaps such a large deletion (279 amino acids) exerts a conformation strain on the cytoplasmic gating factor that interferes with its function.
T-channels inactivate in a similar manner as other voltage-gated Na+ and HVA Ca2+ channels, with slow inactivation from closed states and fast inactivation from the open state (Serrano et al., 1999; Burgess et al., 2002). Similarly, mutations in the S6 segments of T-channels slow open channel inactivation (Marksteiner et al., 2001; Arias et al., 2005) as observed in HVA channels (Shi and Soldatov, 2002; Splawski et al., 2004; Stotz et al., 2004). These results suggest that the S6 segments form an internal gating ring similar to that determined for K+ channels (Yellen, 2002). The present study shows that inactivation from both closed and open states is affected by deletions in the intracellular loop. A similar conclusion was reached by Staes et al. (2001) who used C-terminal chimeras between Cav3.1 and Cav1.2 channels to localize a region just after IVS6 involved in inactivation. One possible explanation for these similar results is that the S6 gating ring extends into the cytoplasm and includes contributions from other loops. Similarly, other intracellular loops may also contribute to the regulation of surface expression.
Measurements of membrane expression of CaV3.2 deletion mutants revealed novel regulatory properties of the loop I–II of CaV3.2 channels. The membrane expression assay used here relies on the antibody accessibility of an HA epitope that is present at the extracellular side of the channel protein, and our conclusions were drawn by two independent measurements of surface expression: luminometry and FACS. These data were also supported by confocal microscopy showing that plasma membrane expression of the D4 deletion mutant was higher than for WT CaV3.2 channels. These studies revealed that only ∼12–14% of wild-type Cav3.2 channels are expressed at the surface, an expression level that was not affected in the D1 and D6 mutants. Notably, all of the deletions of the central region of the I–II loop led to significant increases (∼200–350%) in surface expression. The D3 and D4 deletions being almost as efficient as the larger D1–D3 and D3–D5 deletions in targeting CaV3.2 proteins to the membrane, it is tempting to speculate that the main molecular determinants responsible for membrane targeting and/or stability are included in the amino acids 493 to amino acids 618 region of loop I–II. The surrounding sequences (D2 and D5, amino acids 453 to amino acids 491, respectively) may partly contribute to this modulation, especially the D2 stretch (amino acids 453 to amino acids 491), because membrane expression of D1–D3 was higher than for D3 alone. Overall analysis of membrane expression is in good agreement with electrophysiological measurements, i.e., current densities. Two exceptions are the D1 and D6 mutations, which showed significant reduction in their current density but no apparent reduction in their surface expression. Because the whole-cell current (I) can be defined by the single-channel current (i), the number of channels (N), and the probability of channel opening (Po), then we can calculate changes in iPo relative to control from the electrophysiological measurements of I (or adjusted Gmax to account for changes in driving force) and the luminometry measurements of N. This analysis indicates that the D6 deletion drastically reduces iPo to 9% of control, whereas D1 increases it 187% of control. The D6 results identify for the first time a role for pre-S1 segments in controlling channel gating and open state inactivation in any voltage-gated Ca2+ channel. Recent studies on KvAP voltage-dependent K+ channels suggest that S1 segments are at the contact interface between S4 and pore regions (Cuello et al., 2004). Because the D6 deletion affects T-channel activity, then it might indicate that T-channels have a similar architecture. Notably, the region deleted in D6 contains the G773D and G784S polymorphisms found in epilepsy patients and the R788C polymorphism that is found in ∼10% of the general population (Vitko et al., 2005).
It is of interest to note that both CAE SNPs and experimental deletions within loop I–II (except D1 and D6) lead to increased surface expression. However, because single mutants are distributed in various domains of loop I–II (Fig. 1), including D6, we cannot directly correlate these two sets of data. Because overexpression at the plasma membrane is not restricted to a specific portion of the I–II loop, our results cannot be simply explained by the disruption of single retention site, as observed in KATP channels (Zerangue et al., 1999). Nevertheless, evidence that the loop does contain a protein interaction site that impairs surface expression was obtained using a construct in which the region deleted in D1–D3 was fused to the C terminus of D1–D3. This addition normalized current density (−54 ± 11 pA/pF; n = 11) to control values (WT, −54 ± 9 pA/pF; n = 12). At this stage, we favor the hypothesis that there are many regions within the I–II loop of Cav3.2 involved in regulating surface expression and that point mutations or deletions disrupt these regions and impair its normal surface expression. Future experiments will therefore be necessary to identify the specific properties of this loop, its role in targeting and/or stability at the plasma membrane, as well as to delineate the molecular domain(s) within this loop that are involved in the Cav3.2 channel expression at the plasma membrane.
The deletion studies demonstrate that the I–II loop contributes to intracellular retention of the normal Cav3.2 protein and support the idea that subtle changes in primary sequence of I–II loop attributable to CAE SNPs may affect its molecular properties, leading to increased membrane expression of the mutant Cav3.2 channels. The study therefore uncovers a common, and possibly primary, mechanism by which polymorphisms in CACNA1H may contribute to the development of absence epilepsy: by increasing surface expression of Cav3.2 channels to the plasma membrane. In addition to altering neuronal excitability, increased channels may lead to increases in intracellular Ca2+ which in turn may affect gene transcription or surface expression. Notably, expression of untagged C456S channels was capable of increasing the expression of tagged WT channels (normalized surface expression was increased from 100 ± 1 to 175 ± 7; n = 4). The mechanism for this dominant effect is under investigation. Overall, the results establish the I–II loop as an important regulator of channel function and expression. Modulation of Cav3.2 channel expression being described in many physiological and pathological situations (autism, development, pain, temporal lobe epilepsy…), we suggest that future investigations should consider whether any posttranslational modulation occurring through the I–II loop is involved in such pathophysiological situations.
Footnotes
This work was supported by National Institutes of Health Grant NS038691 (E.P.-R.). I.B. was supported by a grant from the Fondation Française pour la Recherche sur l'Epilepsie. We thank Thomas Geer (Opelco, Dulles, VA) for help with the confocal studies.
References
- Arias JM, Murbartián J, Vitko I, Lee JH, Perez-Reyes E. Transfer of β subunit regulation from high to low voltage-gated Ca2+ channels. FEBS Lett. 2005;579:3907–3912. doi: 10.1016/j.febslet.2005.06.008. [DOI] [PubMed] [Google Scholar]
- Burgess DE, Crawford O, Delisle BP, Satin J. Mechanism of inactivation gating of human T-type (low-voltage activated) calcium channels. Biophys J. 2002;82:1894–1906. doi: 10.1016/S0006-3495(02)75539-2. [DOI] [PMC free article] [PubMed] [Google Scholar]
- Chen Y, Lu J, Zhang Y, Pan H, Wu H, Xu K, Liu X, Jiang Y, Bao X, Zhou J, Liu W, Shi G, Shen Y, Wu X. T-type calcium channel gene α1G is not associated with childhood absence epilepsy in the Chinese Han population. Neurosci Lett. 2003a;341:29–32. doi: 10.1016/s0304-3940(03)00124-1. [DOI] [PubMed] [Google Scholar]
- Chen YC, Lu JJ, Pan H, Zhang YH, Wu HS, Xu KM, Liu XY, Jiang YW, Bao XH, Yao ZJ, Ding KY, Lo WHY, Qiang BQ, Chan P, Shen Y, Wu XR. Association between genetic variation of CACNA1H and childhood absence epilepsy. Ann Neurol. 2003b;54:239–243. doi: 10.1002/ana.10607. [DOI] [PubMed] [Google Scholar]
- Coulter DA, Huguenard JR, Prince DA. Characterization of ethosuximide reduction of low-threshold calcium current in thalamic neurons. Ann Neurol. 1989;25:582–593. doi: 10.1002/ana.410250610. [DOI] [PubMed] [Google Scholar]
- Cuello LG, Cortes DM, Perozo E. Molecular architecture of the KvAP voltage-dependent K+ channel in a lipid bilayer. Science. 2004;306:491–495. doi: 10.1126/science.1101373. [DOI] [PubMed] [Google Scholar]
- Delisle BP, Anson BD, Rajamani S, January CT. Biology of cardiac arrhythmias: ion channel protein trafficking. Circ Res. 2004;94:1418–1428. doi: 10.1161/01.RES.0000128561.28701.ea. [DOI] [PubMed] [Google Scholar]
- Dubel SJ, Altier C, Chaumont S, Lory P, Bourinet E, Nargeot J. Plasma membrane expression of T-type calcium channel α1 subunits is modulated by HVA auxiliary subunits. J Biol Chem. 2004;279:29263–29269. doi: 10.1074/jbc.M313450200. [DOI] [PubMed] [Google Scholar]
- Geourjon C, Deleage G. SOPMA: significant improvements in protein secondary structure prediction by consensus prediction from multiple alignments. Comput Appl Biosci. 1995;11:681–684. doi: 10.1093/bioinformatics/11.6.681. [DOI] [PubMed] [Google Scholar]
- Gomora JC, Daud AN, Weiergräber M, Perez-Reyes E. Block of cloned human T-type calcium channels by succinimide antiepileptic drugs. Mol Pharmacol. 2001;60:1121–1132. [PubMed] [Google Scholar]
- Kain SR, Adams M, Kondepudi A, Yang TT, Ward WW, Kitts P. Green fluorescent protein as a reporter of gene expression and protein localization. Biotechniques. 1995;19:650–655. [PubMed] [Google Scholar]
- Khosravani H, Altier C, Simms B, Hamming KS, Snutch TP, Mezeyova J, McRory JE, Zamponi GW. Gating effects of mutations in the Cav3.2 T-type calcium channel associated with childhood absence epilepsy. J Biol Chem. 2004;279:9681–9684. doi: 10.1074/jbc.C400006200. [DOI] [PubMed] [Google Scholar]
- Lacinova L, Klugbauer N, Hofmann F. Gating of the expressed Cav3.1 calcium channel. FEBS Lett. 2002;531:235–240. doi: 10.1016/s0014-5793(02)03509-3. [DOI] [PubMed] [Google Scholar]
- Liman ER, Hess P, Weaver F, Koren G. Voltage-sensing residues in the S4 region of a mammalian K+ channel. Nature. 1991;353:752–756. doi: 10.1038/353752a0. [DOI] [PubMed] [Google Scholar]
- Llinás R, Ribary U, Jeanmonod D, Cancro R, Kronberg E, Schulman J, Zonenshayn M, Magnin M, Morel A, Siegmund M. Thalamocortical dysrhythmia. I. Functional and imaging aspects. Thalamus Relat Syst. 2001;1:237–244. [Google Scholar]
- Marksteiner R, Schurr P, Berjukow S, Margreiter E, Perez-Reyes E, Hering S. Inactivation determinants in segment IIIS6 of Cav3.1. J Physiol (Lond) 2001;537:27–34. doi: 10.1111/j.1469-7793.2001.0027k.x. [DOI] [PMC free article] [PubMed] [Google Scholar]
- McCormick DA, Huguenard JR. A model of the electrophysiological properties of thalamocortical relay neurons. J Neurophysiol. 1992;68:1384–1400. doi: 10.1152/jn.1992.68.4.1384. [DOI] [PubMed] [Google Scholar]
- Peloquin JB, Khosravani H, Barr W, Bladen C, Evans R, Mezeyova J, Parker D, Snutch TP, McRory JE, Zamponi GW. Functional analysis of Cav3.2 T-type calcium channel mutations linked to childhood absence epilepsy. Elpilepsia. 2006;47:655–658. doi: 10.1111/j.1528-1167.2006.00482.x. [DOI] [PubMed] [Google Scholar]
- Perez-Reyes E. Molecular physiology of low-voltage-activated T-type calcium channels. Physiol Rev. 2003;83:117–161. doi: 10.1152/physrev.00018.2002. [DOI] [PubMed] [Google Scholar]
- Pragnell M, De Waard M, Mori Y, Tanabe T, Snutch TP, Campbell KP. Calcium channel β-subunit binds to a conserved motif in the I-II cytoplasmic linker of the α1-subunit. Nature. 1994;368:67–70. doi: 10.1038/368067a0. [DOI] [PubMed] [Google Scholar]
- Randall AD, Tsien RW. Contrasting biophysical and pharmacological properties of T-type and R-type calcium channels. Neuropharmacology. 1997;36:879–893. doi: 10.1016/s0028-3908(97)00086-5. [DOI] [PubMed] [Google Scholar]
- Richards MW, Butcher AJ, Dolphin AC. Ca2+ channel beta-subunits: structural insights AID our understanding. Trends Pharmacol Sci. 2004;25:626–632. doi: 10.1016/j.tips.2004.10.008. [DOI] [PubMed] [Google Scholar]
- Serrano JR, Perez-Reyes E, Jones SW. State-dependent inactivation of the α1G T-type calcium channel. J Gen Physiol. 1999;114:185–201. doi: 10.1085/jgp.114.2.185. [DOI] [PMC free article] [PubMed] [Google Scholar]
- Shi C, Soldatov NM. Molecular determinants of voltage-dependent slow inactivation of the Ca2+ channel. J Biol Chem. 2002;277:6813–6821. doi: 10.1074/jbc.M110524200. [DOI] [PubMed] [Google Scholar]
- Splawski I, Timothy KW, Sharpe LM, Decher N, Kumar P, Bloise R, Napolitano C, Schwartz PJ, Joseph RM, Condouris K, Tager-Flusberg H, Priori SG, Sanguinetti MC, Keating MT. Cav1.2 calcium channel dysfunction causes a multisystem disorder including arrhythmia and autism. Cell. 2004;119:19–31. doi: 10.1016/j.cell.2004.09.011. [DOI] [PubMed] [Google Scholar]
- Splawski I, Yoo DS, Stotz SC, Cherry A, Clapham DE, Keating MT. CACNA1H mutations in autism spectrum disorders. J Biol Chem. 2006;281:22085–22091. doi: 10.1074/jbc.M603316200. [DOI] [PubMed] [Google Scholar]
- Staes M, Talavera K, Klugbauer N, Prenen J, Lacinová L, Droogmans G, Hofmann F, Nilius B. The amino side of the C-terminus determines fast inactivation of the T-type calcium channel α1G. J Physiol (Lond) 2001;530:35–45. doi: 10.1111/j.1469-7793.2001.0035m.x. [DOI] [PMC free article] [PubMed] [Google Scholar]
- Stotz SC, Jarvis SE, Zamponi GW. Functional roles of cytoplasmic loops and pore lining transmembrane helices in the voltage-dependent inactivation of HVA calcium channels. J Physiol (Lond) 2004;554:263–273. doi: 10.1113/jphysiol.2003.047068. [DOI] [PMC free article] [PubMed] [Google Scholar]
- Talley EM, Cribbs LL, Lee JH, Daud A, Perez-Reyes E, Bayliss DA. Differential distribution of three members of a gene family encoding low voltage-activated (T-type) calcium channels. J Neurosci. 1999;19:1895–1911. doi: 10.1523/JNEUROSCI.19-06-01895.1999. [DOI] [PMC free article] [PubMed] [Google Scholar]
- Vitko I, Chen Y, Arias JM, Shen Y, Wu XR, Perez-Reyes E. Functional characterization and neuronal modeling of the effects of childhood absence epilepsy variants of CACNA1H, a T-type calcium channel. J Neurosci. 2005;25:4844–4855. doi: 10.1523/JNEUROSCI.0847-05.2005. [DOI] [PMC free article] [PubMed] [Google Scholar]
- Yellen G. The voltage-gated potassium channels and their relatives. Nature. 2002;419:35–42. doi: 10.1038/nature00978. [DOI] [PubMed] [Google Scholar]
- Zerangue N, Schwappach B, Jan YN, Jan LY. A new ER trafficking signal regulates the subunit stoichiometry of plasma membrane K(ATP) channels. Neuron. 1999;22:537–548. doi: 10.1016/s0896-6273(00)80708-4. [DOI] [PubMed] [Google Scholar]
- Zhang Y, Mori M, Burgess DL, Noebels JL. Mutations in high-voltage-activated calcium channel genes stimulate low-voltage-activated currents in mouse thalamic relay neurons. J Neurosci. 2002;22:6362–6371. doi: 10.1523/JNEUROSCI.22-15-06362.2002. [DOI] [PMC free article] [PubMed] [Google Scholar]