

Abstract
Frequency modulations are a prominent feature of animal vocalizations and human speech. Here we investigated how neurons in the inferior colliculus (IC) of Mexican free-tailed bats respond to the frequency-modulated (FM) direction and velocity of complex signals by extracting their spectrotemporal receptive fields (STRFs) using a family of upward- and downward-moving ripple stimuli. STRFs were obtained in more than half of the cells that were sampled. To verify the validity of each STRF, we compared their features both with tone-evoked responses and by convolving the STRF with several conspecific calls. We show that responses to tones are in close agreement with the STRF and that the responses predicted by convolutions compare favorably with responses evoked by those calls. The high predictability showed that the STRF captured most of the excitatory and inhibitory properties of IC cells. Most neurons were selective for the direction and velocity of spectral motion with a majority favoring the downward FM direction, and most had spectrum–time inseparability that correlated with their direction selectivity. Furthermore, blocking inhibition significantly reduced the directional selectivity of these neurons, suggesting that inhibition shapes FM direction selectivity in the IC. Finally, we decomposed the natural calls into their ripple components and show that most species-specific calls have downward-sweeping FM components with sweep velocities that correspond with the preferred sweep velocities of IC neurons. This close quantitative correspondence among features of signals and responses suggests that IC cells are tuned by inhibition to respond optimally to spectral motion cues present in their conspecific vocalizations.
Keywords: spectrotemporal receptive field, inferior colliculus, conspecific calls, inhibition, inseparability, direction selectivity, velocity tuning, FM sweep
Introduction
One important goal of auditory neuroscience is to understand how auditory neurons respond to natural signals. Animals interact with their acoustic environment, and neurons in the auditory system must have evolved to decode natural sounds that are important for social communication and survival. Natural sounds, such as conspecific vocalizations, contain complex temporal and spectral features. The acoustic complexity makes it difficult to discern which features of a call actually evoke responses and how the excitation and inhibition evoked by those features interact to shape the responses of the neuron.
Interactions among excitatory and inhibitory inputs are especially important in the inferior colliculus (IC) because the IC is the common target of both excitatory and inhibitory projections from the majority of lower auditory nuclei, from the opposite IC via its commissure and from descending projections of the auditory cortex (Oliver and Huerta, 1992; Casseday et al., 2002). Consistent with the massive convergence, a host of new response properties are created in the IC. What is noteworthy is that inhibition plays a critical role in the formation of those properties, as revealed by the numerous changes in IC response properties that occur when inhibition is blocked (Faingold et al., 1991; Fuzessery and Hall, 1996; Ehrlich et al., 1997; LeBeau et al., 2001; Pollak et al., 2003a,b).
Here we used spectrotemporal receptive fields (STRFs) to evaluate how the spectral and temporal features of inhibition interact with excitation in the IC of Mexican free-tailed bats and how those interactions create selective features for the direction and velocity of frequency-modulated (FM) sweeps, acoustic features that are prominent in their natural calls. To do this, we first generated STRFs with a family of moving ripples (Klein et al., 2000). We verified the validity of the STRFs by comparing their features both with tone-evoked responses and by convolving them with a suite of conspecific communication sounds to evaluate the degree to which the STRF predicts the responses to biologically relevant sounds that were not used to generate it. In a subset of cells, we also generated STRFs before and while inhibition was blocked and evaluated how the spectrotemporal features of excitation and inhibition interact to create selectivity for spectral motion. Finally, we decomposed the conspecifc calls into their ripple components and show that the velocities in the FM components of species-specific communication calls correspond closely with the FM velocities preferred by IC cells. In short, we show how the spectrotemporal arrangement of inhibition in receptive fields shapes and tunes response selectivity for complex signals and argue that those features are tuned to the natural signals these animals receive in their daily lives.
Materials and Methods
Surgical procedures.
Surgical and pharmacological procedures, electronic equipment, sound generation, and criteria for isolating single neurons were described previously (Bauer et al., 2002; Klug et al., 2002). The bats were prepared under general anesthesia (IsoFlo; Abbott Laboratories, North Chicago, IL), and lidocaine (Abbott Laboratories) was applied topically to all open wounds. After a small metal rod was mounted on the skull, a small hole was made in the skull over the IC, and the bat was then transferred to a heated recording chamber, in which it was placed in a restraining cushion constructed of foam molded to the animal's body. The metal rod was attached to a bar mounted on the stereotaxic instrument. The electrode was positioned over the IC and was subsequently advanced from outside of the experimental chamber with a piezoelectric microdrive (7121W; Burleigh Instruments, Fishers, NY). Recordings were made at depths ranging from ∼350 to 1600 μm, which covered most of the dorsoventral extent of the central nucleus of the inferior colliculus. Recordings were begun after the bats recovered from the anesthetic, and thus all data were obtained from awake animals. If the bats showed signs of discomfort, doses of the neuroleptic ketamine hydrochloride (Vetamine, 1:40 dilution, 0.01 cc injection; Mallinckrodt, St. Louis, MO) were administered. All experimental procedures were in accordance with a protocol approved by the University of Texas Institutional Animal Care and Use Committee.
Electrodes.
Single units were recorded with either a single micropipette filled with buffered 1 m NaCl or five-barrel “piggyback” multibarrel micropipettes (Havey and Caspary, 1980) with a single-barrel pipette attached for recording single-unit activity. One barrel of the five-barrel pipette was the balancing barrel and was filled with buffered 1 m NaCl and the other barrels with bicuculline methiodide (Sigma, St. Louis, MO), an antagonist of GABAA receptors, and/or with the glycine receptor antagonist strychnine HCl (both were 10 mm in 0.165 m NaCl, pH 3.0; Sigma). For bicuculline and strychnine, retention currents were negative and ejection currents were positive. The drug and balancing barrels were connected via silver–silver chloride wires to a six-channel microiontophoresis constant-current generator (Neurophore BH-2; Medical Systems, Greenvale, NY) that was used to generate and monitor ejection and retention currents. The sum channel was used to balance current in the drug barrels. The recording barrel was connected to a Dagan (Minneapolis, MN) alternating current amplifier (model 2400).
Acoustic stimuli.
Acoustic signals were tone bursts, six species-specific calls, and 147 moving ripples. The calls were selected from a larger repertoire and were chosen because their acoustic features represent a range of spectrotemporal patterns that are used in a variety of important behavioral contexts. All stimuli were presented monaurally to the ear contralateral to the IC with custom-made earphones (Schuller, 1997) biased with 200 V direct current and positioned in the funnel formed by the bat's pinna. The earphones were flat ±5 dB from ∼10 to 70 kHz. The tone bursts, 20 ms in duration with 0.2 ms rise–fall times, were generated by a Macintosh G4 computer (Apple Computers, Cupertino, CA) with custom-built software. The ripples were created using Matlab (MathWorks, Natick, MA) and were stored as sound files. All stimuli were then uploaded from the Macintosh G4 into a custom made Downloadable Arbitrary Waveform Generator through a 24-bit digital interface (DIO-24; National Instruments, Austin, TX) and a digital distributor just before the presentation of that particular sound. The acoustic signals output to an InstruTech (Port Washington, NY) 16-bit digital-to-analog converter and were sent to custom-made electronic attenuators and then to the earphones.
The best frequency (BF), or frequency to which it was most sensitive, and threshold at BF were obtained for each cell, followed by a rate-level function and tuning curve. The ripples were then presented at 30–50 dB above BF threshold, and a spectrotemporal receptive field was constructed as described below. Peristimulus time (PST) histograms were generated from 20 presentations of each stimulus (bin width was 1.0 ms).
The species-specific communication calls were recorded from a captive colony of Mexican free-tailed bats while the bats were engaged in a particular behavior. The calls were equated for RMS intensity and presented to each neuron at 30–40 dB above BF threshold. The calls are shown in Figure 3.
Figure 3.

STRFs provide accurate predictions of responses to species-specific calls. Spectrograms of each species-specific vocalization are shown in the top, with the evoked response of each IC neuron (red) and the predicted response of its STRF (blue) displayed below each call. Each row shows the predicted and evoked responses of an IC neuron with its STRF on the left. Predicted responses were generated by convolving the STRF of the neuron with the spectrogram of each call. Correlation between predicted and actual response is shown in top right of each panel. A, B, Two neurons in which there were high correlations between their STRF predictions and their actual responses. Convolutions predicted the call selectivity of these neurons because they predicted very low response magnitudes for the calls that evoked little or virtually no responses but predicted high response magnitudes for those calls that evoked strong responses. Those calls that evoked little or no responses were used to demonstrate that convolving STRFs with those calls also predicted little or no activity, but no correlation coefficient was computed for those calls.
Moving ripple stimuli.
Each moving ripple stimulus was constructed from a combination of tone components that had random phases (Kowalski et al., 1996). The tone components were sinusoidally modulated both spectrally and temporally. The amplitude of each tone component was sinusoidally amplitude modulated in time with a fixed rate and a phase that depended on the position of the tone component on the spectral axis. The initial phases of the amplitude modulations of the tone components varied sinusoidally on the spectral axis at a fixed rate, thereby creating spectral modulations at any point in time. The particular combination of spectral (SMR) and temporal (TMR) modulation rates, in turn, caused frequency modulations, in which the velocity, direction, and spectral bandwidth of the frequency modulation were unique to each ripple stimulus. Thus, some ripples had relatively narrow frequency bands that swept upward or downward in frequency at a high rate, whereas others had wider bands that swept at lower rates (Fig. 1A,B).
Figure 1.
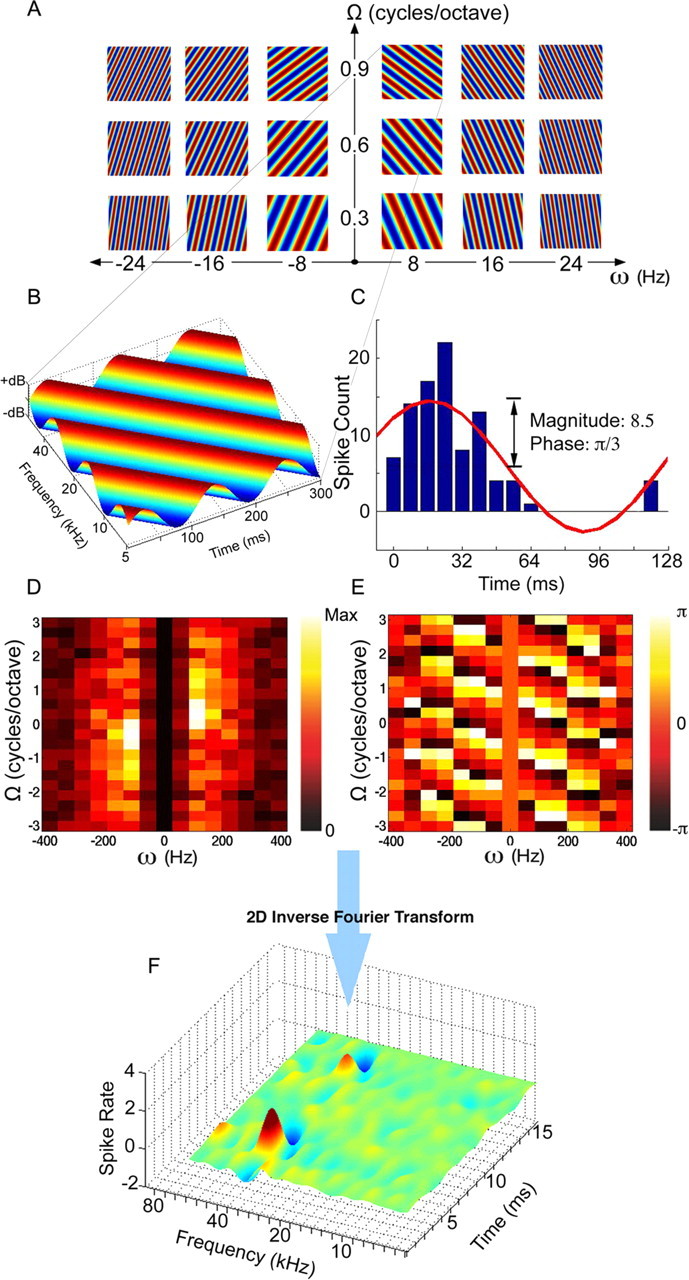
Constructing an STRF from neural responses to moving ripple stimuli. A, A subset of moving ripple stimuli with different temporal and spectral modulation rates. B, A single moving ripple stimulus with a temporal modulation rate (ω) of 8 Hz and a spectral modulation rate (Ω) of 0.9 cycles per octave. C, Neural response of an IC cell to the ripple stimulus shown in B. Magnitude and phase of the response are extracted by calculating the amplitude and unwrapped phase of the fundamental present in the recorded period histogram with its period equivalent to one ripple cycle (1/ω). D, Magnitude matrix showing response magnitudes for all ripple stimuli presented. E, Phase matrix showing response phases to the same ripple set. F, By using a range of temporal and spectral modulation rates (ω, Ω), a ripple transfer function is obtained with its magnitude (D) and phase (E) derived from the neural responses to each ripple stimulus. An STRF for the neuron is constructed by linearly summing each ripple stimulus in our set, scaled by its response magnitude and shifted by its response phase, which is analogous to taking the inverse Fourier transform of the ripple transfer function.
Each tone component of a ripple stimulus can be described as follows:
where x is the position on the logarithmic frequency axis defined by x = log2(f/f0), with f0 being the starting frequency, ω is the TMR in hertz, Ω is the SMR in cycles per octave, Φ is the starting phase of the ripple, L is the overall loudness of the stimulus, and ΔA is the amplitude modulation of the ripple. Each ripple stimulus had 25–100 tones per octave equally spaced along the logarithmic frequency axis and was 90% linearly modulated (ΔA = 0.9). L was typically 30–50 dB above BF threshold.
A total of 147 ripple stimuli were used that were temporally modulated (ω) from 8 to 392 Hz in steps of 64 Hz and spectrally modulated (Ω) from −3.0 to 3.0 cycles per octave in steps of 0.3 cycles per octave. Each ripple was 300 ms long and had a frequency range of 5–50 kHz (∼3.3 octaves).
Data analysis.
Each ripple stimulus was presented 10–20 times, and a PST histogram generated from the 10–20 repetitions of each ripple was obtained (Fig. 1C). The PST histogram was then folded into a 16-bin period histogram based on the period of the ripple stimulus (reciprocal of the temporal modulation rate, 1/ω). To find the magnitude and phase of the response, the period histogram was fitted with a sinusoid by applying a 16-point Fourier transform and taking the magnitude and unwrapped phase of the fundamental (Kowalski et al., 1996). Response magnitude and phase were extracted for every ripple stimulus presented with different spectral and temporal modulation rates (ω, Ω).
We graph the magnitude and phase calculated from the response evoked by each ripple in two matrices, one showing the response magnitudes and the other the response phase (Fig. 1D,E). The matrix of the response magnitudes evoked by each ripple is termed the magnitude matrix, and the graph of the phase responses is termed the phase matrix. Both matrices are arranged such that increasing temporal modulation frequencies (ω) are shown along the abscissa and increasing spectral modulation frequencies (Ω) are shown on the ordinate. Each matrix has four quadrants, in which the first quadrant plots the range of spectral and temporal modulations that produced downward-sweeping ripples, and the second quadrant plots the same spectral and temporal modulation parameters but for upward-sweeping ripples. The third and fourth quadrants provide redundant information for reasons explained below.
The STRF for each neuron was constructed from the combination of ripple stimuli presented, in which each ripple was weighted by its magnitude value in the magnitude matrix and temporally shifted by its phase value in the phase matrix. The linear summation of those weighted and phase-shifted ripples generated the STRF of the cell (Fig. 1F).
The magnitude and phase matrices together constitute the ripple transfer function defined as follows:
where M is the response magnitude, Φ is the phase of the response, and .
It is important to note here the complex conjugate symmetry in the ripple transfer function, as follows:
This symmetry enabled us to measure the transfer function in only two quadrants of ripple space (first and fourth), in which positive and negative values were used for Ω, and only positive values were used for ω. Using Equation 3 enabled us to deduce the transfer function in the other two quadrants (second and third). A value of 0 was assumed for ripples with no temporal modulation (ω = 0).
The STRF of the cell was constructed by taking the inverse Fourier transform of the ripple transfer function in two dimensions:
where F−1 {.} designates the inverse Fourier transform with respect to ω and Ω.
As seen in Figure 1F, the STRF shows the frequency tuning of the neuron on the logarithmic spectral axis. The temporal axis reflects the impulse response of the cell.
The significant portions of each STRF were obtained by estimating response variability using the bootstrap method (Efron and Tibshirani, 1994). By resampling with replacement, an estimate of the variability of each point on the STRF was obtained (Depireux et al., 2001). We used the same criteria of Fritz et al. (2003) for significance. Regions of the STRF with values that exceeded ±2.5 SDs from the mean were considered significant, whereas other regions were regarded as measurement noise.
Predicted call responses from convolutions.
After obtaining an STRF for an auditory neuron, the response of the cell to any given stimulus can be predicted by performing a convolution in the temporal dimension and integration in the spectral dimension with the spectrogram of the stimulus. In the discrete case, the predicted response is the product of a temporally reversed STRF with the spectrogram of the stimulus summed over frequency and time:
 |
The predicted response, r, was then rectified by setting any negative predicted response value to 0, r = max(0,r). This rectification was performed to conduct an accurate correlation between the predicted response and the actual response of the cell and to compensate for the half-wave rectification nonlinearity present in extracellular recordings of auditory neurons.
STRFs of IC neurons were convolved with each of the communication calls, and a predicted response for each call was calculated using Equation 5. The highest magnitude of predicted response across all calls was then scaled to the highest magnitude of actual response across the same set of calls. The scaling allowed us to analyze the relative magnitudes of the predicted responses and compare each with the response magnitudes that were actually evoked by each call. A correlation coefficient was then calculated for each call to assess the accuracy of the predictions. Calls that had weak or no responses in both the predictions and in the actual responses of the cell produced low correlation values attributable to noise in the STRF and the weak response of the cell. These calls were used to demonstrate that STRFs not only predicted calls to which the neurons responded but also predicted the calls to which the neurons failed to respond. No correlation coefficient was calculated for calls that evoked weak responses and for which weak responses were predicted by convolution.
Inseparability and direction-selectivity analysis.
To assess the degree of STRF inseparability, we performed singular value decomposition (SVD) (Depireux et al., 2001). SVD can be viewed as decomposing the STRF into a linear sum of separable matrices, with each matrix weighted by its singular value on how much it can estimate the STRF as a product of two vectors as in strf = Σ λiui · viT, where T denotes the Hermitian transpose and λ being the singular values with λ1 ≥ λ2 ≥ λ3 ≥… Therefore, a separable STRF will have a first singular value (λ1) that dominates all the other singular values. The more dominant is the first singular value compared with the other singular values, the more separable is the STRF. With this in mind, we defined an inseparability index (Ins) as follows:
 |
A value of Ins near 0 indicates a separable STRF, whereas a value closer to 1 shows a high degree of inseparability.
To specifically investigate the direction selectivity of STRFs and its contribution to inseparability, we calculated a direction-selective index (DSI) for each STRF. The index was calculated from the total power in the first quadrant of the magnitude matrix, P1, compared with the total power in the second quadrant, P2. If the STRF favors one ripple direction over the other, more power will be present in the corresponding quadrant of the transfer function versus the other, i.e., an STRF that favors downward-moving ripples will have more power in the first quadrant because the first quadrant of the magnitude matrix is composed of the response magnitudes evoked by downward-sweeping ripples. The DSI is therefore defined as follows:
where total power is computed by adding the square of the magnitudes in each quadrant. A negative value of DSI will indicate direction selectivity for the downward direction; a positive value shows upward selectivity and no direction selectivity for values near 0. Note that relative power was examined in only two quadrants of the transfer function attributable to the complex conjugate symmetry mentioned in Equation 3.
Velocity tuning.
We analyzed the tuning of IC neurons to FM velocity in a similar manner that had been applied to receptive fields of middle temporal area MT neurons and their selectivity for visual speed (Perrone and Thiele, 2001). Because the velocity of a moving ripple is expressed as the ratio of temporal to spectral modulation rates (v = ω/Ω), the magnitude matrix could be then divided into isovelocity lines passing through the origin in which FM velocity is directly related to the slope of each line. Therefore, an IC neuron that is tuned for a particular FM velocity will have its ripple responses both elongated and oriented along a specific velocity line in the magnitude matrix, in which the slope of that line indicates the optimal velocity of the neuron.
To quantify the orientation of ripple responses in one quadrant of the magnitude matrix, the responses were normalized and then fit by a rotated two-dimensional Gaussian as follows:
where ω′ = (ω − x)cos(θ) + (Ω − y)sin(θ) and Ω′ = −(ω − x)sin(θ) + (Ω − y)cos(θ) are the rotated coordinates of the Gaussian around its peak (x,y) by the angle θ. The spread of the Gaussian along the rotated dimensions (ω′, Ω′) is indicated by sx and sy, respectively. A constant pedestal value (p) is added, and then G is normalized relative to its maximum. The parameters x, y, sx, sy, θ, and p were nonlinearly optimized using the Nelder-Mead direct search method (fminsearch in Matlab) to minimize the sum of the squared deviations or mean-squared error (E) between the neural responses and G values:
 |
where Rj is the response magnitude at temporal and spectral modulation rates (ωj, Ωj), and Gj is the Gaussian fit value at the same modulation rates. To evaluate the goodness of the fit, the responses of each neuron were correlated with the Gaussian model, and neurons with a correlation coefficient <0.7 were not considered.
Velocity tuning of IC neurons was then assessed by comparing the orientation of the Gaussian (θ) with the slope of the velocity line that passes through the peak response at the (x,y) location. We define the orientation error (OE) of a neuron as the difference between the angle of optimal velocity tuning (β) and the orientation angle (θ): OE = β − θ, where β = atan(y/x), and both angles are in reference to the vertical axis. Therefore, if the Gaussian fit had its main axis oriented toward the origin (0,0), then it would have an OE of 0, which suggests a strong tuning for FM velocity. Alternatively, higher absolute values of OE would indicate lesser degrees of velocity tuning.
Decomposition of conspecific vocalizations.
Because moving ripples make up the Fourier basis components of the spectrotemporal domain, each syllable of a bat call was decomposed into a linear sum of moving ripples as described by Singh and Theunissen (2003). This was accomplished by performing a windowed Fourier transform in two dimensions on the spectrogram of that syllable after subtracting its mean as follows:
where Ft,x{.} denotes the Fourier transform with respect to time and logarithmic frequency, S is the spectrogram of a bat call, and S̄ is its mean over time and frequency (direct current component). A magnitude matrix for each syllable was constructed by plotting the magnitude of each ripple present in the call with a range of temporal modulation rates from −400 to 400 Hz and a range of spectral modulation rates from −5 to 5 cycles per octave. Similar to the magnitude matrix of an IC neuron showing the magnitude of each ripple present in the STRF, the magnitude matrix of a bat call shows the magnitude of the spectral and temporal modulations (ripples) present in each call. The average FM velocity present in each syllable of a bat vocalization was evaluated by calculating the slope of the velocity line passing through the origin and the peak value of its magnitude matrix.
Results
This study is based on 114 neurons recorded from the central nucleus of the IC of Mexican free-tailed bats. Similar to other STRF studies in the IC (Poon and Yu, 2000; Escabi and Schreiner, 2002), cells in our study responded in one of three ways to the moving ripple stimuli. Eight neurons (∼7%) failed to respond to any of the ripple stimuli, and no STRF could be extracted for these cells. Another 47 neurons (∼41%) either responded to only a few of the ripple stimuli or did not phase lock well to modulations in the stimuli, and thus STRFs could not be derived for these neurons either. However, 59 neurons (∼52%) responded to ripple stimuli with phase-locked responses, and STRFs were constructed for these neurons. In these 59 neurons, their tone-evoked BFs, the frequency requiring the lowest intensity to evoke spikes, ranged from 16 to 49 kHz, although most (30 of 59, 51%) had BFs between 21 and 25 kHz. The BFs of 24% (14 of 59) were between 16 and 20 kHz, and 17% (10 of 59) were tuned between 26 and 30 kHz. The remaining 8% were tuned to frequencies above 30 kHz. Although most of the neurons in our sample were tuned to a narrow range of frequencies, between 21 and 25 kHz, this frequency range is overrepresented in the cochlea as well as in other auditory brainstem nuclei of Mexican free-tailed bats (Vater and Siefer, 1995; Bauer et al., 2002; Klug et al., 2002; Xie et al., 2005).
A representative STRF is shown in Figure 2A and illustrates many of the features common to the STRFs we obtained from the other 58 neurons. The STRF had a clear excitatory region surrounded temporally and spectrally by inhibitory regions. In addition, the neuron had an onset inhibitory region at a frequency corresponding to the excitatory frequency but with a shorter latency that preceded the excitation in time and an offset inhibitory region at the same frequency as the excitatory frequency but with a longer latency. Surrounding inhibitory regions on only the low-frequency side of the excitatory regions, as occurred in the cell in Figure 2A, were seen in ∼11% of the neurons. Inhibitory regions on both the high- and low-frequency side of the excitatory region were seen in the majority of STRFs (∼63%), although their relative magnitudes and shapes differed greatly among different cells. In others (∼5%), the surround inhibition was only above the excitatory region, whereas other cells had no surrounding inhibitory regions (∼21%). All STRFs also had onset or offset inhibitory regions, or both onset and offset inhibition, whose frequencies corresponded to but were temporally separated from the excitatory regions. The presence of onset and/or offset inhibitory regions is consistent with results reported in previous studies (Park and Pollak, 1993; Pollak and Park, 1993; Covey et al., 1996).
Figure 2.

Features of STRFs and their agreement with tone-evoked responses. A, B, STRF generated by a family of moving ripples is shown as a two-dimensional plot, and the same STRF plotted in three dimensions is shown below. Excitation is indicated in red and inhibition in blue, with black contour lines depicting significant regions (see Materials and Methods). The BFSTRF, the frequency on the spectral axis of the STRF that had the highest peak on the temporal axis, was ∼25 kHz. The STRF also had both onset and offset inhibitions, whose frequencies corresponded to but were temporally separated from the excitatory region, and an inhibitory region that flanked the low frequency side of the excitatory region. C, The tuning curve of the same neuron generated by tone-evoked responses. The BF, the frequency to which the neuron was most sensitive, of the tone-evoked tuning curve was also 25 kHz. D, E, Plots showing agreement between tone evoked responses and STRFs in 43 IC neurons.
Receptive fields and tuning curves
To verify the validity of STRF excitatory regions, we compared tone-evoked tuning curves of 43 neurons with their corresponding STRFs. The best frequency of the tuning curve (BFTC) was compared with the best frequency of the STRF (BFSTRF), the frequency on the spectral axis of the STRF that had the highest peak on the temporal axis. In almost every neuron, the BFTC was in close agreement with the BFSTRF obtained from responses to ripple stimuli (r = 0.97) (Fig. 2D). We also compared the frequency of the tone burst that evoked the highest spike count with the BFSTRF of the neuron (Fig. 2E). Here too there was a strong correlation between the two measures (r = 0.96). These results indicate that the STRFs extracted the excitatory response properties from these IC neurons.
Predicting neural response to conspecific vocalizations
To further establish the validity of STRFs, we asked whether the STRFs could predict how the neurons would respond to complex signals that were not used to generate their STRFs. To do this, we presented a suite of six conspecific communication calls to 44 neurons that were held long enough so that we obtained both their STRFs and responses to the calls. We compared the responses that were actually evoked by the six calls with the predicted responses for those calls that were generated by convolving the STRF of the neuron with the spectrogram of each communication call. We then evaluated (1) the degree to which the temporal response patterns predicted by the convolutions matched the temporal response patterns that were actually evoked by the calls and (2) whether the convolutions predicted which calls actually evoked responses and which calls failed to evoke responses.
The agreement among the predicted and evoked responses differed among the 44 neurons and ranged from poor to very good. Although the 44 neurons displayed various degrees of predictability, there were no obvious differences in the STRFs of neurons whose STRFs yielded high predictabilities from those that yielded low predictabilities. In ∼27% (12 of 44) of the cells, the median correlation of predicted and evoked responses ranged from 0.1 to 0.29. However, in 73% (32 of 44) of the cells, the median correlations were at least 0.3 and typically much higher. In these neurons, the STRFs not only predicted the calls to which the neurons responded and their temporal discharge patterns but also predicted the calls to which the neurons failed to respond. Two examples of neurons that had good predictions are shown in Figure 3, A and B. Both neurons had similar BFs, 25 kHz (Fig. 3A) and 23 kHz (Fig. 3B), and both neurons responded similarly to some calls and differently to others. This shows that even minor differences in the spectrotemporal arrangement of excitatory and inhibitory regions can have a substantial influence on shaping responses to complex signals.
Blocking inhibitory receptors
One of the questions we address is whether the inhibitory regions in the STRFs were caused by inhibition at that IC cell or whether the inhibition occurred in a lower nucleus and the spike suppressions were then inherited by the IC cell. These alternatives are not mutually exclusive, and it may be that some inhibitory frequency regions were caused by inhibition at the IC cell whereas other inhibitory regions of the same cell were inherited from lower nuclei.
To evaluate the degree to which inhibition was generated in the IC, we recorded STRFs in 16 cells both before and while inhibition was blocked by the iontophoretic application of bicuculline, an antagonist of GABAA receptors, and/or strychnine, an antagonist of glycine receptors. In 12 of 16 cells, some of the inhibitory fields in their STRFs were essentially eliminated and others were greatly reduced when inhibition was blocked, as illustrated by the neuron in Figure 4. Although the blockers eliminated some inhibitory regions in 12 of 16 neurons, in none of those neurons could we completely eliminate all inhibition. Presumably the remaining inhibitory regions were either inherited from lower regions or remained because the drugs failed to block all inhibitory receptors on the neurons.
Figure 4.
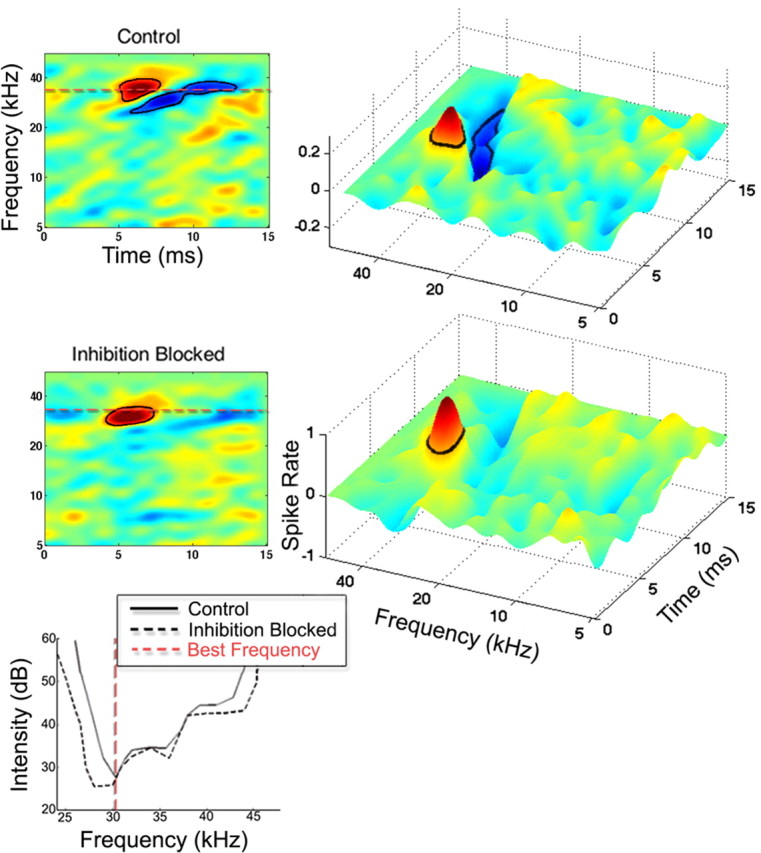
Effects of blocking inhibition on the STRF and tuning curve of an IC neuron. The reduction in surrounding inhibitory regions in the STRF of a neuron before blocking inhibition (control) and while inhibitory receptors were blocked. Blocking inhibition also caused a small expansion of the excitatory region of the neuron. Both bicuculline (60 nA injection current) and strychnine (60 nA injection current) were applied to the cell.
Inseparability and direction selectivity
As shown in the previous sections, and as confirmed by the STRF predictions, the STRFs were able to extract excitatory and inhibitory response properties in many IC neurons. In this section, we analyzed the arrangement of excitatory and inhibitory regions within the STRFs of the 32 neurons whose median predictability for calls was 0.3 or above. Because most bat communication and echolocation calls are composed of FM sweeps, we investigated the selectivity of the 32 neurons for the direction of spectral motion by evaluating the spectrum–time inseparability of their STRFs.
Similar to the analysis used in the visual system to assess directional selectivity of motion (Reid et al., 1991; Priebe et al., 2003), we calculated an Ins for each STRF to obtain information about whether the spectrotemporal organization of its receptive fields had features required for FM sweep direction selectivity. An STRF whose spectrotemporal features are fully separable can be expressed as the product of a function in time and another in frequency, and thus the same temporal response pattern would be evoked by any excitatory frequency (Sen et al., 2001). Neurons with fully separable STRFs cannot be directionally selective. For a neuron to respond more favorably to one FM sweep direction over the other, its receptive field must have different temporal response properties (latencies) for different frequencies, and thus its response to any auditory stimulus has to take both the spectral and temporal properties of the stimulus into consideration, i.e., its STRF is spectrotemporally inseparable.
To illustrate how these features contribute to directional selectivity, either excitatory or inhibitory regions or both regions in the STRFs of inseparable neurons are tilted in the frequency–time plane (Fig. 3A, the STRF). The spectrotemporal tilts represent shifts in latency of either excitation or inhibition along the frequency axis. The tilt in the excitatory field could impart a limited degree of directional preference. The reason is that any point in time an FM signal sweeping in the nonpreferred direction will encroach on a smaller portion of the excitatory receptive field than will a signal that sweeps in the preferred direction. Whether or not tilts occur in the excitatory field, tilted inhibitory fields enhance directional preferences, or even create them, because signals sweeping in the nonpreferred direction simultaneously evoke both excitation and inhibition, thereby suppressing responses to that FM direction, whereas signals sweeping in the preferred direction activate excitation and inhibition at different times, thereby allowing the cell to respond to the preferred direction.
To evaluate the degree of inseparability, we calculated the overall inseparability of the STRFs of each of the 32 neurons whose median predictability for calls was 0.3 or above. Inseparability is not an all-or-none property, and STRFs can be partially inseparable. Most IC neurons had some degree of inseparability, with a mean inseparability index of 0.33 ± 0.14. The distribution of inseparability indices is shown in Figure 5A.
Figure 5.

Inseparability and direction selectivity of STRFs. A, Distribution of the inseparability indices across all IC neurons with a valid STRF that yielded a predictability of 0.3 or higher. B, Distribution of direction selectivity indices across the same neurons. C, Correlation between the two indices indicating a strong contribution of inseparability of the STRFs to direction selectivity. D, Blocking inhibitory receptors of 12 IC neurons reduced their direction selectivity and to a lesser extent their spectrum–time inseparability, indicating that both properties are shaped by inhibition.
To evaluate the relationship between inseparability and FM directional selectivity, we determined the preference for FM sweep direction in the 32 neurons and correlated their directional selectivity with their inseparability index. We evaluate preferences for FM sweep direction by referring to the magnitude matrix of each neuron that was used to construct its STRF. As described in Materials and Methods, each moving ripple we presented was constructed from a particular SMR and a TMR, which in combination imparted a frequency modulation sweep with a certain velocity and upward or downward direction (Fig. 1B). The vigor with which a neuron responded to each downward- and upward-moving ripple is documented in its magnitude matrix (Figs. 1D, 6A). Because ripples in the first quadrant of the magnitude matrix were all downward sweeping and ripples in the second quadrant were all upward sweeping, we calculated a DSI for each neuron by comparing the relative power between the first and second quadrants in the magnitude matrix of each neuron. Negative values show that downward-sweeping ripples in the first quadrant of the matrix evoked the strongest responses, and positive values indicate strongest responses to upward-sweeping ripples in the second quadrant. We considered neurons to be directional selective if their absolute DSI was >0.25. As seen in Figure 5B, the DSIs of most (22 of 32) neurons were more negative than −0.25, showing that most IC neurons favored downward-sweeping ripples. The DSIs of only two neurons were greater than +0.25 and were selective for upward sweeps. The remaining eight neurons had DSIs between −0.25 and +0.25 and were considered nonselective. The average direction selectivity index was −0.37 ± 0.3.
Figure 6.

A, B, Contour plots of the magnitude matrices of one neuron containing the ripple responses obtained before (A) and while (B) inhibition was blocked. Before inhibition was blocked, the neuron responded strongly to downward-sweeping ripples in quadrant 1 (Q1) and hardly at all to upward-sweeping ripples in quadrant 2 (Q2), and thus was directionally selective. Its directional selectivity index was −0.91. When inhibition was blocked, the range of SMRs as well as TMRs to which the cell responded increased in both quadrants of the magnitude matrix. Thus, the directional selectivity index was reduced to −0.35 attributable to the smaller difference in overall power between the two quadrants. The resulting STRFs before and while inhibition was blocked are shown in C and D, respectively.
To evaluate the relationship of inseparability and direction selectivity (tilt), we plotted the absolute magnitude of the direction selectivity index ( DSI ) against the inseparability index for each of the 32 neurons. As shown in Figure 5C, the inseparability index was strongly correlated with the direction selectivity index (r = 0.7). This suggests that spectrum–time inseparability of IC neurons is the main contributor to the direction selectivity. Moreover, because most direction selectivity indices were negative, IC neurons in our study had a preference for responding to downward-sweeping compared with upward-sweeping ripples and presumably other FM signals as well.
Inhibition shapes directional selectivity
Previously we showed that blocking inhibition eliminated most of the inhibitory fields in the STRFs of the majority of neurons. If the structure (tilting) of surround inhibition in the STRF contributes to inseparability, then blocking inhibition should not only reduce inseparability but also should reduce direction selectivity. To show this relationship, we calculated inseparability and direction selectivity indices for the 12 neurons whose STRFs were changed when inhibition was blocked. In the majority of these neurons, blocking inhibition caused a reduction in both inseparability and direction selectivity indices (Fig. 5D). An example showing the change in the magnitude matrix of responses of a neuron evoked by upward- and downward-sweeping ripples before and while inhibition was blocked is shown in Figure 6. Blocking inhibition caused a 56% reduction in direction selectivity indices, declining from a mean of −0.5 to −0.24, whereas inseparability decreased by 20%, from a mean of 0.38–0.30.
One explanation for this difference in the effects of inhibition on direction selectivity and inseparability is that blocking inhibition frequently causes an expansion of the excitatory receptive field, in which the expansion is not uniform along the spectrotemporal axis (Yang et al., 1992; Palombi and Caspary, 1996; LeBeau et al., 2001; Klug et al., 2002). Such a nonuniform expansion of the excitatory receptive field contributes to inseparability. Thus, blocking inhibition could have had two opposing influences on inseparability. It reduced inseparability attributable to the reduction or elimination of tilted inhibitory regions, thereby reducing or eliminating the power asymmetry between the two quadrants of the magnitude matrix. However, a nonuniform expansion in excitation could enhance inseparability if responses to spectral and temporal modulation rates were different for the preferred compared with the nonpreferred direction (Fig. 6B), thereby creating spectrotemporal asymmetries between the two quadrants of the magnitude matrix. The net effect should be a substantial reduction of direction selectivity coupled with a smaller change in inseparability, which is the result we obtained.
Comparing properties of bat calls with response features of IC neurons
In the section above, we showed that most IC neurons in the Mexican free-tailed bat were directionally selective, favoring the downward FM direction. This directional preference agrees with the prominence of downward FM components present in their echolocation and social communication calls, an agreement that can be qualitatively assessed by visually inspecting their spectrograms (Fig. 3). Here we evaluate the velocities of the FM sweep components in their calls and compare them with the FM velocities of the ripple stimuli to which IC neurons responded most strongly.
We decomposed the spectrogram of each call into a set of ripples with different magnitudes and phases, as described in Materials and Methods. This allowed us to compare the magnitudes of the particular ripples present in each call with the magnitude of the response evoked by each of the ripples we presented, as revealed in the magnitude matrix of the neuron. Additionally, decomposing a call into its ripple components provides information about both its FM direction and its sweep rate (FM velocity). To further evaluate whether acoustic features of their natural calls correspond to neuronal response features, we calculated the FM velocities to which IC neurons were tuned and compared them with the FM velocities of their natural calls.
Before turning to the ripple decomposition of the natural calls and how that decomposition was compared with the ripple composition of the STRF of the neuron, we first illustrate how the decomposition was used to assess FM velocity by considering a simpler signal, a synthetic downward FM sweep. As shown in Figure 7, the ripple composition of an FM sweep is aligned diagonally on its magnitude matrix and clusters around a line that passes through the origin (0,0). The slope of the line indicates the FM velocity (sweep rate) of the signal. Because the velocity of a moving ripple is equal to the ratio of its temporal to spectral modulation rates (v = TMR/SMR), each of the ripples that lie on that line has the same velocity, which is the velocity of the FM sweep.
Figure 7.

Decomposing a synthetic FM sweep into its ripple components. A, A spectrogram of a synthetic, downward FM sweep moving at a constant velocity indicated by its slope. B, Magnitude matrix of the FM sweep shown in A obtained by the two-dimensional Fourier transform of its spectrogram. Because FM velocity is equal to the ratio of temporal to spectral modulation rates (TMR/SMR), the ripple composition of the sweep clusters around a line passing through the origin (0,0) with a slope that indicates the FM velocity of the sweep.
If an IC neuron were selective for an FM velocity, in addition to FM direction, then its magnitude matrix, which shows the response magnitudes evoked by each moving ripple, should express similar features to those of the magnitude matrix of a decomposed FM signal. Specifically, those ripples that evoked responses should approximately cluster around a line that passes through the origin of the magnitude matrix, similar to that shown for the synthetic FM sweep. The slope of the line indicates the velocity to which the neuron is best tuned, and most ripple responses should be aligned or oriented along that velocity line. Velocity selectivity thus requires an orientation or tilt of responses in one quadrant of the magnitude matrix. Therefore, velocity tuning entails inseparability within a particular FM direction (quadrant) in addition to full spectrum–time inseparability (Depireux et al., 2001). Although overall inseparability provides the substrate for direction selectivity as discussed above, quadrant (directional) inseparability enables an IC neuron to be selective for the velocity of spectral motion.
To evaluate whether IC neurons were tuned to velocity, we first calculated the quadrant inseparability for the downward direction in the 30 neurons whose STRFs yielded good predictions and had strong responses in the first quadrant of their magnitude matrix. Most neurons in our sample were indeed quadrant inseparable, with a mean index of 0.25 ± 0.12. Next we evaluated the degree to which responses were both elongated and oriented along a particular velocity line in the magnitude matrix. This was computed by fitting the responses of a neuron with a rotated two-dimensional Gaussian (Fig. 8A,B), which estimated the orientation angle as well as the spread of responses across the magnitude matrix (see Materials and Methods). To assess the goodness of the Gaussian fits, we correlated the responses with the resulting fitted model. All 30 neurons had correlation coefficients of at least 0.7, with a mean correlation coefficient of 0.86 ± 0.07. To evaluate the degree to which the orientation of each Gaussian contributed to the goodness of each fit, the fitting was repeated while constraining the orientation angle to 0 (θ = 0°). The non-oriented fits decreased the correlation coefficient in most neurons to a mean of 0.78 ± 0.08. Comparing the correlations of the oriented with those of the non-oriented fits suggests that the orientation of the Gaussians contributed significantly (t = 4.34; df = 58; p < 0.005) to the goodness of the fitted model.
Figure 8.

Velocity tuning of IC neurons. A, Contour plot of the first quadrant in the magnitude matrix of an IC neuron showing responses to downward-moving ripples. B, Responses were fit with a two-dimensional Gaussian, which estimated the orientation angle as well as the spread of responses across the quadrant. The orientation of responses was compared with the velocity line (blue) passing through the peak (black dot). The slope of the line represents the BV of the neuron. The deviation of the orientation angle from the angle of the BV line (orientation error) indicates the degree to which an IC neuron is tuned for velocity, in which the larger the error the poorer the tuning. The neuron shown had a BV of 105 octaves/s, an sx/sy ratio of 4.5, and an orientation error of 5°. C, Response peaks and orientation lines are shown for 30 IC neurons in reference to different velocity lines. Most IC neurons had a BV between 0 and 100 octaves/s, with a mean of ∼60 octaves/s. D, Distribution of orientation errors obtained from the 30 neurons showing a mean of 0° and an SD of 7°. This shows that most IC neurons in our sample had a strong degree of velocity tuning.
The orientation of each Gaussian was then compared with the slope of the velocity line passing through its peak (Fig. 8B). We refer to this line as the best velocity (BV) line, which represents an ideal or perfect velocity tuning. If all of the responses in the matrix fell on that line and only on that line, the neuron would have fired only to one FM velocity, its BV, and thus would have been perfectly tuned for velocity. Therefore, the deviation of the orientation angle from the angle of the BV line, referred to as the orientation error, indicates the degree to which an IC neuron is tuned for velocity, in which the larger the error the poorer the tuning.
Figure 8D plots the orientation errors in the 30 IC neurons. The orientation errors were normally distributed around a mean of 0° with an SD of 7°. Additionally, comparing the spread of responses along their orientation angle (sx) with their spread perpendicular to that angle (sy) indicates that responses were elongated along their orientation with a median ratio (sx/sy) of 5. Their mean ratio of 20 ± 18 was significantly larger than 1, the ratio of a circular shape (t = 4; df = 29; p < 0.001). This shows that most IC neurons in our sample had a strong degree of velocity tuning and that the neurons were tuned to the sweep rate shown by the BV line. The distribution of the FM velocities to which the neurons were best tuned is displayed in Figure 8C. Most IC neurons had a BV between 0 and 100 octaves/s with a mean of ∼60 octaves/s, yet some had BVs as high as ∼230 octaves/s.
To compare the velocity tuning of neurons with the velocity features of natural calls, we decomposed 21 bat communication and echolocation calls containing 32 syllables or contiguous segments into their ripple components. Figure 9 shows spectrograms of four of these syllables with the magnitude matrices of their ripple components. Because most of these syllables were downward FM sweeps, their ripple spectrum was oriented along the velocity line corresponding to the average FM velocity present in each syllable. Whereas some calls such as the protest squeal had 0 velocity, others reached sweep rates of ∼250 octaves/s. The distribution of velocities derived from decomposing 32 syllables are plotted in Figure 10A. Finally, we evaluated the degree to which the velocities of the calls that evoked the highest spike rates correlated with the best velocity of the neuron for the 17 cells in which median predictions were 0.5 or higher. Fifteen of the 17 neurons responded best to calls that had comparable velocities. Thus, three neurons tuned to velocities of 100 octaves/s or higher responded best to calls with velocities of at least 100 octaves/s, whereas 12 neurons tuned to velocities below 100 octaves/s responded best to calls with velocities below 100 octaves/s. In only two neurons was there a mismatch between the best velocity of the neuron and the velocity of the call that evoked the maximum response. For the 17 neurons, the correlation between call velocity and tuned velocity was 0.55.
Figure 9.

Decomposing conspecific calls into their ripple components. The top row shows examples of four syllables from four bat calls. The bottom row displays their magnitude matrices that show the ripple composition of each syllable. Similar to the decomposition of the synthetic FM sweep, the tilt in the ripple composition of each matrix indicates the averaged FM velocity present in each syllable. The FM velocity of each syllable is indicated by the dotted blue line in its matrix.
Figure 10.

FM velocities in communication calls and IC neurons. A, Distribution of FM velocities found in 21 calls containing 32 syllables. B, Distribution of the best velocities to which IC neurons are tuned. The two distributions are well correlated (r = 0.7), suggesting that the FM velocities to which IC neurons are tuned and the velocities present in their conspecific calls correspond closely.
What is apparent is that the FM velocities to which IC neurons are tuned and the velocities present in their conspecific calls correspond closely (Fig. 10). These results, together with the results shown in the previous sections, suggest that the population of IC neurons in Mexican free-tailed bats are tuned to both the FM direction and the velocities found in their natural signals.
Discussion
Our motivation for generating STRFs was to determine whether we could obtain a description of the spectrotemporal features of excitation and inhibition that is sufficiently general so that we could predict responses to other stimuli and thereby provide an explanation for the behavior of IC neurons. The test we used to evaluate the quality of the description was the degree to which the STRF predicted responses to natural calls. By presenting a family of moving ripples to IC neurons in Mexican free-tailed bats, we obtained STRFs from more than half of the neurons in our sample and showed that the STRFs in most of those neurons provide an accurate description of their linear receptive fields. That STRFs captured the excitatory response properties of IC neurons is shown by the high correlations of the BFs evoked by tones and the BF of the STRF, as well as the correlations of the frequencies evoking the highest discharges and the BF of the STRF. The STRFs not only extracted excitatory properties but also the inhibitory features as shown by the moderately high or very high correlations among predicted and evoked responses in a substantial number of cells. The processing in these neurons was essentially linear, and thus their STRFs extracted most of their functional properties. The validity of their STRFs was further illustrated by their ability to predict response failures to some calls.
Although the STRFs described the spectrotemporal properties of inhibition and excitation for most IC neurons, in some neurons the convolutions did not provide reliable predictions of the responses that were actually evoked by species-specific calls. The question is why the STRFs failed to predict responses to natural calls in those neurons, or in other neurons why the family of moving ripples failed to generate an interpretable STRF? One explanation for neurons in which the STRFs provided poor predictions is that they apparently had either static or dynamic nonlinear response properties that were stronger than the linear response properties extracted by the STRFs generated by moving ripples. Another explanation is that different stimuli may have generated stronger STRFs or different STRFs than did the family of moving ripples that we used. Recent studies in both cats (Escabi and Schreiner, 2002; Escabi et al., 2003) and songbirds (Woolley et al., 2005) have shown that stimuli with statistics that most closely correspond to natural stimuli generated either stronger or even different STRFs than other stimuli. For example, a recent study by Woolley et al. (2006) of the midbrain of zebra finches showed that STRFs generated with zebra finch songs yielded different STRFs than those generated by modulation limited noise. Moreover, the STRFs generated by song components provided better predictions of the actual responses evoked by song than did the STRFs generated by noise. Following from this, it seems possible that, had we used a variety of natural calls rather than ripples, we might have generated STRFs in a larger number of cells, and in those cells in which the ripple generated STRFs provided poor predictions, somewhat different STRFs would have been generated that may have yielded more accurate predictions of responses to the natural calls.
STRFs reveal spectral motion detecting properties of auditory neurons
Species-specific calls, or any other signal, can be decomposed into their ripple components, and thus the degree to which the ripple composition of any signal matches those in the magnitude matrix of the neuron both provides a prediction of how the neuron would respond to that signal, which is accomplished by convolution, and indicates which features of the signal the neuron prefers. Thus, our analysis showed that the majority of the conspecific social calls were composed mostly of ripples moving in the downward spectral direction. Consistent with this feature of the calls is that the STRFs of most IC neurons are directionally selective, with strong preferences for FM signals moving downward at sweep rates that correspond to the FM velocities present in their natural signals. The quantitative agreement between the spectrotemporal properties of bat calls and the spectrotemporal features of ripple stimuli that evoke responses in IC neurons indicates that many IC neurons are tuned to the features of their conspecific vocalizations. These results are consistent with those reported by Woolley et al. (2005) who showed that some spectral and temporal modulations that comprised the STRFs in the midbrain of the zebra finch were also prominent features of the spectral and temporal modulations present in its conspecific song.
Inhibition shapes directional selectivity
Directional selectivity for downward FM sweeps was strongly influenced by inhibition, because blocking inhibition greatly reduced the directional preference for downward-sweeping compared with upward-sweeping ripples. However, it was not inhibition per se that shapes directional selectivity but rather it was the tilting of the inhibitory surrounds along the spectrotemporal axis of the STRF, as shown by the contribution of the linear inseparability of IC neurons to direction selectivity. Inhibition is therefore tuning most IC neurons for downward direction selectivity and thereby shapes their responsiveness to specific features present in the species vocalizations.
Neurons in the IC of the bat are tuned for conspecific natural sounds
Directional selectivity for FM sweeps has been a recurrent theme in studies of the auditory system in a variety of mammals for more than 30 years (Grinnell and McCue, 1963; Suga, 1964, 1968; Clopton and Winfield, 1974; Mendelson and Cynader, 1985; Phillips et al., 1985; Poon et al., 1991; Fuzessery, 1994; Gordon and O'Neill, 1998; Poon and Yu, 2000). FM directional selectivity has been of particular interest in studies of bats attributable to the universal presence of brief downward-sweeping FM components in their echolocation calls (Pollak and Casseday, 1986; Neuweiler and Schmidt, 1993). Directional selectivity for FM signals in bats was first shown by Suga (1965, 1973), who also was the first to propose that selectivity is shaped by surround inhibition. This theme has been verified in more recent studies (Fuzessery and Hall, 1996; Koch and Grothe, 1998), which showed that blocking inhibition reduces FM directional properties of neurons in the IC of bats. More recently, neurons selective for FM velocity were reported in the IC of the pallid bat (Fuzessery et al., 2006). Direction selectivity and velocity tuning were also observed in the auditory cortex of bats (Razak and Fuzessery, 2006) and rats (Zhang et al., 2003). Both studies showed that directional selectivity, although not initially formed in the cortex, is enhanced at the cortex by both spectral and temporal asymmetries of inhibition.
The results reported here are consistent with and expand on the results reported in previous studies of bats and other mammals. Here we did not present electronically generated FM sweeps that were tailored to the BF of the neuron, but rather we used ripple stimuli as well as a suite of calls that Mexican free-tailed bats emit for social communication. We showed that most of the communication calls had prominent downward-sweeping FM components with velocities reflected by the tilt of their ripple composition. The importance of downward-sweeping FM signals for bats is further underscored by the similar spectrotemporal features of the FM sweeps in both their social communication and echolocation calls. Almost all of these signals are brief FM signals that have starting frequencies of 30–40 kHz and sweep downward approximately an octave in frequency at velocities ranging from 0 to 250 octaves/s. Thus, the dominance of direction-selective neurons favoring the downward direction with a similar distribution of preferred velocities as in the calls suggests that a substantial portion of the IC population is tuned by inhibition to respond to the features in its conspecific vocalizations.
Footnotes
This work was supported by National Institutes of Health Grant DC 20068. We thank Carl Resler for technical support and Achim Klug, Alex Huk, Ruili Xie, and Josh Gittleman for their comments and suggestions.
References
- Bauer EE, Klug A, Pollak GD. Spectral determination of responses to species-specific calls in the dorsal nucleus of the lateral lemniscus. J Neurophysiol. 2002;88:1955–1967. doi: 10.1152/jn.2002.88.4.1955. [DOI] [PubMed] [Google Scholar]
- Casseday JH, Fremouw T, Covey E. The inferior colliculus: a hub for the central auditory system. In: Oertel D, Popper AN, Fay RR, editors. Integrative functions in the mammalian auditory pathway. New York: Springer; 2002. pp. 238–318. [Google Scholar]
- Clopton BM, Winfield JA. Unit responses in the inferior colliculus of rat to temporal auditory patterns of tone sweeps and noise bursts. Exp Neurol. 1974;42:532–540. doi: 10.1016/0014-4886(74)90076-4. [DOI] [PubMed] [Google Scholar]
- Covey E, Kauer JA, Casseday JH. Whole-cell patch-clamp recordings reveals subthreshold sound-evoked post synaptic currents in the inferior colliculus of awake bats. J Neurosci. 1996;16:3009–3018. doi: 10.1523/JNEUROSCI.16-09-03009.1996. [DOI] [PMC free article] [PubMed] [Google Scholar]
- Depireux DA, Simon JZ, Klein DJ, Shamma SA. Spectro-temporal response field characterization with dynamic ripples in ferret primary auditory cortex. J Neurophysiol. 2001;85:1220–1234. doi: 10.1152/jn.2001.85.3.1220. [DOI] [PubMed] [Google Scholar]
- Efron B, Tibshirani RJ. Boca Raton, FL: CRC; 1994. An introduction to the bootstrap. [Google Scholar]
- Ehrlich D, Casseday JH, Covey E. Neural tuning to sound duration in the inferior colliculus of the big brown bat, Eptesicus fuscus. J Neurophysiol. 1997;77:2360–2372. doi: 10.1152/jn.1997.77.5.2360. [DOI] [PubMed] [Google Scholar]
- Escabi MA, Schreiner CE. Nonlinear spectrotemporal sound analysis by neurons in the auditory midbrain. J Neurosci. 2002;22:4114–4131. doi: 10.1523/JNEUROSCI.22-10-04114.2002. [DOI] [PMC free article] [PubMed] [Google Scholar]
- Escabi MA, Miller LM, Read HL, Schreiner CE. Naturalistic auditory contrast improves spectrotemporal coding in the cat inferior colliculus. J Neurosci. 2003;23:11489–11504. doi: 10.1523/JNEUROSCI.23-37-11489.2003. [DOI] [PMC free article] [PubMed] [Google Scholar]
- Faingold CL, Boersma Anderson CA, Caspary DM. Involvement of GABA in acoustically-evoked inhibition in inferior colliculus neurons. Hear Res. 1991;52:201–216. doi: 10.1016/0378-5955(91)90200-s. [DOI] [PubMed] [Google Scholar]
- Fritz J, Shamma S, Elhilali M, Klein D. Rapid task-related plasticity of spectrotemporal receptive fields in primary auditory cortex. Nat Neurosci. 2003;6:1216–1223. doi: 10.1038/nn1141. [DOI] [PubMed] [Google Scholar]
- Fuzessery ZM. Response selectivity for multiple dimensions of frequency sweeps in the pallid bat inferior colliculus. J Neurophysiol. 1994;72:1061–1079. doi: 10.1152/jn.1994.72.3.1061. [DOI] [PubMed] [Google Scholar]
- Fuzessery ZM, Hall JC. Role of GABA in shaping frequency tuning and creating FM sweep selectivity in the inferior colliculus. J Neurophysiol. 1996;76:1059–1073. doi: 10.1152/jn.1996.76.2.1059. [DOI] [PubMed] [Google Scholar]
- Fuzessery ZM, Richardson MD, Coburn MS. Neural mechanisms underlying selectivity for the rate and direction of frequency-modulated sweeps in the inferior colliculus of the pallid bat. J Neurophysiol. 2006;96:1320–1336. doi: 10.1152/jn.00021.2006. [DOI] [PubMed] [Google Scholar]
- Gordon M, O'Neill WE. Temporal processing across frequency channels by FM selective auditory neurons can account for FM rate selectivity. Hear Res. 1998;122:97–108. doi: 10.1016/s0378-5955(98)00087-2. [DOI] [PubMed] [Google Scholar]
- Grinnell AD, McCue JJ. Neurophysiological investigations of the bat Myotis lucifugus stimulated by frequency modulated acoustical pulses. Nature. 1963;198:453–455. [Google Scholar]
- Havey DC, Caspary DM. A simple technique for constructing “piggyback” multibarrel microelectrodes. Encephalogr Clin Neurophysiol. 1980;48:249–251. doi: 10.1016/0013-4694(80)90313-2. [DOI] [PubMed] [Google Scholar]
- Klein DJ, Depireux DA, Simon JZ, Shamma SA. Robust spectrotemporal reverse correlation for the auditory system: optimizing stimulus design. J Comput Neurosci. 2000;9:85–111. doi: 10.1023/a:1008990412183. [DOI] [PubMed] [Google Scholar]
- Klug A, Bauer EE, Hanson JT, Hurley L, Meitzen J, Pollak GD. Response selectivity for species-specific calls in the inferior colliculus of Mexican free-tailed bats is generated by inhibition. J Neurophysiol. 2002;88:1941–1954. doi: 10.1152/jn.2002.88.4.1941. [DOI] [PubMed] [Google Scholar]
- Koch U, Grothe B. GABAergic and glycinergic inhibition sharpens tuning for frequency modulations in the inferior colliculus of the big brown bat. J Neurophysiol. 1998;80:71–82. doi: 10.1152/jn.1998.80.1.71. [DOI] [PubMed] [Google Scholar]
- Kowalski N, Depireux DA, Shamma SA. Analysis of dynamic spectra in ferret primary auditory cortex. I. Characteristics of single-unit responses to moving ripple spectra. J Neurophysiol. 1996;76:3503–3523. doi: 10.1152/jn.1996.76.5.3503. [DOI] [PubMed] [Google Scholar]
- LeBeau FE, Malmierca MS, Rees A. Iontophoresis in vivo demonstrates a key role for GABAA and glycinergic inhibition in shaping frequency response areas in the inferior colliculus of guinea pig. J Neurosci. 2001;21:7303–7312. doi: 10.1523/JNEUROSCI.21-18-07303.2001. [DOI] [PMC free article] [PubMed] [Google Scholar]
- Mendelson JR, Cynader MS. Sensitivity of cat primary auditory cortex (AI) neurons to the direction and rate of frequency modulation. Brain Res. 1985;327:331–335. doi: 10.1016/0006-8993(85)91530-6. [DOI] [PubMed] [Google Scholar]
- Neuweiler G, Schmidt S. Audition in echolocating bats. Curr Opin Neurobiol. 1993;3:563–569. doi: 10.1016/0959-4388(93)90057-6. [DOI] [PubMed] [Google Scholar]
- Oliver DL, Huerta MF. Inferior and superior colliculi. In: Webster DB, Popper AN, Fay RR, editors. The mammalian auditory system: neuroanatomy. New York: Springer; 1992. pp. 168–221. [Google Scholar]
- Palombi PS, Caspary DM. GABA inputs control discharge rate primarily within frequency receptive fields of inferior colliculus neurons. J Neurophysiol. 1996;75:2211–2219. doi: 10.1152/jn.1996.75.6.2211. [DOI] [PubMed] [Google Scholar]
- Park TJ, Pollak GD. GABA shapes a topographic organization of response latency in the mustache bat's inferior colliculus. J Neurosci. 1993;13:5172–5187. doi: 10.1523/JNEUROSCI.13-12-05172.1993. [DOI] [PMC free article] [PubMed] [Google Scholar]
- Perrone JA, Thiele A. Speed skills: measuring the visual speed analyzing properties of primate MT neurons. Nat Neurosci. 2001;4:526–532. doi: 10.1038/87480. [DOI] [PubMed] [Google Scholar]
- Phillips DP, Mendelson JR, Cynader MS, Douglas RM. Responses of single neurones in cat auditory cortex to time-varying stimuli: frequency-modulated tones of narrow excursion. Exp Brain Res. 1985;58:443–454. doi: 10.1007/BF00235862. [DOI] [PubMed] [Google Scholar]
- Pollak GD, Casseday JH. New York: Springer; 1986. The neural basis of echolocation in bats. [Google Scholar]
- Pollak GD, Park TJ. The effects of GABAergic inhibition on monaural response properties of neurons in the mustache bat's inferior colliculus. Hear Res. 1993;65:99–117. doi: 10.1016/0378-5955(93)90205-f. [DOI] [PubMed] [Google Scholar]
- Pollak GD, Klug A, Bauer EE. Processing and representation of species-specific communication calls in the auditory system of bats. Int Rev Neurobiol. 2003a;56:83–121. doi: 10.1016/s0074-7742(03)56003-2. [DOI] [PubMed] [Google Scholar]
- Pollak GD, Burger RM, Klug A. Dissecting the circuitry of the auditory system. Trends Neurosci. 2003b;26:33–39. doi: 10.1016/s0166-2236(02)00009-7. [DOI] [PubMed] [Google Scholar]
- Poon PW, Yu PP. Spectro-temporal receptive fields of midbrain auditory neurons in the rat obtained with frequency modulated stimulation. Neurosci Lett. 2000;289:9–12. doi: 10.1016/s0304-3940(00)01251-9. [DOI] [PubMed] [Google Scholar]
- Poon PW, Chen X, Hwang JC. Basic determinants for FM responses in the inferior colliculus of rats. Exp Brain Res. 1991;83:598–606. doi: 10.1007/BF00229838. [DOI] [PubMed] [Google Scholar]
- Priebe NJ, Cassanello CR, Lisberger SG. The neural representation of speed in macaque area MT/V5. J Neurosci. 2003;23:5650–5661. doi: 10.1523/JNEUROSCI.23-13-05650.2003. [DOI] [PMC free article] [PubMed] [Google Scholar]
- Razak KA, Fuzessery ZM. Neural mechanisms underlying selectivity for the rate and direction of frequency-modulated sweeps in the auditory cortex of the pallid bat. J Neurophysiol. 2006;96:1303–1319. doi: 10.1152/jn.00020.2006. [DOI] [PubMed] [Google Scholar]
- Reid RC, Soodak RE, Shapley RM. Directional selectivity and spatiotemporal structure of receptive fields of simple cells in cat striate cortex. J Neurophysiol. 1991;66:505–529. doi: 10.1152/jn.1991.66.2.505. [DOI] [PubMed] [Google Scholar]
- Schuller G. A cheap earphone for small animals with good frequency responses in the ultrasonic frequency range. J Neurosci Methods. 1997;71:187–190. doi: 10.1016/s0165-0270(96)00142-2. [DOI] [PubMed] [Google Scholar]
- Sen K, Theunissen FE, Doupe AJ. Feature analysis of natural sounds in the songbird auditory forebrain. J Neurophysiol. 2001;86:1445–1458. doi: 10.1152/jn.2001.86.3.1445. [DOI] [PubMed] [Google Scholar]
- Singh NC, Theunissen FE. Modulation spectra of natural sounds and ethological theories of auditory processing. J Acoust Soc Am. 2003;114:3394–3411. doi: 10.1121/1.1624067. [DOI] [PubMed] [Google Scholar]
- Suga N. Recovery cycles and responses to frequency modulated tone pulses in auditory neurones of echo-locating bats. J Physiol (Lond) 1964;175:50–80. doi: 10.1113/jphysiol.1964.sp007503. [DOI] [PMC free article] [PubMed] [Google Scholar]
- Suga N. Analysis of frequency modulated sounds by auditory neurons of echolocating bats. J Physiol (Lond) 1965;179:26–53. doi: 10.1113/jphysiol.1965.sp007648. [DOI] [PMC free article] [PubMed] [Google Scholar]
- Suga N. Analysis of frequency-modulated and complex sounds by single auditory neurons of bats. J Physiol (Lond) 1968;198:51–80. doi: 10.1113/jphysiol.1968.sp008593. [DOI] [PMC free article] [PubMed] [Google Scholar]
- Suga N. Feature extraction in the auditoy system of bats. In: Moller AR, editor. Basic mechanisms in hearing. New York: Academic; 1973. pp. 675–744. [Google Scholar]
- Vater M, Siefer W. The cochlea of Tadarida brasiliensis: specialized functional organization in a generalized bat. Hear Res. 1995;91:178–195. doi: 10.1016/0378-5955(95)00188-3. [DOI] [PubMed] [Google Scholar]
- Woolley SM, Fremouw TE, Hsu A, Theunissen FE. Tuning for spectro-temporal modulations as a mechanism for auditory discrimination of natural sounds. Nat Neurosci. 2005;8:1371–1379. doi: 10.1038/nn1536. [DOI] [PubMed] [Google Scholar]
- Woolley SM, Gill PR, Theunissen FE. Stimulus-dependent auditory tuning results in synchronous population coding of vocalizations in the songbird midbrain. J Neurosci. 2006;26:2499–2512. doi: 10.1523/JNEUROSCI.3731-05.2006. [DOI] [PMC free article] [PubMed] [Google Scholar]
- Xie R, Meitzen J, Pollak GD. Differing roles of inhibition in hierarchical processing of species-specific calls in auditory brainstem nuclei. J Neurophysiol. 2005;94:4019–4037. doi: 10.1152/jn.00688.2005. [DOI] [PubMed] [Google Scholar]
- Yang L, Pollak GD, Resler C. GABAergic circuits sharpen tuning curves and modify response properties in the mustache bat inferior colliculus. J Neurophysiol. 1992;68:1760–1774. doi: 10.1152/jn.1992.68.5.1760. [DOI] [PubMed] [Google Scholar]
- Zhang LI, Tan AY, Schreiner CE, Merzenich MM. Topography and synaptic shaping of direction selectivity in primary auditory cortex. Nature. 2003;424:201–205. doi: 10.1038/nature01796. [DOI] [PubMed] [Google Scholar]