

Abstract
The mechanisms that specify the vesicular phenotype of inhibitory interneurons in vertebrates are poorly understood because the two main inhibitory transmitters, glycine and GABA, share the same vesicular inhibitory amino acid transporter (VIAAT) and are both present in neurons during postnatal development. We have expressed VIAAT and the plasmalemmal transporters for glycine and GABA in a neuroendocrine cell line and measured the quantal release of glycine and GABA using a novel double-sniffer patch-clamp technique. We found that glycine is released from vesicles when VIAAT is coexpressed with either the neuronal transporter GlyT2 or the glial transporter GlyT1. However, GlyT2 was more effective than GlyT1, probably because GlyT2 is unable to operate in the reverse mode, which gives it an advantage in maintaining the high cytosolic glycine concentration required for efficient vesicular loading by VIAAT. The vesicular inhibitory phenotype was gradually altered from glycinergic to GABAergic through mixed events when GABA is introduced into the secretory cell and competes for uptake by VIAAT. Interestingly, the VIAAT ortholog from Caenorhabditis elegans (UNC-47), a species lacking glycine transmission, also supports glycine exocytosis in the presence of GlyT2, and a point mutation of UNC-47 that abolishes GABA transmission in the worm confers glycine specificity. Together, these results suggest that an increased cytosolic availability of glycine in VIAAT-containing terminals was crucial for the emergence of glycinergic transmission in vertebrates.
Keywords: inhibitory transmission, glycine, GABA, vesicles, uptake, quanta
Introduction
Glycine and GABA are the major fast inhibitory neurotransmitters released at central synapses but, in contrast to the widespread usage of GABA, glycine transmission is restricted to the spinal cord, hindbrain, and retina. In these structures, glycine signaling is not segregated from, but intermingles with GABA signaling at both presynaptic (Burger et al., 1991; Christensen et al., 1991; Todd et al., 1996; Dumba et al., 1998) and postsynaptic levels (Triller et al., 1987; Bohlhalter et al., 1994). Although both amino acids can be released separately or together (Jonas et al., 1998; O'Brien and Berger, 1999), the mechanisms that specify their relative contribution in vesicles are not fully understood. Glycine and GABA share the same vesicular transporter, named vesicular inhibitory amino acid transporter (VIAAT) or vesicular GABA transporter (VGAT) (McIntire et al., 1997; Sagné et al., 1997; Chaudhry et al., 1998; Dumoulin et al., 1999; Wojcik et al., 2006), but, in contrast to GABA, glycine uptake by recombinant VIAAT has not been detected (G. C. Bellenchi and B. Gasnier, unpublished data). In addition, it is not known how glycine, with an estimated IC50 value of ∼27 mm (McIntire et al., 1997; Bedet et al., 2000), can effectively compete with GABA for uptake by VIAAT.
To demonstrate glycine uptake by VIAAT, we expressed the vesicular transporter in the neuroendocrine serotoninergic cell line BON and used a sniffer patch-clamp technique to detect vesicular release of glycine. A similar approach has been previously used to show that expression of the vesicular glutamate transporter VGLUT1 is sufficient to induce glutamate exocytosis (Takamori et al., 2000). However, in the case of glycine, we suspected that expression of the vesicular transporter VIAAT would not be sufficient to induce glycine exocytosis, despite the ubiquity of this amino acid, because genetic disruption of GlyT2 in mice (Gomeza et al., 2003) and humans (Eulenburg et al., 2006; Rees et al., 2006) reduces glycinergic transmission and causes hyperekplexia. Therefore, the primary role of GlyT2 may be to stockpile very large amounts of glycine in nerve terminals to promote significant VIAAT-mediated vesicular filling.
This hypothesis, in which plasmalemmal uptake replaces biosynthetic enzymes for the supply of transmitter to the synaptic vesicle and therefore determines the presynaptic phenotype, implies that under physiological condition, GlyT2 accumulates supramillimolar levels of glycine from a low micromolar extracellular source. For this to occur, GlyT2 must therefore compete successfully with the glial recapture of glycine by the transporter GlyT1, with which it shares a common extracellular space. To investigate the functional coupling of plasmalemmal and vesicular glycine uptake, we compared the release of glycine from VIAAT-containing vesicles when GlyT1 is substituted for GlyT2 in the BON cell model. Then, we examined alterations in vesicular glycine content introduced by GABA competition for VIAAT. We were able to clearly differentiate the release of glycine and GABA from single vesicles by using specific ligand-gated channels with different ionic permeabilities. Finally, we determined whether a change in the substrate specificity of the vesicular transporter was required for the emergence of glycine transmission in vertebrates by comparing VIAAT with an invertebrate ortholog.
Materials and Methods
Plasmids and molecular biology.
cDNA of the human glycine receptor-α1 (GlyR-α1; a gift from H. Betz, Max-Planck Institute for Brain Research, Frankfurt, Germany) was subcloned into a pIRES2-EGFP vector (Clontech, Cambridge, UK), whereas cDNAs coding for the C. elegans EXP-1A (a gift from E. M. Jorgensen, University of Utah, UT) was subcloned in the p3αpA plasmid vector (Roux and Supplisson, 2000) and transfected into human embryonic kidney 293 (HEK293) cells. Rat GlyT1b (a gift from K. Smith, Synaptic Pharmaceutical, Paramus, NJ), rat GlyT2a (a gift from B. López-Corcuera and C. Aragón, Universidad Autónoma de Madrid, Madrid, Spain), and rat GABA transporter subtype 1 (GAT1; a gift from B. Kanner, Hebrew University, Jerusalem, Israel) were subcloned in the p3αpA plasmid vector for transfection into BON cells (a gift from C. M. Townsend, University of Texas Medical Branch, Galveston, TX) along with a cDNA coding for EGFP for identification of transfected cells. Rat VIAAT cDNA (a gift from B. Giros, Inserm U513, Créteil, France) was subcloned into pcDNA3 and stably expressed in BON cells as described previously by Gras et al. (2002). Two independent stable transfectants were used throughout this study. C. elegans unc-47 cDNA (a gift from E. M. Jorgensen) was subcloned into pIRES2-EGFP, and the G462R mutation was introduced by Quikchange site-directed mutagenesis (Stratagene, La Jolla, CA) and verified by sequencing.
Cell culture and transfection.
HEK293 cells were grown in DMEM supplemented with 10% fetal calf serum (Sigma, St. Louis, MO), 100 IU/ml penicillin, and 100 μg/ml streptomycin in a 5% CO2/air atmosphere. BON cells were cultured as indicated in Gras et al. (2002). HEK293 and BON cells were cultured on glass coverslips (Marienfeld, Germany) and transient transfections were performed with 1–3 μg of cDNAs using standard protocols provided with Lipofectamine 2000 (Invitrogen, Carlsbad, CA) or GeneJammer (Stratagene) transfection kits. Coexpression of GlyR and EXP1 in HEK293 cells was achieved with a 1:5 DNA ratio. After transfection, BON cells were maintained in nominally glycine-free media (BHK-21 media, without serum) and glycine and/or GABA (300 μm unless otherwise indicated) were added to the media 12–24 h before experiments. The expression of GlyT1 and GlyT2 at the membrane surface of BON cells was confirmed by confocal microscopy and by recording the whole cell transporter current evoked by glycine (300 μm) at −70 mV (data not shown). The average amplitudes of the glycine-evoked currents were −1.42 ± 0.5 pA/pF (n = 4) for GlyT1 and −0.74 ± 0.5 pA/pF (n = 4) for GlyT2. Cell culture reagents were supplied by Invitrogen or PAA Laboratories (Linz, Austria).
Sniffer-patch electrophysiology.
Whole-cell patch-clamp recordings from EGFP- expressing HEK293 cells were performed using an Axopatch 200A amplifier (Molecular Devices, Menlo Park, CA) and borosilicate glass pipettes with a typical resistance of 4–6 MΩ, coated with dental wax and filled with either of the following solutions (in mm): 155 K-gluconate, 4 KCl, 10 HEPES, 0.1 EGTA, 5 ATP-Mg, pH 7.3 (see Figs. 1–3); or 135 K-gluconate, 4 KCl, 20 HEPES, 20 BAPTA, 5 ATP-Mg, pH 7.3 (see Figs. 4–7). HEK293 cells were held at −45 mV and lifted off the coverslip and tested for their receptor expression by rapid application of glycine or GABA (200 μm) using an automated multibarrel perfusion system (SF-77B; Warner Instrument, Hamden, CT). Only HEK293 cells with current amplitudes of 1–3 nA for GlyR and 0.4–2 nA for EXP1 were used in experiments. Patch-clamped HEK293 cells were gently pressed onto the surface of transfected BON cells expressing EGFP using a piezzo micromanipulator (Polytec PI, Pantin, France). Acetylcholine (ACh) (100 μm) was applied to trigger exocytotic release of glycine or GABA from BON cells. Currents were filtered at 1–2 kHz and acquired at 10–20 kHz using Digidata 1200 (Molecular Devices) and Clampex acquisition software (Pclamp 8; Molecular Devices). Between trials, the currents evoked by glycine and GABA, along with the cell capacitance and series resistance, were continuously monitored to verify the stability of the HEK cell. Because the release rate decreases to near zero during prolonged ACh (100 μm) applications (>1 min; data not shown), ACh was applied up to 10 times (typically six) to each BON cell every 3–4 min. BON cells with a mean release rate lower than 2 events/min were discarded for further analysis to ensure a representative sampling of the vesicles population for different trials. Inhibitory transmitter release rate varied greatly from cell to cell. The cumulative release rates are normalized per minute of ACh application and averaged over multiple BON cells. When direct comparison of conditions were necessary, such as the experiments presented in Figure 3B,D, experiments were performed over a few days from a more homogenous subset of BON cells cultured in comparable conditions.
Figure 1.

VIAAT and GlyT2 coexpression promotes quantal glycine release. A, Schematic representation of the BON/HEK293 model. The micrograph is an overlay of phase contrast and green fluorescence images that shows two BON cells and a patch-clamped HEK293 cell expressing EGFP pressed on top of one of the BON cells. B, Left, Time course of Fluo4/AM fluorescence change in five representative BON/VIAAT cells evoked by the application of acetylcholine (bar, 100 μm). Right, Application of 4-DAMP (0.1 μm, red bar), a non-M2 muscarinic receptor antagonist, blocks the Ca2+ oscillations evoked by acetylcholine in five representative BON/VIAAT cells. C, A representative current trace recorded with a HEK/GlyR cell during ACh stimulation (bar, 100 μm) of a BON/VIAAT+GlyT2 cells after overnight incubation with glycine-containing media (300 μm). Transient currents were recorded from 114/301 BON/VIAAT+GlyT2 cells tested. D, No events were detected from naive BON cells (top trace, 18/18 cells) or from BON/GlyT2 cells (middle trace, 31/31 cells). No (in 60/71 cells) or small, low frequency transient currents (in 11/71 cells) were detected from BON/VIAAT cells (bottom trace). E, Transient currents recorded from BON/VIAAT+GlyT2 cells were blocked with strychnine (0.5 μm, red bar; four superimposed ACh applications are shown with different colors).
Figure 2.

Characteristics of the glycine events. A, Left, A current trace illustrating the broad range of glycine-events amplitudes. Right, Expanded view of 153 successive exocytotic events and their average (red trace) recorded during eight ACh applications to a single BON/VIAAT+GlyT2 cell. B, Small and large glycine-events (left) have comparable activation kinetics when normalized (right). C, Distribution probabilities of the 10–90% rise time (left) and 10–90% decay time (right) of glycine events (n = 4199). The cumulative probabilities are shown in red. D, Histograms of number (left) and first-latency (right) of the glycine-events recorded during each ACh application (n = 41). E, Normalized cumulative distribution of glycine-event peak-amplitudes recorded from five BON/VIAAT+GlyT2 cells (closed circles; 44 ACh applications, 688 events) incubated overnight in 300 μm glycine. The solid line corresponds to the fit of the data with the sum of two log-normal cumulative distribution functions (see Materials and Methods). The dashed lines represent the individual distributions with n1 = 5.7, μ1 = 3.4, σ1 = 0.49 (red line) and n2 = 9.3, μ2 = 5.1, σ2 = 1.0 (blue line).
Figure 3.

GlyT2 supports glycine release more efficiently than GlyT1. A, Representative glycine release events recorded with a HEK/GlyR cell apposed to BON/VIAAT+GlyT2 or BON/VIAAT+GlyT1 cells incubated for 12–24 h in [Gly]e = 3 μm. The current traces correspond to three successive ACh applications and are shown with different colors. B, The normalized cumulative distribution of glycine-event peak amplitudes recorded from eight BON/VIAAT+GlyT2 cells (closed circles; 59 Ach applications, 871 events) or from eight BON/VIAAT+GlyT1 cells (open squares; 37 Ach applications, 272 events) incubated overnight in 3 μm glycine. The solid line corresponds to the fit of the data with the sum of two log-normal cumulative distribution functions (n1 = 5.1, μ1 = 3.13, σ1 = 0.41, n2 = 9.6, μ2 = 4.7, σ2 = 1.0 for GlyT2; and n1 = 3.7, μ1 = 3.5, σ1 = 0.6, n2 = 4.1, μ2 = 5.7, σ2 = 1.37 for GlyT1). C, Representative glycine release events recorded with a BON/VIAAT cell expressing GlyT2 or GlyT1, as in A, but after a pulse-chase glycine-loading protocol: after transfection, BON cells were maintained in nominally glycine-free media and exposed to 30 μm glycine for 30 min 14–20 h before experiments. D, The normalized cumulative distribution of the glycine-event peak amplitudes recorded from five BON/VIAAT+GlyT2 cells (closed circles; 45 Ach applications, 1257 events) or from seven BON/VIAAT+GlyT1 cells (open squares; 25 Ach applications, 264 events) incubated as described in C. The solid line correspond to the fit of the data with the sum of two log-normal cumulative distribution functions (n1 = 10.1, μ1 = 3.35, σ1 = 0.48, n2 = 16.7, μ2 = 4.9; σ2 = 1.04 for GlyT2; and n1 = 1.4, μ1 = 3.2, σ1 = 0.29, n2 = 4.9, μ2 = 4.3; σ2 = 0.8 for GlyT1).
Figure 4.

Detection of GABA release from BON/VIAAT cells with HEK/GlyR+EXP1 cells. A, Schematic representation of the BON/HEK293 model for the codetection of GABA and glycine release. B, Glycine and GABA (200 μm) evoked currents with opposite polarity in HEK/GlyR+EXP1 cells held at −45 mV. C, Current–voltage relationships for glycine (closed circles; 200 μm) and GABA- (open circles; 200 μm) evoked currents in HEK/GlyR+EXP1 cells. Currents were normalized to their absolute amplitude at −45 mV. D, Concentration-response curves of GlyR (filled circles; EC50 = 63.9 ± 9.1 μm; h = 2.5 ± 0.5; n = 5) and EXP1 receptors (open circles; EC50 = 6.5 ± 0.5 μm; h = 1.4 ± 0.1; n = 6) were fitted using the Hill equation. GlyR- and EXP1-receptor mediated currents properties were identical when the receptors were expressed individually or in combination. E, Current trace recorded with a HEK/GlyR+EXP1 cell apposed to a BON/VIAAT+GAT1 cell incubated overnight in the presence of GABA and glycine (300 μm each). Application of Ach (100 μm) evoked only inward currents. F, GABA events (n = 17; average trace is shown in red) recorded during a single acetylcholine application. G, Distribution probabilities of the 10–90% rise time (left) and 10–90% decay time of GABA events (n = 659). The cumulative probability is shown in red. H, Normalized cumulative distribution of the peak amplitude of GABA events (n = 659). The solid line corresponds to the fit of the sum of two log-normal distributions (dashed lines) with the values of n1 = 4.8, μ1 = 2.61, σ1 = 0.3 (red line) and n2 = 6.8, μ2 = 3.42, σ2 = 0.61 (blue line).
Figure 5.

Detection of glycine and GABA corelease from individual vesicles. A, Algebraic sum of representative glycine and GABA events (left) predicts a biphasic unitary event (right) if glycine and GABA are released simultaneously. B, A representative unitary mixed event recorded with HEK/GlyR+EXP1 cell during ACh stimulation of a BON/VIAAT+GlyT2 cell incubated overnight in the presence of 300 μm GABA and glycine, reflecting GABA and glycine corelease from a single vesicle. C, Current trace with pure GABA and mixed events recorded during a single ACh application to a BON/VIAAT+GlyT2 cell incubated overnight in the presence of glycine and GABA. For clarity, the outward current amplitude scale was fixed at 300 pA. The inset shows traces of four consecutive mixed events with different peak amplitudes for the outward and inward currents. D, Histogram of the latency between the outward and inward peak current of mixed events. The solid line represents the cumulative probability. E, The glycine outward component of mixed events (top, insert) evoked during ACh application is blocked by the addition of 1 μm strychnine (bottom, insert), with no change in release rate.
Figure 6.
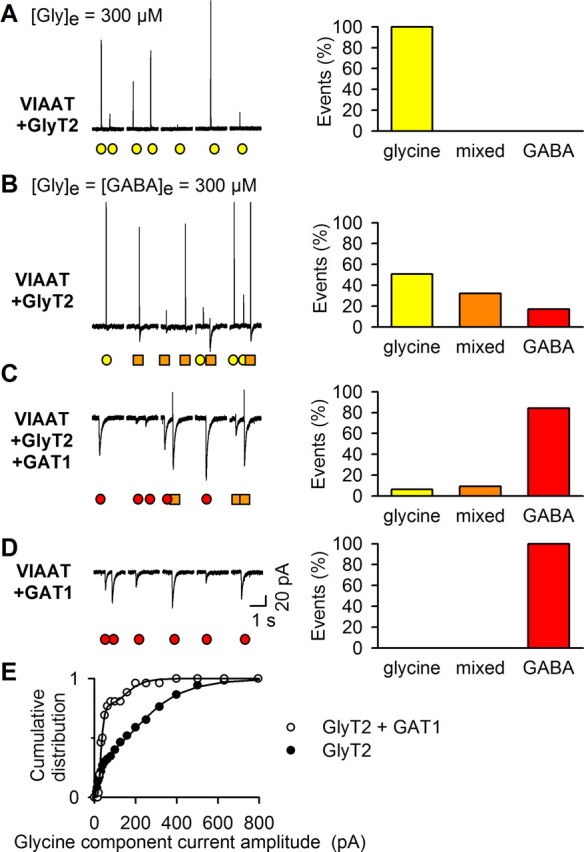
GlyT2-mediated [Gly]i can compete effectively with GABA for uptake by VIAAT. A–D, Left, Examples of five consecutive 2 s recordings of quantal release during a single ACh application to BON/VIAAT+GlyT2 (A, B), BON/VIAAT+GlyT2+GAT1 (C), and BON/VIAAT+GAT1 (D) cells incubated in [Gly]e = 300 μm without GABA (A) or in [Gly]e = [GABA]e = 300 μm (B–D). Glycine, mixed, and GABA events are indicated by yellow circles, orange squares, and red circles, respectively. Right, Proportions of glycine, mixed, and GABA events for 679 (A), 660 (B), 625 (C), and 512 (D) events recorded from 9 to 15 BON cells per condition. The number of glycine, mixed, and GABA events detected were 679, 0, 0 (A); 336, 212, 110 (B); 40, 58, 527 (C); and 0, 0, 512 (D), respectively, for the different conditions described above. E, Cumulative distribution of the peak amplitude of the glycine component of mixed currents recorded from BON/VIAAT cells expressing GlyT2 alone (closed circles; n = 20 cells) (see Fig. 6B) or in combination with GAT1 (open circles; n = 7 cells) (see Fig. 6C). The mean glycine component of mixed events decreases from 153.8 ± 14.2 pA (n = 127) to 58.0 ± 13.4 pA (n = 26) when GAT1 is expressed (p = 0.016; two-tailed Mann–Whitney test).
Figure 7.

The vesicular GABA transporter of C. elegans, UNC-47 accumulates glycine and the mutation G462R confers glycine specificity. A, Current trace recorded with a HEK/GlyR+EXP1 cell apposed to a BON/UNC47+GlyT2 cell during a single ACh application (top trace). Numbers mark the GABA, mixed, and glycine events shown below (red circle, orange squares, and yellow circles, respectively). B, In contrast, only pure glycinergic events are detected from BON/UNC47(G462R)+GlyT2 cells. C, Bar graph of the proportions of cumulative glycine, mixed, and GABA events from five BON/UNC-47+GlyT2 cells (777 events) and 14 BON/UNC-47(G462R) cells (259 events). The number of glycine, mixed, and GABA events detected were 91, 220, 466 for the BON/UNC-47+GlyT2 and 259, 0, 0 for the BON/UNC-47(G462R) cells.
Experiments were performed at room temperature. ORG25543 was a generous gift from H. Sundaram and D. Hill (Organon, Newhouse, UK). NNC-711 was supplied by Tocris Bioscience (Bristol, UK), and all other chemicals were obtained from Sigma.
Ca2+ imaging.
Before the experiments, BON cells were incubated for 20 min with 5 μm Ca2+ dye Fluo4/AM (Invitrogen). Images of epifluorescence were acquired at 1 Hz using a CoolSNAP-ES CCD camera (Roper Scientific, Tucson, AZ). We measured the mean intensity of fluorescence in the cell body using Metaview software (Universal Imaging, West Chester, PA) and calculated the relative fluorescence change as follows: ΔF/F = (F − F0)/F0, where F0 is the average basal fluorescence recorded before ACh application.
Analysis.
Events were detected by the threshold method (+10 and −5 pA for glycine and GABA events, respectively) using ClampFit (Pclamp 8-9; Molecular Devices). Glycine and GABA corelease was identified as outward followed by inward current occurring <100 ms apart (see Fig. 5D). Data are expressed as means ± SEM with n, the number of repeats given in parentheses. Significance (p < 0.05) was tested using an F test.
Concentration-response curves of the current mediated by the activation of glycine or GABA receptors were fitted using the Hill equation:
 |
where Imax is the maximal current elicited by substrate, h is the Hill coefficient, and EC50 is the concentration that activates 50% of Imax.
The cumulative distribution function (cdf) of the peak event amplitudes were fitted as the sum of two log-normal distributions:
 |
where x is the absolute event amplitude, ni is the number of events, and μi and σi are the mean and SD of the logarithm of the amplitude, respectively.
Results
Plasmalemmal uptake of glycine promotes its vesicular release
Patch-clamped HEK293 cells expressing homomeric α1-glycine receptors (GlyR) were pressed against neuroendocrine BON cells (Parekh et al., 1994) expressing VIAAT and GlyT2 (Fig. 1A). Application of ACh, which stimulates secretion from BON cells (Parekh et al., 1994; Takamori et al., 2000), triggered in the BON cells intracellular Ca2+ oscillations that were sensitive to the non-M2 muscarinic receptor antagonist 4-DAMP (Fig. 1B) and evoked a burst of transient outward currents in the HEK cell (Fig. 1C). In contrast, transient currents were not detected in HEK cells that were not pressed onto BON cells (data not shown) or when HEK cells were pressed on naive (VIAAT-negative) or GlyT2-only-expressing BON cells (Fig. 1D). No or few events were detected with VIAAT-only-expressing BON cells (Fig. 1D) or if BON/VIAAT+GlyT2 cells were incubated with ORG25543 (data not shown), a GlyT2-specific inhibitor (Roux and Supplisson, 2000; Caulfield et al., 2001). Application of strychnine, a glycine receptor antagonist, blocked the transient currents (Fig. 1E), indicating that they correspond to the release of glycine from the BON cells. These GlyR-mediated currents (Fig. 2A–B) had fast kinetics (10–90% rise time, 3.7 ± 0.1 ms and 10–90% decay time, 14.8 ± 0.2 ms; n = 4199) (Fig. 2C) and occurred at a mean rate of 15.4 ± 1.2 events/min (n = 41) of ACh application with a first latency of 16 ± 0.9 s (n = 41) (Fig. 2D). They appeared monophasic and independent of each other, without evidence for multivesicular release, despite having high current-amplitude variability during each trial (coefficient of variation >1). The cumulative probability curve of the peak-current amplitudes was bimodal and well described by the sum of two log-normal distributions (Fig. 2E), in agreement with the existence of several populations of secretory vesicles in the BON cell line (Parekh et al., 1994).
GlyT2 supports glycine release more efficiently than GlyT1
We compared the peak amplitude and the frequency of the release events detected from BON/VIAAT cells coexpressing either GlyT2 or GlyT1. When these BON cells were incubated for 12–24 h in a medium containing 3 μm extracellular glycine ([Gly]e), a concentration within the range measured in the CSF (Jones et al., 2006), glycine release was detected from BON/VIAAT+GlyT1 (Fig. 3A) with unitary events of similar amplitudes than those observed with GlyT2-expressing cells (Fig. 3A–B), albeit at half the frequency [7.0 ± 0.9 events/min (n = 8) and 14.6 ± 3.1 events/min (n = 8), respectively, p < 0.05]. This difference in frequency was not observed when BON cells were incubated overnight with 300 μm glycine [15.6 ± 2.9 events/min (n = 8) for GlyT2 and 14.1 ± 3.6 events/min (n = 7) for GlyT1, respectively; p = 0.78; data not shown].
Then we compared the capacity of the two transporters to maintain a high [Gly]i, and thus robust glycine exocytosis, in a condition that promotes reverse transport, as the two transporters differ in their capacity to reverse direction (Roux and Supplisson, 2000; Aubrey et al., 2005). In this pulse-chase protocol, BON/VIAAT cells expressing either GlyT1 or GlyT2 were cultured in nominally glycine-free medium and exposed for 30 min to 30 μm glycine 14–20 h before analysis with a HEK/GlyR cell. Although glycine release was preserved in all BON/VIAAT+GlyT2 cells analyzed, the glycine release frequency of BON/VIAAT+GlyT1 cells was markedly decreased by 62% (Fig. 3C–D). This result suggests that in contrast to GlyT2, when the extracellular glycine concentration is limiting, GlyT1 cannot maintain the high cytosolic glycine concentration required for its vesicular accumulation.
Detection of glycine and GABA vesicular corelease
To examine in our model whether com-petition between GABA and glycine for uptake by VIAAT can modify the vesicular content, we coexpressed BON/VIAAT±GlyT2 cells with the plasmalemmal transporter GAT1 and included GABA in the BON culture medium (Fig. 4A). We were able to differentiate clearly the release of each transmitter by coexpressing in HEK cells GlyR and EXP-1A (EXP1), a C. elegans GABA-gated receptor with cationic permeability (Beg and Jorgensen, 2003). When HEK/GlyR+EXP1 cells were held at −45 mV, fast application of glycine evoked an outward current, whereas GABA evoked an inward current (Fig. 4B–C), but with a different range of agonist sensitivity, as shown in the activation curves of Figure 4D. Application of ACh triggered GABA release from BON/VIAAT+GAT1 cells that evoked transient inward currents in sniffer HEK/GlyR+EXP1 cells (Fig. 4E). Although EXP-1 is insensitive to blockers of vertebrate GABA receptors, such as bicuculline or picrotoxin (Beg and Jorgensen, 2003), we are confident that these transient currents correspond to the activation of EXP1 receptors by GABA release from BON cells as they reversed near 0 mV (data not shown), the expected reversal potential of EXP1 (Fig. 4C), and were never detected from VIAAT-negative BON cells (data not shown). These individual GABA events recorded with HEK/GlyR+EXP1 cells (Fig. 4E–F) had slower kinetics (10–90% rise time = 33.0 ± 1.1 ms and 10–90% decay time = 112 ± 2.9 ms; n = 659) than glycine events (Fig. 4G). Nevertheless, their bimodal amplitude distribution and their release rate (11.6 ± 3.0 events/min of ACh application, n = 41) were similar to those of glycine release, indicating that GABA and glycine are released from the same vesicular pools (Fig. 4H). In contrast to glycine, GABA release was detected from BON/VIAAT cells incubated with GABA but not transfected with GAT1, suggesting the existence of an endogenous GABA transporter. In agreement with this conclusion, GABA release was markedly reduced, from 17.6 to 1.4 events/min, when BON/VIAAT cells (not transfected with GAT1) were incubated with the GABA transporter inhibitor NNC-711 (2.5 μm).
The distinct kinetics and opposite polarity of glycine and GABA events predict that the corelease of both neurotransmitters from a single vesicle should evoke a fast outward component followed by a slower inward one, representing the algebraic sum of individual glycine and GABA events (Fig. 5A). Indeed, biphasic outward/inward currents were recorded with HEK/GlyR+EXP1 cells (Fig. 5B–C). These events had a constant time interval between the outward and inward peaks (+33.7 ± 1 ms; n = 607 events) (Fig. 5D), and the outward component was suppressed by strychnine (Fig. 5E), confirming that they represent unitary corelease of glycine and GABA rather than coincident exocytoses.
Glycine and GABA competition for vesicular loading by VIAAT
We categorized unitary events as glycinergic, GABAergic, or mixed, according to their shape, and compared their proportions in conditions of increasing GABA competition. A 100% glycine release phenotype was only detected when BON/VIAAT+GlyT2 cells were incubated in the absence of GABA (Fig. 6A). In the presence of equal extracellular concentrations of GABA and glycine, GABA uptake by the endogenous transporter of BON cells was sufficient to decrease the frequency of pure glycine events to 56 ± 10% and to induce the appearance of both mixed and pure GABA events (Fig. 6B). When intracellular GABA ([GABA]i) was further enhanced by the expression of the plasma membrane GABA transporter GAT1 (Guastella et al., 1990), pure glycine events were only rarely observed (8 ± 4%) and GABA events dominated (Fig. 6C). Finally, in the absence of GlyT2, a pure GABAergic phenotype was observed when the GABA uptake was enhanced by GAT1 expression (Fig. 6D). The amplitude of the outward current in the mixed events decreased when GABA uptake was enhanced by GAT-1 expression, as shown in Figure 6B–C, indicating that GABA replaces glycine in vesicles (Fig. 6E).
Glycine transport is an ancestral property of the vesicular transporter and a single point mutation confers selectivity for glycine
To examine whether VIAAT has been adapted for glycine exocytosis during evolution, we replaced it by an invertebrate ortholog, the C. elegans transporter UNC-47 (McIntire et al., 1997). Surprisingly, although genomic data indicate that glycinergic transmission does not exist in nematodes (Bargmann, 1998), we detected glycine release and mixed events in addition to GABA release when HEK/GlyR+EXP1 cells were apposed to BON cells expressing GlyT2 and UNC-47 (Fig. 7A). As a negative control, we introduced into UNC-47 the G462R mutation which impairs GABAergic transmission in C. elegans (McIntire et al., 1997). In agreement with the “shrinker” phenotype of unc-47(n2409) worms, the G462R mutation abolished GABA release in our system but, unexpectedly, it spared glycine release (Fig. 7B–C), thus implying that the vesicular transport of glycine and GABA were differentially affected. This constitutes the first evidence that the vesicular accumulation of glycine and GABA can be molecularly separated.
Discussion
We investigated the mechanisms underlying the secretory glycine/GABA vesicular phenotypes. In our BON model, consecutive glycine uptake by GlyT2 and VIAAT is necessary and sufficient for concentrating glycine into vesicles, in agreement with conclusions drawn from the genetic knock-out of GlyT2 and VIAAT in mice (Gomeza et al., 2003; Wojcik et al., 2006). We found that GlyT2 achieves more robust glycine release than GlyT1, probably because the inability of GlyT2 to operate in the efflux mode protects the cytosolic pool of glycine from variations in extracellular glycine. By introducing GABA competition for VIAAT, we were able to recreate the complete repertoire of inhibitory secretory phenotypes. Finally, we demonstrate that the vesicular GABA transporter from C. elegans also transports glycine.
Sniffer detection of glycine quanta
In our model system, the BON and HEK cells are the cellular equivalents of giant “presynaptic” and “postsynaptic” elements. Both cells were cultured separately, transfected with transporters and receptors, and brought together only at the time of the experiment. Although this system lacks the differentiation and organization of a neuronal synapse, its modularity, homogeneity, and release properties offer several advantages to dissect out the mechanisms determining a neurotransmitter phenotype. For example, BON cells do not have an active zone where vesicles are docked and primed for release; instead, vesicles must diffuse to the plasma membrane after intracellular Ca2+ elevation before eventually being released (Huet et al., 2006). This weak stimulus-secretion coupling between the cytoplasmic Ca2+ oscillations triggered by ACh and the exocytotic machinery is reflected by the long latency and the low frequencies of the events recorded here and practically eliminates the possibility that a release event detected by the activation of GlyR in the HEK cells corresponds to the simultaneous fusion of independent vesicles. Therefore, exocytotic events evoked homogenous “synaptic-like” monophasic currents in HEK cells that can be considered as quanta of glycine release. The detection of this sparse neurotransmitter release from BON cells was aided by the large intercellular contact with the whole-cell patch-clamped HEK cell.
The distribution of the glycine current amplitudes was skewed and covered two log scales. This large variation could result from differences in the amount of glycine released per quantum or from heterogeneity in GlyR density at the HEK cell surface. In spinal cord slices, a similar distribution of glycinergic miniature IPSC amplitudes has been described in some ventral horn interneurons, and this variation was attributed to differences in the size of postsynaptic GlyR clusters (Oleskevich et al., 1999). However, in absence of the scaffolding protein gephyrin (Kirsch et al., 1993), homomeric α1-GlyRs have a uniform, unclustered distribution in transiently transfected HEK cells (Legendre et al., 2002) with a density ∼60 receptors/μm2 (Gentet et al., 2000), a value that is below that estimated for glycinergic synapses (Choquet and Triller, 2003). Therefore, because the detection of glycine in our system is not restricted by the sharp boundaries defined by receptor clusters, the variation in current amplitude likely reflects changes in vesicular glycine content, which should be proportional to the size of vesicles, which are known to be heterogeneous in BON cells (Parekh et al., 1994; Kim et al., 2001).
GABA and glycine competition for VIAAT-mediated vesicular filling
We took advantage of the cationic permeability of EXP1, a GABA receptor from C. elegans (Beg and Jorgensen, 2003), to create an inhibitory transmitter detector that differentiates glycine and GABA release by the direction of the evoked current (outward and inward, respectively). We show that VIAAT-containing vesicles accumulate both glycine and GABA, thus confirming the inference from a long series of biochemical, morphological, physiological, and genetic studies (Christensen et al., 1990; Burger et al., 1991; McIntire et al., 1997; Sagné et al., 1997; Chaudhry et al., 1998; Dumoulin et al., 1999; Wojcik et al., 2006). The slower time course of GABA events compared with glycine events can be explained by the differences in EC50 and Hill coefficients of the two receptors. Indeed, the dose–response curves of EXP1 and GlyR show that at low concentration (≤10 μm), GABA evokes a current in the HEK cell, whereas glycine cannot (Fig. 4D). Thus, as GABA and glycine diffused away from the release site, GABA should activate receptors over a larger area and for a longer time period than glycine. Our detection method was not sensitive enough to estimate the relative content of GABA and glycine in vesicles, and therefore our analysis was limited to the categorization of secretory events based on their shape. Homogenous patterns of events with pure GABA or pure glycine release were only observed in the absence of the other amino acid in the cytosol (Fig. 6A,D), as expected for a nonselective vesicular transporter. When vesicles had access to both GABA and glycine, we examined whether glycine can significantly compete with GABA. This is an open question because, on one hand, GABA permeates lipid bilayers much more efficiently than glycine at physiological pH (Hell et al., 1991) and, on the other hand, neosynthesized GABA has a kinetic advantage over glycine for vesicular uptake because of a functional coupling between VIAAT and the vesicle-bound biosynthetic enzyme GAD65 (Jin et al., 2003). In our experiments, we observed various patterns of secretory phenotypes, generally composed of a minority of mixed events associated with either pure glycine or pure GABA events (Fig. 6B,C). In contrast, we never observed both pure GABA and pure glycine events in the absence of mixed events, nor did we record only mixed events in the absence of glycine or GABA events. This under-representation of mixed events was not anticipated. It may correspond to an under-detection of mixed vesicles caused by an uneven distribution of EXP1 and GlyR (see Keller et al., 2001). However, this hypothesis is unlikely because it predicts a variable shape of the mixed events (see above). Alternatively, the under-representation of mixed events could result from a preferential loading of either GABA or glycine in individual vesicles from the same cell, as observed during focal stimulation of a single inhibitory bouton (Katsurabayashi et al., 2004).
One potential mechanism for such vesicular heterogeneity could be that the association of VIAAT to protein partners (for instance, GAD65) confers a preference for either GABA or glycine uptake. Although one vesicular transporter is thought to be sufficient to load vesicles with neurotransmitter (Daniels et al., 2006), a recent study showed that several copies of vesicular transporter are present on a single vesicle (Takamori et al., 2006); thus, each vesicle may have a heterogeneous population of VIAAT molecules, each one interacting with different GABA and/or glycine preferring partners. Another possibility is that one of the two transmitters leaks from vesicles by a VIAAT-independent manner (for the permeability of lipid bilayers to GABA, see Hell et al., 1991), thus resulting in a dependence of the GABA-to-glycine ratio of the vesicle on the density of VIAAT molecules in its membrane. Therefore, although the phenotype of inhibitory transmission may be determined entirely postsynaptically by the expression of specific receptors on the target cells (Dugué et al., 2005), our data and results from focal stimulation of a single nerve terminal (Katsurabayashi et al., 2004) suggest that in some regions, this variation may have a presynaptic origin. In agreement, the postnatal switch in neuronal phenotypes described in several sensorimotor structures (Kotak et al., 1998; Gao et al., 2001; Keller et al., 2001) is associated in the lateral superior olive with a downregulation of GAD65 (Nabekura et al., 2004) and an upregulation of GlyT2 at the terminal (Friauf et al., 1999).
Evolutionary implications of the comparison between VIAAT and UNC-47
We show that, although invertebrates are thought to lack glycinergic synapses, vesicles containing UNC-47, the vesicular GABA transporter of C. elegans, accumulate glycine in GlyT2-expressing BON cells. In addition, despite the competition between GABA and glycine, mutation of a conserved glycine to arginine in the tenth transmembrane domain of UNC-47 was sufficient to abolish GABA uptake while preserving glycine uptake. Therefore, the binding sites or translocation pathways of GABA and glycine in UNC-47 and VIAAT may only partially overlap.
From a phylogenic viewpoint, the ability of UNC-47 to replace VIAAT and transport glycine in our experiments suggests that the emergence of glycinergic nerve terminals in vertebrates may have resulted from a change in cytosolic glycine availability without significant tuning-up of VIAAT for glycine. This scenario would favor GABA-and-glycine corelease, suggesting that corelease might have played an early physiological role in the vertebrate lineage by expanding the repertoire of inhibitory signaling (Jonas et al., 1998; Russier et al., 2002) and/or by allowing a gradual shift from one transmitter to another (Kotak et al., 1998; Nabekura et al., 2004). In addition, as glycine has the ability to interact with neighboring N-methyl-d-aspartate receptors (Johnson and Ascher, 1987) by spillover from inhibitory synapses (Ahmadi et al., 2003), glycine cosignaling may also uniquely contribute to the refinement of developing inhibitory and excitatory networks (Kim and Kandler, 2003).
Footnotes
This work was supported by the Centre National de la Recherche Scientifique, Institut National de la Santé et de la Recherche Médicale (S.S.), the Action Concertée Incitative “biologie du développement et physiologie intégrative” from the Ministère de la recherche and grants from the Fédération pour la Recherche sur le Cerveau and Association Française contre les Myopathies (S.S) and the Fondation Edmond de Rothschild (B.G). F.M.R. was a Fondation Edmond de Rothschild's fellow and K.R.A. is a European Union Incoming International Fellowships Marie Curie fellow. We thank Philippe Ascher, Boris Barbour, François Darchen, Stéphane Dieudonné, Anne Feltz, Jean-Pierre Henry, Clément Léna, Jacques Neyton, and Pierre Paoletti for suggestions and discussion.
References
- Ahmadi S, Muth-Selbach U, Lauterbach A, Lipfert P, Neuhuber WL, Zeilhofer HU. Facilitation of spinal NMDA receptor currents by spillover of synaptically released glycine. Science. 2003;300:2094–2097. doi: 10.1126/science.1083970. [DOI] [PubMed] [Google Scholar]
- Aubrey KR, Vandenberg RJ, Clements JD. Dynamics of forward and reverse transport by the glial glycine transporter, glyt1b. Biophys J. 2005;89:1657–1668. doi: 10.1529/biophysj.105.061572. [DOI] [PMC free article] [PubMed] [Google Scholar]
- Bargmann CI. Neurobiology of the Caenorhabditis elegans genome. Science. 1998;282:2028–2033. doi: 10.1126/science.282.5396.2028. [DOI] [PubMed] [Google Scholar]
- Bedet C, Isambert MF, Henry JP, Gasnier B. Constitutive phosphorylation of the vesicular inhibitory amino acid transporter in rat central nervous system. J Neurochem. 2000;75:1654–1663. doi: 10.1046/j.1471-4159.2000.0751654.x. [DOI] [PubMed] [Google Scholar]
- Beg AA, Jorgensen EM. EXP-1 is an excitatory GABA-gated cation channel. Nat Neurosci. 2003;6:1145–1152. doi: 10.1038/nn1136. [DOI] [PubMed] [Google Scholar]
- Bohlhalter S, Mohler H, Fritschy JM. Inhibitory neurotransmission in rat spinal cord: co-localization of glycine- and GABAA-receptors at GABAergic synaptic contacts demonstrated by triple immunofluorescence staining. Brain Res. 1994;642:59–69. doi: 10.1016/0006-8993(94)90905-9. [DOI] [PubMed] [Google Scholar]
- Burger PM, Hell J, Mehl E, Krasel C, Lottspeich F, Jahn R. GABA and glycine in synaptic vesicles: storage and transport characteristics. Neuron. 1991;7:287–293. doi: 10.1016/0896-6273(91)90267-4. [DOI] [PubMed] [Google Scholar]
- Caulfield WL, Collie IT, Dickins RS, Epemolu O, McGuire R, Hill DR, McVey G, Morphy JR, Rankovic Z, Sundaram H. The first potent and selective inhibitors of the glycine transporter type 2. J Med Chem. 2001;44:2679–2682. doi: 10.1021/jm0011272. [DOI] [PubMed] [Google Scholar]
- Chaudhry FA, Reimer RJ, Bellocchio EE, Danbolt NC, Osen KK, Edwards RH, Storm-Mathisen J. The vesicular GABA transporter, VGAT, localizes to synaptic vesicles in sets of glycinergic as well as GABAergic neurons. J Neurosci. 1998;18:9733–9750. doi: 10.1523/JNEUROSCI.18-23-09733.1998. [DOI] [PMC free article] [PubMed] [Google Scholar]
- Choquet D, Triller A. The role of receptor diffusion in the organization of the postsynaptic membrane. Nat Rev Neurosci. 2003;4:251–265. doi: 10.1038/nrn1077. [DOI] [PubMed] [Google Scholar]
- Christensen H, Fykse EM, Fonnum F. Uptake of glycine into synaptic vesicles isolated from rat spinal cord. J Neurochem. 1990;54:1142–1147. doi: 10.1111/j.1471-4159.1990.tb01941.x. [DOI] [PubMed] [Google Scholar]
- Christensen H, Fykse EM, Fonnum F. Inhibition of gamma-aminobutyrate and glycine uptake into synaptic vesicles. Eur J Pharmacol. 1991;207:73–79. doi: 10.1016/s0922-4106(05)80040-9. [DOI] [PubMed] [Google Scholar]
- Daniels RW, Collins CA, Chen K, Gelfand MV, Featherstone DE, Diantonio A. A single vesicular glutamate transporter is sufficient to fill a synaptic vesicle. Neuron. 2006;49:11–16. doi: 10.1016/j.neuron.2005.11.032. [DOI] [PMC free article] [PubMed] [Google Scholar]
- Dugué GP, Dumoulin A, Triller A, Dieudonné S. Target-dependent use of coreleased inhibitory transmitters at central synapses. J Neurosci. 2005;25:6490–6498. doi: 10.1523/JNEUROSCI.1500-05.2005. [DOI] [PMC free article] [PubMed] [Google Scholar]
- Dumba JS, Irish PS, Anderson NL, Westrum LE. Electron microscopic analysis of gamma-aminobutyric acid and glycine colocalization in rat trigeminal subnucleus caudalis. Brain Res. 1998;806:16–25. doi: 10.1016/s0006-8993(98)00688-x. [DOI] [PubMed] [Google Scholar]
- Dumoulin A, Rostaing P, Bedet C, Levi S, Isambert MF, Henry JP, Triller A, Gasnier B. Presence of the vesicular inhibitory amino acid transporter in GABAergic and glycinergic synaptic terminal boutons. J Cell Sci. 1999;112:811–823. doi: 10.1242/jcs.112.6.811. [DOI] [PubMed] [Google Scholar]
- Eulenburg V, Becker K, Gomeza J, Schmitt B, Becker CM, Betz H. Mutations within the human GLYT2 (SLC6A5) gene associated with hyperekplexia. Biochem Biophys Res Commun. 2006;348:400–405. doi: 10.1016/j.bbrc.2006.07.080. [DOI] [PubMed] [Google Scholar]
- Friauf E, Aragon C, Lohrke S, Westenfelder B, Zafra F. Developmental expression of the glycine transporter GLYT2 in the auditory system of rats suggests involvement in synapse maturation. J Comp Neurol. 1999;412:17–37. [PubMed] [Google Scholar]
- Gao BX, Stricker C, Ziskind-Conhaim L. Transition from GABAergic to glycinergic synaptic transmission in newly formed spinal networks. J Neurophysiol. 2001;86:492–502. doi: 10.1152/jn.2001.86.1.492. [DOI] [PubMed] [Google Scholar]
- Gentet LJ, Stuart GJ, Clements JD. Direct measurement of specific membrane capacitance in neurons. Biophys J. 2000;79:314–320. doi: 10.1016/S0006-3495(00)76293-X. [DOI] [PMC free article] [PubMed] [Google Scholar]
- Gomeza J, Ohno K, Hulsmann S, Armsen W, Eulenburg V, Richter DW, Laube B, Betz H. Deletion of the mouse glycine transporter 2 results in a hyperekplexia phenotype and postnatal lethality. Neuron. 2003;40:797–806. doi: 10.1016/s0896-6273(03)00673-1. [DOI] [PubMed] [Google Scholar]
- Gras C, Herzog E, Bellenchi GC, Bernard V, Ravassard P, Pohl M, Gasnier B, Giros B, El Mestikawy S. A third vesicular glutamate transporter expressed by cholinergic and serotoninergic neurons. J Neurosci. 2002;22:5442–5451. doi: 10.1523/JNEUROSCI.22-13-05442.2002. [DOI] [PMC free article] [PubMed] [Google Scholar]
- Guastella J, Nelson N, Nelson H, Czyzyk L, Keynan S, Miedel MC, Davidson N, Lester HA, Kanner BI. Cloning and expression of a rat brain GABA transporter. Science. 1990;249:1303–1306. doi: 10.1126/science.1975955. [DOI] [PubMed] [Google Scholar]
- Hell JW, Edelmann L, Hartinger J, Jahn R. Functional reconstitution of the gamma-aminobutyric acid transporter from synaptic vesicles using artificial ion gradients. Biochemistry. 1991;30:11795–11800. doi: 10.1021/bi00115a009. [DOI] [PubMed] [Google Scholar]
- Huet S, Karatekin E, Tran VS, Fanget I, Cribier S, Henry JP. Analysis of transient behavior in complex trajectories: application to secretory vesicle dynamics. Biophys J. 2006;91:3542–3559. doi: 10.1529/biophysj.105.080622. [DOI] [PMC free article] [PubMed] [Google Scholar]
- Jin H, Wu H, Osterhaus G, Wei J, Davis K, Sha D, Floor E, Hsu CC, Kopke RD, Wu JY. Demonstration of functional coupling between gamma -aminobutyric acid (GABA) synthesis and vesicular GABA transport into synaptic vesicles. Proc Natl Acad Sci USA. 2003;100:4293–4298. doi: 10.1073/pnas.0730698100. [DOI] [PMC free article] [PubMed] [Google Scholar]
- Johnson JW, Ascher P. Glycine potentiates the NMDA response in cultured mouse brain neurons. Nature. 1987;325:529–531. doi: 10.1038/325529a0. [DOI] [PubMed] [Google Scholar]
- Jonas P, Bischofberger J, Sandkuhler J. Corelease of two fast neurotransmitters at a central synapse. Science. 1998;281:419–424. doi: 10.1126/science.281.5375.419. [DOI] [PubMed] [Google Scholar]
- Jones CM, Smith M, Henderson MJ. Reference data for cerebrospinal fluid and the utility of amino acid measurement for the diagnosis of inborn errors of metabolism. Ann Clin Biochem. 2006;43:63–66. doi: 10.1258/000456306775141759. [DOI] [PubMed] [Google Scholar]
- Katsurabayashi S, Kubota H, Higashi H, Akaike N, Ito Y. Distinct profiles of refilling of inhibitory neurotransmitters into presynaptic terminals projecting to spinal neurones in immature rats. J Physiol (Lond) 2004;560:469–478. doi: 10.1113/jphysiol.2004.067017. [DOI] [PMC free article] [PubMed] [Google Scholar]
- Keller AF, Coull JA, Chery N, Poisbeau P, De Koninck Y. Region-specific developmental specialization of GABA-glycine cosynapses in laminas I-II of the rat spinal dorsal horn. J Neurosci. 2001;21:7871–7880. doi: 10.1523/JNEUROSCI.21-20-07871.2001. [DOI] [PMC free article] [PubMed] [Google Scholar]
- Kim G, Kandler K. Elimination and strengthening of glycinergic/GABAergic connections during tonotopic map formation. Nat Neurosci. 2003;6:282–290. doi: 10.1038/nn1015. [DOI] [PubMed] [Google Scholar]
- Kim M, Javed NH, Yu JG, Christofi F, Cooke HJ. Mechanical stimulation activates Galphaq signaling pathways and 5-hydroxytryptamine release from human carcinoid BON cells. J Clin Invest. 2001;108:1051–1059. doi: 10.1172/JCI12467. [DOI] [PMC free article] [PubMed] [Google Scholar]
- Kirsch J, Wolters I, Triller A, Betz H. Gephyrin antisense oligonucleotides prevent glycine receptor clustering in spinal neurons. Nature. 1993;366:745–748. doi: 10.1038/366745a0. [DOI] [PubMed] [Google Scholar]
- Kotak VC, Korada S, Schwartz IR, Sanes DH. A developmental shift from GABAergic to glycinergic transmission in the central auditory system. J Neurosci. 1998;18:4646–4655. doi: 10.1523/JNEUROSCI.18-12-04646.1998. [DOI] [PMC free article] [PubMed] [Google Scholar]
- Legendre P, Muller E, Badiu CI, Meier J, Vannier C, Triller A. Desensitization of homomeric alpha1 glycine receptor increases with receptor density. Mol Pharmacol. 2002;62:817–827. doi: 10.1124/mol.62.4.817. [DOI] [PubMed] [Google Scholar]
- McIntire SL, Reimer RJ, Schuske K, Edwards RH, Jorgensen EM. Identification and characterization of the vesicular GABA transporter. Nature. 1997;389:870–876. doi: 10.1038/39908. [DOI] [PubMed] [Google Scholar]
- Nabekura J, Katsurabayashi S, Kakazu Y, Shibata S, Matsubara A, Jinno S, Mizoguchi Y, Sasaki A, Ishibashi H. Developmental switch from GABA to glycine release in single central synaptic terminals. Nat Neurosci. 2004;7:17–23. doi: 10.1038/nn1170. [DOI] [PubMed] [Google Scholar]
- O'Brien JA, Berger AJ. Cotransmission of GABA and glycine to brain stem motoneurons. J Neurophysiol. 1999;82:1638–1641. doi: 10.1152/jn.1999.82.3.1638. [DOI] [PubMed] [Google Scholar]
- Oleskevich S, Alvarez FJ, Walmsley B. Glycinergic miniature synaptic currents and receptor cluster sizes differ between spinal cord interneurons. J Neurophysiol. 1999;82:312–319. doi: 10.1152/jn.1999.82.1.312. [DOI] [PubMed] [Google Scholar]
- Parekh D, Ishizuka J, Townsend CM, Jr, Haber B, Beauchamp RD, Karp G, Kim SW, Rajaraman S, Greeley G, Jr, Thompson JC. Characterization of a human pancreatic carcinoid in vitro: morphology, amine and peptide storage, and secretion. Pancreas. 1994;9:83–90. doi: 10.1097/00006676-199401000-00013. [DOI] [PubMed] [Google Scholar]
- Rees MI, Harvey K, Pearce BR, Chung SK, Duguid IC, Thomas P, Beatty S, Graham GE, Armstrong L, Shiang R, Abbott KJ, Zuberi SM, Stephenson JB, Owen MJ, Tijssen MA, van den Maagdenberg AM, Smart TG, Supplisson S, Harvey RJ. Mutations in the gene encoding GlyT2 (SLC6A5) define a presynaptic component of human startle disease. Nat Genet. 2006;38:801–806. doi: 10.1038/ng1814. [DOI] [PMC free article] [PubMed] [Google Scholar]
- Roux MJ, Supplisson S. Neuronal and glial glycine transporters have different stoichiometries. Neuron. 2000;25:373–383. doi: 10.1016/s0896-6273(00)80901-0. [DOI] [PubMed] [Google Scholar]
- Russier M, Kopysova IL, Ankri N, Ferrand N, Debanne D. GABA and glycine co-release optimizes functional inhibition in rat brainstem motoneurons in vitro. J Physiol (Lond) 2002;541:123–137. doi: 10.1113/jphysiol.2001.016063. [DOI] [PMC free article] [PubMed] [Google Scholar]
- Sagné C, El Mestikawy S, Isambert MF, Hamon M, Henry JP, Giros B, Gasnier B. Cloning of a functional vesicular GABA and glycine transporter by screening of genome databases. FEBS Lett. 1997;417:177–183. doi: 10.1016/s0014-5793(97)01279-9. [DOI] [PubMed] [Google Scholar]
- Takamori S, Rhee JS, Rosenmund C, Jahn R. Identification of a vesicular glutamate transporter that defines a glutamatergic phenotype in neurons. Nature. 2000;407:189–194. doi: 10.1038/35025070. [DOI] [PubMed] [Google Scholar]
- Takamori S, Holt M, Stenius K, Lemke EA, Gronborg M, Riedel D, Urlaub H, Schenck S, Brugger B, Ringler P, Muller SA, Rammner B, Grater F, Hub JS, De Groot BL, Mieskes G, Moriyama Y, Klingauf J, Grubmuller H, Heuser J, et al. Molecular anatomy of a trafficking organelle. Cell. 2006;127:831–846. doi: 10.1016/j.cell.2006.10.030. [DOI] [PubMed] [Google Scholar]
- Todd AJ, Watt C, Spike RC, Sieghart W. Colocalization of GABA, glycine, and their receptors at synapses in the rat spinal cord. J Neurosci. 1996;16:974–982. doi: 10.1523/JNEUROSCI.16-03-00974.1996. [DOI] [PMC free article] [PubMed] [Google Scholar]
- Triller A, Cluzeaud F, Korn H. gamma-Aminobutyric acid-containing terminals can be apposed to glycine receptors at central synapses. J Cell Biol. 1987;104:947–956. doi: 10.1083/jcb.104.4.947. [DOI] [PMC free article] [PubMed] [Google Scholar]
- Wojcik SM, Katsurabayashi S, Guillemin I, Friauf E, Rosenmund C, Brose N, Rhee JS. A shared vesicular carrier allows synaptic corelease of GABA and glycine. Neuron. 2006;50:575–587. doi: 10.1016/j.neuron.2006.04.016. [DOI] [PubMed] [Google Scholar]