

Abstract
Elevation of intracellular Ca2+ in astrocytes can influence cerebral microcirculation and modulate synaptic transmission. Recently, in vivo imaging studies identified delayed, sensory-driven Ca2+ oscillations in cortical astrocytes; however, the long latencies of these Ca2+ signals raises questions in regards to their suitability for a role in short-latency modulation of cerebral microcirculation or rapid astrocyte-to-neuron communication. Here, using in vivo two-photon Ca2+ imaging, we demonstrate that ∼5% of sulforhodamine 101-labeled astrocytes in the hindlimb area of the mouse primary somatosensory cortex exhibit short-latency (peak amplitude ∼0.5 s after stimulus onset), contralateral hindlimb-selective sensory-evoked Ca2+ signals that operate on a time scale similar to neuronal activity and correlate with the onset of the hemodynamic response as measured by intrinsic signal imaging. The kinetics of astrocyte Ca2+ transients were similar in rise and decay times to postsynaptic neuronal transients, but decayed more slowly than neuropil Ca2+ transients that presumably reflect presynaptic transients. These in vivo findings suggest that astrocytes can respond to sensory activity in a selective manner and process information on a subsecond time scale, enabling them to potentially form an active partnership with neurons for rapid regulation of microvascular tone and neuron–astrocyte network properties.
Keywords: astrocyte, calcium, synaptic transmission, blood flow, intrinsic optical signals, hindlimb, hyperemia
Introduction
Astrocyte Ca2+ oscillations have been implicated in modulating cerebral synaptic transmission and microvascular tone. Evidence suggests that Ca2+ transients in astrocytes trigger neurotransmitter release that can influence neuronal excitability and synaptic transmission (Pasti et al., 1997; Araque et al., 1998a,b; Fellin et al., 2004) (for review, see Auld and Robitaille, 2003; Haydon and Carmignoto, 2006). Astrocytes also form a close physical and functional partnership with brain arterioles, because elevation of intracellular Ca2+ in astrocyte endfeet is sufficient to trigger rapid changes in vascular tone (Zonta et al., 2003; Mulligan and MacVicar, 2004; Takano et al., 2006). The presence of ionotropic glutamate receptors and rapid transporter-mediated currents suggest that astrocytes can communicate with neurons on a rapid subsecond time scale, and in vitro and in situ studies have shown that astrocyte Ca2+ transients and synaptic-like currents can be triggered by neuronal activity (Dani et al., 1992; Murphy et al., 1993; Porter and McCarthy, 1995a,b, 1996; Bergles and Jahr, 1997; Pasti et al., 1997; Latour et al., 2001; Matthias et al., 2003; Wallraff et al., 2004; Jabs et al., 2005; Lalo et al., 2006).
Imaging of intrinsic optical signals (IOSs) and local blood flow using two-photon imaging has indicated that blood flow to active regions of the cerebral cortex is increased within 600 ms of the onset of local neuronal activity (Kleinfeld et al., 1998; Devor et al., 2003). It has been suggested that neuron-to-astrocyte communication may be a key mediator of this functional hyperemia (Zonta et al., 2003; Takano et al., 2006), and metabotropic glutamate receptors and glutamate uptake transporters on astrocytes have been implicated in the hemodynamic response to neuronal activity (Gurden et al., 2006; Takano et al., 2006). However, using in vivo two-photon laser-scanning microscopy, only relatively delayed increases in intracellular Ca2+ in astrocytes of mouse barrel cortex were observed during whisker stimulation that was sufficient to activate neurons on a millisecond time scale (Wang et al., 2006). Surprisingly, despite the potential for rapid neuron–astrocyte signaling, these astrocyte responses began ∼3 s after stimulus onset and only reached peak amplitude after ∼9 s. Although robust, the long latencies involved in these responses suggest they would not be useful for triggering changes in microcirculation in response to neural activity and apparently relegate the astrocyte to a slower modulatory role in brain physiology. Using macroscopic imaging of evoked IOSs and in vivo single-cell two-photon Ca2+ imaging, we demonstrate that astrocytes of the somatosensory cortex exhibit short-latency limb-specific Ca2+ signals. These Ca2+ elevations reach peak amplitude ∼0.5 s after stimulus onset, a time frame similar to activity in adjacent neurons and more consistent with a role for astrocytes in triggering changes in local microvascular tone.
Materials and Methods
Data acquired from urethane-anesthetized (1.25 g/kg, supplemented at 0.25 g/kg when necessary) C57B6 mice (male and female, 2–4 months of age) are examined in this report. All surgical and imaging protocols were conducted in accordance with the guidelines set forth by the Canadian Council for Animal Care.
Imaging of IOSs.
A 3 × 3 mm section of skull over the somatosensory cortex was removed, leaving the dura intact. The exposed brain was covered with HEPES-buffered artificial CSF (ACSF) and a glass coverslip (#1 coverslip thickness). The skull was fastened with cyanoacrylate glue and dental cement to a stainless-steel chamber and mounted on an Olympus (Tokyo, Japan) BX50W1 microscope. IOS image acquisition of a 3.09 × 2.33 mm cortical area (pixel size, 4.1 μm) was performed using XCAP software (Epix, Buffalo Grove, IL) with a charge-coupled device camera (XC st70; Sony, Tokyo, Japan) through a 2.5× Zeiss (Oberkochen, Germany) Plan Neofluor 0.075 numerical aperture (NA) objective during 625 nm light-emitting diode illumination. During imaging of evoked IOSs, limb stimulation (1 s, 10Hz or 100Hz) was alternated between the contralateral hindlimb and forelimb. For each limb, 20–50 trials were imaged at a frame rate of 30 Hz for 3.3 s (1.67 s prestimulus and poststimulus onset; interstimulus intervals, 20 s). Image analysis was performed in Image J (National Institutes of Health, Bethesda, MD). Trials for each limb were first summed and mean filtered (radius, 3 pixels). Frames 1.5 s before stimulation were summed to create a “blank” reference, whereas those during and after stimulation (over 1.5 s) were summed to create a “response” image. By dividing the “response” image by the “blank” reference image, an “IOS response map” could be made to identify the hindlimb and forelimb responsive cortex. Limb stimulation was achieved with custom-made mechanical limb manipulators.
Two-photon laser-scanning microscopy.
After IOS imaging, the coverslip was removed and a pressure injection (Picospritzer II; General Valve, Fairfield, NJ) of the membrane permeant Ca2+ indicator Oregon Green Bapta-1 AM (OGB-1; Invitrogen, Eugene, OR) (Stosiek et al., 2003) was made within the hindlimb cortex. Subsequent to OGB-1 injection, the cortex was incubated with sulforhodamine 101 (SR101; Sigma, St. Louis, MO) (Nimmerjahn et al., 2004) to facilitate identification of astrocytes, then covered with 1.3% agarose (at 37–38°C; type 3-A; A9793; Sigma) dissolved in HEPES-buffered ACSF and sealed with a glass coverslip (#1 coverslip thickness).
Two-photon imaging experiments were performed using a modified Olympus BX50W1 upright microscope (for description, see Zhang et al., 2005). Olympus 40× IR-LUMPLanFl (0.8 NA) and Olympus 60× LUMFL (1.1 NA) water-immersion objectives were used. Images were acquired at 3.5–7.7 Hz (mean, 5.6 Hz) using custom software routines (IgorPro; Wavemetrics, Eugene, OR). Ca2+ fluctuations in astrocytes, neurons, and regions of interest (ROIs) in the surrounding neuropil in layers I-III of the hindlimb cortex were imaged in response to at least 10 trials of brief (0.5–1.0 s) mechanical stimulation of each limb. In one group of experiments, imaging parameters were adjusted to allow concomitant imaging of multiple neuron and astrocyte somata. In separate experiments, a 1.1 NA, 60× objective was used to acquire higher-resolution images of individual astrocyte somata and endfeet.
Two-photon image processing.
A median filter (radius, 1 pixel) was applied to each image to reduce background noise associated with photon or photomultiplier tube noise. Using custom IgorPro functions, Ca2+ fluctuations in each trial of stimulation could be determined and mean traces of Ca2+ oscillation across all trials made for individual astrocytes, neurons, and neuropil ROIs. Mean traces were imported into Clampfit 9.0 (Molecular Devices, Sunnydale, CA) and responding cells were identified using a threshold search. Thresholds were set to identify cells where the change in Ca2+-induced fluorescence relative to baseline fluorescence was greater than one SD over baseline and remained above this criterion for at least 0.5 s (or three times the frame rate for frame rates >170 ms/frame). These criteria were found effective for separating responsive cells from noise.
Statistical analysis.
Multigroup comparisons were made using an ANOVA with post hoc t tests. A p value ≤0.05 was considering statistically significant, except for multiple post hoc comparisons, in which case the Bonferroni correction was used to set the α level. Data are expressed as the mean ± SEM.
Results
Figure 1 summarizes the imaging protocol and data from a representative case. Custom mechanical manipulators were used to activate the somatosensory cortex in adult urethane-anesthetized mice via movement (1.0 s at 10 or 100 Hz) of the contralateral hindlimb (cHL) or contralateral forelimb (cFL). Imaging of evoked IOS was used to measure the hemodynamic response to cortical activation and establish a map of responsive cortex. In Figure 1A, IOS maps show the regions of cortex activated over 30 trials of cHL (red shading) or cFL (blue shading) stimulation. The shaded areas primarily reflect areas of increased light absorption/decreased reflectance (i.e., an initial darkening of the cortex in active regions relative to surrounding cortex), and indicate activation within 30% of peak amplitude. Figure 1B shows the time course of the mean light intensity fluctuations in the hindlimb region demarcated by the dashed circle in Figure 1A. Consistent with previous reports, there is an “initial dip” in light reflectance in active regions, likely caused by a relative increase in deoxyhemoglobin shortly after stimulus onset (Frostig et al., 1990; Devor et al., 2003). After the initial dip, increased blood flow (functional hyperemia) is associated with increased oxyhemoglobin concentration and blood volume, manifested in the IOS by increased light reflectance/decreased absorbance starting ∼600–800 ms after stimulus onset (Fig. 1B) (Devor et al., 2003). Figure 1C shows two-photon images of layer II/III neurons and astrocytes (depth, 180 μm) labeled with the membrane permeant Ca2+ indicator OGB-1 (Stosiek et al., 2003) and astrocyte marker SR101 (Nimmerjahn et al., 2004). In Figure 1D, the mean Ca2+ fluctuations, as indicated by the percentage change in OGB-1 fluorescence divided by the baseline fluorescence (ΔF/Fo), averaged from 10 trials of cHL, cFL, ipsilateral hindlimb, and ipsilateral forelimb stimulation (1.0 s at 100 Hz), are illustrated for two astrocytes, one neuron, and one ROI in the neuropil (Fig. 1C,E, arrowheads). In astrocyte a1, neuron n1, and neuropil ROI np1, Ca2+ fluorescence increased immediately after cHL stimulation onset, but did not increase for stimulation of any other limbs. The response to cHL stimulation in a1, n1, and np1 all met threshold criteria, although differences in amplitude and duration are apparent. Astrocyte a2, despite its juxtaposition to a1, did not show a Ca2+ response to any stimulation conditions. Figure 1E shows a “difference image” illustrating poststimulus increases in absolute OGB-1 fluorescence levels in response to cHL stimulation. No clear spatial relationship was observed in this or other animals, as strong responses in neurons and astrocytes did not appear to be dependent on the location of the cell relative to other responsive and nonresponsive cells (i.e., responsive astrocytes were not necessarily adjacent to responsive neurons or other responsive astrocytes) (Fig. 1E, a1, a2).
Figure 1.
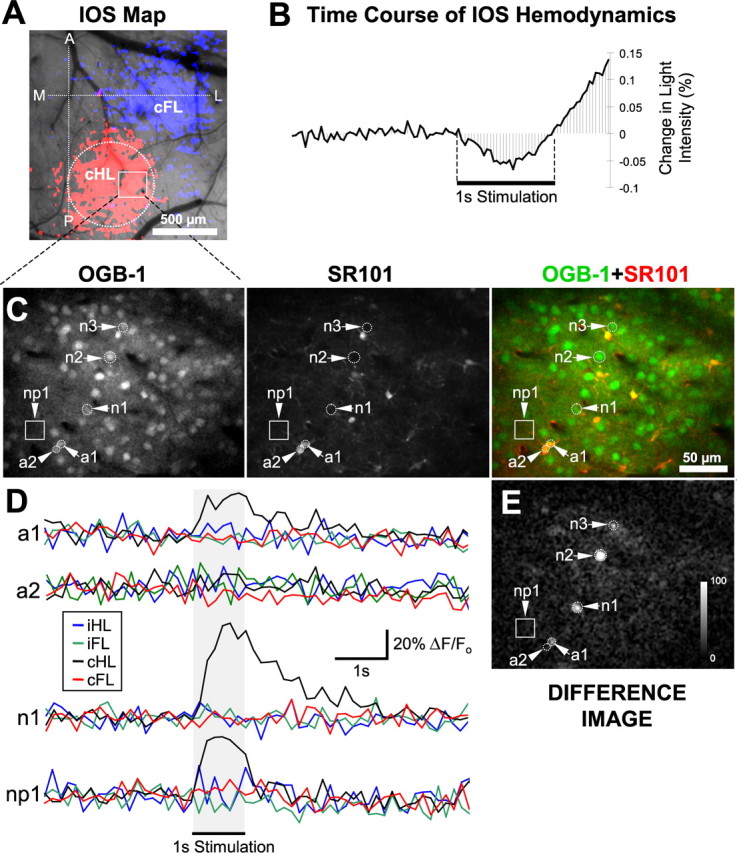
Identification of short-latency astrocyte Ca2+ responses activated by sensory stimulation. A, An IOS response map derived from cHL (red shading) and cFL (blue shading) limb stimulation. The horizontal dashed line indicates bregma, whereas the vertical dashed line is 1.2 mm lateral to the midline. B, The time course of the hemodynamic response that constitutes the IOS during cHL stimulation in the cortex demarcated by the dashed circle in A. C, Images of OGB-1 and SR101 labeling acquired via two-photon microscopy of the subregion of the hindlimb area demarcated by the white box in A (depth, 180 μm). D, Average change (for 10 trials) in OGB-1 fluorescence (relative to baseline, ΔF/Fo) triggered by mechanical stimulation of each of the limbs individually for the astrocytes (a1, a2), neuron (n1), and region of interest in the neuropil (np1), demarcated by arrows in C. E, A difference image generated from images captured before and during cHL stimulation, illustrating the mean increase in absolute fluorescence after cHL stimulation and made by averaging frames prestimulation (10 frames, 154.13 ms per frame) and poststimulation (10 frames starting with stimulation onset), and then subtracting the prestimulation image from the poststimulation image. Because the neuropil has a lower resting fluorescence than cell somata and a relatively spatially homogenous calcium response across the image, a small increase in absolute fluorescence in the neuropil may give rise to a significant ΔF/Fo, but will not be visible in a difference image. As such, difference images depicting changes in absolute fluorescence were useful for identifying responsive somata visible above the response of the neuropil. The calibration bar shows the mean increase in fluorescence (from 10 trials of cHL stimulation) in raw gray levels in the 1.5 s after stimulus onset (subtracting baseline). A, Anterior; L, lateral; M, medial; P, posterior; iHL, ipsilateral hindlimb; iFL, ipsilateral forelimb.
Two-photon Ca2+ imaging of 355 astrocytes (seven mice) in layers I–III (depth, 129 ± 13 μm) in hindlimb-activated somatosensory cortex was performed in response to brief (0.5 s, n = 47; 1.0 s, n = 308) mechanical limb stimulation at 3 Hz (n = 68), 10 Hz (n = 115), and 100 Hz (n = 308). Eighteen astrocytes (5.07% of total astrocytes; an average of 5.08 ± 1.28% per mouse) showed an above-threshold stimulus-driven Ca2+ elevation after cHL stimulation. No other limbs induced a significant Ca2+ response. Approximately 20–30% of neurons and most neuropil ROIs in the same image planes showed Ca2+ responses above threshold criteria. Of 68 astrocytes (one mouse) tested with multiple frequencies of stimulation (1.0 s of 3, 10, and 100 Hz stimulation plus 5.0 s of 10 Hz stimulation), two responded to multiple frequencies of 1.0 s stimulation, and a third astrocyte showed a strong short-latency response to the prolonged (5.0 s) stimulation, but no other conditions.
To confirm that astrocyte responses did not reflect contamination from surrounding neuropil, we assessed the stimulus-driven increase in absolute fluorescence (in raw gray levels) in responsive astrocytes and the surrounding elements. The mean increases in absolute OGB-1 fluorescence (peak − Fo) in astrocytes (44.4 ± 5.1 gray levels) during the 1.5 s after stimulation was significantly greater than the mean increase in fluorescence in neuropil ROIs (13.3 ± 1.4 gray levels) in the same images (t test, p ≪ 0.001). These findings are inconsistent with the astrocyte responses being caused by contamination from neuropil responses. Further, morphological analysis revealed that astrocytes labeled with SR101 had small, irregular somata with multiple visible processes, including endfoot processes. Astrocyte somata (n = 111; meanarea, 48.8 ± 1.5 μm2) were significantly smaller (t test, p ≪ 0.001) than neuron somata (n = 215; meanarea, 57.4 ± 1.0 μm2) in the same images, which were spherical without visible processes (Fig. 1C). Importantly, there was no significant difference between responsive astrocytes (n = 18; meanarea, 49.2 ± 3.0 μm2; meanprocess, 2.00 ± 0.26) and nonresponsive astro-cytes (n = 93; meanarea, 48.7 ± 1.7 μm2; meanprocess, 1.95 ± 0.13) in somatic area (t test, p = 0.91) or mean number of visible processes (t test, p = 0.87).
Figure 2A shows mean Ca2+ responses for astrocytes, neurons, and neuropil ROIs in response to brief cHL stimulation. The mean ΔF/Fo traces are based on 20 above-threshold astrocyte responses (from 18 astrocytes; two astrocytes responded to two stimulation frequencies), matched to 20 neuron and neuropil responses according to stimulus condition and image section (Fig. 1, a1, n1, np1). Time-to-peak (relative to stimulus onset) and decay tau distributions for the astrocytes, neurons, and neuropil ROIs used in the average traces are illustrated in Figure 2B. The peak amplitudes (ΔF/Fo) of astrocyte, neuron, and neuropil Ca2+ signals were 19.1 ± 1.7, 30.8 ± 4.2, and 17.3 ± 2.7%. Whereas time-to-peak (from stimulus onset) means did not differ significantly between astrocytes (0.41 ± 0.11 s), neurons (0.56 ± 0.09 s), and neuropil (0.43 ± 0.09 s; F(2,18) = 0.67; p = 0.52), decay taus showed a significant effect of group (F(2,18) = 5.60; p = 0.013). Post hoc t tests using the Bonferroni correction revealed significantly shorter decay taus in neuropil ROIs (0.55 ± 0.04 s) compared with astrocytes (1.07 ± 0.17 s; p = 0.011) and neurons (1.21 ± 0.18 s; p = 0.005). The mean decay taus of astrocytes and neurons were not significantly different (p = 0.59).
Figure 2.

Average Ca2+ response to brief cHL stimulation and response kinetics in astrocytes, neurons, and neuropil. In A, average traces illustrate the change in fluorescence relative to baseline (ΔF/Fo) of 20 above-threshold astrocyte responses and matched neuronal and neuropil responses during brief (0.5–1.0 s) cHL stimulation. Individual traces for each cell or neuropil region were interpolated to a common frame rate before averaging. Traces are decimated (by averaging) to 4 Hz (black squares) and error bars show the SEM. The dashed vertical line indicates stimulus onset. Histograms in B show the time to peak from stimulus onset and the decay tau for the individual astrocyte (top), neuron (middle), and neuropil (bottom) responses used to generate the mean traces on the left. Time to peaks and decay taus are binned over 250 ms, and labels on the x-axis indicate the upper bound for the labeled bin (note, only every second tick is labeled).
Analysis of image planes containing responsive astrocytes and well loaded endfoot processes suggests that above-threshold sensory-evoked Ca2+ transients occur in 12.7% of endfeet (n = 102; 4 mice) in layer II/III of the hindlimb cortex (peak ΔF/Fo, 18.8 ± 5.4%; time-to-peak, 0.73 ± 0.19 s; decay tau, 0.93 ± 0.10 s). Notably, endfoot decay was significantly longer than neuropil decay (t test, p = 0.003). Longer decays in the astrocyte somata/endfeet, and neuronal somata likely reflect the larger compartment volume and slower Ca2+ clearance from these elements relative to the axons and dendrites of the neuropil (Kerr et al. 2005). To more closely examine the endfoot responses, we performed higher-resolution two-photon imaging (60×, 1.1 NA objective) on astrocyte endfeet and somata in layer I of the hindlimb cortex (primarily targeting astrocytes and endfeet associated with penetrating arterioles; six mice). Additionally, we simultaneously measured OGB-1 and SR101 fluorescence, which allowed us to correct for possible movement artifact induced by changes in blood vessel diameter by calculating the OGB-1/SR101 (G/R) ratio. Endfoot Ca2+ responses showed significant intertrial variability, but typically started immediately after limb stimulation, reached peak amplitude 0.5–4 s after stimulation onset, and maintained elevated fluorescence after stimulus cessation (i.e., rapid onset but slow decay). Representative astrocyte and endfoot responses are illustrated in Figure 3. Figure 3, D and E, illustrates “difference images,” which illustrate elevation in raw OGB-1 fluorescence above changes in the surrounding neuropil for the astrocyte and endfoot depicted in 3A–C for a single trial of cHL stimulation and an average of 10 trials, respectively. Traces in Figure 3, F (single trial) and G (10 trial average), show the ΔF/Fo and G/R ratios from the ROIs outlined in Figure 3C. This astrocyte and endfoot exhibited a sensory-evoked Ca2+ transient with rapid onset, beginning immediately after stimulation, but slow decay. G/R ratios confirm that this transient is selective to the Ca2+indicator and cannot be explained by movement artifact, which would affect both OGB-1 and SR101 channels. A second representative astrocyte and endfoot, shown in Figure 3H–J, shows rapid onset and slow decay, but slower time-to-peak kinetics relative to the example in Figure 3A–G.
Figure 3.

Somatic and endfoot Ca2+ transients in an astrocyte (Astro) identified via high-resolution two-photon calcium imaging. A–C, OGB-1, SR101, and OGB-1 plus SR101 overlay for an astrocyte and endfoot in layer I of the hindlimb somatosensory cortex. D, E, Difference (Diff.) images for a single trial and the average of 10 trials of cHL (1 s, 100Hz) stimulation for the astrocyte and endfoot in A–C, respectively. Calibration bars in D and E show the mean increase in absolute fluorescence in raw gray levels after stimulus onset (subtracting baseline). Traces in F and G show the ΔF/Fo and G/R ratios from the ROIs outlined in C for a single trial and 10 trial averages, respectively. G/R ratios are normalized to SD units (i.e., ratio values were divided by their baseline SD). Both ΔF/Fo and G/R ratios reveal short-latency calcium transients in the astrocyte soma and adjacent endfoot. H–J, A second representative astrocyte and endfoot, exhibiting rapid sensory-evoked response onset, but slower rise time [H, OGB-1 plus SR101 overlay; I, difference image based on mean response to 10 trials of cHL stimulation (1 s, 100Hz); J, mean ΔF/Fo traces].
Discussion
We identify a subset of astrocytes in somatosensory cortex that exhibit selective, short-latency Ca2+ responses to sensory stimulation. The responses reach peak amplitude ∼0.5 s after stimulus onset and can be separated from the predominantly presynaptic (i.e., neuropil) (Kerr et al., 2005) and postsynaptic neuronal Ca2+ responses. Our data demonstrates that sensory-driven astrocyte Ca2+ oscillations, which have been proposed to modulate microvascular tone (Zonta et al., 2003; Mulligan and MacVicar, 2004; Takano et al., 2006), can occur at short latencies necessary to facilitate hyperemia to the active cortex. Previous evidence indicates that hyperemia begins ∼600 ms after sensory stimulus onset and, thus, would require a rapid response from astrocytes (Kleinfeld et al., 1998; Devor et al., 2003). It is worth noting that astrocyte processes can contact up to 100,000 synapses (Bushong et al., 2002), and most astrocytes extend endfoot processes toward nearby blood vessels (Simard et al., 2003). These anatomical considerations suggest this subset of rapidly responding, sensory-driven astrocytes are poised to exert significant influence on the subsecond regulation of synaptic transmission and microvascular tone, and are consistent with astrocytes shaping synaptic events rather than merely following them. Although previous two-photon imaging studies (Wang et al., 2006) demonstrated robust astrocyte Ca2+ responses to sensory stimulation, the signals were delayed until several seconds after the local field potential reported a sensory-evoked response, suggesting that they would not be useful for modulating microcirculation in response to neuronal activity at short latencies. Indeed, it is unclear whether the astrocyte Ca2+ signals reported by the previous study (Wang et al., 2006) were accompanied by a rapid hemodynamic response, as we demonstrate using intrinsic signal imaging on the same preparations and regions used for Ca2+ imaging. It is also uncertain why Wang et al. (2006) only observed delayed onset astrocyte Ca2+ signals in response to sensory stimulation. A possible limitation of the previous study is that it uses an astrocyte-specific labeling method that uses prolonged incubation in high DMSO and pluronic detergent without the protection of the overlying dura. This method, in contrast to bolus dye loading that we used (Stosiek et al. 2003), does not permit the simultaneous optical monitoring of neighboring short-latency neuronal Ca2+ responses that verify tissue health and imaging in the targeted region of the somatosensory cortex. Previous in vitro studies have shown that astrocytes respond to stimulation intensities in a range similar to neurons, and that the magnitude of astrocyte Ca2+ responses is correlated with the amount of neuronal activity (Porter and McCarthy, 1996; Pasti et al., 1997). Astrocyte Ca2+ signals are graded according to the degree of neuronal activation, rather than all-or-none, and different subtypes of glutamate receptor are activated at different intensities of neuronal stimulation (Porter and McCarthy, 1996; Pasti et al., 1997; Latour et al., 2001; Lalo et al., 2006; Wang et al., 2006). It is possible that short- and long-latency astrocytic Ca2+ oscillations may reflect different degrees of neuronal activity and it is likely that different patterns of sensory stimulation elicit heterogeneous astrocyte Ca2+ signals. Furthermore, different subpopulations of protoplasmic astrocytes possess varying glutamate-receptor complements, and the short- and long-latency responses may reflect the activation of different glutamate receptors (Matthias et al., 2003; Wallraff et al., 2004; Jabs et al., 2005), and play different roles in regulating rapid or slow modulation of neuron–astrocyte network properties (Dani et al., 1992; Pasti et al., 1997) or cortical hemodynamics. Consistent with these proposals, recent in vivo work indicates that both short- and long-latency astrocyte Ca2+ signals can be observed in response to intracortical electrical stimulation (Gobel et al., 2007); although the authors note the large amplitude, long-lasting Ca2+ oscillations that propagate throughout the glial network, careful examination of the data presented suggests that smaller, short-latency Ca2+ transients were also triggered by electrical stimulation in some astrocytes.
Footnotes
This work was supported by Canadian Institutes of Health Research (CIHR) operating Grant MOP12675 (T.H.M.) and a Focus on Stroke postdoctoral fellowship, jointly funded by the Heart and Stroke Foundation of Canada, CIHR, Canadian Stroke Network, and Astra Zeneca Canada (I.R.W.). T.H.M. is a Michael Smith Foundation for Health Research senior scholar. We thank Ping Li for assistance with surgical preparations, Brian MacVicar and Craig Brown for comments on this manuscript, Jamie Boyd and Kerry Delaney for imaging software and hardware, and Alexander Goroshkov for technical assistance.
References
- Araque A, Parpura V, Sanzgiri RP, Haydon PG. Glutamate-dependent astrocyte modulation of synaptic transmission between cultured hippocampal neurons. Eur J Neurosci. 1998a;10:2129–2142. doi: 10.1046/j.1460-9568.1998.00221.x. [DOI] [PubMed] [Google Scholar]
- Araque A, Sanzgiri RP, Parpura V, Haydon PG. Calcium elevation in astrocytes causes an NMDA receptor-dependent increase in the frequency of miniature synaptic currents in cultured hippocampal neurons. J Neurosci. 1998b;18:6822–6829. doi: 10.1523/JNEUROSCI.18-17-06822.1998. [DOI] [PMC free article] [PubMed] [Google Scholar]
- Auld DS, Robitaille R. Glial cells and neurotransmission: an inclusive view of synaptic function. Neuron. 2003;40:389–400. doi: 10.1016/s0896-6273(03)00607-x. [DOI] [PubMed] [Google Scholar]
- Bergles DE, Jahr CE. Synaptic activation of glutamate transporters in hippocampal astrocytes. Neuron. 1997;19:1297–1308. doi: 10.1016/s0896-6273(00)80420-1. [DOI] [PubMed] [Google Scholar]
- Bushong EA, Martone ME, Jones YZ, Ellisman MH. Protoplasmic astrocytes in CA1 stratum radiatum occupy separate anatomical domains. J Neurosci. 2002;22:183–192. doi: 10.1523/JNEUROSCI.22-01-00183.2002. [DOI] [PMC free article] [PubMed] [Google Scholar]
- Dani JW, Chernjavsky A, Smith SJ. Neuronal activity triggers calcium waves in hippocampal astrocyte networks. Neuron. 1992;8:429–440. doi: 10.1016/0896-6273(92)90271-e. [DOI] [PubMed] [Google Scholar]
- Devor A, Dunn AK, Andermann ML, Ulbert I, Boas DA, Dale AM. Coupling of total hemoglobin concentration, oxygenation, and neural activity in rat somatosensory cortex. Neuron. 2003;39:353–359. doi: 10.1016/s0896-6273(03)00403-3. [DOI] [PubMed] [Google Scholar]
- Fellin T, Pascual O, Gobbo S, Pozzan T, Haydon PG, Carmignoto G. Neuronal synchrony mediated by astrocytic glutamate through activation of extrasynaptic NMDA receptors. Neuron. 2004;43:729–743. doi: 10.1016/j.neuron.2004.08.011. [DOI] [PubMed] [Google Scholar]
- Frostig RD, Lieke EE, Ts'o DY, Grinvald A. Cortical functional architecture and local coupling between neuronal activity and the microcirculation revealed by in vivo high-resolution optical imaging of intrinsic signals. Proc Natl Acad Sci USA. 1990;87:6082–6086. doi: 10.1073/pnas.87.16.6082. [DOI] [PMC free article] [PubMed] [Google Scholar]
- Gobel W, Kampa BM, Helmchen F. Imaging cellular network dynamics in three dimensions using fast 3D laser scanning. Nat Methods. 2007;4:73–79. doi: 10.1038/nmeth989. [DOI] [PubMed] [Google Scholar]
- Gurden H, Uchida N, Mainen ZF. Sensory-evoked intrinsic optical signals in the olfactory bulb are coupled to glutamate release and uptake. Neuron. 2006;52:335–345. doi: 10.1016/j.neuron.2006.07.022. [DOI] [PubMed] [Google Scholar]
- Haydon PG, Carmignoto G. Astrocyte control of synaptic transmission and neurovascular coupling. Physiol Rev. 2006;86:1009–1031. doi: 10.1152/physrev.00049.2005. [DOI] [PubMed] [Google Scholar]
- Jabs R, Pivneva T, Huttmann K, Wyczynski A, Nolte C, Kettenmann H, Steinhauser C. Synaptic transmission onto hippocampal glial cells with hGFAP promoter activity. J Cell Sci. 2005;118:3791–3803. doi: 10.1242/jcs.02515. [DOI] [PubMed] [Google Scholar]
- Kerr JN, Greenberg D, Helmchen F. Imaging input and output of neocortical networks in vivo. Proc Natl Acad Sci USA. 2005;102:14063–14068. doi: 10.1073/pnas.0506029102. [DOI] [PMC free article] [PubMed] [Google Scholar]
- Kleinfeld D, Mitra PP, Helmchen F, Denk W. Fluctuations and stimulus-induced changes in blood flow observed in individual capillaries in layers 2 through 4 of rat neocortex. Proc Natl Acad Sci USA. 1998;95:15741–15746. doi: 10.1073/pnas.95.26.15741. [DOI] [PMC free article] [PubMed] [Google Scholar]
- Lalo U, Pankratov Y, Kirchhoff F, North RA, Verkhratsky A. NMDA receptors mediate neuron-to-glia signaling in mouse cortical astrocytes. J Neurosci. 2006;26:2673–2683. doi: 10.1523/JNEUROSCI.4689-05.2006. [DOI] [PMC free article] [PubMed] [Google Scholar]
- Latour I, Gee CE, Robitaille R, Lacaille JC. Differential mechanisms of Ca2+ responses in glial cells evoked by exogenous and endogenous glutamate in rat hippocampus. Hippocampus. 2001;11:132–145. doi: 10.1002/hipo.1031. [DOI] [PubMed] [Google Scholar]
- Matthias K, Kirchhoff F, Seifert G, Huttmann K, Matyash M, Kettenmann H, Steinhauser C. Segregated expression of AMPA-type glutamate receptors and glutamate transporters defines distinct astrocyte populations in the mouse hippocampus. J Neurosci. 2003;23:1750–1758. doi: 10.1523/JNEUROSCI.23-05-01750.2003. [DOI] [PMC free article] [PubMed] [Google Scholar]
- Mulligan SJ, MacVicar BA. Calcium transients in astrocyte endfeet cause cerebrovascular constrictions. Nature. 2004;431:195–199. doi: 10.1038/nature02827. [DOI] [PubMed] [Google Scholar]
- Murphy TH, Blatter LA, Wier WG, Baraban JM. Rapid communication between neurons and astrocytes in primary cortical cultures. J Neurosci. 1993;13:2672–2679. doi: 10.1523/JNEUROSCI.13-06-02672.1993. [DOI] [PMC free article] [PubMed] [Google Scholar]
- Nimmerjahn A, Kirchhoff F, Kerr JN, Helmchen F. Sulforhodamine 101 as a specific marker of astroglia in the neocortex in vivo. Nat Methods. 2004;1:31–37. doi: 10.1038/nmeth706. [DOI] [PubMed] [Google Scholar]
- Pasti L, Volterra A, Pozzan T, Carmignoto G. Intracellular calcium oscillations in astrocytes: a highly plastic, bidirectional form of communication between neurons and astrocytes in situ. J Neurosci. 1997;17:7817–7830. doi: 10.1523/JNEUROSCI.17-20-07817.1997. [DOI] [PMC free article] [PubMed] [Google Scholar]
- Porter JT, McCarthy KD. GFAP-positive hippocampal astrocytes in situ respond to glutamatergic neuroligands with increases in [Ca2+]i. Glia. 1995a;13:101–112. doi: 10.1002/glia.440130204. [DOI] [PubMed] [Google Scholar]
- Porter JT, McCarthy KD. Adenosine receptors modulate [Ca2+]i in hippocampal astrocytes in situ. J Neurochem. 1995b;65:1515–1523. doi: 10.1046/j.1471-4159.1995.65041515.x. [DOI] [PubMed] [Google Scholar]
- Porter JT, McCarthy KD. Hippocampal astrocytes in situ respond to glutamate released from synaptic terminals. J Neurosci. 1996;16:5073–5081. doi: 10.1523/JNEUROSCI.16-16-05073.1996. [DOI] [PMC free article] [PubMed] [Google Scholar]
- Simard M, Arcuino G, Takano T, Liu QS, Nedergaard M. Signaling at the gliovascular interface. J Neurosci. 2003;23:9254–9262. doi: 10.1523/JNEUROSCI.23-27-09254.2003. [DOI] [PMC free article] [PubMed] [Google Scholar]
- Stosiek C, Garaschuk O, Holthoff K, Konnerth A. In vivo two-photon calcium imaging of neuronal networks. Proc Natl Acad Sci USA. 2003;100:7319–7324. doi: 10.1073/pnas.1232232100. [DOI] [PMC free article] [PubMed] [Google Scholar]
- Takano T, Tian GF, Peng W, Lou N, Libionka W, Han X, Nedergaard M. Astrocyte-mediated control of cerebral blood flow. Nat Neurosci. 2006;9:260–267. doi: 10.1038/nn1623. [DOI] [PubMed] [Google Scholar]
- Wallraff A, Odermatt B, Willecke K, Steinhauser C. Distinct types of astroglial cells in the hippocampus differ in gap junction coupling. Glia. 2004;48:36–43. doi: 10.1002/glia.20040. [DOI] [PubMed] [Google Scholar]
- Wang X, Lou N, Xu Q, Tian GF, Peng WG, Han X, Kang J, Takano T, Nedergaard M. Astrocytic Ca2+ signaling evoked by sensory stimulation in vivo. Nat Neurosci. 2006;9:816–823. doi: 10.1038/nn1703. [DOI] [PubMed] [Google Scholar]
- Zhang S, Boyd J, Delaney K, Murphy TH. Rapid reversible changes in dendritic spine structure in vivo gated by the degree of ischemia. J Neurosci. 2005;25:5333–5338. doi: 10.1523/JNEUROSCI.1085-05.2005. [DOI] [PMC free article] [PubMed] [Google Scholar]
- Zonta M, Angulo MC, Gobbo S, Rosengarten B, Hossmann KA, Pozzan T, Carmignoto G. Neuron-to-astrocyte signaling is central to the dynamic control of brain microcirculation. Nat Neurosci. 2003;6:43–50. doi: 10.1038/nn980. [DOI] [PubMed] [Google Scholar]