

Abstract
Medium spiny neurons (MSNs) are the principal cells of the striatum and perform a central role in sensorimotor processing. MSNs must integrate many excitatory inputs located across their dendrites to fire action potentials and enable striatal function. However, the dependence of synaptic responses on the temporal and spatial distribution of these inputs remains unknown. Here, we use whole-cell recordings, two-photon microscopy, and two-photon glutamate uncaging to examine subthreshold synaptic integration in MSNs from acute rat brain slices. We find that synaptic responses can summate sublinearly, linearly, or supralinearly depending on the spatiotemporal pattern of activity. Repetitive activity at single inputs leads to sublinear summation, reflecting long-lived AMPA receptor desensitization. In contrast, asynchronous activity at multiple inputs generates linear summation, with synapses on neighboring spines functioning independently. Finally, synchronous activity at multiple inputs triggers supralinear summation at depolarized potentials, reflecting activation of NMDA receptors and L-type calcium channels. Thus, the properties of subthreshold integration in MSNs are determined by the distribution of synaptic inputs and the differential activation of multiple postsynaptic conductances.
Keywords: striatum, medium spiny neuron, dendrite, spine, synaptic integration, two-photon microscopy
Introduction
The dorsal striatum is important for sensorimotor processing, as underscored by diseases like Parkinson's and Huntington's. The principal neurons of the dorsal striatum are medium spiny neurons (MSNs), which receive glutamatergic inputs from the cortex and thalamus (Cowan and Wilson, 1994; Wilson, 2003). These excitatory inputs arrive at spines located throughout the dendrites, where they can activate multiple types of postsynaptic receptors to evoke electrical and calcium signals. Although these signals are important for controlling firing and synaptic plasticity in MSNs (Calabresi et al., 1992a,b, 1994; Kreitzer and Malenka, 2005), little is known about their integration during repetitive synaptic activity.
The electrophysiological properties of MSNs and their excitatory inputs show pronounced changes during development. In adult animals, strong excitation drives state transitions in vivo, with the membrane potential shifting from a negative potential of −80 mV to a near-threshold potential of −50 mV (Wilson and Kawaguchi, 1996; Stern et al., 1997). While individual inputs generate small EPSPs (Kawaguchi et al., 1989), they also show paired-pulse facilitation at this age (Choi and Lovinger, 1997; Tang et al., 2001), such that repetitive activity can generate pronounced depolarizations. In immature animals, state transitions are less frequent in vivo, with smaller magnitudes and durations (Tepper et al., 1998). Over the first postnatal month, individual inputs also display paired-pulse depression, which is thought to reflect a high initial glutamate release probability that progressively decreases with repetitive activity (Choi and Lovinger, 1997; Tang et al., 2001; Akopian and Walsh, 2002; Kreitzer and Malenka, 2005). The small size of EPSPs and the depressive nature of excitatory inputs suggest that these MSNs must integrate many inputs to approach threshold and fire action potentials.
During distributed synaptic activity, a variety of postsynaptic interactions may occur between nearby synaptic inputs arriving on individual dendritic segments. For example, local depolarization could suppress synaptic responses by decreasing the driving force for current flow through AMPA-type glutamate receptors (AMPARs) or activating voltage-sensitive outward conductances (Urban and Barrionuevo, 1998; Tamas et al., 2002). In contrast, this depolarization could boost synaptic responses by relieving magnesium (Mg) block of NMDA-type glutamate receptors (NMDARs) or activating voltage-sensitive inward conductances (Margulis and Tang, 1998; Cash and Yuste, 1999; Nettleton and Spain, 2000). However, the dendrites of MSNs are too small to record from directly, and extracellular electrodes cannot be used to activate spatiotemporal patterns of inputs. Consequently, the contributions of different passive and active mechanisms to interactions between synaptic inputs in the dendrites of MSNs remain unknown.
Here, we examine the properties of subthreshold synaptic integration in MSNs in acute striatal slices of 2- to 3-week-old rats. Using whole-cell recordings, two-photon laser scanning microscopy (2PLSM), and two-photon laser uncaging (2PLU) of glutamate, we deliver multiple inputs to known locations while measuring Ca signals in spines and electrical signals at the soma. We find that depression of single inputs does not reflect decreased glutamate release probability, but instead results from desensitization of AMPARs. To generate sustained depolarization, multiple inputs must be activated within a narrow time window at clusters of spines. Repetitive activity at both single spines and clusters enhances local Ca signals because of additional influx through NMDARs. These results have important implications for how MSNs function in the striatum and generate Ca signals needed for synaptic plasticity.
Materials and Methods
Recordings were made from MSNs in striatal slices from postnatal day 15 (P15)–P18 Sprague Dawley rats, as described previously (Carter and Sabatini, 2004). Briefly, coronal slices (300 μm thick) were cut in ice-cold external solution containing (in mm) 110 choline, 25 NaHCO3, 1.25 NaH2PO4, 2.5 KCl, 7 MgCl2, 0.5 CaCl2, 25 glucose, 11.6 Na-ascorbate, and 3.1 Na-pyruvate, bubbled with 95% O2/5% CO2. Slices were transferred to artificial CSF (ACSF) containing (in mm) 127 NaCl, 25 NaHCO3, 1.25 NaH2PO4, 2.5 KCl, 1 MgCl2, 2 CaCl2, and 25 glucose, bubbled with 95% O2 and 5% CO2. After 30–40 min at 34°C, slices were stored at 24°C, and experiments were conducted at 30–32°C. In all experiments, 10 μm d-serine, 10 μm bicuculline, and 100 μm LY-341495 [(2S)-2-amino-2-[(1S,2S)-2-carboxycycloprop-1-yl]-3-(xanth-9-yl) propanoic acid] were present in the ACSF to prevent NMDAR desensitization, block GABAA receptors, and block metabotropic glutamate receptors, respectively. In some experiments, picrotoxin was used instead of bicuculline. In some experiments, one or more of the following drugs were added to the ACSF (in μm): 10 2,3-dioxo-6-nitro-1,2,3,4-tetrahydrobenzo[f]quinoxaline-7-sulfonamide (NBQX), 10 3-[(R)-2-carboxypiperazin-4-yl]-propyl-1-phosphonic acid (CPP), 2500 γ-d-glutamylglycine (γ-DGG), 100 cyclothiazide, 1 TTX, 0.3 SNX-482, 1 ω-conotoxin-MVIIC, 20 nimodipine, and 20 mibefradil. The mixture of voltage-sensitive Ca channel blockers consisted of SNX-482, ω-conotoxin-MVIIC, nimodipine, and mibefradil. All chemicals were from Sigma (St. Louis, MO) or Tocris Bioscience (Ellisville, MO) with the exception of SNX-482 and ω-conotoxin-MVIIC (Peptides International, Louisville, KY).
Whole-cell recordings were obtained from MSNs identified with video infrared differential interference contrast microscopy and 2PLSM based on their small cell bodies and prominent dendritic spines. Glass electrodes (2.8–4 MΩ) were filled with one of two internal solutions. Current-clamp recordings used (in mm) 135 KMeSO3, 10 HEPES, 4 MgCl2, 4 Na2ATP, 0.4 NaGTP, and 10 Na2 creatine PO4, pH 7.4, with KOH. Voltage-clamp recordings used (in mm) 135 CsMeSO3, 10 HEPES, 4 MgCl2, 4 Na2ATP, 0.4 NaGTP, and 10 Na2 creatine PO4, pH 7.4, with CsOH. Electrodes also contained 100 or 500 μm Fluo-5F to monitor Ca levels and 20 μm Alexa Fluor-594 to image neuronal morphology. Recordings were made using a Multiclamp 700B amplifier, filtering at 5 kHz for current-clamp recordings and 2 kHz for voltage-clamp recordings, and sampling at 10 kHz. Excitatory input fibers were stimulated with a small glass electrode (tip diameter, 2–4 μm) filled with ACSF, using brief (0.2 ms) and small (5–20 μA) current injections. For the experiments in Figures 1 and 5, the electrodes were placed near the external capsule. For the experiments in Figure 3, the electrode was placed ∼10 μm from the spine of interest.
Figure 1.

Excitatory inputs display postsynaptic depression. A, Left, EPSPs at −80 mV evoked by single (red trace) and paired (black traces) extracellular stimulation with ISIs of 10, 20, 50, 100, and 200 ms. Right, PPR of EPSP amplitude as a function of ISI. B, Left, 2PLSM image of a spine (S) and dendrite (D). Right, uEPSPs (top) and fluorescence transients (bottom) at −80 mV evoked by 2PLU at the spine with an ISI of 50 ms. Yellow line indicates orientation of line scan and arrows indicate uncaging times. C, uEPSPs (top) and ΔG/Rspine (middle) at −80 mV evoked by unpaired (red) and paired (black) 2PLU with an ISI of 50 ms. Solid lines are averages across multiple spines and the shaded areas represent the mean ± SEM. Bottom, PPR of uEPSP and Δ[Ca]spine amplitude at an ISI of 50 ms. D, As in C for responses recorded at a resting potential of −50 mV. *p < 0.05 compared with unity.
Figure 5.

Spatially distributed excitatory inputs do not interact. A, EPSPs at −80 mV evoked by extracellular stimulation of a single pathway (red trace) or two pathways (black traces) with ISIs of 0, 2, 5, 10, 20, 50, 100, and 200 ms. B, PPR of EPSP amplitude for one pathway (closed circles; data from Fig. 1B) or two pathways (open circles) as a function of ISI. *p < 0.05 compared with unity.
Figure 3.

Synaptically released glutamate depresses AMPAR responses. A, 2PLSM image (left) of a spine (S) and dendrite (D), fluorescence transients (top right), and ΔG/Rspine and ΔG/Rdendrite (bottom right) at −80 mV evoked by extracellular stimulation near the spine in CPP. The yellow line indicates orientation of line scan and arrow indicates stimulus time. B, Left, EPSCs at −80 mV in CPP evoked by extracellular stimulation (black trace), 2PLU (red trace), and paired activation (blue trace) with an ISI of 50 ms. Arrows indicate times of extracellular stimulation (black) and 2PLU (red). Right, EPSCs magnified from the green box, evoked by 2PLU (red trace), paired activation minus extracellular stimulation (blue trace), and the subtracted trace scaled to peak amplitude of the uEPSC (blue dotted trace).
Intracellular Ca imaging and glutamate uncaging was accomplished with a custom microscope that combines 2PLSM and 2PLU, as described previously (Carter and Sabatini, 2004). Neurons were filled via the patch electrode for 10–20 min before imaging. Fluo-5F (100 or 500 μm) was used to monitor total synaptic and AMPAR-mediated Ca signals at −80 mV. Fluo-5F (500 μm) was used to monitor total synaptic and NMDAR-mediated Ca signals at −50 mV. Dye concentrations were chosen to ensure that Ca signals were in the linear range of the indicators (Carter and Sabatini, 2004). For 2PLSM, Fluo-5F (green) and Alexa Fluor-594 (red) were excited using 840 nm light to monitor Ca signals and spine morphology, respectively. To measure Ca signals, green and red fluorescence were collected during 500 Hz line scans across a dendrite–spine or spine–spine pair. Ca signals were quantified as increases in green fluorescence from baseline normalized to the red fluorescence (ΔG/R) (Oertner et al., 2002; Sabatini et al., 2002). For 2PLU, 4-methoxy-7-nitroindolinyl-caged l-glutamate was bath applied at 2.5 mm, and glutamate uncaging was achieved using a 0.5 ms pulse of 720 nm light. Laser intensity was initially chosen to mimic the amplitude of AMPAR-mediated spontaneous, miniature EPSCs at −80 mV and was held constant across all experiments. Interstimulus intervals (ISIs) were ≥2 ms to ensure the scanning mirrors had time to settle on the spine of interest before uncaging commenced. Reference frame scans were taken between each acquisition to correct for small spatial drift of the preparation over time.
Image and physiology data were acquired using National Instruments (Austin, TX) boards and custom software written in Matlab (Mathworks, Natick, MA) (Pologruto et al., 2003). Off-line analysis was performed using custom routines written in Igor Pro (Wavemetrics, Lake Oswego, OR). The amplitudes of EPSPs/uncaging-evoked EPSPs (uEPSPs) are calculated over a ±1 ms window around the peak. The amplitudes of EPSCs/uncaging-evoked EPSCs (uEPSCs) are averages over a 20 ms time period after the stimulus. The amplitudes of spine Ca signals are averages over a 50 ms time period after the stimulus.
For experiments in Figures 1–4, we measured the response to stimulation at t = 0 ms (Single1) or paired stimulation at a variable ISI (Pair1→2). The paired-pulse ratio (PPR) was calculated using the following equations:
|
|
Figure 2.

Depression is caused by AMPAR desensitization. A, AMPAR-mediated EPSCs at −80 mV in CPP (top left), CPP and γ-DGG (top right), or CPP and CTZ (bottom left) with variable ISIs. Bottom right, PPR of EPSC amplitude as a function of ISI in the indicated conditions. B, AMPAR-mediated uEPSCs (top) and ΔG/Rspine (middle) at −80 mV in CPP with an ISI of 50 ms. Bottom, PPR of uEPSC and Δ[Ca]spine amplitude at an ISI of 50 ms. C, As in B for responses obtained at −80 mV in CPP and CTZ. *p < 0.05 compared with unity.
Figure 4.

NMDAR responses summate linearly. A, NMDAR-mediated EPSCs at −50 mV in NBQX (top) or NBQX and nimodipine (NIM; middle) with variable ISIs. Bottom, PPR of EPSC amplitude as a function of ISI in the indicated conditions. B, NMDAR-mediated uEPSCs (top) and ΔG/Rspine (middle) at −50 mV in NBQX with ISI = 50 ms. Bottom, PPR of uEPSC and Δ[Ca]spine amplitude at an ISI of 50 ms. *p < 0.05 compared with unity.
For experiments in Figure 5, we measured the response to stimulation of pathways 1 and 2 alone at t = 0 ms (Single1 and Single2) or paired stimulation of pathway 1 at t = 0 ms with pathway 2 at a variable ISI (Pair1→2). The PPR was calculated using the following equations:
|
|
For the experiments in Figures 6 and 7, we measured the response to stimulation of spine 1 (S1) and spine 2 (S2) alone at t = 0 ms (Single1 and Single2) or paired stimulation of S1 at t = 0 ms with S2 at a variable ISI of positive (Pair1→2) or negative (Pair2→1) value. The ratios for uEPSPs (RuEPSP) were calculated using the following equations:
|
|
Figure 6.
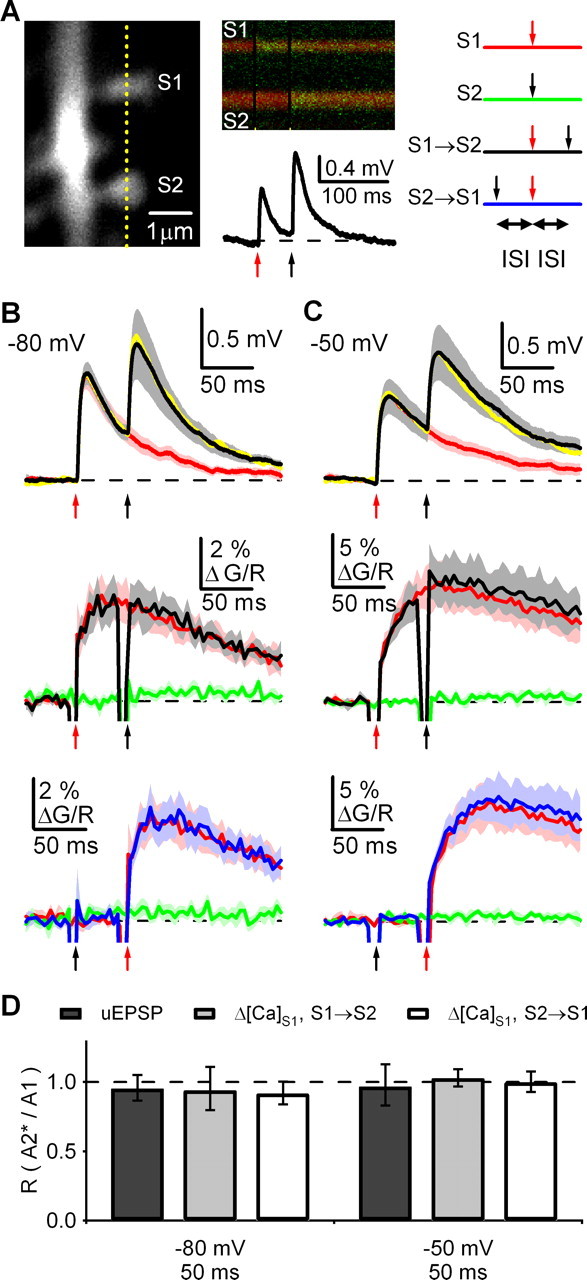
Asynchronous synaptic inputs at neighboring spines do not interact. A, Left, 2PLSM image of dendrite and two spines (S1 and S2). Middle, Fluorescence transients (top) and simultaneous uEPSPs (bottom) at −80 mV evoked by sequential 2PLU at the two spines. Right, Stimulation schematic: S1 alone (red traces), S2 alone (green traces), S1→S2 (black traces), or S2→S1 (blue traces). Yellow line indicates orientation of line scan and arrows indicate times of 2PLU at S1 (red) and S2 (black). B, uEPSPs (top) and ΔG/RS1 (S1→S2 in middle and S2→S1 on bottom) at −80 mV with an ISI of 50 ms. For uEPSPs, red traces are single responses (S1), black traces are paired responses (S1→S2), and yellow traces are the linear predictions. For ΔG/RS1, the colored traces indicate the responses evoked by the stimulation protocols shown in the schematic in (A). C, As in B for responses recorded at −50 mV with an ISI of 50 ms. D, Ratio of the amplitudes of paired (A2*) and unpaired (A1) uEPSPs and Δ[Ca]S1 (S1→S2 and S2→S1) in the indicated conditions. Summary data are shown as the geometric mean and 95% confidence interval. *p < 0.05 compared with unity.
Figure 7.
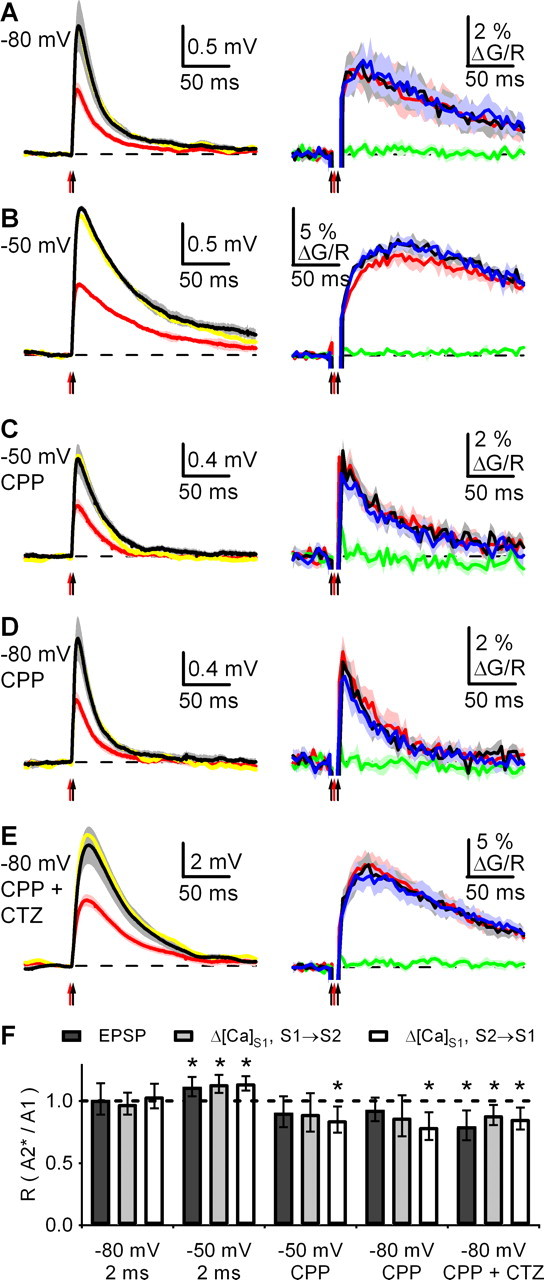
Synchronous activation of neighboring spines reveals NMDAR-dependent nonlinearities. A, uEPSPs (left) and ΔG/Rspine (both S1→S2 and S2→S1 on right) at −80 mV with an ISI of 2 ms. The colored traces are the same as those described for Figure 6. B–E, As in A for responses at −50 mV (B), at −50 mV in CPP (C), at −80 mV in CPP (D), and at −80 mV in CPP and CTZ (E). F, Ratio of the amplitudes of paired (A2*) and unpaired (A1) uEPSPs and Δ[Ca]S1 (S1→S2 and S2→S1) in the indicated conditions. Summary data are shown as the geometric mean and 95% confidence interval. *p < 0.05 compared with unity.
The ratio for Ca signals in S1 (Δ[Ca]S1) when stimulation of S1 preceded S2 (RCa (S1→S2)) was calculated using the following equations:
|
|
Similarly, the ratio for Ca signals in S1 (Δ[Ca]S1) when stimulation of S1 followed S2 (RCa (S2→S1)) was calculated using the following equations:
|
|
For experiments shown in Figure 8 and supplemental Figure 4 (available at www.jneurosci.org as supplemental material), we measured the response to the individual stimuli alone (Single1, Single2, Single3, Single4, and Single5) or in a burst. The ratios for EPSP amplitude (RuEPSP(A)), uEPSP decay (RuEPSP(D)) and Ca signals (RCa) were calculated using the following equations:
|
|
Figure 8.
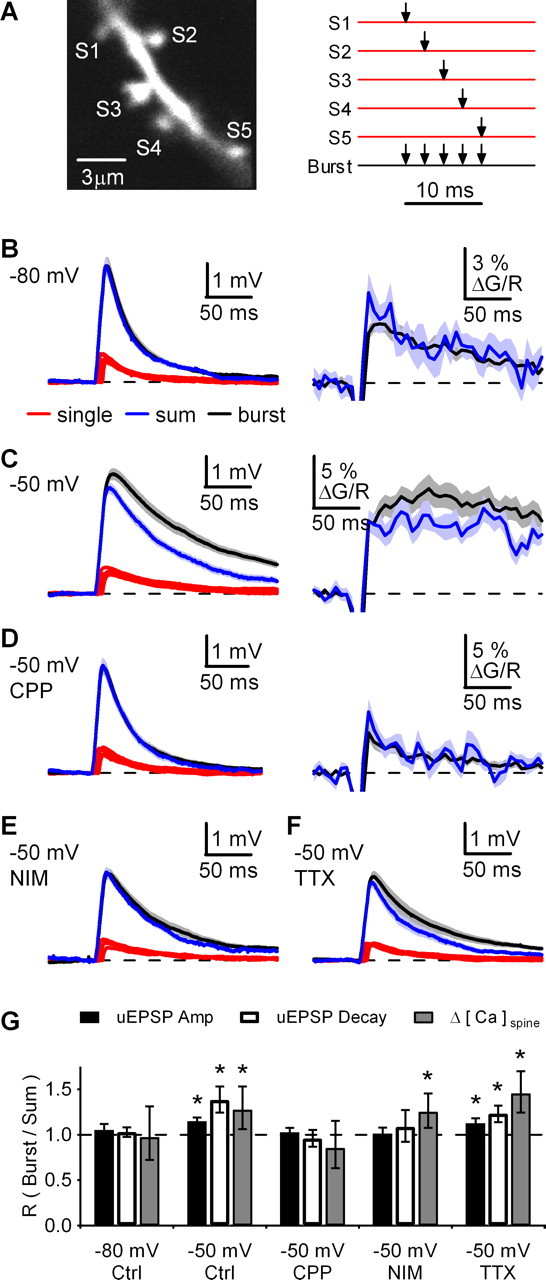
Bursts of inputs at spine clusters trigger supralinear responses. A, Left, 2PLSM image of dendrite and cluster of five spines (S1–S5). Right, Schematic showing 2PLU at each spine alone (red traces) or burst stimulation at all spines (black trace). B, Left, uEPSPs at −80 mV with an ISI of 2 ms, showing single-spine responses (red traces), the linearly predicted sum of these responses (blue trace), and burst response (black trace). Right, ΔG/Rspine measured in one of the five spines, showing the linearly predicted sum of single spine responses (blue trace) and burst response (black trace). C–F, As in B for uEPSPs and ΔG/Rspine at −50 mV (C), uEPSPs and ΔG/Rspine at −50 mV in CPP (D), uEPSPs at −50 mV in nimodipine (E), and uEPSPs at −50 mV in TTX (F). G, Ratio (R) of burst and sum for uEPSP amplitudes, uEPSP half-decay times and Δ[Ca]spine amplitudes in the indicated conditions. Summary data are shown as the geometric mean and 95% confidence interval. *p < 0.05 compared with unity.
For experiments in Figures 1–5 and supplemental Figures 1–3 (available at www.jneurosci.org as supplemental material), summary data are reported as the arithmetic mean ± SEM. For experiments in Figures 6–8 and supplemental Figure 4 (available at www.jneurosci.org as supplemental material), summary data are reported as the geometric mean and 95% confidence interval (CI). Significance was defined as p < 0.05 and determined using the single-sample t test, assuming normal or log-normal distributions, respectively. Significance was verified using the nonparametric Wilcoxon signed-ranks test, which makes no assumptions about the data distribution. The results of the parametric and nonparametric tests were generally similar, and differences were considered significant only if they judged to be so by both tests.
Results
Single excitatory synaptic inputs undergo postsynaptic depression
We analyzed synaptic integration in MSNs in acute coronal slices at a near-physiological temperature (30–32°C). We first examined the response to repetitive activity at a single input by stimulating excitatory fibers with an extracellular electrode near the external capsule and recording EPSPs in whole-cell current-clamp. Subthreshold EPSPs at a resting potential of −80 mV displayed significant depression (Fig. 1A), which we quantified as the PPR of the additional depolarization produced by the second EPSP (A2*) to the amplitude of the first EPSP (A1) (see Materials and Methods). Paired-pulse depression (PPD) was significant at a range of ISIs (n = 10 cells) and could be attributable to either changes in presynaptic glutamate release probability or postsynaptic mechanisms.
To examine postsynaptic contributions to PPD, a combination of 2PLSM and 2PLU of glutamate was used to bypass the presynaptic terminal and directly stimulate individual spines (Fig. 1B). MSNs were filled through the recording pipette with a Ca-sensitive green fluorophore (Fluo-5F) and a Ca-insensitive red fluorophore (Alexa-594). Spines were visualized with 840 nm light, glutamate was uncaged with brief (0.5 ms) pulses of 720 nm light, and uEPSPs or uEPSCs were recorded at the soma. Changes in Ca levels were measured in the spine head (Δ[Ca]spine) and quantified as changes in the ratio of green fluorescence relative to baseline red fluorescence (ΔG/Rspine).
In neurons resting at −80 mV, uEPSPs displayed significant PPD at ISI = 50 ms (PPRuEPSP = 66 ± 7%; p < 0.05; n = 6 cells, 11 spines) (Fig. 1C). Similar results were seen for the Ca signal in the stimulated spine (PPRCa = 70 ± 11%; p < 0.05), suggesting that depression happens locally at the synapse. In neurons depolarized to a near-threshold potential of −50 mV, both uEPSPs and Δ[Ca]spine also displayed significant PPD at ISI = 50 ms (PPRuEPSP = 74 ± 8%, p < 0.05; PPRCa = 74 ± 4%, p < 0.05; n = 9 cells, 13 spines) (Fig. 1D), suggesting a common mechanism at these two potentials. The quantitatively similar results seen with extracellular stimulation and 2PLU suggest that PPD may be dominated by postsynaptic mechanisms and may not necessarily reflect changes in presynaptic glutamate release probability.
Postsynaptic depression is caused by AMPAR desensitization
AMPARs contribute to both EPSPs and spine Ca signals in MSNs (Carter and Sabatini, 2004). We assessed the contribution of AMPARs to depression by blocking NMDARs with CPP (10 μm) and recording EPSCs in voltage clamp. AMPAR-mediated EPSCs at −80 mV showed prominent PPD in response to extracellular stimulation at a range of ISIs (Fig. 2A) (n = 9 cells). Two postsynaptic mechanisms can influence PPR of AMPAR-mediated EPSCs in other cell types. First, desensitization may decrease the response of AMPARs during repetitive stimulation and decrease PPR. Second, saturation of AMPARs caused by exposure to different concentrations of glutamate can mask presynaptic changes and increase PPR. Although previous studies in MSNs have highlighted changes in presynaptic glutamate release in PPD (Choi and Lovinger, 1997; Tang et al., 2001; Akopian and Walsh, 2002), the role of postsynaptic mechanisms is unknown.
The low-affinity AMPAR antagonist γ-DGG eliminates both saturation and desensitization by decreasing the probability of opening of AMPARs and reducing overlap in the populations of AMPARs activated by the first and second stimuli (Liu et al., 1999; Wadiche and Jahr, 2001; Foster et al., 2002; Wong et al., 2003; Crowley et al., 2007). γ-DGG (2.5 mm) decreased the amplitude of AMPAR-mediated EPSCs to 37 ± 3% of control (supplemental Fig. 1, available at www.jneurosci.org as supplemental material). AMPAR-mediated EPSCs also showed reduced PPD in experiments performed in γ-DGG, an effect that is inconsistent with the expected behavior of AMPARs experiencing saturation (Fig. 2A) (n = 9 cells). To independently test the contribution of desensitization, we examined PPR in the presence of cyclothiazide (CTZ), an allosteric modulator of AMPARs that eliminates desensitization (Yamada and Rothman, 1992; Patneau et al., 1993). CTZ (100 μm) increased the amplitude of AMPAR-mediated EPSCs to 240 ± 40% of control (supplemental Fig. 1, available at www.jneurosci.org as supplemental material). AMPAR-mediated EPSCs also showed reduced PPD in experiments performed in CTZ, supporting a role for desensitization (Fig. 2A) (n = 9 cells). Similar results were found by measuring PPR at ISI = 50 ms during wash-in of either γ-DGG (n = 9 cells) or CTZ (n = 4 cells) (supplemental Fig. 1, available at www.jneurosci.org as supplemental material). However, interpreting the effects of CTZ is complicated by possible presynaptic effects of this drug on presynaptic glutamate release (Diamond and Jahr, 1995).
To confirm desensitization of AMPARs during paired stimulation, we used 2PLU to bypass the presynaptic terminal and activate AMPARs at individual spines. AMPAR-mediated uEPSCs and Δ[Ca]spine displayed prominent PPD at ISI = 50 ms (PPRuEPSC = 60 ± 3%, p < 0.05; PPRCa = 65 ± 8%, p < 0.05; n = 7 cells, 7 spines) (Fig. 2B). Unfortunately, we were unable to resolve AMPAR-mediated uEPSCs and Δ[Ca]spine in the presence of γ-DGG because of the significant reduction of AMPAR opening and the small size of the single spine signals. However, using 2PLU enabled us to unambiguously assess the influence of AMPAR desensitization with CTZ. AMPAR-mediated uEPSCs and Δ[Ca]spine showed linear summation at ISI = 50 ms in experiments performed in CTZ (PPRuEPSC = 96 ± 7%; PPRCa = 110 ± 10%; n = 7 cells, 11 spines) (Fig. 2C), suggesting that desensitization of AMPARs accounts for most of the PPD at these synapses.
The kinetics of AMPAR-mediated uEPSCs generated by 2PLU mimic those of spontaneous, miniature EPSCs in MSNs (Carter and Sabatini, 2004). However, the time course of the glutamate signal generated by 2PLU could differ from that generated by vesicular release and might enhance desensitization of AMPARs. We performed two experiments to confirm that uncaging and synaptic simulation probe a common set of receptors and share a common mechanism of PPD. First, we measured PPD of AMPAR-mediated uEPSCs while varying the strength of the first uncaging pulse. The amount of PPD depended on the number of AMPARs activated by the first uncaging pulse, indicating that repeated uncaging probes the same set of receptors (supplemental Fig. 2, available at www.jneurosci.org as supplemental material). Second, we combined extracellular stimulation with 2PLU to confirm that uncaging activates the same set of receptors that are desensitized by endogenous release of glutamate (Fig. 3). Extracellular stimulation near a spine of interest generated an AMPAR-mediated EPSC at the soma and Ca signal in that spine, but not the neighboring dendrite (Fig. 3A). Pairing with 2PLU at that spine generated a response comprised of the EPSC and uEPSC (Fig. 3B). Subtracting the EPSC revealed PPD of the uEPSC amplitude following vesicular release (56 ± 8% of control; n = 9 cells, 10 spines). These results indicate that extracellular stimulation and 2PLU activate a similar population of receptors and generate comparable levels of depression.
NMDAR-mediated synaptic responses summate linearly
NMDARs make large contributions to spine Ca signals in MSNs (Carter and Sabatini, 2004), which can be important for the induction of synaptic plasticity (Calabresi et al., 1992a). We examined NMDAR responses during repetitive activity in voltage-clamp recordings while blocking AMPARs with NBQX (10 μm). In response to extracellular stimulation, NMDAR-mediated EPSCs at −50 mV showed no PPD at ISIs <200 ms, and instead displayed a small amount of paired-pulse facilitation (PPF) (Fig. 4A) (n = 9 cells). Previous results suggest that activation of L-type Ca channels can boost NMDAR responses in MSNs (Akopian and Walsh, 2002) and trigger plasticity (Calabresi et al., 1994; Kreitzer and Malenka, 2005), even during voltage-clamp recordings. However, PPF was not altered in experiments conducted in nimodipine (20 μm) to block L-type Ca channels (Fig. 4A) (n = 6 cells). In contrast, PPF was reduced in experiments performed in CTZ (100 μm) (Fig. 4A) (n = 6 cells), further suggesting presynaptic effects of this drug on glutamate release at this synapse. As a complementary approach, we used 2PLU to assess the response of postsynaptic NMDARs at the spine during repetitive activity. NMDAR-mediated uEPSCs and Δ[Ca]spine summated linearly at ISI = 50 ms (PPRuEPSC = 101 ± 21%; PPRCa = 98 ± 10%; n = 4 cells, 6 spines) (Fig. 4B), indicating that these receptors are not saturated or desensitized. These results suggest that extracellular stimulation elicits presynaptic facilitation of glutamate release that is normally masked by desensitization of AMPARs.
Minimal interactions occur between distributed synaptic inputs
MSNs receive inputs from many cortical and thalamic neurons, each making only a few synapses on a given MSN (Cowan and Wilson, 1994; Wilson, 2003). Because single inputs summate sublinearly during repetitive activity, integration of multiple inputs may be needed to generate a large depolarization. We initially examined interactions between excitatory inputs by delivering stimuli through two electrodes placed near the external capsule and separated by >100 μm (Fig. 5A), which activates a small number of spines distributed across the dendritic tree. In response to asynchronous pairing at −80 mV, EPSPs summated linearly over a wide range of ISIs, with a small sublinearity at ISI = 2 ms (Fig. 5B). These results suggest that synapses that are located far from each other on the dendrite function independently. However, local interactions between nearby spines may not be revealed with this approach.
Asynchronous synaptic inputs at neighboring spines do not interact
Although theoretical work has described a variety of possible interactions between activation of synapses on nearby spines, the inability to activate synapses in a controlled spatial arrangement has made it difficult to study how synaptic integration depends on synapse arrangement in neurons. We used 2PLSM and 2PLU to directly examine these interactions by activating spines on the same dendritic branch (Fig. 6) and monitoring the effects on uEPSPs recorded at the soma and Ca transients measured in each spine. In control experiments, the activation of both AMPARs and NMDARs steeply decreased as the site of uncaging was moved away from the spine, demonstrating that nearby spines can be independently stimulated with this approach (supplemental Fig. 3, available at www.jneurosci.org as supplemental material). To assess the influence of one spine on another, we selected neighboring spines in the same focal plane and activated each spine alone (S1 and S2) or as a pair (S1→S2 and S2→S1) (Fig. 6A). For our analysis, we considered interactions between asynchronous (ISI = 50 ms) and synchronous (ISI = 2 ms) inputs at spines separated by 3–10 μm.
Asynchronous pairing had no affect on uEPSPs recorded at −80 mV, as quantified by the ratio of the uEPSP amplitude with (A2*) and without (A1) pairing (RuEPSP = 95%; CI = 86–105; n = 7 cells, 18 spines) (Fig. 6B,D) (see Materials and Methods). Similarly, asynchronous pairing had no influence on Δ[Ca]S1, as quantified by the ratio of the amplitude of the Ca transient in the spine with (A2*) and without (A1) pairing (see Materials and Methods). Thus, Δ[Ca]S1 was not altered when S1 activation either preceded (RCa (S1→S2) = 94%; CI = 80–111) or followed (RCa (S2→S1) = 92%, CI = 84–100) activation of S2. Similar results were found at −50 mV for both uEPSPs (RuEPSP = 97%, CI = 83–113; n = 9 cells, 20 spines) and Δ[Ca]S1 (RCa (S1→S2) = 103%, CI = 97–109; RCa (S2→S1) = 100%, CI = 93–108) (Fig. 6C,D). These results suggest that no interactions occur between spines during asynchronous activation, even when neighboring spines are separated by only a few microns.
Nonlinear interactions between synchronous inputs at neighboring spines
Interactions between spines may occur with synchronous synaptic inputs, which likely lead to larger changes in local membrane potential and conductance. Synchronous pairing had no influence on uEPSPs and Δ[Ca]S1 at −80 mV (RuEPSP = 101%, CI = 89–115; RCa (S1→S2) = 98%, CI = 89–107; RCa (S2→S1) = 104%, CI = 94–114; n = 5 cells, 14 spines) (Fig. 7A,F). However, synchronous pairing significantly boosted uEPSPs at −50 mV (RuEPSP = 112%; CI = 104–120, p < 0.05; n = 9 cells, 20 spines) (Fig. 7B,F). Local Ca signals in spines were also significantly boosted at −50 mV, with no dependence on the order of stimulation (RCa (S1→S2) = 114%, CI = 107–121, p < 0.05; RCa (S2→S1) = 114%, CI = 109–120, p < 0.05). These results demonstrate that interactions can occur between neighboring spines, but only for temporally coincident inputs at membrane potentials near threshold for action potentials.
The influence of synchronous pairing on synaptic responses may depend on differential activation of glutamate receptors at depolarized potentials. We assessed the involvement of NMDARs in these interactions by blocking these receptors with CPP. Synchronous pairing had no influence on AMPAR-mediated uEPSPs at −50 mV (RuEPSP = 91%; CI = 79–104; n = 9 cells, 24 spines) (Fig. 7C,F), indicating that NMDAR activation is required to boost responses. Whereas spine Ca signals were also unaffected when activation of S2 followed S1 (RCa (S1→S2) = 90%; CI = 75–106), these signal were depressed when activation of S2 preceded S1 (RCa (S2→S1) = 84%; CI = 75–96; p < 0.05), indicating that NMDAR activation may mask a sublinear summation of AMPAR-mediated responses. Similar results were found for AMPAR-mediated responses at −80 mV (RuEPSP = 93%, CI = 84–103; RCa (S1→S2) = 87%, CI = 72–105; RCa (S2→S1) = 79%, CI = 69–91; p < 0.05; n = 9 cells, 20 spines) (Fig. 7D,F).
If interactions between neighboring spines depend on local changes in membrane potential and conductance, they may be enhanced when AMPAR-mediated responses are amplified with CTZ (100 μm). AMPAR-mediated uEPSPs were significantly reduced by pairing at −80 mV in experiments performed in CTZ (RuEPSP = 80%; CI = 68–93; p < 0.05; n = 9 cells, 20 spines). Moreover, Δ[Ca]spine was reduced by synchronous activity, although the dependence on the order of stimulation was lost (RCa (S1→S2) = 88%, CI = 81–97, p < 0.05; RCa (S2→S1) = 86%, CI = 77–95, p < 0.05) (Fig. 7E,F). Together, these results indicate neighboring spines can interact, with local changes in membrane potential or conductance generating nonlinear summation of synaptic inputs.
Clusters of spines interact during synchronous bursts of synaptic activity
In hippocampal pyramidal neurons, synchronous activation of multiple inputs enhances local interactions between spines that boost uEPSPs and dendritic Ca signals (Gasparini and Magee, 2006; Losonczy and Magee, 2006). To test whether this occurs in MSNs, we identified a cluster of five spines within the same focal plane along a small stretch of dendrite, and used 2PLU to activate either individual spines (S1–S5) or the entire cluster of spines with a burst of activity at ISI = 2 ms (Fig. 8A). We quantified our results as the ratio of the burst response to the linearly predicted sum response (see Materials and Methods). In control experiments, the burst response did not result in glutamate spillover, as the activation of both AMPARs and NMDARs showed linear summation in voltage-clamp recordings (supplemental Fig. 4, available at www.jneurosci.org as supplemental material). uEPSPs at −80 mV summated linearly during bursts and neither the amplitude (RuEPSP(A) = 105%; CI = 98–112; n = 19 cells) nor half-decay time (RuEPSP(D) = 103%; CI = 98–108) was different from the linear prediction (Fig. 8B,G). In a subset of experiments, Δ[Ca]spine was measured in one of the five spines and found to summate linearly during bursts (RCa = 97%; CI = 72–131; n = 9 cells). In contrast, uEPSPs were both amplified and prolonged at −50 mV (RuEPSP(A) = 115%, CI = 111–119, p < 0.05; RuEPSP(D) = 138%, CI = 124–153, p < 0.05; n = 23 cells) and Δ[Ca]spine also summated supralinearly (RCa = 127%; CI = 106–153; p < 0.05; n = 10 cells) (Fig. 8C,G).
The enhancement of synaptic responses with synchronous activity at depolarized potentials could be caused by activation of multiple voltage-sensitive receptors and ion channels. Blocking NMDARs with CPP (10 μm) abolished the boosting of both uEPSPs (RuEPSP(A) = 102%, CI = 98–107; RuEPSP(D) = 96%, CI = 87–106; n = 19 cells) and Δ[Ca]spine (RCa = 85%; CI = 63–115; n = 10 cells) (Fig. 8D,G). Previous results indicate that L-type Ca channels are located at dendritic spines (Olson et al., 2005) and can shape EPSPs and sustained depolarizations (Cepeda et al., 1998; Akopian and Walsh, 2002; Vergara et al., 2003). Blocking L-type Ca channels with nimodipine (20 μm) also reduced boosting of uEPSPs (RuEPSP(A) = 101%, CI = 95–108; RuEPSP(D) = 108%, CI = 92–127; n = 16 cells), but had no effect on Δ[Ca]spine (RCa = 125%; CI = 108–146; p < 0.05; n = 15 cells) (Fig. 8E,G). In contrast, blocking voltage-sensitive Na channels with TTX (1 μm) did not block boosting of uEPSPs (RuEPSP(A) = 113%, CI = 107–118, p < 0.05; RuEPSP(D) = 118%, CI = 103–134, p < 0.05; n = 20 cells) or Δ[Ca]spine (RCa = 146%; CI = 125–170; p < 0.05; n = 9 cells) (Fig. 8F,G). These results indicate that activation of both NMDARs and L-type Ca channels is required for supralinear summation of uEPSPs, but only NMDARs are necessary to enhance spine Ca signals during synchronous activity.
Discussion
Here we examined how individual MSNs integrate different temporal and spatial patterns of synaptic activity at their dendrites. Using a combination of whole-cell recordings, two-photon laser scanning microscopy, two-photon laser uncaging of glutamate, and selective pharmacology, we were able to separate presynaptic and postsynaptic factors that influence synaptic integration. We found that repetitive activity at individual spines generates sublinearly summating signals caused by AMPAR desensitization. In contrast, synchronous activity at nearby spines can evoke supralinearly summating electrical and Ca signals caused by activation of NMDARs and L-type Ca channels. Synaptic integration thus depends on both the distribution of synaptic inputs and the differential activation of multiple postsynaptic conductances.
Single input responses
We found that AMPAR-mediated EPSCs undergo prominent depression at MSNs. Depression was prevented by both reducing AMPAR occupancy with γ-DGG and blocking AMPAR desensitization with CTZ, in contrast to previous results (Akopian and Walsh, 2007). The residual depression at early time points in CTZ may be attributable to saturation, reflecting increased glutamate affinity and slowed deactivation kinetics of AMPARs in the presence of this drug (Yamada and Rothman, 1992; Patneau et al., 1993). The similar effects of γ-DGG and CTZ are consistent with desensitization of AMPARs (Wong et al., 2003; Crowley et al., 2007), and suggest that changes in presynaptic glutamate release probability are minimal at this synapse. PPD of uncaging-evoked EPSCs and spine-head Ca transients was similar in magnitude to that of electrically evoked EPSCs and was also eliminated by CTZ, indicating that desensitization underlies most of the PPD seen at glutamatergic synapses onto MSNs. Although desensitization is uncommon at many principal neurons (Hestrin, 1992), similar depression has been observed at other central synapses (Rozov et al., 2001; Chen et al., 2002; Xu-Friedman and Regehr, 2003). The prolonged time course of depression seen in our experiments likely reflects the slow recovery from desensitization of AMPARs in MSNs (Gotz et al., 1997; Jahn et al., 1998).
Although we consistently observed depression of AMPAR-mediated EPSCs, a wide range of PPR values have been observed previously at excitatory synapses onto MSNs. This variability may partly depend on animal age, with depression in young animals and more facilitation as animals mature over the first postnatal month (Choi and Lovinger, 1997; Tang et al., 2001). The source of synaptic input may also influence PPR, with cortical inputs showing more facilitation than thalamic inputs (Cromwell et al., 1995). PPR may also depend on the type of MSNs, with more facilitation in cells expressing D1 dopamine receptors than those expressing D2 dopamine receptors (Kreitzer and Malenka, 2007). Finally, the synaptic history may affect PPR, with increased facilitation at synapses following induction of long-term depression (Choi and Lovinger, 1997; Kreitzer and Malenka, 2005). Although changes in PPR are usually interpreted to reflect the presynaptic glutamate release probability, our results indicate that postsynaptic mechanisms also contribute in MSNs.
In contrast to AMPAR-mediated synaptic responses, we found that NMDAR-mediated EPSCs showed slight facilitation. This facilitation was not caused by activation of L-type Ca channels, in contrast to previous studies (Akopian and Walsh, 2002). Although facilitation was reduced by CTZ, this finding is consistent with presynaptic effects of this drug and a similar lack of facilitation in AMPAR-mediated EPSCs. The linear summation of NMDAR-mediated uEPSCs and spine Ca signals seen with glutamate uncaging indicates that these receptors are not saturated by the first input (Mainen et al., 1999). Therefore, although the contribution of each synapse to the synaptic potential decreases during repetitive activity, NMDARs remain open and produce large Ca transients in activated spines. This local NMDAR-mediated Ca signal may be important for the induction of synaptic plasticity in these neurons (Calabresi et al., 1992a).
Paired spine responses
MSNs possess thousands of spines distributed over their dendrites, each receiving an excitatory synaptic input (Cowan and Wilson, 1994; Wilson, 2003). Using extracellular stimulation, we found that these inputs summate linearly over a wide range of interstimulus intervals. However, this approach cannot be used to selectively activate nearby inputs and assess local interactions between spines. Using 2PLU, we selectively activated spines along the dendrites and found that nearby inputs can interact in a variety of ways. Minimal interactions occur during asynchronous activity, with linear summation of somatic uEPSPs and compartmentalization of spine Ca signals. Comparable interactions occur during synchronous activity at hyperpolarized potentials where these neurons usually rest. However, synchronous activity leads to supralinear interactions at depolarized potentials near threshold for action potential firing. The shift in resting membrane potential enables activation of voltage-sensitive NMDARs, which contribute to both the electrical signals recorded at the soma and local Ca signals in the spine head. Blocking these receptors reveals a small sublinear summation of AMPAR-mediated Ca signals, likely because of a local decrease in driving force. Whether similar interactions occur at other neurons will likely depend on the types of glutamate receptors and voltage-sensitive ion channels they possess.
We have largely focused on how glutamate receptor properties shape subthreshold synaptic responses in MSNs. However, a variety of voltage-sensitive potassium channels can also influence subthreshold physiology in MSNs (Surmeier et al., 1988; Calabresi et al., 1990; Nisenbaum et al., 1994; Bargas et al., 1999). These channels may shape subthreshold synaptic responses, and may contribute to sublinear summation of uEPSPs at different resting membrane potentials. Activation of these and other voltage-sensitive conductances may be enhanced with larger membrane potential changes generated during more complex patterns of synaptic activity.
Comparison with dendritic integration in pyramidal neurons
Dendritic integration has been extensively examined in cortical and hippocampal pyramidal neurons but only minimally in other cell types. In pyramidal neurons, both linear and nonlinear modes of synaptic interaction have been described (Margulis and Tang, 1998; Urban et al., 1998; Cash and Yuste, 1999; Nettleton and Spain, 2000; Tamas et al., 2002). Strong dendritic stimulation with one-photon uncaging of glutamate activates multiple spines over a small stretch of dendrite and generates local Ca spikes because of activation of NMDARs and voltage-sensitive conductances (Schiller et al., 2000; Wei et al., 2001; Cai et al., 2004). Similarly, two independent input pathways converging on the same stretch of dendrite can locally interact to generate supralinear but saturating responses (Polsky et al., 2004). Supralinear summation can also be achieved using synchronous stimulation of ∼20 nearby inputs on thin apical dendrites by two-photon uncaging of glutamate (Gasparini and Magee, 2006; Losonczy and Magee, 2006). In these studies, dendritic spikes are generated that depend on voltage-sensitive Na channels and are shaped by NMDARs and other voltage-sensitive ion channels.
We find that synchronous activity at clustered spines leads to supralinear summation of synaptic responses in MSNs at depolarized membrane potentials. The supralinear summation of uEPSPs may involve a local depolarizing feedback loop, in which activation of AMPARs provides the initial depolarization to activate NMDARs and L-type Ca channels. However, unlike hippocampal pyramidal neurons, this depolarizing feedback loop neither depends on voltage-sensitive Na channels nor involves dendritic spikes. The supralinear summation of spine Ca signals in MSNs may reflect additional Ca influx into spines through NMDARs because of relief of Mg block. This enhanced Ca signal could activate intracellular signaling pathways and may be important for the induction of synaptic plasticity (Calabresi et al., 1992a).
Significance for striatal function
In mature animals, excitatory synaptic inputs drive state transitions and fire action potentials to enable MSN and striatal function (Wilson and Kawaguchi, 1996; Stern et al., 1997). We focused our analysis on young animals, in which synaptic plasticity has been extensively studied and shown to depend on the postsynaptic membrane potential. We found that AMPAR desensitization prevents a single input from generating large changes in membrane potential. Instead, multiple inputs must be integrated, which likely derive from different areas and represent unique types of information (Kincaid et al., 1998; Zheng and Wilson, 2002; Alloway et al., 2006). Similar synaptic integration is likely to be important in the ventral striatum, where multiple types of inputs are also processed (O'Donnell and Grace, 1995; Mulder et al., 1998). Thus, MSNs are fundamentally integrative neurons that are acutely sensitive to the spatial and temporal distribution of synaptic activity they receive at spines distributed across their dendrites.
Footnotes
This work was supported by the Hereditary Disease Foundation (A.G.C.), the National Institute of Neurological Disorders and Stroke (NINDS) Grant F31 NS049655-01, the Quan Fellowship (G.J.S.-L.), NINDS Grant RO1 NS046579-01A, and the McKnight Foundation (B.L.S.). We declare that we have no financial conflicts of interests. We thank Michael Beierlein and members of the Sabatini lab for helpful discussions and comments on this manuscript.
References
- Akopian G, Walsh JP. Corticostriatal paired-pulse potentiation produced by voltage-dependent activation of NMDA receptors and L-type Ca2+ channels. J Neurophysiol. 2002;87:157–165. doi: 10.1152/jn.00115.2001. [DOI] [PubMed] [Google Scholar]
- Akopian G, Walsh JP. Reliable long-lasting depression interacts with variable short-term facilitation to determine corticostriatal paired-pulse plasticity in young rats. J Physiol (Lond) 2007;580:225–240. doi: 10.1113/jphysiol.2006.115790. [DOI] [PMC free article] [PubMed] [Google Scholar]
- Alloway KD, Lou L, Nwabueze-Ogbo F, Chakrabarti S. Topography of cortical projections to the dorsolateral neostriatum in rats: multiple overlapping sensorimotor pathways. J Comp Neurol. 2006;499:33–48. doi: 10.1002/cne.21039. [DOI] [PubMed] [Google Scholar]
- Bargas J, Ayala GX, Vilchis C, Pineda JC, Galarraga E. Ca2+-activated outward currents in neostriatal neurons. Neuroscience. 1999;88:479–488. doi: 10.1016/s0306-4522(98)00211-5. [DOI] [PubMed] [Google Scholar]
- Cai X, Liang CW, Muralidharan S, Kao JP, Tang CM, Thompson SM. Unique roles of SK and Kv4.2 potassium channels in dendritic integration. Neuron. 2004;44:351–364. doi: 10.1016/j.neuron.2004.09.026. [DOI] [PubMed] [Google Scholar]
- Calabresi P, Mercuri NB, Bernardi G. Synaptic and intrinsic control of membrane excitability of neostriatal neurons. II. An in vitro analysis. J Neurophysiol. 1990;63:663–675. doi: 10.1152/jn.1990.63.4.663. [DOI] [PubMed] [Google Scholar]
- Calabresi P, Pisani A, Mercuri NB, Bernardi G. Long-term potentiation in the striatum is unmasked by removing the voltage-dependent magnesium block of NMDA receptor channels. Eur J Neurosci. 1992a;4:929–935. doi: 10.1111/j.1460-9568.1992.tb00119.x. [DOI] [PubMed] [Google Scholar]
- Calabresi P, Maj R, Pisani A, Mercuri NB, Bernardi G. Long-term synaptic depression in the striatum: physiological and pharmacological characterization. J Neurosci. 1992b;12:4224–4233. doi: 10.1523/JNEUROSCI.12-11-04224.1992. [DOI] [PMC free article] [PubMed] [Google Scholar]
- Calabresi P, Pisani A, Mercuri NB, Bernardi G. Post-receptor mechanisms underlying striatal long-term depression. J Neurosci. 1994;14:4871–4881. doi: 10.1523/JNEUROSCI.14-08-04871.1994. [DOI] [PMC free article] [PubMed] [Google Scholar]
- Carter AG, Sabatini BL. State-dependent calcium signaling in dendritic spines of striatal medium spiny neurons. Neuron. 2004;44:483–493. doi: 10.1016/j.neuron.2004.10.013. [DOI] [PubMed] [Google Scholar]
- Cash S, Yuste R. Linear summation of excitatory inputs by CA1 pyramidal neurons. Neuron. 1999;22:383–394. doi: 10.1016/s0896-6273(00)81098-3. [DOI] [PubMed] [Google Scholar]
- Cepeda C, Colwell CS, Itri JN, Chandler SH, Levine MS. Dopaminergic modulation of NMDA-induced whole cell currents in neostriatal neurons in slices: contribution of calcium conductances. J Neurophysiol. 1998;79:82–94. doi: 10.1152/jn.1998.79.1.82. [DOI] [PubMed] [Google Scholar]
- Chen C, Blitz DM, Regehr WG. Contributions of receptor desensitization and saturation to plasticity at the retinogeniculate synapse. Neuron. 2002;33:779–788. doi: 10.1016/s0896-6273(02)00611-6. [DOI] [PubMed] [Google Scholar]
- Choi S, Lovinger DM. Decreased probability of neurotransmitter release underlies striatal long-term depression and postnatal development of corticostriatal synapses. Proc Natl Acad Sci USA. 1997;94:2665–2670. doi: 10.1073/pnas.94.6.2665. [DOI] [PMC free article] [PubMed] [Google Scholar]
- Cowan RL, Wilson CJ. Spontaneous firing patterns and axonal projections of single corticostriatal neurons in the rat medial agranular cortex. J Neurophysiol. 1994;71:17–32. doi: 10.1152/jn.1994.71.1.17. [DOI] [PubMed] [Google Scholar]
- Cromwell HC, Buchwald NA, Levine MS. Decortication decreases paired-pulse facilitation in the neostriatal slice of the rat. Neurosci Lett. 1995;192:213–217. doi: 10.1016/0304-3940(95)11633-8. [DOI] [PubMed] [Google Scholar]
- Crowley JJ, Carter AG, Regehr WG. Fast vesicle replenishment and rapid recovery from desensitization at a single synaptic release site. J Neurosci. 2007;27:5448–5460. doi: 10.1523/JNEUROSCI.1186-07.2007. [DOI] [PMC free article] [PubMed] [Google Scholar]
- Diamond JS, Jahr CE. Asynchronous release of synaptic vesicles determines the time course of the AMPA receptor-mediated EPSC. Neuron. 1995;15:1097–1107. doi: 10.1016/0896-6273(95)90098-5. [DOI] [PubMed] [Google Scholar]
- Foster KA, Kreitzer AC, Regehr WG. Interaction of postsynaptic receptor saturation with presynaptic mechanisms produces a reliable synapse. Neuron. 2002;36:1115–1126. doi: 10.1016/s0896-6273(02)01106-6. [DOI] [PubMed] [Google Scholar]
- Gasparini S, Magee JC. State-dependent dendritic computation in hippocampal CA1 pyramidal neurons. J Neurosci. 2006;26:2088–2100. doi: 10.1523/JNEUROSCI.4428-05.2006. [DOI] [PMC free article] [PubMed] [Google Scholar]
- Gotz T, Kraushaar U, Geiger J, Lubke J, Berger T, Jonas P. Functional properties of AMPA and NMDA receptors expressed in identified types of basal ganglia neurons. J Neurosci. 1997;17:204–215. doi: 10.1523/JNEUROSCI.17-01-00204.1997. [DOI] [PMC free article] [PubMed] [Google Scholar]
- Hestrin S. Activation and desensitization of glutamate-activated channels mediating fast excitatory synaptic currents in the visual cortex. Neuron. 1992;9:991–999. doi: 10.1016/0896-6273(92)90250-h. [DOI] [PubMed] [Google Scholar]
- Jahn K, Bufler J, Franke C. Kinetics of AMPA-type glutamate receptor channels in rat caudate-putamen neurones show a wide range of desensitization but distinct recovery characteristics. Eur J Neurosci. 1998;10:664–672. doi: 10.1046/j.1460-9568.1998.00080.x. [DOI] [PubMed] [Google Scholar]
- Kawaguchi Y, Wilson CJ, Emson PC. Intracellular recording of identified neostriatal patch and matrix spiny cells in a slice preparation preserving cortical inputs. J Neurophysiol. 1989;62:1052–1068. doi: 10.1152/jn.1989.62.5.1052. [DOI] [PubMed] [Google Scholar]
- Kincaid AE, Zheng T, Wilson CJ. Connectivity and convergence of single corticostriatal axons. J Neurosci. 1998;18:4722–4731. doi: 10.1523/JNEUROSCI.18-12-04722.1998. [DOI] [PMC free article] [PubMed] [Google Scholar]
- Kreitzer AC, Malenka RC. Dopamine modulation of state-dependent endocannabinoid release and long-term depression in the striatum. J Neurosci. 2005;25:10537–10545. doi: 10.1523/JNEUROSCI.2959-05.2005. [DOI] [PMC free article] [PubMed] [Google Scholar]
- Kreitzer AC, Malenka RC. Endocannabinoid-mediated rescue of striatal LTD and motor deficits in Parkinson's disease models. Nature. 2007;445:643–647. doi: 10.1038/nature05506. [DOI] [PubMed] [Google Scholar]
- Liu G, Choi S, Tsien RW. Variability of neurotransmitter concentration and nonsaturation of postsynaptic AMPA receptors at synapses in hippocampal cultures and slices. Neuron. 1999;22:395–409. doi: 10.1016/s0896-6273(00)81099-5. [DOI] [PubMed] [Google Scholar]
- Losonczy A, Magee JC. Integrative properties of radial oblique dendrites in hippocampal CA1 pyramidal neurons. Neuron. 2006;50:291–307. doi: 10.1016/j.neuron.2006.03.016. [DOI] [PubMed] [Google Scholar]
- Mainen ZF, Malinow R, Svoboda K. Synaptic calcium transients in single spines indicate that NMDA receptors are not saturated. Nature. 1999;399:151–155. doi: 10.1038/20187. [DOI] [PubMed] [Google Scholar]
- Margulis M, Tang CM. Temporal integration can readily switch between sublinear and supralinear summation. J Neurophysiol. 1998;79:2809–2813. doi: 10.1152/jn.1998.79.5.2809. [DOI] [PubMed] [Google Scholar]
- Mulder AB, Hodenpijl MG, Lopes da Silva FH. Electrophysiology of the hippocampal and amygdaloid projections to the nucleus accumbens of the rat: convergence, segregation, and interaction of inputs. J Neurosci. 1998;18:5095–5102. doi: 10.1523/JNEUROSCI.18-13-05095.1998. [DOI] [PMC free article] [PubMed] [Google Scholar]
- Nettleton JS, Spain WJ. Linear to supralinear summation of AMPA-mediated EPSPs in neocortical pyramidal neurons. J Neurophysiol. 2000;83:3310–3322. doi: 10.1152/jn.2000.83.6.3310. [DOI] [PubMed] [Google Scholar]
- Nisenbaum ES, Xu ZC, Wilson CJ. Contribution of a slowly inactivating potassium current to the transition to firing of neostriatal spiny projection neurons. J Neurophysiol. 1994;71:1174–1189. doi: 10.1152/jn.1994.71.3.1174. [DOI] [PubMed] [Google Scholar]
- O'Donnell P, Grace AA. Synaptic interactions among excitatory afferents to nucleus accumbens neurons: hippocampal gating of prefrontal cortical input. J Neurosci. 1995;15:3622–3639. doi: 10.1523/JNEUROSCI.15-05-03622.1995. [DOI] [PMC free article] [PubMed] [Google Scholar]
- Oertner TG, Sabatini BL, Nimchinsky EA, Svoboda K. Facilitation at single synapses probed with optical quantal analysis. Nat Neurosci. 2002;5:657–664. doi: 10.1038/nn867. [DOI] [PubMed] [Google Scholar]
- Olson PA, Tkatch T, Hernandez-Lopez S, Ulrich S, Ilijic E, Mugnaini E, Zhang H, Bezprozvanny I, Surmeier DJ. G-protein-coupled receptor modulation of striatal CaV1.3 L-type Ca2+ channels is dependent on a Shank-binding domain. J Neurosci. 2005;25:1050–1062. doi: 10.1523/JNEUROSCI.3327-04.2005. [DOI] [PMC free article] [PubMed] [Google Scholar]
- Patneau DK, Vyklicky L, Jr, Mayer ML. Hippocampal neurons exhibit cyclothiazide-sensitive rapidly desensitizing responses to kainate. J Neurosci. 1993;13:3496–3509. doi: 10.1523/JNEUROSCI.13-08-03496.1993. [DOI] [PMC free article] [PubMed] [Google Scholar]
- Pologruto TA, Sabatini BL, Svoboda K. ScanImage: flexible software for operating laser scanning microscopes. Biomed Eng Online. 2003;2:13. doi: 10.1186/1475-925X-2-13. [DOI] [PMC free article] [PubMed] [Google Scholar]
- Polsky A, Mel BW, Schiller J. Computational subunits in thin dendrites of pyramidal cells. Nat Neurosci. 2004;7:621–627. doi: 10.1038/nn1253. [DOI] [PubMed] [Google Scholar]
- Rozov A, Jerecic J, Sakmann B, Burnashev N. AMPA receptor channels with long-lasting desensitization in bipolar interneurons contribute to synaptic depression in a novel feedback circuit in layer 2/3 of rat neocortex. J Neurosci. 2001;21:8062–8071. doi: 10.1523/JNEUROSCI.21-20-08062.2001. [DOI] [PMC free article] [PubMed] [Google Scholar]
- Sabatini BL, Oertner TG, Svoboda K. The life cycle of Ca2+ ions in dendritic spines. Neuron. 2002;33:439–452. doi: 10.1016/s0896-6273(02)00573-1. [DOI] [PubMed] [Google Scholar]
- Schiller J, Major G, Koester HJ, Schiller Y. NMDA spikes in basal dendrites of cortical pyramidal neurons. Nature. 2000;404:285–289. doi: 10.1038/35005094. [DOI] [PubMed] [Google Scholar]
- Stern EA, Kincaid AE, Wilson CJ. Spontaneous subthreshold membrane potential fluctuations and action potential variability of rat corticostriatal and striatal neurons in vivo. J Neurophysiol. 1997;77:1697–1715. doi: 10.1152/jn.1997.77.4.1697. [DOI] [PubMed] [Google Scholar]
- Surmeier DJ, Bargas J, Kitai ST. Voltage-clamp analysis of a transient potassium current in rat neostriatal neurons. Brain Res. 1988;473:187–192. doi: 10.1016/0006-8993(88)90334-4. [DOI] [PubMed] [Google Scholar]
- Tamas G, Szabadics J, Somogyi P. Cell type- and subcellular position-dependent summation of unitary postsynaptic potentials in neocortical neurons. J Neurosci. 2002;22:740–747. doi: 10.1523/JNEUROSCI.22-03-00740.2002. [DOI] [PMC free article] [PubMed] [Google Scholar]
- Tang K, Low MJ, Grandy DK, Lovinger DM. Dopamine-dependent synaptic plasticity in striatum during in vivo development. Proc Natl Acad Sci USA. 2001;98:1255–1260. doi: 10.1073/pnas.031374698. [DOI] [PMC free article] [PubMed] [Google Scholar]
- Tepper JM, Sharpe NA, Koos TZ, Trent F. Postnatal development of the rat neostriatum: electrophysiological, light- and electron-microscopic studies. Dev Neurosci. 1998;20:125–145. doi: 10.1159/000017308. [DOI] [PubMed] [Google Scholar]
- Urban NN, Barrionuevo G. Active summation of excitatory postsynaptic potentials in hippocampal CA3 pyramidal neurons. Proc Natl Acad Sci USA. 1998;95:11450–11455. doi: 10.1073/pnas.95.19.11450. [DOI] [PMC free article] [PubMed] [Google Scholar]
- Urban NN, Henze DA, Barrionuevo G. Amplification of perforant-path EPSPs in CA3 pyramidal cells by LVA calcium and sodium channels. J Neurophysiol. 1998;80:1558–1561. doi: 10.1152/jn.1998.80.3.1558. [DOI] [PubMed] [Google Scholar]
- Vergara R, Rick C, Hernandez-Lopez S, Laville JA, Guzman JN, Galarraga E, Surmeier DJ, Bargas J. Spontaneous voltage oscillations in striatal projection neurons in a rat corticostriatal slice. J Physiol (Lond) 2003;553:169–182. doi: 10.1113/jphysiol.2003.050799. [DOI] [PMC free article] [PubMed] [Google Scholar]
- Wadiche JI, Jahr CE. Multivesicular release at climbing fiber-Purkinje cell synapses. Neuron. 2001;32:301–313. doi: 10.1016/s0896-6273(01)00488-3. [DOI] [PubMed] [Google Scholar]
- Wei DS, Mei YA, Bagal A, Kao JP, Thompson SM, Tang CM. Compartmentalized and binary behavior of terminal dendrites in hippocampal pyramidal neurons. Science. 2001;293:2272–2275. doi: 10.1126/science.1061198. [DOI] [PubMed] [Google Scholar]
- Wilson CJ. Basal ganglia. In: Shepherd GM, editor. The synaptic organization of the brain. Ed 5. New York: Oxford UP; 2003. [Google Scholar]
- Wilson CJ, Kawaguchi Y. The origins of two-state spontaneous membrane potential fluctuations of neostriatal spiny neurons. J Neurosci. 1996;16:2397–2410. doi: 10.1523/JNEUROSCI.16-07-02397.1996. [DOI] [PMC free article] [PubMed] [Google Scholar]
- Wong AY, Graham BP, Billups B, Forsythe ID. Distinguishing between presynaptic and postsynaptic mechanisms of short-term depression during action potential trains. J Neurosci. 2003;23:4868–4877. doi: 10.1523/JNEUROSCI.23-12-04868.2003. [DOI] [PMC free article] [PubMed] [Google Scholar]
- Xu-Friedman MA, Regehr WG. Ultrastructural contributions to desensitization at cerebellar mossy fiber to granule cell synapses. J Neurosci. 2003;23:2182–2192. doi: 10.1523/JNEUROSCI.23-06-02182.2003. [DOI] [PMC free article] [PubMed] [Google Scholar]
- Yamada KA, Rothman SM. Diazoxide blocks glutamate desensitization and prolongs excitatory postsynaptic currents in rat hippocampal neurons. J Physiol (Lond) 1992;458:409–423. doi: 10.1113/jphysiol.1992.sp019424. [DOI] [PMC free article] [PubMed] [Google Scholar]
- Zheng T, Wilson CJ. Corticostriatal combinatorics: the implications of corticostriatal axonal arborizations. J Neurophysiol. 2002;87:1007–1017. doi: 10.1152/jn.00519.2001. [DOI] [PubMed] [Google Scholar]