

Abstract
Axons in the CNS do not regrow after injury, whereas lesioned axons in the peripheral nervous system (PNS) regenerate. Lesioned CNS axons form characteristic swellings at their tips known as retraction bulbs, which are the nongrowing counterparts of growth cones. Although much progress has been made in identifying intracellular and molecular mechanisms that regulate growth cone locomotion and axonal elongation, a comprehensive understanding of how retraction bulbs form and why they are unable to grow is still elusive. Here we report the analysis of the morphological and intracellular responses of injured axons in the CNS compared with those in the PNS. We show that retraction bulbs of injured CNS axons increase in size over time, whereas growth cones of injured PNS axons remain constant. Retraction bulbs contain a disorganized microtubule network, whereas growth cones possess the typical bundling of microtubules. Using in vivo imaging, we find that pharmacological disruption of microtubules in growth cones transforms them into retraction bulb-like structures whose growth is inhibited. Correspondingly, microtubule destabilization of sensory neurons in cell culture induces retraction bulb formation. Conversely, microtubule stabilization prevents the formation of retraction bulbs and decreases axonal degeneration in vivo. Finally, microtubule stabilization enhances the growth capacity of CNS neurons cultured on myelin. Thus, the stability and organization of microtubules define the fate of lesioned axonal stumps to become either advancing growth cones or nongrowing retraction bulbs. Our data pinpoint microtubules as a key regulatory target for axonal regeneration.
Keywords: retraction bulb, dorsal root ganglia neurons (DRG neurons), in vivo imaging, growth cone, microtubule, regeneration
Introduction
Growth cones regulate neurite extension and sense guidance cues during development (Huber et al., 2003). After injury, the formation of a growth cone at the tip of a transected axon is a crucial step during subsequent axonal regeneration. The tips of lesioned axonal stumps located in the PNS transform into growth cones of stereotypic spiky morphology capable of sustained growth. On the contrary, lesioned CNS axons form swellings termed “retraction bulbs” at the tip of their proximal stumps, which are oval structures and lack a regenerative response (Ramon y Cajal, 1928; Li and Raisman, 1995; Hill et al., 2001). Although there is a growing interest in identifying the intrinsic mechanisms that prevent axonal regeneration in these end structures (Silver and Miller, 2004; Tom et al., 2004; Steinmetz et al., 2005), the current knowledge about retraction bulbs remains fragmentary.
Growth cones contain the machinery for movement and axonal extension consisting of a complex interplay of different intracellular events. For example, mitochondria concentrate in the tip of the growing axon to provide energy necessary for axon formation (Morris and Hollenbeck, 1993; Bradke and Dotti, 1997). Axon growth also depends on continuous membrane supply from the soma to support the surface expansion of the growing axon (Craig et al., 1995; Dai and Sheetz, 1995; Vogt et al., 1996). Notably, microtubules and their dynamic rearrangements are essential for axon outgrowth (Forscher and Smith, 1988; Sabry et al., 1991; Tanaka and Kirschner, 1991; Dent and Gertler, 2003).
Our knowledge about the intrinsic mechanisms that restrain axons from regrowing is mostly based on in vitro models, including the growth cone collapse and the stripe assays. Although such assays helped discover important repulsion signals, including Semaphorins and Ephrins (Raper and Kapfhammer, 1990; Drescher et al., 1995), they have limitations in recapitulating the morphology and intracellular mechanisms of stalled axons in vivo, e.g., after spinal cord injury. For example, in the growth cone collapse assay, growth cones retract their filopodia and lamellipodia, showing enhanced retrograde transport of varicosities, resulting in rapid thinning of the fan-like growth cone after ligand stimulation (Fan et al., 1993), which is distinct from the bulbous structure of a retraction bulb. Recently, a cell culture model that produces voluminous axonal tips reminiscent to retraction bulbs has been established using a proteoglycan–laminin gradient (Tom et al., 2004; Steinmetz et al., 2005).
However, the underlying mechanisms of retraction bulb formation and axon stalling still remain unclear. To investigate processes that malfunction in injured CNS axons and generate an obstacle for regeneration, we analyzed the intracellular structure of retraction bulbs compared with growth cones. We chose to work with dorsal root ganglia (DRG) neurons because their peripheral axonal branches form growth cones after lesioning and regenerate, whereas the central branches form retraction bulbs and do not regenerate.
Materials and Methods
Mice.
We used green fluorescent protein-M (GFP-M) and yellow fluorescent protein-H (YFP-H) transgenic mice (8–12 weeks of age; 15–30 g) expressing GFP/YFP under the control of the neuron-specific Thy-1 promoter (Feng et al., 2000). All animal experiments were performed in accordance with the animal handling laws of the government (Regierung von Oberbayern, Number 209.1/211-2531-115/02).
Dorsal column lesion and postoperative care.
The mice were anesthetized with a mixture of midazolam (Dormicum; 2 mg/kg), medetomidine (Domitor; 0.15 mg/kg), and fentanyl (0.05 mg/kg) injected intraperitoneally. The lamina at the level of T8/9 was removed by laminectomy to expose the dorsal columns at the thoracic level. Fine iridectomy scissors (FST, Heidelberg, Germany) were used to transect the dorsal columns bilaterally. The lamina was closed, and the skin was stapled. Two to three hours after surgery, animals were woken up by subcutaneous injection of a mixture of flumazenil (Antisedan; 0.2 mg/kg), atipamezole (Anexate; 0.75 mg/kg), and naloxone (Narcanti; 0.12 mg/kg). The animals were kept on a heating pad for the following 24 h. Postsurgical animal care was done as follows: the bladders were expressed every day twice; antibiotic (10 μl of 7.5% Borgal solution; Hoechst Russel Vet, Frankfurt, Germany) was given subcutaneously once daily, and buprenorphine (0.15 mg/kg) was given once every 12 h after surgery, in total three times.
Sciatic nerve lesion.
The mice were anesthetized as described above. The sciatic nerve was exposed ∼2.5 cm from the DRG cell bodies by a small incision and crushed with forceps for 10 s. The incision was sutured, and the skin was stapled. The anesthesia was reversed, and the animals were transferred to a heating pad for the following 24 h.
Perfusion and sectioning.
Animals were killed and perfused at the defined time points. In brief, animals were anesthetized with 5% chloral hydrate solution (prepared in saline) and perfused intracardially with 0.1 m PBS at a speed of 3 ml/min for 5 min, immediately followed by 4% paraformaldehyde (PFA) in PBS for 20 min for immunostainings and for 45 min for morphology analysis. The spinal cord or sciatic nerve lesion sites were carefully dissected and postfixed in 4% PFA (at room temperature for 30 min for immunostainings, at 4°C overnight for morphology analysis). The tissues were incubated in 15% sucrose at room temperature for 4 h and in 30% sucrose overnight. The tissues were embedded in optimal cutting temperature compound (Tissue-Tek; Miles, Elkhart, IN) and sectioned longitudinally by a cryostat (CM 3050; Leica, Wetzlar, Germany) at 10 μm. For size quantifications, we made either thick cryostat sections (40 μm) or whole mounts for confocal observation.
Immunohistochemistry.
The primary antibodies used were anti-glutamated (Glu)-tubulin (rabbit) at 1:500 dilution (Millipore, Billerica, MA), anti-Tyr-tubulin (rat) at 1:500 (Abcam, Cambridge, MA), and anti-golgin-160 (rabbit) at 1:200 (a gift from Dr. Francis Barr, Max Planck Institute of Biochemistry, Martinsreid, Germany). Tissue sections were washed with PBS twice for 10 min and then incubated with blocking solution containing 10% goat serum and 0.3–0.5% Triton X-100 in PBS at room temperature for 1 h, washed with PBS, and incubated with primary antibody (in blocking solution with 5% goat serum) at 4°C overnight. The sections were washed with PBS and incubated with an anti-rabbit secondary antibody Alexa 568 (Invitrogen, Eugene, OR). The sections were mounted with water-based mounting medium (Polysciences, Warrington, PA).
DRG neuron culture and nocodazole application.
Dorsal root ganglia were isolated from L4 and L5 spinal levels of adult female Sprague Dawley rats (200–250 g). Ganglia were enzymatically digested in 1% collagenase type I (Worthington Biochemical, Lakewood, NJ) for 90 min and then in 0.25% trypsin (Sigma-Aldrich, St. Louis, MO) at 37°C for 15 min. Enzymatic digestion was stopped by addition of Neurobasal medium (Invitrogen) containing 5% horse serum, and neurons were recovered by centrifugation at 500 rpm for 5 min. Dissociated neurons were cultured on laminin-coated dishes (50 μg/ml; Roche, Indianapolis, IN) in Neurobasal media complemented with B-27 supplement, l-glutamine, and penicillin-streptomycin. Cells were incubated at 37°C in a humidified atmosphere containing 5% CO2. After 48 h, cells were fixed with 4% paraformaldehyde and stained for βIII-tubulin (TuJ1; Covance, Princeton, NJ) and Glu-tubulin antibodies.
Cerebellar granule neurons culture and taxol application.
Granule neurons were isolated from the cerebellar cortex of 9-d-old rats and cultured as described previously (Hatten, 1985). Briefly, the cerebellar cortex was trypsinized, followed by trituration in a Trypsin/DNase mix (10 and 1 mg/ml, respectively) in Tyrode solution (CMF-PBS). The granule cells were suspended in Neurobasal medium (Invitrogen) complemented with B-27 supplement (Invitrogen), 10% calf serum (Invitrogen), glutamine (Invitrogen), and 1% penicillin-streptomycin (Invitrogen) and purified by preplating the cell suspension on poly-d-lysine (Sigma-Aldrich)-coated dishes. The cells were plated at 2.5 × 10⁶ per well in eight-well chamber slides [Lab-Tek (Campbell, CA) system; Nunc (Pittsburgh, PA)] coated with 1 mg/ml poly-d-lysine alone or together with myelin as outgrowth-inhibitory substrate. The myelin substrate was prepared as described previously (Neumann et al., 2002), and 1 μg of protein was dried on the poly-d-lysine-precoated dishes per well overnight.
Eighteen hours after plating, cells were fixed with 4% paraformaldehyde and immunostained with the βIII-tubulin neuronal marker (TuJ1; Covance). The longest neurite per neuron was measured in duplicates on an average of 500 cells per condition, and the results were expressed as the percentage of neurites exhibiting >60 μm length. Each experiment was repeated at least three times.
Confocal imaging.
We acquired confocal images with a Leica SP2 confocal microscope system in sequential scanning mode.
Electron microscopy.
Animals were perfused as described above by using Lewis Shute fixative (Lewis and Shute, 1969). The tissue was dissected without drying and postfixed in Lewis Shute fixative and then in osmium tetroxide. Afterward, the tissue was dehydrated and embedded in Araldite, cut by an ultramicrotome (LKB, Mt. Waverley, Australia) at 50 nm and poststained with lead citrate and uranyl acetate by an ultrastainer (LKB). Electron microscopy (EM) images of the sections were acquired using a Zeiss (Thornwood, NY) EM 10 electron microscope.
In vivo imaging.
We used an Olympus (Tokyo, Japan) SZX-12 fluorescent stereomicroscope equipped with 1× Plan Apochromat objective and 1.6× Plan Fluorite objective (Olympus). A ColorView II camera integrated to the microscope was used to capture images through Analysis FIVE software (Soft Imaging System, Münster, Germany). Animals were anesthetized as described above.
Treatment of peripheral axons in vivo.
Sciatic nerve lesion was performed as described above. After 24 h, animals were reanesthetized, and 10 μl of 330 μm nocodazole (diluted in 5% DMSO in PBS; Sigma-Aldrich) or 5% DMSO alone was applied onto the lesion site with a pipette. The injury site was closed, and animals were perfused 24 h after nocodazole or DMSO application for staining and imaging. For assessing peripheral axon growth, the animals were reanesthetized 1–2 d after lesioning, and nocodazole, taxol (10 μl of 1 μm), or DMSO was applied in the same manner. The animals were either observed for 6 h and then killed or reimaged 24 h later, depending on the experimental protocol.
Treatment of central axons in vivo.
After removing the laminas at T11/12 level, a small unilateral lesion was applied with vannas spring scissors (FST) by transecting only the superficial axons of the dorsal columns. We imaged the injury site before and after lesion by acquiring serial images. The animals were kept on a heating pad during the imaging session. Ten microliters of 1 μm taxol (diluted in saline; Sigma-Aldrich) or saline as control was applied onto the lesion site each hour, starting immediately after lesioning. The lesion sites were visualized by in vivo imaging as described above. The animals' anesthesia was boosted after 3 h. At the end of the observation period, animals were perfused and prepared for the confocal imaging as described above.
Size, distance, and length quantifications.
The size of retraction bulbs and growth cones was quantified as follows: the maximum diameter of the retraction bulb and growth cone at the tip of the axon was measured and divided by the diameter of the cylindrical shaft of the axon.
The retraction distance of taxol- and saline-treated axons to the lesion site was quantified as follows: the lesion site was outlined from the in vivo binocular images. We then measured the distance of the axonal tips to the proximal edge of the lesion.
To measure neurite length in dorsal root ganglia neurons, we took pictures from each well (80 cells per well on average) using a confocal microscope and a 10× objective. We then analyzed the data using Amira 4.1 (Mercury Computer Systems, Chelmsford, MA). The mean length has been calculated by measuring the total number of pixels in the images from which the pixels of the cell bodies have been subtracted and dividing by the average pixel number per micrometer of the axons and the total number of cell bodies in the image [total length per neuron = total number of pixels (only axons) × (pixel number per micrometer)−1 × (number of neurons)−1].
Image processing and data evaluation.
Angle deviations, numbers of vesicles and mitochondria, size of end structures, and distance to the lesion site were quantified with Analysis FIVE software. The images were assembled with Photoshop (Adobe Systems, San Jose, CA) and Canvas (ACD Systems, Miami, Florida). The diagrams were drawn with Illustrator (Adobe Systems). For the three-dimensional (3D) reconstructions, the quantification of vesicle volumes and the total length of DRG neurons after in vitro nocodazole treatment were measured using Amira 4.1. The statistical analysis was performed with Excel (Microsoft, Seattle, WA), and statistical significance (p < 0.05) was calculated using the two-tailed, unpaired t test.
Results
Morphological changes of growth cones and retraction bulbs
The peripheral axonal branches of the DRG neurons run in the PNS, where they generate growth cones and regrow after nerve injury (Fig. 1 A). In contrast, the central axonal branches coursing in the dorsal columns of the spinal cord do not regrow after damage, and the lesioned proximal axonal terminals form retraction bulbs (Fig. 1 A). To analyze the differences between retraction bulbs and growth cones in vivo, we used transgenic mice expressing GFP in a small subset of neurons, allowing a clear visualization of individual axons (Fig. 1 B–K; supplemental Fig. S1, available at www.jneurosci.org as supplemental material) (Feng et al., 2000; Kerschensteiner et al., 2005). We induced growth cone formation by lesioning the sciatic nerve, which contains the peripheral axonal branches from the lumbar 4 and 5 DRG neurons (Fig. 1 A–E; supplemental Fig. S1C–E, available at www.jneurosci.org as supplemental material). Retraction bulb formation, on the other hand, was induced by lesioning the dorsal columns at the thoracic 8 and 9 level (Fig. 1 A,F–K; supplemental Fig. S1F–H, available at www.jneurosci.org as supplemental material).
Figure 1.
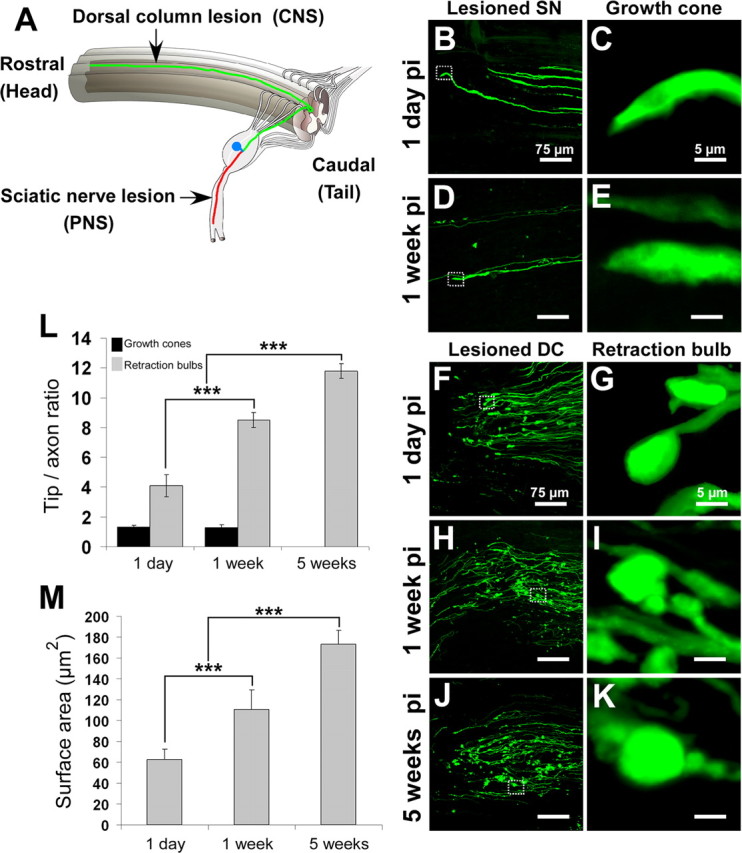
Retraction bulbs, but not growth cones, increase in size over time. GFP-M mice were anesthetized, the sciatic nerve or the dorsal columns were injured, the mice were then killed at various postinjury times, and the tissue was fixed and analyzed by confocal microscopy. A, Drawing of the spinal cord depicting the DRG neurons and their axons in the spinal cord and sciatic nerve. A representative DRG neuron is highlighted; the cell body residing in the dorsal root is shown in blue, the central branch of the axon in green, and the peripheral branch in red. The site of dorsal column transection to lesion the central axonal branches and the site of sciatic nerve crush to lesion the peripheral axonal branches are indicated by black arrows. B–E, Growth cones at 1 d (B) and 1 week (D) after sciatic nerve crush; higher magnifications of B and D are shown in C and E, respectively. F–K, Retraction bulbs at 1 d (F), 1 week (H), and 5 weeks (J) after dorsal column lesion; higher magnifications of marked areas in F, H, and J are shown in G, I, and K, respectively. Note that some of the axons possess smaller swellings on the shaft in addition to the big terminal bulbs (I, K). L, Size comparison of growth cones and retraction bulbs by tip/axonal shaft ratio. Although the sizes of retraction bulbs increase, the sizes of growth cones remain constant over time. M, Absolute size increase of retraction bulbs over time analyzed by surface area quantification. All values are average ± SD. L, M, ***p < 0.001. pi, Postinjury. Scale bars: B, D, F, H, J, 75 μm; C, E, G, I, K, 5 μm.
Peripherally axotomized DRG neurons in vivo generated a slim growth cone that remained morphologically constant over time (Fig. 1 B–E). Although growth cones of DRG neurons in cell culture have filopodia (supplemental Fig. S2, available at www.jneurosci.org as supplemental material), they rarely show such structures in vivo. The maximal width of the in vivo growth cones was comparable with the diameter of the axonal shaft: the growth cone (tip)/shaft ratio was 1.31 ± 0.14 at day 1 (Fig. 1 B,C) (n = 113 growth cones), 1.51 ± 0.15 at day 4 (n = 48 growth cones), and 1.20 ± 0.20 at 1 week after sciatic lesion (Fig. 1 D,E) [n = 21 growth cones; average ± SD; n ≥ 7 mice for each time point (Fig. 1 L)]. Later time points were difficult to visualize because of the high velocity of axonal regeneration in the PNS.
After axotomizing the central axonal branches, retraction bulbs formed at the proximal tips. These bulbs were typically round or oval with a much larger diameter than their axons and lacked any kind of extensions (Fig. 1 F–K). Retraction bulbs increased approximately three times in size from 1 d to 5 weeks after injury (Fig. 1 F–K,L). The retraction bulb (tip)/axonal shaft ratio was 4.09 ± 0.73 at 1 d (Fig. 1 F,G) (n = 109 retraction bulbs), 8.49 ± 0.51 at 1 week (Fig. 1 H,I) (n = 111 retraction bulbs), and 11.79 ± 0.49 at 5 weeks after injury (Fig. 1 J,K) [n = 92 retraction bulbs; average ± SD; n ≥ 8 mice for each time point (Fig. 1 L)]. In contrast to the slim growth cones that were continuous with the peripheral axonal shafts, the surface area of bulbous structures increased over time (Fig. 1 M). Some of the axons formed smaller bulbs on their shafts in addition to the bigger terminal bulbs [supplemental Fig. S1G (available at www.jneurosci.org as supplemental material), arrow; Fig. 1 I,K]. We next aimed to address the underlying intracellular differences that could cause the formation of retraction bulbs and stalling of axons.
Retraction bulbs contain mitochondria and trans-Golgi-network-derived vesicles
Sustained axonal growth requires various intracellular activities (e.g., transport of vesicles and cytoskeletal dynamics) that need a high energy supply from mitochondria (Morris and Hollenbeck, 1993). Using electron microscopy, we analyzed the mitochondrial morphology and density in growth cones and retraction bulbs at various time points. The mitochondria of the retraction bulbs (Fig. 2 C,D) were indistinguishable from the mitochondria of growth cones (Fig. 2 A,B) and did not show characteristics of degenerating mitochondria that typically contain swollen membranes and loss of cristae (Kong and Xu, 1998). Mitochondrial density in retraction bulbs at 4 d, 2 weeks, and 5 weeks after injury (3.63 ± 0.61, 3.9 ± 0.62, and 4.75 ± 0.66 mitochondria/μm2, respectively; average ± SEM; n ≥ 7 retraction bulbs per time point) was significantly higher (p < 0.05) (Fig. 2 M) than in growth cones (1.76 ± 0.47; average ± SEM; n = 8 growth cones).
Figure 2.

Retraction bulbs contain mitochondria and trans-Golgi-network (TGN)-derived vesicles. A–D, EM was used to analyze the morphology and quantity of vesicles and mitochondria. Electron micrographs show a growth cone 2 d after sciatic nerve crush (A) and a retraction bulb 4 d after dorsal column lesion (C). Accumulation of mitochondria and vesicles is observed in the end structures. B, D, Higher magnification of the areas marked in A and C, respectively. Black arrows show some of the vesicles, and black arrowheads indicate some of the mitochondria in the end structures. E–L, Localization of vesicles shown by immunofluorescent labeling with anti-golgin-160 antibody, specific for TGN-derived vesicles. E, I, GFP-positive end structures (green); F, J, labeled vesicles (red); G, K, overlay of GFP and golgin-160 signal. F, G, J, K, White arrows indicate the vesicles that accumulate in the end structures, and white arrowheads indicate vesicles in the axon shaft. H, L, 3D reconstruction of the confocal images in G and K, respectively. The red particles are vesicles; the outline of the end structures is partially depicted in shaded beige. M–O, Concentration of mitochondria (M) and vesicles (N) in the growth cones at 2 d and in retraction bulbs at various time points after injury as calculated from electron micrographs. O, Concentration of vesicles in the growth cones at 2 d and retraction bulbs at 2 weeks derived from 3D volumetric quantifications. The volume of vesicles in the end structures is shown in percentages. GCs, Growth cones; RBs, retraction bulbs. M–O, *p < 0.05 between retraction bulbs at that time point and growth cones at 2 d after injury.
To investigate whether lack of membrane traffic underlies both retraction bulb formation and axonal stalling after CNS injury we assessed post-Golgi trafficking by coimmunostaining GFP-labeled growth cones and retraction bulbs using the trans-Golgi-derived vesicle marker golgin-160 (Misumi et al., 1997). Post-Golgi vesicles accumulated both in the growth cones (Fig. 2 E–H) and retraction bulbs (Fig. 2 I–L). Similar results were obtained by electron microscopy (Fig. 2 A–D, arrows). The density of smooth, small-sized vesicles was significantly higher in the retraction bulbs at 4 d, 2 weeks, and 5 weeks after injury than in the growth cones (p < 0.05) (Fig. 2 N) (24.6 ± 3.86, 35.7 ± 6.54, and 51.17 ± 6.52 vesicles/μm2, respectively, for retraction bulbs; average ± SEM; growth cones, 12.15 ± 2.5; n ≥ 7 retraction bulbs per time point and n = 8 growth cones). Additionally, vesicle density in the retraction bulbs significantly increased over time (p < 0.01) (Fig. 2 N, from 4 d to 5 weeks after injury). Thus, it appears that vesicles are accumulating over time in the retraction bulbs. We quantified the vesicle densities in the end structures also on 3D images obtained after reconstruction of confocal stacks and found results similar to the quantifications on the EM images (Fig. 2 H,L,O) [26.6 ± 1.3% vesicles/volume (vol) in retraction bulbs at 2 weeks and 14.1 ± 3.7% vesicles/vol in growth cones; average ± SD of the total volume of the end structure; n = 4 3D images per condition]. Altogether, we could not find any apparent deficiencies in energy supply or membrane trafficking that hamper axon extension after spinal cord injury.
Retraction bulbs contain disorganized microtubules
Microtubules play a key role in axonal growth and guidance (Yamada et al., 1970; Forscher and Smith, 1988; Suter et al., 1998; Dent et al., 1999; Dent and Gertler, 2003). They form the backbone of the axonal shafts and core domain of growth cones, giving stability to those structures and enabling organelle transport (Hirokawa and Takemura, 2005). In addition, the dynamic microtubules protrude through the peripheral regions of growth cones, enabling axon elongation (Kabir et al., 2001). We therefore investigated whether the microtubular array differs in nongrowing retraction bulbs and regenerating growth cones. To assess the integrity of microtubules, we coimmunostained GFP-labeled axonal shafts, growth cones, and retraction bulbs for detyrosinated tubulin using an anti-Glu-tubulin antibody and tyrosinated tubulin using an anti-Tyr antibody as markers for stable and dynamic microtubules, respectively (Westermann and Weber, 2003). We found that detyrosinated (stable) microtubules were tightly bundled and parallel aligned in the growth cones and their axonal shaft (Fig. 3 A–D) (n = 21 growth cones). The parallel microtubule arrays were observed all over the growth cone (Fig. 3 D, arrowheads). Tyrosinated (dynamic) microtubules also showed a bundling that reaches to the tips of the growth cones (supplemental Fig. S3E–H, available at www.jneurosci.org as supplemental material) (n = 12 growth cones), similar to what has been demonstrated in cultured neurons (Schaefer et al., 2002; Dent and Gertler, 2003). In contrast, stable microtubules were highly disorganized in retraction bulbs (Fig. 3 E–H) (n = 19 retraction bulbs). Although some regions contained accumulation of stable microtubules (Fig. 3 F, white arrow), other regions were devoid of microtubule filaments (Fig. 3 F, white arrowhead). The orientation of different microtubules was highly heterogeneous (Fig. 3 F, yellow arrows). For instance, none of the microtubules that are indicated with yellow arrowheads in the 3D reconstruction (Fig. 3 H) were parallel to each other. Interestingly, dynamic microtubules were also found in retraction bulbs, albeit seemingly to a smaller extent than in the growth cones (supplemental Fig. S3A–D, available at www.jneurosci.org as supplemental material) (n = 7 retraction bulbs), suggesting that the microtubules are still dynamic and can integrate new tubulin dimers. However, these dynamic microtubules in retraction bulbs were disordered (Fig. S3C, yellow arrows). Moreover, dynamic microtubules were almost absent from the tips of retraction bulbs (Fig. S3C, white arrowhead) but accumulated in the more central domain (Fig. S3C, white arrow). These results suggest that the mislocalization of dynamic microtubules in the nongrowing bulbs could account for axon stalling.
Figure 3.

Retraction bulbs have dispersed and disorganized microtubules. A–H, Immunostaining of axonal end structures with anti-Glu-tubulin antibody, recognizing the detyrosinated α-tubulin subunits, which are already assembled into microtubules, to visualize the organization of microtubules. A–D, Growth cones possess tightly bundled microtubules parallel to the axonal axis. GFP-positive growth cone (green; A), anti-Glu-tubulin staining (red; B), merge (C), and 3D reconstruction (D) are shown. B, D, The arrows (B) and arrowheads (D) point to some of the parallel microtubule bundles. E–H, Retraction bulbs have highly dispersed and disorganized microtubules. GFP-positive retraction bulb (green; E), anti-Glu-tubulin staining (red; F), merge (G), and 3D reconstruction (H) are shown. F, H, The yellow arrows (F) and arrowheads (H) indicate dispersed microtubules that are highly deviated. F, The white arrow indicates regions in which microtubules are densely accumulated, and the white arrowhead indicates regions without microtubules. I–R, Electron micrographs of retraction bulbs and growth cones were analyzed to quantify the angle of deviation of microtubules. Unlesioned central axons were also quantified as a control. A representative unlesioned CNS axon (I), growth cone (L), and retraction bulb (O) are shown. J, M, P, The microtubules in I, L, and O were manually traced in black to visualize the overall microtubule organization in the axonal structures. K, N, R, Higher magnifications of the marked areas in J, M, and P, respectively. The angles between the traced microtubules and the axonal axis were quantified (see Fig. 4).
We further quantified the deviation of microtubules from the axonal axis by analyzing electron micrographs of axonal terminals. In unlesioned controls, the microtubules aligned in parallel to the axonal axis: 99% of the microtubules deviated <30° from the axonal axis [a representative image is shown in Fig. 3 I; the microtubules of the same image were traced with black lines for clearer visualization in Fig. 3 J; a higher magnification of the marked area, showing the angle of deviation, is presented in Fig. 3 K (n = 7 axonal shafts)]. In growth cones, 97.0% of the microtubules deviated <30° from the axonal axis, similar to the unlesioned controls (Fig. 3 L–N) (n = 8 growth cones). In retraction bulbs, only 51% of the microtubules deviated <30° from the axonal axis; instead, 35% of the microtubules deviated between 30 and 60°, and 13% deviated >60° from the axonal axis (Fig. 3 O–R) (n = 9 retraction bulbs). These results show that microtubules in retraction bulbs are disorganized and dispersed compared with unlesioned axons and growth cones (p < 0.001) (the quantification of the data are shown in Fig. 4).
Figure 4.

Quantification of the microtubule deviation from the axonal axis. Each dot represents a single microtubule filament (at least 7 electron micrographs were analyzed and pooled for each condition). The microtubules are significantly more vertical in the retraction bulbs than in either growth cones or unlesioned central axons (p < 0.001).
Microtubule destabilization converts a growth cone into a retraction bulb-like structure and halts axonal growth in vivo
Our observation of disorganized microtubules in retraction bulbs led us to examine whether destabilization of microtubules in a growth cone would be sufficient to transform it into a retraction bulb. To address this point, we injured the sciatic nerve of GFP-M mice to obtain regenerating growth cones, as before, and applied 10 μl of the microtubule-disrupting drug nocodazole (330 μm) to the site of the lesioned sciatic nerve 1 d later. During examination of the sciatic nerve 24 h after nocodazole treatment, we found that 42.3 ± 13.2% of the axons (average ± SD; n = 165 axons from 11 mice) had transformed their growth cones into a bulb (Fig. 5 D–F). Application of DMSO, which served as a negative control, did not cause bulb formation (Fig. 5 A–C). The tip/axonal shaft ratio of nocodazole-induced bulbs (4.25 ± 0.56; average ± SD; n = 70 from 12 mice) was significantly higher than in both lesioned, untreated (1.45 ± 0.13; average ± SD; n = 53 from 8 mice) and lesioned, DMSO-treated (1.64 ± 0.46; average ± SD; n = 62 from 12 mice) controls (Fig. 5 G) (p ≤ 0.001 for both). These nocodazole-induced peripheral bulbs showed a size increase similar to the retraction bulbs seen in the CNS 1 d after spinal cord injury (4.09 ± 0.73) (Fig. 1 F,G,L). When we analyzed the nocodazole-induced peripheral bulbs, we found a dispersed microtubule organization, similar to that in retraction bulbs of the CNS (compare Figs. 5 H–K, 3 E–H). Lower concentrations of nocodazole did not cause bulb formation (10 μl of 3.3 or 33 μm nocodazole) (supplemental Fig. S4A–J, available at www.jneurosci.org as supplemental material).
Figure 5.

Nocodazole application converts a growth cone into a retraction bulb-like structure and restricts axonal growth in vivo. A–K, One day after sciatic nerve injury, GFP-M mice were reanesthetized, and their sciatic nerves were exposed. The exposed sciatic nerves were treated with 10 μl of either 330 μm nocodazole (D–F, H–K) or 5% DMSO as control (A–C). The effects on the morphology and the cytoskeletal structure were assessed 24 h after the treatment. A, The morphology of the growth cones does not change under control conditions. Growth cones treated with 5% DMSO resemble untreated growth cones. B, C, Higher magnifications of the growth cones marked with arrowheads in A. D, After treatment with nocodazole, the axons form bulbs at their tips instead of growth cones. E, F, Higher magnifications of the peripheral bulbs marked with arrowheads in D. G, Quantification of peripheral bulb sizes. The tip/axon ratio of the peripheral bulbs is significantly higher than that of either DMSO-treated growth cones or untreated growth cones (***p < 0.001). All values are average ± SD. H–K, The nocodazole-treated peripheral bulb (H) immunostained with an anti-Glu-tubulin antibody (I) to assess the underlying microtubule organization. The white arrowheads in I and yellow arrowheads in 3D reconstruction (K) point to some of the microtubules, which are dispersed in a way similar to that observed in retraction bulbs (compare with Fig. 3 E–H). L–O, Two days after sciatic nerve injury, the lesion site was reexposed, and binocular images were captured before the treatments. Immediately after the imaging, 10 μl of 330 μm nocodazole (after N) or 5% DMSO (after L) were applied. The positions of the axonal tips were followed over 6 h. O, The nocodazole-treated axonal tip in N remained at its position 6 h after treatment. The tip of this axon is marked by red arrowheads in N and O. L, M, The DMSO-treated growth cone extends during the time of imaging. The tip of this axon is followed by the green arrowheads. The images are aligned with the purple dashed lines with respect to the landmarks, the vertical vessels, which remained at the same position during imaging. P, Quantification of the relative growth of axon terminals after nocodazole and DMSO treatments. Only the axons that were clearly visible at each imaging time have been considered and averaged for each animal. Each green bar represents one control, and each red bar represents one nocodazole-treated animal. Scale bars: L–O, 100 μm.
To assess the growth capacity of the nocodazole-induced peripheral bulbs, we performed in vivo imaging and followed the advance of injured peripheral axonal endings (Fig. 5 L–O). Two days after sciatic nerve injury, the lesion sites containing the growth cones were treated with either nocodazole or vehicle (DMSO). We imaged axons at the time of treatment and 6 h later and measured their extension. Nocodazole treatment (10 μl of 330 μm) significantly (p < 0.05) inhibited the growth of axons compared with control treatment [Fig. 5 L,M, green arrowheads (control); Fig. 5 N,O, red arrowheads (nocodazole)]. All control animals showed axonal growth of 20–100 μm within the observation period. In contrast, nocodazole-treated animals showed very little axonal regrowth: only two of seven animals extended their axons up to 10 μm, whereas the other nocodazole-treated animals did not elongate their axons during the observation period (Fig. 5 P). Lower concentrations of nocodazole did not show any growth-inhibitory effect (10 μl of 3.3 or 33 μm nocodazole) (supplemental Fig. S4K–P, available at www.jneurosci.org as supplemental material).
Together, our results demonstrate that destabilization of microtubules in vivo is sufficient to generate retraction bulb-like structures from a growth cone, as judged by morphological, cytoskeletal, and growth criteria.
Microtubule destabilization induces the formation of bulbous axon terminals and restricts axon outgrowth in cell culture
To address whether nocodazole-induced axonal stalling and morphological changes of the growth cones function cell autonomously, we attempted to generate retraction bulb-like structures in isolated DRG neurons in cell culture. DRG neurons were dissected and cultured as described previously (Neumann et al., 2002). One day after plating, when DRG neurons formed several axons with growth cones at their tips, they were treated with various concentrations of nocodazole for another day. Whereas only a minor fraction of control neurons had tips with a bulbous, club-like morphology, nocodazole-treated neurons had significantly more bulbous endings (Fig. 6 A–J) (9.6 ± 2.3% in controls, 29.1 ± 4.4% in 75 nm nocodazole, 41.1 ± 8.2% in 250 nm nocodazole; p < 0.001; average ± SD; data derived from three independent cultures per condition). Similar to the retraction bulbs formed after spinal cord injury, nocodazole-induced bulbous endings possessed disorganized stable and dynamic microtubules compared with the growth cones (Fig. 6 K,L; supplemental Fig. S5, available at www.jneurosci.org as supplemental material).
Figure 6.

Nocodazole application converts the axon terminals into retraction bulb-like swellings and inhibits axonal growth in vitro. A–I, DRG neurons from adult rats were cultured on laminin for 48 h. A, D, G, From 24 to 48 h, the neurons were incubated with 0.33% DMSO (control; A), 75 nm nocodazole (D), or 250 nm nocodazole (G). B, C, Higher magnifications from A showing in vitro DRG growth cones. E and F, H and I, Higher magnifications from D and G, respectively, showing the retraction bulb-like swellings in vitro after nocodazole treatments. J, Quantification of the retraction bulbs formed at the axonal endings in percentages. Nocodazole treatments (75 and 250 nm) induce significantly more bulbous endings than control treatments (**p < 0.05). K, L, The microtubule organization of the control and 250 nm nocodazole-treated axonal endings, which were identified by immunostaining with a general neuronal tubulin antibody recognizing class III β-tubulin (TuJ1) and with anti-Glu-tubulin antibody. K1–K4, Similar to in vivo growth cones, in vitro growth cones possess bundled microtubules. L1–L4, In contrast, the nocodazole-induced bulbous axon terminals contain disorganized microtubules similar to their in vivo counterparts. M–P, The growth of the axons after treatments was analyzed by calculating the total length of the axons per DRG neuron. TuJ1-stained neurons were imaged by confocal microscopy under identical conditions and quantified. M–O, Control (M) and 75 nm nocodazole- (N) and 250 nm nocodazole (O)-treated DRG neurons. P, Quantification of the average total length of the axons per DRG neuron. There is a significant decrease in the length of nocodazole-treated DRG axons compared with controls. **p < 0.05. Scale bars: A, D, G, 30 μm; B, C, E, F, H, I, 10 μm; M–O, 200 μm.
The growth of the nocodazole-treated axons was significantly (p < 0.01) inhibited compared with controls. The total length of the axons per DRG neuron 2 d in culture (treated from 24 to 48 h) was 2849 ± 46 μm in controls but reduced to 2132 ± 138 μm in 75 nm nocodazole and 1555 ± 142 μm in 250 nm nocodazole (Fig. 6 M–P) (average ± SEM; data derived from three independent cultures per condition). After nocodazole treatments, the total number of cells did not change (data not shown). Thus, destabilization of microtubules is sufficient to cause formation of bulbous endings reminiscent of retraction bulb-like structures by their morphology, microtubule structure, and growth ability.
Microtubule stabilization interferes with the formation of retraction bulbs
Because microtubule destabilization appears to be crucial element in the generation of retraction bulbs, we wondered whether microtubule stabilization would be sufficient to prevent the formation of retraction bulbs after CNS injury. To this end, we applied taxol, a microtubule-stabilizing drug, to the injured spinal cord and assessed the alteration of the axonal stumps' terminals by in vivo imaging. We performed a small unilateral lesion in the dorsal columns of GFP-M mice at the T12 level (Fig. 7 A,B), and the injury sites were bathed in either the microtubule-stabilizing drug taxol or in vehicle (saline). We then continuously observed the behavior of the axons during the subsequent 6 h, using a binocular microscope (Kerschensteiner et al., 2005; Misgeld and Kerschensteiner, 2006) (Fig. 7 C,D). In control conditions, we started to observe formation of apparent retraction bulbs 1 h after injury (Fig. 7 D). At 6 h after injury, already 71.3 ± 9.1% of the axons (average ± SD; n = 18 mice) had formed retraction bulbs at their tips (Fig. 7 D,F,M). However, when 1 μm taxol was repetitively applied (10 μl/h), starting immediately after the injury, only 22.8 ± 13.1% (average ± SD; n = 11 mice) of the axons developed bulbs (defined by a tip/axon ratio of >2) in the first 6 h (Fig. 7 C,E,M). In addition, the size of the axon terminals formed after taxol treatment was smaller (Fig. 7 G–I) [tip/axon ratio, 2.53 ± 0.54 (average ± SD) for the five biggest retraction bulbs per animal] than the retraction bulbs of control treatment (Fig. 7 J–L) [4.14 ± 0.44 (average ± SD); n = 11 mice for each condition; p < 0.001]. The microtubules of taxol-treated axonal endings were bundled and aligned in parallel to the axonal axis resembling the cytoskeletal structure of in vivo growth cones (compare Figs. 7 N–R, 3 A–D). Interestingly, some axons of taxol-treated animals also showed decreased acute axonal degeneration (Kerschensteiner et al., 2005) and Wallerian degeneration as shown by the reduced axonal retraction from the lesion site. In six of 11 taxol-treated animals, the proximal axonal stumps were as close as 25 μm to the injury site 6 h after injury (Fig. 7 E, red arrow), whereas only one of 11 controls showed such minimal retraction (Fig. 7, compare E, F). These results suggest that stabilization of microtubules prevents the formation of retraction bulbs and interferes with axonal retraction after CNS lesioning. To test whether the effect of taxol is specific for inhibiting degeneration of central axonal branch or whether it can change the growth of the peripheral branch after injury, we applied the same concentration of taxol onto the regenerating axons after a sciatic nerve lesion. We observed that 1 μm taxol application did not significantly alter the growth speed of the axons compared with controls. The average growth of the axons was 572 ± 277 μm in the taxol-treated group (supplemental Fig. S6A,B,E, available at www.jneurosci.org as supplemental material) and 511 ± 276 μm in the DMSO-treated group (supplemental Fig. S6C,D,E, available at www.jneurosci.org as supplemental material) within 24 h after treatment (average ± SD; n ≥ 7 mice per group). This suggests that taxol at the concentration used interferes with the growth restraint inflicted on axons but does not change the general growth rates of axons.
Figure 7.

Taxol application interferes with the formation of retraction bulbs. A–D, In vivo imaging to identify effect of the taxol versus control after a small lesion on dorsal column (A, B). Ten microliters of 1 μm taxol (C) or saline (D) were applied repetitively (once per hour) starting immediately after injury (0 h). The lesion sites before and after injury (up to 6 h after injury) in taxol (C) and saline (D) applications are shown from top to bottom. One hour after injury, the first retraction bulbs form in control animals (C) but not in the taxol-applied animals (D). Although most of the axons form retraction bulbs after 6 h in the control, only a minority of taxol-treated animals show axons forming retraction bulbs (compare C, D, 6 h time point). E, F, Confocal image of the lesion sites at 6 h after injury from the same animals shown in C and D, respectively. The dotted lines indicate the injury sites. E, The red arrow indicates an axon that is within a few micrometer proximity of the lesion site. G–L, Higher magnifications of the axon terminals indicated in E and F (the biggest ones from the samples); G–I, the taxol-treated axon terminals; J–L, the control-treated axon terminals. Note that the sizes of the taxol-treated axonal endings are smaller than the retraction bulbs in controls. M, The percentage of axons with retraction bulbs (RBs) in taxol-treated (white circles; n = 11 animals) compared with saline (control)-treated animals (dark circles; n = 18 animals). From 1 h after injury on, there are significantly less bulbs in taxol-treated animals (*p < 0.05; ***p < 0.001). N–R, The Glu-tubulin antibody was used to identify microtubule structure of taxol-treated central axon terminals. GFP-positive axon in green (N), the anti-Glu-tubulin antibody staining in red (O), the merge image (P), and the 3D reconstruction of the presented sample (R) are shown. Note that the microtubules are highly parallel to the axonal axis and mostly bundled as seen in the growth cones. R, The yellow arrowheads focus on some of the microtubules aligned in parallel bundles. Scale bars: G–L, 20 μm.
Microtubule stabilization enhances the growth capacity of neurons cultured on myelin
We further investigated whether taxol application could enhance axonal growth of neurons cultured on an inhibitory substrate. Cultured DRG neurons contain axons that resemble peripheral axonal branches according to their growth rates (Smith and Skene, 1997). We therefore decided to use CNS neurons to study growth of axons on inhibitory substrates. Dissociated cerebellar granule neurons (CGNs) were plated on poly-lysine or CNS myelin (Niederost et al., 1999) and treated with taxol or vehicle. When granule neurons were cultured on poly-lysine, 42.9 ± 4.1% of neurons formed long neurites within 18 h (Fig. 8 A,B,I). In contrast, myelin inhibited the formation of long neurites: only 7.4 ± 2.6% of neurons were able to form a process longer than 60 μm (Fig. 8 E,F,I). Remarkably, in the presence of taxol (10 nm), a significant amount of neurons plated on myelin showed enhanced axonal growth; 29.9 ± 2.35% of the cells contained neurites longer than 60 μm (p < 0.001) (Fig. 8 G–I). Notably, taxol application did not change the growth capacity of CGNs when they were plated on poly-lysine: 40.4 ± 3.3% of neurons had processes longer than 60 μm (Fig. 8 C,D,I) (average ± SD; n ≥ 3 independent experiments per condition). These results show that stabilization of microtubules in culture increases the growth ability of neurons in the presence of an inhibitory environment.
Figure 8.
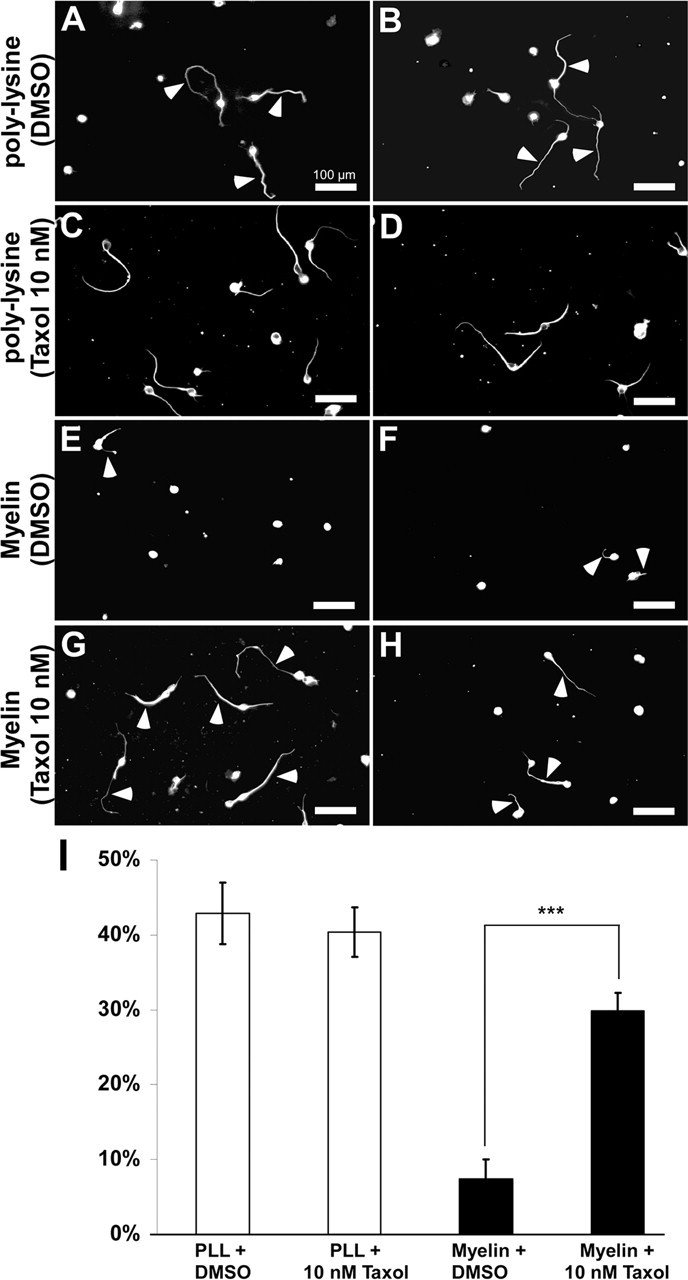
Taxol treatment increases the growth capacity of neurons in culture. A–H, CGNs were cultured either on poly-lysine (A–D) or on an inhibitory substrate (myelin; E–H). A, B, Most of the CGNs cultured on poly-lysine form long axons (42.9 ± 4.1% of the cells had processes longer than 60 μm) within a short time (18 h). C, D, Treatment of CGNs cultured on poly-lysine does not change the growth capacity of these neurons (40.4 ± 3.3% of the cells had processes longer than 60 μm). E, F, CGNs cultured on myelin show reduced axonal growth: only 7.5 ± 2.67% of the cells have processes longer than 60 μm. G, H, Treatment of CGNs with 10 nm taxol largely rescues the formation of long axons on an inhibitory myelin substrate, resulting in 29.9 ± 2.35% of CGNs with axons longer than 60 μm. A–H, Arrowheads indicate axons. I, The percentage of the neurites that are longer than 60 μm is plotted for each condition. ***p < 0.001. Scale bars: A–H, 100 μm. The data are shown as average ± SD; n ≥ 3 independent experiments per condition. PLL, Poly-lysine.
Discussion
Retraction bulbs are the morphological hallmarks of lesioned axons that do not regenerate (Ramon y Cajal, 1928). We have shown that one of the main features of retraction bulb formation is the loss of the microtubule organization (Fig. 9). Disorganizing the microtubules of growth cones using nocodazole was sufficient to generate retraction bulbs as well as to inhibit axonal growth both in vitro and in vivo. Conversely, preventing microtubule disorganization by the microtubule-stabilizing drug taxol blocks the formation of retraction bulbs. Moreover, we demonstrate that microtubule stabilization is sufficient to induce elongation of CNS axons cultured on a growth-inhibitory substrate.
Figure 9.

Model for retraction bulb formation versus growth cone-mediated regeneration. A, D, Before injury, PNS and CNS axons are connected to their targets and are functional. An injury (red flashes) to a CNS axon (A) or PNS axon (D) results in disconnection of the axon from the target tissue. B, E, A few days after injury, the axonal part distal from the lesion site dies back (not shown). The CNS axon proximal to axotomy responds to injury by forming a retraction bulb (B), which is characterized by dispersed stable and dynamic microtubules and accumulated organelles including trans-Golgi-derived vesicles and mitochondria. Stabilization of the microtubules starting immediately after injury (from A) inhibits the formation of retraction bulbs and can furthermore induce axon outgrowth. The PNS axon forms a growth cone after a lesion (E), which efficiently uses membrane trafficking, energy, and an intact cytoskeleton for elongation. Stable microtubules are aligned in parallel bundles and serve as tracks for organelle transport to support the rapidly advancing growth cone and to form the backbone of the growing axon. Dynamic microtubules reach the axonal tip. Destabilization of microtubules at this level can convert the growth cones into retraction bulb-like structures containing dispersed microtubule organization. C, A few weeks after injury, the retraction bulb still enlarges with the accumulation of organelles as a result of a continuous membrane traffic. F, In contrast, the PNS axon continues its rapid elongation until finding and connecting to the target.
The basic intracellular events of retraction bulb formation and maintenance
Formation of axonal swellings is one of the early manifestations of axonal degeneration. In our experiments, the first retraction bulbs start to form within 1 h, consistent with previous observations (Kerschensteiner et al., 2005), and they possess dynamic morphologies during initial hours of injury. Subsequently, they enlarge in size over weeks.
In aiming to identify the mechanisms underlying retraction bulb formation and lack of axonal growth, we assessed effects on membrane trafficking, energy supply, and microtubules. Our results suggest that trans-Golgi-derived vesicles and mitochondria reach and accumulate in the retraction bulbs, indicating that they are not restricting factors of axon regeneration after CNS injury. Indeed, ongoing membrane trafficking of stalled axons might be one cause for the expansion of the retraction bulbs over time, together with endocytosis (Tom et al., 2004). Whereas growth cones in vivo have bundled and parallel-aligned stable and dynamic microtubules that reach the tip, we found that retraction bulbs contain disorganized and dispersed stable and dynamic microtubules. Notably, dynamic microtubules are mislocalized in retraction bulbs. This contrasts with in vivo growth cones, which contain bundled dynamic microtubules that extend to the axonal tips. Reorganization of dynamic microtubules is crucial to generate a pushing force against the plasma membrane (Dogterom et al., 2005). Dynamic microtubules probe the actin-rich peripheral regions of in vitro growth cones and continuously project into lamellipodia and filopodia, showing the typical dynamic behavior of microtubules necessary for axon extension (Kabir et al., 2001; Schaefer et al., 2002). Thus, it appears that disorganized microtubules present in retraction bulbs are not able to support axon extension.
Interestingly, slowly growing or pausing growth cones in vitro share some similarities with retraction bulbs. For example, pausing growth cones expand their surface area and show rearrangements of their microtubules (Sabry et al., 1991; Tanaka and Kirschner, 1991; Dent et al., 1999). Specifically, WNT-7a causes axon inhibition and the generation of enlarged mossy fiber growth cones that possess unbundled microtubules reminiscent to the microtubules in retraction bulbs (Hall et al., 2000).
Manipulating the microtubule network to convert the end structures
Modification of microtubules with pharmacological drugs can change the direction (Buck and Zheng, 2002), morphology, and elongation of the axons (Pan et al., 2003). Our findings demonstrate that microtubule destabilization using nocodazole is sufficient to produce retraction bulb-like structures from growth cones and to block axonal growth both in culture and in vivo after peripheral injury.
We also demonstrate that stabilization of microtubules using taxol after CNS injury inhibits dispersion of the microtubules, preventing retraction bulb formation and axonal degeneration. One way to interpret these results is that taxol could inhibit microtubule catastrophe events that occur after CNS injury, probably caused by a rapid intra-axonal accumulation of calcium (Balentine and Spector, 1977; O'Brien et al., 1997). Interestingly, pharmacological inhibition of calpains, a group of proteases that cleaves the major proteins, including cytoskeletal proteins (George et al., 1995), also has a neuroprotective effect in the optic nerve (Araujo Couto et al., 2004) and in DRG neurons (Kerschensteiner et al., 2005).
In addition, we show that taxol treatment increases the growth ability of cultured postnatal CGNs when plated on CNS myelin, which is an established cell culture assay that resembles some aspects of the inhibitory environment of the injured spinal cord. Interestingly, taxol-treated neurons do not show enhanced growth when plated on poly-lysine, suggesting that taxol enables axons to overcome growth restraint rather than enhancing their general growth potential. Consistent with this interpretation, we demonstrate that taxol-treated injured peripheral axons of DRG neurons do not change their growth rate.
Together, our in vitro and in vivo findings present promising insights to study the therapeutic potentials of microtubule stabilization in spinal cord injury. It is important to stress that microtubules need to be dynamic to support axon extension. Indeed, low concentrations of taxol do not block microtubule dynamics, but suppress the rate and extent of microtubule shrinkage, yet still allow polymerization (Derry et al., 1995). In contrast, high concentrations of taxol suppress microtubule dynamics, and thereby axon elongation (Schwamborn and Puschel, 2004), and cause toxicity for cells, which would imbalance the recovering tissue. Hence, a proper range of drug and delivering methods should be investigated for assessing the effect of taxol on axonal regeneration in vivo.
Putative signaling mechanisms underlying microtubule disorganization
Peripheral and central injuries trigger axonal responses that are dependent on distinct extrinsic factors present in the CNS and PNS. Microtubules are regulated by external signals during axon elongation and guidance (Suter et al., 1998; Buck and Zheng, 2002; Dent and Gertler, 2003). In fact, the known inhibitory cues present in the CNS myelin and the glial scar, including myelin-associated glycoprotein (MAG), Nogo, OMgP (oligodendrocyte–myelin glycoprotein), and versican, converge downstream of their receptors onto signaling pathways of the Rho GTPases (Dubreuil et al., 2003; Fournier et al., 2003; Schweigreiter et al., 2004; Sivasankaran et al., 2004), which, in addition to the actin cytoskeleton, also affect microtubule stability and dynamics (Etienne-Manneville, 2004; Mimura et al., 2006). This suggests that extracellular inhibitory molecules could also induce changes in the dynamics and morphology of the axonal tip by affecting microtubule organization. Indeed, a recent report from Mimura et al. (2006) showed that MAG inhibits microtubule assembly and axon outgrowth in postnatal cerebellar granule neurons via Rho kinase activation. Interestingly, they identified CRMP-2 (collapsin response mediator protein-2), a microtubule-associated protein, as a target for microtubule disassembly both in vitro and in vivo after spinal cord injury. In addition to externally triggered responses induced by inhibitory factors, there are intrinsic determinants that confer growth competence. Lesioning the peripheral axonal branches of DRG neurons causes expression of a distinct set of genes, termed regeneration-associated genes, which are not upregulated after central lesioning (Ylera and Bradke, 2006). Interestingly, those sets of genes contain direct and indirect regulators of microtubule polymerization and stabilization, including tubulin isoforms, MAPs (microtubule-associated proteins), and arginase I (Miller et al., 1989; Moskowitz and Oblinger, 1995; Cai et al., 2002; Bosse et al., 2006), which may enhance the rapid regrowth of lesioned PNS axons. Notably, it has been demonstrated that interfering with the expression of microtubule binding proteins inhibits neurite outgrowth (Caceres et al., 1992). Together, our work establishes microtubules aside from the actin cytoskeleton as a major intracellular regulator of growth restraint after CNS lesioning.
Conclusions
Injured axon terminals' retraction bulbs in vivo are hallmarks of regeneration failure in the injured spinal cord as well as most of the other CNS neurodegenerative disorders, including traumatic brain injury, Alzheimer's disease, Parkinson's disease, and multiple sclerosis (Coleman, 2005). Hence, identification of the differences inherent to formation of retraction bulbs and advancing growth cones would provide essential insights to better address the causes of regeneration failure in the CNS. We believe that our results decipher a key intracellular mechanism that determines the formation and differential growth properties of growth cones and retraction bulbs. The future challenge will be to manipulate the microtubules of retraction bulbs in vivo to induce regrowth of injured CNS axons. We expect that stabilization of microtubules, alone or combined with other therapeutic interventions, will be a potential approach to enhance regeneration of injured CNS axons.
Footnotes
This work was supported by the Max Planck Society and additional grants from the Deutsche Forschungsgemeinschaft (SFB 391). F.B. is a recipient of a Career Development Award from the Human Frontier Science Program. A.E. was supported by the Marie Curie Association. F.B. and A.E. are members of the European Union-Research Training Network “Nervous System Repair” (RTN MRTN-CT-2003-504636). J.E. is a student of the Gulbenkian PhD Program in Biomedicine and is sponsored by the Portuguese Foundation for Science and Technology. We thank D. Büringer and M. Braun for assistance in using electron microscopy. We are indebted to Dr. F. Barr for sharing reagents and to Dr. J. R. Sanes for the gift of GFP-M and YFP-H transgenic mice. We are grateful to Drs. B. Garvalov, H. Thoenen, A. Borst, R. Klein, C. Brakebusch, G. Tavosanis, M. Hübener, T. Keck, F. Barr, B. Ylera, S. Tahirovic, and Mr. H. Witte for their critical reading of this manuscript.
References
- Araujo Couto L, Sampaio Narciso M, Hokoc JN, Blanco Martinez AM. Calpain inhibitor 2 prevents axonal degeneration of opossum optic nerve fibers. J Neurosci Res. 2004;77:410–419. doi: 10.1002/jnr.20170. [DOI] [PubMed] [Google Scholar]
- Balentine JD, Spector M. Calcification of axons in experimental spinal cord trauma. Ann Neurol. 1977;2:520–523. doi: 10.1002/ana.410020612. [DOI] [PubMed] [Google Scholar]
- Bosse F, Hasenpusch-Theil K, Kury P, Muller HW. Gene expression profiling reveals that peripheral nerve regeneration is a consequence of both novel injury-dependent and reactivated developmental processes. J Neurochem. 2006;96:1441–1457. doi: 10.1111/j.1471-4159.2005.03635.x. [DOI] [PubMed] [Google Scholar]
- Bradke F, Dotti CG. Neuronal polarity: vectorial cytoplasmic flow precedes axon formation. Neuron. 1997;19:1175–1186. doi: 10.1016/s0896-6273(00)80410-9. [DOI] [PubMed] [Google Scholar]
- Buck KB, Zheng JQ. Growth cone turning induced by direct local modification of microtubule dynamics. J Neurosci. 2002;22:9358–9367. doi: 10.1523/JNEUROSCI.22-21-09358.2002. [DOI] [PMC free article] [PubMed] [Google Scholar]
- Caceres A, Mautino J, Kosik KS. Suppression of MAP2 in cultured cerebellar macroneurons inhibits minor neurite formation. Neuron. 1992;9:607–618. doi: 10.1016/0896-6273(92)90025-9. [DOI] [PubMed] [Google Scholar]
- Cai D, Deng K, Mellado W, Lee J, Ratan RR, Filbin MT. Arginase I and polyamines act downstream from cyclic AMP in overcoming inhibition of axonal growth MAG and myelin in vitro. Neuron. 2002;35:711–719. doi: 10.1016/s0896-6273(02)00826-7. [DOI] [PubMed] [Google Scholar]
- Coleman M. Axon degeneration mechanisms: commonality amid diversity. Nat Rev Neurosci. 2005;6:889–898. doi: 10.1038/nrn1788. [DOI] [PubMed] [Google Scholar]
- Craig AM, Wyborski RJ, Banker G. Preferential addition of newly synthesized membrane protein at axonal growth cones. Nature. 1995;375:592–594. doi: 10.1038/375592a0. [DOI] [PubMed] [Google Scholar]
- Dai J, Sheetz MP. Axon membrane flows from the growth cone to the cell body. Cell. 1995;83:693–701. doi: 10.1016/0092-8674(95)90182-5. [DOI] [PubMed] [Google Scholar]
- Dent EW, Gertler FB. Cytoskeletal dynamics and transport in growth cone motility and axon guidance. Neuron. 2003;40:209–227. doi: 10.1016/s0896-6273(03)00633-0. [DOI] [PubMed] [Google Scholar]
- Dent EW, Callaway JL, Szebenyi G, Baas PW, Kalil K. Reorganization and movement of microtubules in axonal growth cones and developing interstitial branches. J Neurosci. 1999;19:8894–8908. doi: 10.1523/JNEUROSCI.19-20-08894.1999. [DOI] [PMC free article] [PubMed] [Google Scholar]
- Derry WB, Wilson L, Jordan MA. Substoichiometric binding of taxol suppresses microtubule dynamics. Biochemistry. 1995;34:2203–2211. doi: 10.1021/bi00007a014. [DOI] [PubMed] [Google Scholar]
- Dogterom M, Kerssemakers JW, Romet-Lemonne G, Janson ME. Force generation by dynamic microtubules. Curr Opin Cell Biol. 2005;17:67–74. doi: 10.1016/j.ceb.2004.12.011. [DOI] [PubMed] [Google Scholar]
- Drescher U, Kremoser C, Handwerker C, Loschinger J, Noda M, Bonhoeffer F. In vitro guidance of retinal ganglion cell axons by RAGS, a 25 kDa tectal protein related to ligands for Eph receptor tyrosine kinases. Cell. 1995;82:359–370. doi: 10.1016/0092-8674(95)90425-5. [DOI] [PubMed] [Google Scholar]
- Dubreuil CI, Winton MJ, McKerracher L. Rho activation patterns after spinal cord injury and the role of activated Rho in apoptosis in the central nervous system. J Cell Biol. 2003;162:233–243. doi: 10.1083/jcb.200301080. [DOI] [PMC free article] [PubMed] [Google Scholar]
- Etienne-Manneville S. Actin and microtubules in cell motility: which one is in control? Traffic. 2004;5:470–477. doi: 10.1111/j.1600-0854.2004.00196.x. [DOI] [PubMed] [Google Scholar]
- Fan J, Mansfield SG, Redmond T, Gordon-Weeks PR, Raper JA. The organization of F-actin and microtubules in growth cones exposed to a brain-derived collapsing factor. J Cell Biol. 1993;121:867–878. doi: 10.1083/jcb.121.4.867. [DOI] [PMC free article] [PubMed] [Google Scholar]
- Feng G, Mellor RH, Bernstein M, Keller-Peck C, Nguyen QT, Wallace M, Nerbonne JM, Lichtman JW, Sanes JR. Imaging neuronal subsets in transgenic mice expressing multiple spectral variants of GFP. Neuron. 2000;28:41–51. doi: 10.1016/s0896-6273(00)00084-2. [DOI] [PubMed] [Google Scholar]
- Forscher P, Smith SJ. Actions of cytochalasins on the organization of actin filaments and microtubules in a neuronal growth cone. J Cell Biol. 1988;107:1505–1516. doi: 10.1083/jcb.107.4.1505. [DOI] [PMC free article] [PubMed] [Google Scholar]
- Fournier AE, Takizawa BT, Strittmatter SM. Rho kinase inhibition enhances axonal regeneration in the injured CNS. J Neurosci. 2003;23:1416–1423. doi: 10.1523/JNEUROSCI.23-04-01416.2003. [DOI] [PMC free article] [PubMed] [Google Scholar]
- George EB, Glass JD, Griffin JW. Axotomy-induced axonal degeneration is mediated by calcium influx through ion-specific channels. J Neurosci. 1995;15:6445–6452. doi: 10.1523/JNEUROSCI.15-10-06445.1995. [DOI] [PMC free article] [PubMed] [Google Scholar]
- Hall AC, Lucas FR, Salinas PC. Axonal remodeling and synaptic differentiation in the cerebellum is regulated by WNT-7a signaling. Cell. 2000;100:525–535. doi: 10.1016/s0092-8674(00)80689-3. [DOI] [PubMed] [Google Scholar]
- Hatten ME. Neuronal regulation of astroglial morphology and proliferation in vitro. J Cell Biol. 1985;100:384–396. doi: 10.1083/jcb.100.2.384. [DOI] [PMC free article] [PubMed] [Google Scholar]
- Hill CE, Beattie MS, Bresnahan JC. Degeneration and sprouting of identified descending supraspinal axons after contusive spinal cord injury in the rat. Exp Neurol. 2001;171:153–169. doi: 10.1006/exnr.2001.7734. [DOI] [PubMed] [Google Scholar]
- Hirokawa N, Takemura R. Molecular motors and mechanisms of directional transport in neurons. Nat Rev Neurosci. 2005;6:201–214. doi: 10.1038/nrn1624. [DOI] [PubMed] [Google Scholar]
- Huber AB, Kolodkin AL, Ginty DD, Cloutier JF. Signaling at the growth cone: ligand-receptor complexes and the control of axon growth and guidance. Annu Rev Neurosci. 2003;26:509–563. doi: 10.1146/annurev.neuro.26.010302.081139. [DOI] [PubMed] [Google Scholar]
- Kabir N, Schaefer AW, Nakhost A, Sossin WS, Forscher P. Protein kinase C activation promotes microtubule advance in neuronal growth cones by increasing average microtubule growth lifetimes. J Cell Biol. 2001;152:1033–1044. doi: 10.1083/jcb.152.5.1033. [DOI] [PMC free article] [PubMed] [Google Scholar]
- Kerschensteiner M, Schwab ME, Lichtman JW, Misgeld T. In vivo imaging of axonal degeneration and regeneration in the injured spinal cord. Nat Med. 2005;11:572–577. doi: 10.1038/nm1229. [DOI] [PubMed] [Google Scholar]
- Kong J, Xu Z. Massive mitochondrial degeneration in motor neurons triggers the onset of amyotrophic lateral sclerosis in mice expressing a mutant SOD1. J Neurosci. 1998;18:3241–3250. doi: 10.1523/JNEUROSCI.18-09-03241.1998. [DOI] [PMC free article] [PubMed] [Google Scholar]
- Lewis PR, Shute CC. An electron-microscopic study of cholinesterase distribution in the rat adrenal medulla. J Microsc. 1969;89:181–193. doi: 10.1111/j.1365-2818.1969.tb00664.x. [DOI] [PubMed] [Google Scholar]
- Li Y, Raisman G. Sprouts from cut corticospinal axons persist in the presence of astrocytic scarring in long-term lesions of the adult rat spinal cord. Exp Neurol. 1995;134:102–111. doi: 10.1006/exnr.1995.1041. [DOI] [PubMed] [Google Scholar]
- Miller FD, Tetzlaff W, Bisby MA, Fawcett JW, Milner RJ. Rapid induction of the major embryonic α-tubulin mRNA, Tα1, during nerve regeneration in adult rats. J Neurosci. 1989;9:1452–1463. doi: 10.1523/JNEUROSCI.09-04-01452.1989. [DOI] [PMC free article] [PubMed] [Google Scholar]
- Mimura F, Yamagishi S, Arimura N, Fujitani M, Kubo T, Kaibuchi K, Yamashita T. Myelin-associated glycoprotein inhibits microtubule assembly by a Rho-kinase-dependent mechanism. J Biol Chem. 2006;281:15970–15979. doi: 10.1074/jbc.M510934200. [DOI] [PubMed] [Google Scholar]
- Misgeld T, Kerschensteiner M. In vivo imaging of the diseased nervous system. Nat Rev Neurosci. 2006;7:449–463. doi: 10.1038/nrn1905. [DOI] [PubMed] [Google Scholar]
- Misumi Y, Sohda M, Yano A, Fujiwara T, Ikehara Y. Molecular characterization of GCP170, a 170-kDa protein associated with the cytoplasmic face of the Golgi membrane. J Biol Chem. 1997;272:23851–23858. doi: 10.1074/jbc.272.38.23851. [DOI] [PubMed] [Google Scholar]
- Morris RL, Hollenbeck PJ. The regulation of bidirectional mitochondrial transport is coordinated with axonal outgrowth. J Cell Sci. 1993;104:917–927. doi: 10.1242/jcs.104.3.917. [DOI] [PubMed] [Google Scholar]
- Moskowitz PF, Oblinger MM. Sensory neurons selectively upregulate synthesis and transport of the βIII-tubulin protein during axonal regeneration. J Neurosci. 1995;15:1545–1555. doi: 10.1523/JNEUROSCI.15-02-01545.1995. [DOI] [PMC free article] [PubMed] [Google Scholar]
- Neumann S, Bradke F, Tessier-Lavigne M, Basbaum AI. Regeneration of sensory axons within the injured spinal cord induced by intraganglionic cAMP elevation. Neuron. 2002;34:885–893. doi: 10.1016/s0896-6273(02)00702-x. [DOI] [PubMed] [Google Scholar]
- Niederost BP, Zimmermann DR, Schwab ME, Bandtlow CE. Bovine CNS myelin contains neurite growth-inhibitory activity associated with chondroitin sulfate proteoglycans. J Neurosci. 1999;19:8979–8989. doi: 10.1523/JNEUROSCI.19-20-08979.1999. [DOI] [PMC free article] [PubMed] [Google Scholar]
- O'Brien ET, Salmon ED, Erickson HP. How calcium causes microtubule depolymerization. Cell Motil Cytoskeleton. 1997;36:125–135. doi: 10.1002/(SICI)1097-0169(1997)36:2<125::AID-CM3>3.0.CO;2-8. [DOI] [PubMed] [Google Scholar]
- Pan YA, Misgeld T, Lichtman JW, Sanes JR. Effects of neurotoxic and neuroprotective agents on peripheral nerve regeneration assayed by time-lapse imaging in vivo . J Neurosci. 2003;23:11479–11488. doi: 10.1523/JNEUROSCI.23-36-11479.2003. [DOI] [PMC free article] [PubMed] [Google Scholar]
- Ramon y Cajal S. Degeneration and regeneration of the nervous system. London: Oxford UP; 1928. [Google Scholar]
- Raper JA, Kapfhammer JP. The enrichment of a neuronal growth cone collapsing activity from embryonic chick brain. Neuron. 1990;4:21–29. doi: 10.1016/0896-6273(90)90440-q. [DOI] [PubMed] [Google Scholar]
- Sabry JH, O'Connor TP, Evans L, Toroian-Raymond A, Kirschner M, Bentley D. Microtubule behavior during guidance of pioneer neuron growth cones in situ. J Cell Biol. 1991;115:381–395. doi: 10.1083/jcb.115.2.381. [DOI] [PMC free article] [PubMed] [Google Scholar]
- Schaefer AW, Kabir N, Forscher P. Filopodia and actin arcs guide the assembly and transport of two populations of microtubules with unique dynamic parameters in neuronal growth cones. J Cell Biol. 2002;158:139–152. doi: 10.1083/jcb.200203038. [DOI] [PMC free article] [PubMed] [Google Scholar]
- Schwamborn JC, Puschel AW. The sequential activity of the GTPases Rap1B and Cdc42 determines neuronal polarity. Nat Neurosci. 2004;7:923–929. doi: 10.1038/nn1295. [DOI] [PubMed] [Google Scholar]
- Schweigreiter R, Walmsley AR, Niederost B, Zimmermann DR, Oertle T, Casademunt E, Frentzel S, Dechant G, Mir A, Bandtlow CE. Versican V2 and the central inhibitory domain of Nogo-A inhibit neurite growth via p75NTR/NgR-independent pathways that converge at RhoA. Mol Cell Neurosci. 2004;27:163–174. doi: 10.1016/j.mcn.2004.06.004. [DOI] [PubMed] [Google Scholar]
- Silver J, Miller JH. Regeneration beyond the glial scar. Nat Rev Neurosci. 2004;5:146–156. doi: 10.1038/nrn1326. [DOI] [PubMed] [Google Scholar]
- Sivasankaran R, Pei J, Wang KC, Zhang YP, Shields CB, Xu XM, He Z. PKC mediates inhibitory effects of myelin and chondroitin sulfate proteoglycans on axonal regeneration. Nat Neurosci. 2004;7:261–268. doi: 10.1038/nn1193. [DOI] [PubMed] [Google Scholar]
- Smith DS, Skene JH. A transcription-dependent switch controls competence of adult neurons for distinct modes of axon growth. J Neurosci. 1997;17:646–658. doi: 10.1523/JNEUROSCI.17-02-00646.1997. [DOI] [PMC free article] [PubMed] [Google Scholar]
- Steinmetz MP, Horn KP, Tom VJ, Miller JH, Busch SA, Nair D, Silver DJ, Silver J. Chronic enhancement of the intrinsic growth capacity of sensory neurons combined with the degradation of inhibitory proteoglycans allows functional regeneration of sensory axons through the dorsal root entry zone in the mammalian spinal cord. J Neurosci. 2005;25:8066–8076. doi: 10.1523/JNEUROSCI.2111-05.2005. [DOI] [PMC free article] [PubMed] [Google Scholar]
- Suter DM, Errante LD, Belotserkovsky V, Forscher P. The Ig superfamily cell adhesion molecule, apCAM, mediates growth cone steering by substrate-cytoskeletal coupling. J Cell Biol. 1998;141:227–240. doi: 10.1083/jcb.141.1.227. [DOI] [PMC free article] [PubMed] [Google Scholar]
- Tanaka EM, Kirschner MW. Microtubule behavior in the growth cones of living neurons during axon elongation. J Cell Biol. 1991;115:345–363. doi: 10.1083/jcb.115.2.345. [DOI] [PMC free article] [PubMed] [Google Scholar]
- Tom VJ, Steinmetz MP, Miller JH, Doller CM, Silver J. Studies on the development and behavior of the dystrophic growth cone, the hallmark of regeneration failure, in an in vitro model of the glial scar and after spinal cord injury. J Neurosci. 2004;24:6531–6539. doi: 10.1523/JNEUROSCI.0994-04.2004. [DOI] [PMC free article] [PubMed] [Google Scholar]
- Vogt L, Giger RJ, Ziegler U, Kunz B, Buchstaller A, Hermens W, Kaplitt MG, Rosenfeld MR, Pfaff DW, Verhaagen J, Sonderegger P. Continuous renewal of the axonal pathway sensor apparatus by insertion of new sensor molecules into the growth cone membrane. Curr Biol. 1996;6:1153–1158. doi: 10.1016/s0960-9822(02)70682-9. [DOI] [PubMed] [Google Scholar]
- Westermann S, Weber K. Post-translational modifications regulate microtubule function. Nat Rev Mol Cell Biol. 2003;4:938–947. doi: 10.1038/nrm1260. [DOI] [PubMed] [Google Scholar]
- Yamada KM, Spooner BS, Wessells NK. Axon growth: roles of microfilaments and microtubules. Proc Natl Acad Sci USA. 1970;66:1206–1212. doi: 10.1073/pnas.66.4.1206. [DOI] [PMC free article] [PubMed] [Google Scholar]
- Ylera B, Bradke F. Model organisms in spinal cord regeneration. Edinburgh: Wiley-VCH; 2006. Stimulating growth potential in mammalian neurons. [Google Scholar]