

Abstract
Although blood oxygenation level-dependent (BOLD) functional magnetic resonance imaging (fMRI) has been widely used to explore human brain function, questions remain regarding the ultimate spatial resolution of positive BOLD fMRI, and indeed the extent to which functional maps revealed by positive BOLD correlate spatially with maps obtained with other high-spatial-resolution mapping techniques commonly used in animals, such as optical imaging of intrinsic signal (OIS) and single-unit electrophysiology. Here, we demonstrate that the positive BOLD signal at 9.4T can reveal the fine topography of individual fingerpads in single-condition activation maps in nonhuman primates. These digit maps are similar to maps obtained from the same animal using intrinsic optical imaging. Furthermore, BOLD fMRI reliably resolved submillimeter spatial shifts in activation in area 3b previously identified with OIS (Chen et al., 2003) as neural correlates of the “funneling illusion.” These data demonstrate that at high field, high-spatial-resolution topographic maps can be achieved using the positive BOLD signal, weakening previous notions regarding the spatial specificity of the positive BOLD signal.
Keywords: fMRI, optical imaging, primate, somatosensory cortex, digits, topography
Introduction
Blood oxygenation level-dependent (BOLD) functional magnetic resonance imaging (fMRI), since its discovery in early 1990s, has become one of the most powerful mapping techniques for localizing brain function and has revolutionized cognitive neuroscience. Because cortical columns are believed to be the building blocks of cerebral cortical function, revealing functional structures at the millimeter and submillimeter scale is critical to understanding brain function. Activation mapping at this millimeter and submillimeter scale is mostly the domain of other high-spatial-resolution techniques, such as optical imaging of intrinsic signals (OIS) and single-unit electrophysiology. Because higher magnetic-field (B0) strengths improve the sensitivity of fMRI signal, higher spatial and temporal resolutions can be achieved. However, the ultimate functional spatial specificity of the positive BOLD signal as a mapping tool without contrast agent, and to what extent these activation maps correlate with underlying neuronal activities as well as their equivalence to maps obtained by optical imaging and electrophysiology are still open questions.
In contrast to BOLD fMRI, OIS offers higher spatial (∼100 μm) and temporal resolution (∼100 ms), and has been widely used for the study of cortical function in animals including rodents, carnivores, and nonhuman primates (Grinvald et al., 1986; Frostig et al., 1990; Malonek and Grinvald, 1997; Chen et al., 2001, 2003), and to some extent in humans (Cannestra et al., 2001; Pouratian et al., 2002; Sato et al., 2002; Schwartz, 2005). Many studies suggest that the optical intrinsic signal corresponds to the early negative BOLD signal (the so-called “initial dip”) (Toth et al., 1996; Malonek and Grinvald, 1997; Cannestra et al., 2001; Pouratian et al., 2002; Sheth et al., 2004). This early negative BOLD signal is quite small, however, and has not been consistently detected (Marota et al., 1999; Silva et al., 2000). Although alternative fMRI approaches, such as cerebral blood flow (CBF) and volume (CBV) methods, can reveal submillimeter sized columnar and laminar organizations of cortex (Duong et al., 2000, 2001; Lu et al., 2004; Sheth et al., 2004; Vanzetta et al., 2004; Harel et al., 2006a) and retina (Cheng et al., 2006), whether such spatial resolution can be obtained using the positive BOLD signal is unknown.
To address these issues, we compared the positive BOLD and OIS maps of fingerpad representation in the primary somatosensory cortex (SI) in the same anesthetized squirrel monkey. In addition to validating the BOLD maps, such intraindividual comparisons can provide direct linkage between OIS and electrophysiological signals studied in animals and BOLD signals studied in humans. We have previously used OIS to map the somatotopy of millimeter-sized fingerpad representations in areas 3b and 1 of SI in this species (Chen et al., 2001) and identified a submillimeter spatial shift in activation location corresponding to the neural correlate of the tactile funneling illusion (Chen et al., 2003). Here, we test whether BOLD fMRI without benefit of exogenous contrast agents can also achieve submillimeter spatial resolution.
Materials and Methods
Animal preparation.
Eight Squirrel monkeys (>25 sessions) were anesthetized with ketamine hydrochloride (10 mg/kg)/atropine (0.05 mg/kg) and maintained with isoflurane anesthesia (0.8–1.1%) delivered in a 70:30 O2/NO2 mixture. Animals were intubated and artificially ventilated. After intubation, the animal was placed in a custom-designed MR cradle and its head secured with ear bars and an eye bar. Lactated Ringer's solution was infused intravenously (2–3 ml/h/kg) to prevent dehydration during the course of the study. Arterial blood oxygen saturation and heart rate (Nonin, Plymouth, MN), electrocardiogram, end-tidal CO2 (ET-CO2; 22–26 mmHg; Surgivet, Waukesha, WI), and respiration (SA Instruments, Stony Brook, NY) were externally monitored and maintained. Temperature (37.5–38.5°C) was monitored (SA Instruments) and maintained via a combination of a circulating water blanket (Gaymar Industries, Orchard Park, NY) and a flow of warm air (SA Instruments). Real-time monitoring was maintained from the time of induction of anesthesia until full recovery. All procedures were in compliance with and approved by the Institutional Animal Care and Use Committee of Vanderbilt University.
Stimulus protocol.
The fingers were secured by gluing small pegs to the fingernails and fixing these pegs firmly in plasticine, leaving the glabrous surfaces available for vibrotactile stimulation by a rounded plastic probe (2 mm diameter) connected to a piezoelectric device (Noliac, Kvistgaard, Denmark). Piezos were driven by Grass S48 square wave stimulators (Grass-Telefactor, West Warwick, RI) at a rate of 8 Hz with 30 ms pulse duration. Stimulation was applied in blocks of 30 s on and then 30 s off. The timing of the presentation of stimuli was externally controlled by the MR scanner.
MR methods.
All scans were performed on a 9.4T 21 cm narrow-bore Varian Inova magnet (Varian Medical Systems, Palo Alto, CA) using a high-performance 3 cm surface transmit–receive coil secured over the sensory cortex. Scout images using a fast gradient-echo sequence were used to define a volume covering primary somatosensory cortex in which static magnetic field homogeneity was optimized, and to plan oblique slices for structural and functional imaging (see Fig. 1). T2*-weighted gradient-echo structural images [repetition time (TR), 200 ms; echo time (TE), 14 ms, three slices, 512 × 512 matrix; 156 × 156 × 2000 μm resolution; number of excitations, 2] were acquired to identify venous structures on the cortical surface used to help locate SI, and as structural features for coregistration of fMRI and optical somatotopic maps. fMRI data were acquired from the same slice using a gradient echo-planar image (EPI) sequence (TE, 16; 64 × 64 matrix; 625 × 625 × 2000 μm resolution). The TR on individual scans was adjusted (e.g., 1.5 or 2 s) to match the ventilator rate to minimize respiration-induced signal variations in the functional time courses.
Figure 1.

Anatomic images for studying SI. a, A high-resolution coronal image is collected to locate somatosensory cortices and to guide placement of three oblique slices parallel to the SI (locations indicated by rectangles, overlaid on coronal scout image). This oblique orientation was used for both high-resolution anatomical and functional imaging. b, Major landmarks (such as central and lateral sulci) used to identify SI are visible on squirrel monkey brain. c, In three images acquired with T2* weighting, sulci and vascular structures appear dark. Both central and lateral sulci are readily identified in the most superficial slice. Scale bar, 10 mm. a, Anterior; m, medial.
fMRI data analysis.
Images were reconstructed on the MR console (Varian VnmrJ) and imported into Matlab (Mathworks, Natick, MA) for analysis. EPI data were collected as a 64 × 64 matrix for an in-plane voxel dimension of 625 μm. These raw EPIs were smoothed with a 3 × 3 Gaussian window with an SD of 312 μm, and then interpolated to a 256 × 256 matrix for overlay on anatomic images. Time courses were drift corrected using a linear model fitted to each time course and temporally smoothed with a low-pass filter whose cutoff frequency was set above the second harmonic of the task function. The correlation of each functional time course to a reference waveform was calculated and functional maps were generated by identifying regions of clustered voxels whose correlation with the reference waveform was significant at least at p ≤ 10−5 (uncorrected for multiple comparisons). Before choice of this threshold, the influence of the threshold on the area, amplitude, and centroid of activation were examined and compared with the results from optical imaging and electrophysiology in the same animals. Activations were overlaid on corresponding anatomic images and then compared with known topography.
Calculations of MI.
The merging index (MI) reflects the normalized distance of the merged activation observed during simultaneous stimulation of two digits from the center of the two single-digit activations. To calculate the MI, the digit locations are set to 0 (center of one digit), 0.5 (central point between two digits), and 1 (center of adjacent digit), allowing the center of activation for the two-digit stimulation to be normalized to the same scale across cases (Chen et al., 2003).
Optical imaging and data analysis.
Three of eight fMRI monkeys were subsequently imaged with optical imaging. For the optical imaging experiments, identical procedures used in the fMRI studies in anesthesia and vital-sign monitoring were followed except monkeys were anesthetized by slightly higher isoflurane (0.9–1.3%) delivered by pure oxygen (to be consistent with our previous optical studies). Importantly, ET-CO2 was maintained at the same level for all optical imaging and fMRI experiments. After craniotomy/durotomy, the primary somatosensory cortex (areas 3b and 1 in the SI) was exposed and identified by blood-vessel landmarks revealed by fMRI studies. Images were collected using the Imager 3001 systems (Optical Imaging, Germantown, NY) with 630 nm illumination. A blood-vessel map, used for landmark purposes, was collected with 570 nm illumination. In blocks of trials, stimuli (4 s duration) were presented in a randomly interleaved manner. Thirty trials were collected per stimulus condition. Intrinsic signal maps were collected at five image frames per second for 3 s starting 200 ms before stimulus onset. Interstimulus intervals were 8 s. Detailed optical imaging procedures have been described previously (Chen et al., 2001, 2003)
For each stimulus condition, all trials were summed to maximize signal-to-noise ratio. Single-condition activation maps were obtained by subtracting individual frames from either the first frame image (baseline image before stimulus onset) obtained from each given vibrotactile stimulus or frames collected during the no-stimulus condition. For each image, regions of strongest activation were delineated by using a thresholding procedure or, in some cases, using statistical measurement (t test) (see Figs. 5, 7). In the thresholding procedure, the strongest activation in each single-condition map was identified by clipping pixels whose gray-scale pixel values (0–255 range) were >85% of the total pixel distribution within each image. In the statistical t test procedure, signal amplitude (average 1.5–3 s after stimulus onset) was compared with the signal 200 ms before stimulus onset.
Figure 5.

Effect of thresholding level on the location and size of activation revealed by optical imaging. a, d, Raw single-condition images of activations in response to D3 (a) and D4 (d) stimulation (sum of 53 trials) are clipped at two SDs and displayed. b, e, Activation areas are defined by outlining pixels for which the signal change was significant at p < 10−5(red), p < 10−4(green), and p < 10−3(blue) for D3 (b) and D4 (e), respectively. c, f, Activations derived at various thresholds are overlaid for comparison of activation size. Activation area as a function of threshold p values (normalized to the activation area at p < 10−5 = 100%) is shown in g. Scale bar, 1 mm.
Figure 7.

3D plots of fMRI and OIS activations. a–h, Four pairs of statistical activation maps of fMRI (top) and OIS (bottom) runs are shown: D3 and D4 from animal 1 (a–d) and D1 and D2 from animal 2 (e–h). Each pair of fMRI and OIS maps are aligned and displayed with the same field of view. The x- and y-axis indicate the aligned imaging plane in mm scale, and the z-axis indicates the t value associated with the mean difference between stimulus and baseline conditions in both fMRI and OIS maps. The mesh is color coded to reflect t value (blue, t ≤ 0; yellow/red, t > 0). For fMRI maps, corresponding p values were t = 5, p = 5 × 10⁻⁷; t = 8, p = 10−14; t = 10, p = 10−20; and t = 15, p = 10−35, respectively. For optical images, corresponding p values were t = 2, p = 0.02; t = 3, p = 10−3; and t = 4, p = 10−4, respectively. Arrows indicate activation center locations. Coordinates corresponding to t value peaks were used to calculate offsets between locations of fMRI and OIS activations.
Alignment of BOLD and OIS activation maps.
For image registration, we identified corresponding anatomical and blood-vessel landmarks in each image (see Fig. 6 d,e) (eight pairs of corresponding points); these coordinates were then put into a point-based registration algorithm (implemented in Matlab). These landmarks were selected without a priori knowledge of the location of functional activations. For each pair of OIS/fMRI images, the registration transformation between these two sets of coordinates was then applied to one activation image, thereby coregistering the OIS image to the fMRI image (cf. Hill et al., 1991; Chen et al., 2002). The resulting overlaps of activation zones in the image pairs were then examined.
Figure 6.
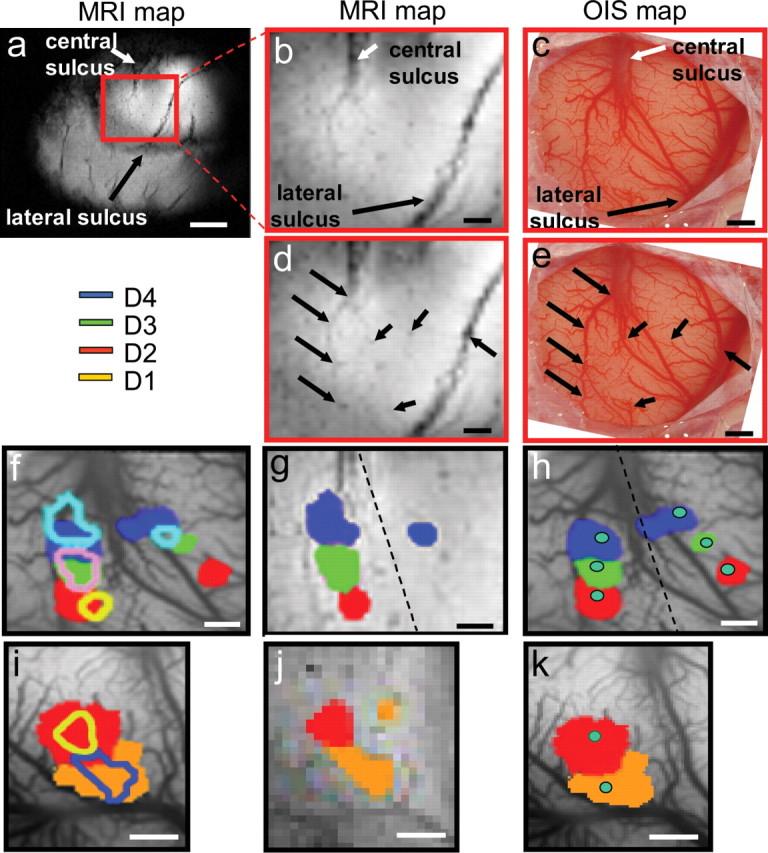
Comparison of somatotopic maps of fingerpads generated by fMRI, intrinsic optical imaging, and electrophysiology in the same animal. a–e, fMRI and optical maps were coregistered using landmarks (e.g., central and lateral sulci) visible on the cortical surface and identifiable vascular markers (black arrows) in both the T2*-weighted structural MR (a, b, d) and optical blood vessel images (c, e). g, h, j, k, Comparison of the composite activation maps obtained from fMRI (g, j) and optical imaging (h, k) for digits D2 (red), D3 (green), and D4 (blue) in monkey 1, and for D2 (red) and D1 (orange) in monkey 2, respectively. b–e are generated from monkey 1. Somatotopic maps of digits obtained from fMRI and optical imaging were overlaid in f (monkey 1) and i (monkey 2) for comparison. Green dots (h, k) indicate the electrode penetration locations where corresponding digit representation were identified. Scale bars: a, 5 mm; b–k, 1 mm. In monkey 1 (g), activations of D4 (blue) and D3 (green) are thresholded at p < 10−7 and D2 (red) at p < 10−8. j, In monkey 2, activations of D1 (orange) and D2 (red) are thresholded at p < 10−8.
To quantitatively compare the locations of BOLD and OIS activations, we generated, for each digit, three-dimensional (3D) mesh graphs of fMRI and OIS activations (see Fig. 7). We then determined the x–y coordinate of the activation center and calculated the distance between center locations in BOLD and OIS maps.
Electrophysiology.
A brief electrophysiological mapping procedure, guided by the previously acquired fMRI map, was used to locate the fingerpad region of areas 3b and 1 before optical imaging. Tungsten microelectrodes were inserted into superficial cortical layers. The responsive skin area of the unit activity was identified by initially palpating areas on the contralateral arm and hand while listening to the audio amplifier for spike activity. Then if the unit activity was located on the hand, the skin was lightly tapped with a 2 mm diameter probe or stroked with a cotton wisp. Area 3b units were discriminated on the basis of small receptive field size (restricted to a single fingerpad), brisk responsiveness to light tapping, and a lateral to medial topography of digits D1–D5. Area 1 units typically have larger receptive fields covering more than one finger (Sur et al., 1982). Area 3b was found anterior to the central sulcus (see Fig 2 d,h). Cortical representations of the distal fingerpads in area 3b and area 1 were segregated by the representations of the middle phalanges and palm (Sur et al., 1982). The receptive fields of multiple or single units were outlined through a series of indentations with a 2-mm-diameter hand-held probe.
Figure 2.

fMRI of digit topography in two monkeys. a–c, f, g, Single-condition activation maps of vibrotactile stimulation of D4 (a), D3 (b), and D2 (c) in monkey 1, and D2 (f) and D1 (g) in monkey 2. The significance levels of the activation-associated changes in BOLD signal in a–c and f and g are indicated by their respective color bars and corresponding p value ranges. Focal activation is observed in area 3b in all five images, and area 1 activation is also apparent in a and g. d, h, Composite maps of a–c in monkey 1 and f–g in monkey 2, respectively (different colors represent different digit activations: D4, blue; D3, green; D2, red; D1, orange). Two inserts show the enlarged view of the composite fingerpad maps. Scale bars: (in d) a–d, (in h) f–h, 5 mm; insets, 1 mm. e, Fingerpad topography in area 3b closely matches the known somatotopic map of squirrel monkey area 3b and area 1 [from Sur et al., (1982)]. i, The raw signal time course (signal amplitude in scanner arbitrary units) for a single run using block design (five cycles of 20 frames of stimulus/20 frames of baseline, corresponding to five 30 s blocks of stimulus and baseline) from D4 activation in area 3b (a). j, Time course of mean percentage signal for five blocks from the same run. The mean percentage signal changes (±SD; k) were highly reproducible and stable across three different sessions (days) in the same monkey (left), across three runs within the same session (same day) in one monkey (middle), and across seven different monkeys (right). In monkey 1, activations of D4 (a) and D3 (b) are thresholded at p < 10−7 and D2 at p < 10−8. In monkey 2, activations of D1 and D2 are thresholded at p < 10−8. a, Anterior; m, medial.
Results
These studies used a total of eight hemispheres in eight squirrel monkeys. Although we have imaged eight squirrel monkeys using fMRI, maps from one monkey contained blood-vessel noise contamination that limited our ability to perform quantitative analysis on that case; we therefore excluded that case from subsequent quantification. Three of the eight hemispheres (in three monkeys) were also imaged with OIS.
Fine fingerpad topography revealed by positive BOLD in areas 3b and 1
Eight squirrel monkeys were studied with fMRI. In each hemisphere of each squirrel monkey, we first obtained three oblique anatomical slices using a 3 cm transmit-receive surface coil positioned over somatosensory cortex (Fig. 1 a). This arrangement provided relatively uniform sensitivity and higher signal/noise ratio in a mapping plane similar to that obtained with OIS, permitting direct coregistration of fMRI and OIS maps. Clear landmarks that are available in the squirrel monkey brain, such as the central and lateral sulci (Fig. 1 b), can be seen in the top slice (Fig. 1 c, slice 1). Deeper slices (Fig. 1 c, slices 2, 3) can be used to study areas that are buried within sulci such as SII (second somatosensory cortex).
Figure 2 shows single-condition activation maps collected from SI during individual 8 Hz vibrotactile stimulation of digits D2, D3, and D4 in monkey 1 (Fig. 2 a–c) (thresholded at p < 10−7 for D3 and D4 and p < 10−8 for D2) and D1 and D2 in monkey 2 (Fig. 2 f–g) (thresholded at p < 10−8 for D1 and D2). We typically observed activation in area 3b (Fig. 2 d,h, overlays) with weaker activation in area 1. In monkey 1, the stimulus elicited distinct focal activations in area 3b for each of the digits (Fig. 2 a–c). The area of activation for each digit extended ∼1 mm in area 3b. Consistent with previous optical imaging and electrophysiological studies, adjacent-digit activations were separated by ∼1 mm. For digit D4 (Fig. 2 a), a smaller activation was observed at a more posterior location corresponding to area 1 (Fig. 2 d, composite). In monkey 2, individual stimulation of D1 and D2 produced robust, focal, and somatotopically organized activations in area 3b (Fig. 2 f–g, composite in h). Consistent with previous maps in the squirrel monkey revealed by electrophysiology (Sur et al., 1982) and by optical imaging (Chen et al., 2001), the somatotopic organization was similar across seven monkeys. Interdigit activation distances support this similarity: across seven cases, the average peak distances between digits 2 and 3 (n = 4), digits 3 and 4 (n = 8), and digits 2 and 4 (n = 5) were 1.25, 1.07, and 2.04 mm, respectively. Thus, the average adjacent interdigit distance between nonadjacent digits is approximately two times the average distance between adjacent digits.
We further evaluated the quality of the fMRI signal by examining the response and consistency of signal amplitude over time within the same animal and across animals. As shown in Figure 2 i, the signal time course was well correlated with the periods of stimulus presentation and interstimulus intervals. Typical of fMRI signal sizes, the amplitude of signal change was on the order of 0.5–1.0% (Fig. 2 j). The average signal changes in the same animal across runs within one imaging session (within 1 d; 0.58 ± 0.27%) (Fig. 2 k, middle), across sessions (on different days; 0.56 ± 0.15%) (Fig. 2 k, left), and across animals (n = 7; 0.60 ± 12%) (Fig. 2 k, right) were not significantly different.
A concern with fMRI image analysis is that the choice of statistical threshold may influence which voxels are considered activated and the subsequent interpretation of activation patterns. To address this issue, we compared the spatial extent of significant BOLD signal change for activation maps generated at three different (low end) statistical threshold levels: p < 10−5, p < 5 × 10⁻⁵, and p < 10−4 (not corrected for multiple comparisons). As shown in Figure 3, lower thresholds resulted in slightly larger activation regions (Fig. 3, compare a–c, e–g). In the two examples shown, activation areas increased up to ∼2.5 times over these three threshold levels (Fig. 3 i). Importantly however, these activations remained centered at the same topographic locations, did not recruit additional regions, and retained topographic organization (Fig. 3 d,h, overlays). This demonstrates that, for the p values examined, the findings we report here are not dependent on the specific activation thresholds chosen. These findings, together with the consistency of the signal time course and topographic organization, strongly support the conclusion that these fMRI signals are stimulus related and not artifactual.
Figure 3.

Effect of different image thresholds on the location and size of BOLD fMRI activation. a–h, Area of D1 activation in case 1 (a–c) and D3 activation in case 2 (e–g) decrease with increasing stringency of thresholding (p < 10−4; p < 5 × 10⁻⁵; and p < 10−5), but composite overlays (d, h) confirm that essential topography and the centroid of activation are unchanged. i, The activation area increases with increasing p value threshold for D1 in case 1 and D3 in case 2 (area relative to area at p < 10−5, defined as 100%). Compared with the activation areas at p < 10−5, areas measured at p < 5 × 10⁻⁵ increased 67.5% for D1 and 81.7% for D3; areas measured at p < 10−4 sizes increased 73.5% for D1 and 135.9% for D3. Scale bars, 1 mm.
Intraindividual optical imaging of fine fingerpad topography
In three of the animals (three hemispheres) studied by fMRI, we also examined digit topography with optical imaging. We first mapped the region near the central sulcus electrophysiologically to determine the locations of digit representation within areas 3b and 1 (Fig. 4 d,g, color dots). Optical images were then acquired from this region during stimulation of distal fingerpads with stimuli identical to those used for the fMRI sessions (for details see Materials and Methods). Optical images revealed activations in both areas 3b and 1 in response to D4, D3, and D2 stimulation in monkey 1 (Fig. 4 a–c) and activations in area 3b in response to D2 and D1 stimulation in monkey 2 (Fig. 4 e,f). Consistent with previous optical imaging studies, digit activations are ∼1 mm2 in size in area 3b and somewhat smaller in area 1. D1 to D4 topography progresses in the lateral-to-medial direction in both areas 3b and 1, consistent with the electrophysiology maps (Fig. 4 d,g).
Figure 4.

Optical imaging of area 3b and area 1 in response to digit stimulation in the same squirrel monkeys imaged with fMRI. a–c, e, f, Focal activations were obtained in single condition optical images in response to D4 (a), D3 (b), and D2 (c) stimulation in monkey 1, and to D2 (e) and D1 (f) stimulation in monkey 2. Stronger activations in area 3b and weaker ones in area 1 are seen in monkey 1 (a–c). The approximate border between areas 3b and 1 is indicated by the dotted line in d and g. Small color dots (a–g) indicate the electrode penetration locations for electrophysiological recording. Digits recorded are indicated by color code: D4, blue; D3, green; D2, red; and D1, orange. Summary overlays of a–c in monkey 1 and e–f in monkey 2 are shown in d and g, respectively. Scale bars, 1 mm. m, Medial; p, posterior.
Similar to the approach we took on the fMRI data, to ensure the activation maps obtained with optical imaging were not dependent on the specific thresholding procedure, we analyzed the optical imaging data at multiple threshold levels. For each stimulus condition, we performed t tests between stimulus and no-stimulus periods and thresholded the resulting maps at p < 10−3, p < 10−4, and p < 10−5. As shown in Figure 5(a,d, raw maps, b,e, threshold overlays), there was virtually no shift in the location of activation with changing threshold (Fig. 5 c,f). Furthermore, the activations remained focal and exhibited minimal recruitment of additional activation zones (one small spot seen in area 1 in Fig. 5 d,e). In parallel with our results with fMRI (Fig. 3), there was up to a 2.5-fold increase in activation size with decreasing threshold (Fig. 5 g): lower thresholds resulted in slightly larger activation areas, with an ∼30% increase from p < 10−5 to p < 10−4 and ∼100% increase from p < 10−4 to p < 10−3 (increase for p < 10−5 to p < 10−4, 27% in D3 and 37% in D4; increase for p < 10−4 to p < 10−3, 61% in D3 and 134% in D4). Despite these increases in area with decreasing threshold, topographic organization was still maintained. Thus our conclusions in this report regarding topographic specificity are consistent across BOLD and OIS methodologies and are not dependent on the precise threshold level used.
Similar maps with BOLD and OIS
Somatotopic maps of area 3b obtained by fMRI were compared with those collected in the same animal using optical imaging and electrophysiology. BOLD and OIS images were coregistered using a semiautomatic point-based registration algorithm (for details, see Material and Methods). Corresponding landmarks, such as matching vascular and structural features (lateral and central sulci) visible on the cortical surface, were selected in the structural MRI and optical maps (Fig. 6, compare b, c). In some cases, even some of the smaller vessels are visible in the fMRI and were used as additional alignment landmarks (Fig. 6 d,e, arrows). Figure 6 illustrates the alignment of the somatotopic maps in area 3b mapped by fMRI and by optical imaging for digits D2, D3, and D4 in one animal (Fig. 6, compare g, h), and for D1 and D2 in a second animal (Fig. 6, compare j, k) under the same conditions of anesthesia and stimulation. In most cases (e.g., D3 in animal one and D1, D2 in animal 2), the locations and relative spacing of digit activations were closely matched. For D4 in animal 1, more spatial offset between the fMRI and OIS maps is apparent. This offset may be attributable to the proximity to large blood vessels (Fig. 6 f), where activations are more vulnerable to vascular and hemodynamic noise contamination. In general, with both methods, single-digit activations were ∼1 mm2 in size and were spaced ∼1 mm apart.
To further examine the similarity between the fMRI and OIS maps, we plotted the activation distribution (as measured by statistical significance, t values), and measured the activation peak locations of fMRI and OIS maps. Activation shape and peak locations identified in fMRI and OIS activation maps for four digits from two animals are illustrated in Figure 7(a–d, animal 1, e–h, animal 2). For the four pairs of fMRI and OIS maps examined, the average activation location difference was 0.14 mm (range, 0.06–0.22 mm). We also examined the variability in trial-to-trial peak location within single fMRI sessions (average, 0.21 ± 0.07 mm, four sessions in four animals). Thus, the difference in location of OIS and fMRI activation is within the variability of fMRI localization for any given digit, indicating that the locations of the OIS and fMRI activations are not significantly different. Given the differences in methodology, the likelihood of residual anatomic coregistration errors arising from slight differences in plane of imaging, and the different signal-to-noise ratios, this degree of alignment is quite remarkable and suggests the equivalence of somatotopic maps generated by high-field BOLD fMRI and optical imaging.
BOLD reveals the representation of funneling illusory stimuli in area 3b
To further investigate the limits of spatial resolution, we next investigated whether high field BOLD fMRI could resolve the submillimeter activation shifts in area 3b previously identified as neural correlates of the tactile funneling illusion (Chen et al., 2003). In the funneling illusion, simultaneous vibrotactile stimulation of two points on the skin produces the tactile illusory sensation of a central stimulated point (at a location where no actual stimulus is delivered); psychophysically, this “funneled” sensation is stronger in magnitude than the sensation produced by either single point stimulus alone (Gardner and Spencer, 1972; Hashimoto et al., 1999). A neural correlate of this spatially mislocalized illusory percept was identified by optical imaging in area 3b in response to simultaneous stimulation of adjacent pairs of digit tips. Specifically, this stimulus condition elicited a submillimeter shift in activation to a central merged (funneled) location between adjacent digit tips (Chen et al., 2003). The next series of fMRI experiments examined whether this submillimeter activation shift could be mapped by high field BOLD fMRI.
Figure 8 summarizes the results of fMRI mapping of SI under conditions of single- and paired-digit stimulation. Two cases are shown. Individual stimulation of D3 and D4 generated distinct activations (Fig. 8 a,e, respectively). Zooming in on area 3b (Fig. 8 b,d,f, turquoise rectangle) revealed well resolved activation foci ∼1 mm in size separated by ∼1 mm. Simultaneous stimulation of D3 and D4 produced a single, focal activation, midway between the activation centers generated by stimulation of D3 and D4 alone (Fig. 8 d; for comparison, centers of activation locations are indicated by dotted red vertical lines). Similar results were obtained in all five hemispheres tested with funneling stimuli (a third funneling example with D1 and D2 stimulation is shown in Fig. 9 a). Consistent with optical imaging studies and with psychophysics (Gardner and Spencer, 1972; Hashimoto et al., 1999; Chen et al., 2003), stimulation of nonadjacent digits showed no merging (Fig. 9 b, D2 plus D4 stimulus condition) [compare Chen et al. (2003), their Fig. 1].
Figure 8.

fMRI reveals the representation of funneling illusory stimuli in area 3b. Two cases are shown (case 1, left; case 2, right). a, b, e, f, For each case, stimulation of single digits D3 (a, b) and D4 (e, f) generated single focal activations organized somatotopically in area 3b (a and e within the blue outline shown in a, shown expanded in b, f). c, d, Stimulation of paired adjacent digits (D3+D4) generated a single focal activation in area 3b, located between the sites of activation during stimulation of D3 (b) and D4 alone (f) (corresponding activation centers are indicated by red dashed lines). Activation is also evident in area 1 (c, d) during simultaneous stimulation of D3+D4 in this case. The color scale from red to yellow (case 1, p < 10−7 to p < 10−15; case 2, p < 10−10 to 10−13; see respective color bar scales) in each activation map indicates the significance level. Scale bars, 1 mm. p, Posterior; l, lateral.
Figure 9.

Comparison of amplitudes of regional fMRI signal change during single and simultaneous stimulation of adjacent (a–c) and nonadjacent (d–f) digits. Spatially shifted (centered) activation was observed in area 3b (a) during simultaneous stimulation of adjacent digits (D1+D2) whereas two separate activations are obtained at each site (D2 and D4) during simultaneous stimulation of nonadjacent digits (D2+D4) (d). Quantitative analysis of the percentage signal change at sites corresponding to individual activation of D1 alone, D2 alone, and D1+D2 (a), or D2 alone, D4 alone, and D2+D4 (d) are shown in b and c (adjacent digit pair) and e and f (nonadjacent pair), respectively. The strongest percentage BOLD signal changes were obtained at D1 or D2 activation sites during individual stimulation of adjacent D1 (b, white columns) or D2 (b, dark columns), and at D2 or D4 activation sites during individual stimulation of nonadjacent D2 (e, white columns) or D4 (e, dark columns). In contrast, the strongest percentage BOLD signal change (c, middle black column) is observed at the midway location (regions analyzed are shown as white boxes in a and d) during simultaneous stimulation of adjacent digits D1+D2 whereas comparable percentage signal changes (e, f) were obtained at D2 and D4 locations (d) during simultaneous stimulation of nonadjacent digits D2+D4. The color scale from red to yellow in each activation map indicates the significance level from p = 10−7 to 10−15 in both a and d. Scale bar, 1 mm.
To quantify the spatial shift in activation, we used an MI ranging from 0 (center of one digit location) to 1 (center of second digit location) (see Materials and Methods). The MI for the case shown in Figure 8 a–f is 0.53, indicating that activation was located between D3 and D4. The average MI for all cases of adjacent digits was 0.55 ± 0.1 (mean ± SEM), in excellent agreement with the MI of 0.54 ± 0.13 measured in previous optical-imaging studies (Chen et al., 2003). This demonstrates that, without additional contrast agents, high-field fMRI can resolve submillimeter shifts in activation.
Agreement of BOLD signal amplitude with optical imaging signal in representing funneling illusory stimuli
Our previous optical-imaging studies showed that the funneling illusion results in a change in activation profile: simultaneous stimulation of two adjacent digits results in an increase in activation at the central merged site and suppression of activation at the stimulated sites (Chen et al., 2003). This change in activation profile at the central merged site does not result from a simple linear combination of maps derived from single-digit activations. The present fMRI data confirm this previous observation (Fig. 9). In Figure 9 a, D1 and D2 were simultaneously stimulated, resulting in a single activation spot at a location between the D1 and D2 representations. Figure 9, b and c, quantifies the activation amplitudes at each of three locations: the area activated by D1 (left), D2 (right), and simultaneous D1 plus D2 (middle) stimulation (Fig. 9 a, white boxes indicate sampled locations). Stimulation of D1 alone produced strong activation at the D1 site and little activation elsewhere (Fig. 9 b, white columns). Similarly, stimulation of D2 alone produced strong activation at the D2 site and little activation elsewhere (Fig. 9 b, dark columns). In contrast, stimulation of D1 plus D2 (Fig. 9 c) resulted in little activation at either the D1 (left column) or D2 (right column) sites, but strong activation at the central site (middle column); the amplitude at this central site is much greater than the sum of individual D1 and D2 stimulations at this site (Fig. 9 b, compare columns).
This nonlinear summation effect was not seen with nonadjacent digit stimulation (Fig. 9 d–f, D2+D4). Simultaneous stimulation of nonadjacent digits D2 and D4 resulted in two activations: one at the D2 site, one at the D4 site, and none in between these sites (Fig. 9 d). Comparison of activation magnitudes revealed three things. First, individual stimulation of D2 or D4 alone evoked strongest activations at D2 (Fig. 9 e, white columns) and D4 (Fig. 9 e, dark columns) sites, respectively. Second, paired D2 plus D4 stimulation (Fig. 9 f) resulted in lower magnitude at each of the D2 and the D4 sites than the sums of single-digit activations (Fig. 9, compare e, sum of D2 activations, left columns, f, D2 column; and e, sum of D4 activations, right columns, f, D4 column), indicative of suppressive influences with paired stimulation. Third, and in important contrast to adjacent-digit activation, the location in between D2 and D4 exhibited little activation during simultaneous D2 plus D4 stimulation (Fig. 9 f, D3 column). These results were all in excellent agreement with previous optical imaging experiments (Chen et al., 2003) and confirm the ability of high-field BOLD fMRI to appropriately resolve both spatial and amplitude differences at the submillimeter scale.
Discussion
Summary
In this study, we used positive BOLD fMRI (without contrast agents) and OIS to map the somatotopic representations of the distal fingerpads in SI of the same squirrel monkeys. The fMRI maps revealed distinct focal activations of individual fingerpads in area 3b, organized in a medial to lateral order from D4 to D1. Coregistration of fMRI and OIS maps based on cortical landmarks confirmed that the locations and areas of individual digit receptive fields were in close agreement. Furthermore, consistent with previous OIS results, BOLD activation resolved the ∼500 μm spatial shift in single condition cortical activation maps accompanying the “tactile funneling illusion.” Thus, the positive BOLD signal can be used to achieve submillimeter spatial resolution. These observations weaken previous notions regarding poorer spatial specificity of the positive BOLD mapping signal relative to OIS and strengthen the correlation between the initial dip and the late positive BOLD.
Methodology
Stable, reproducible maps
Several factors contribute to the stability and reproducibility of these high-resolution fMRI maps. First, the relatively subtle and focal nature of the stimuli generate very small changes in deoxyhemoglobin in draining veins leading to a notable absence of contaminating extravascular BOLD signals from draining veins and venules. Second, at high magnetic field, the short T2 of the intravascular signal (∼9 ms vs ∼40 ms for tissue) (Lee et al., 1999) greatly reduces its contribution from large and small vessels. Thus, the increased spatial resolution available with high field BOLD fMRI can be attributed in part to the increased signal-to-noise ratio, allowing reduced voxel volumes, and in part to decreased artifact from draining vessels. Furthermore, although the theoretical spatial resolution of the EPI data (625 × 625 μm in plane resolution) is determined by the matrix size, under high-signal/noise conditions, the centroid of each activation can be localized to within the spatial resolution limit so that submillimeter shifts can be detected. From our experiments, the areas activated by our stimuli do not extend over large diffuse regions, but at high field they are highly localized and ∼1 mm in extent. As such, we are able to detect shifts on this scale. The third factor is our attention to fine-tuned anesthesia levels and stable physiological conditions of the animal: expired CO2 and blood oxygenation and TR in the fMRI sequence were constantly monitored and adjusted to provide a stable BOLD signal baseline. Under these conditions, the BOLD signal amplitude (0.5–1%) remained stable across runs within single sessions, across multiple sessions, and across subjects (Fig. 2 i), and were comparable with those in previous studies at 9.4T (Schafer et al., 2006).
It is noteworthy that changing the statistical threshold in the fMRI and optical activation maps led to relatively small changes in the area of activation and did not alter their locations. Over the range of thresholds explored, no spurious or unanticipated activations appeared. This robustness across threshold levels suggests that these focal activations were not artifactual byproducts of inappropriate thresholding.
Differences between OIS/fMRI stimulation paradigm
In both fMRI and OIS experiments, we used the same tactile probes, stimulation rates and amplitudes, and anesthesia methods. However, there were differences between these paradigms. The stimuli were delivered in 30 and 4 s blocks for the fMRI and the OIS studies, respectively. Other OIS paradigms that have used longer periods of image acquisition (Kalatsky and Stryker, 2003; Nelken et al., 2004) reveal strong similarity of maps obtained with long acquisition and the traditional interleaved method. Despite these differences, the topographies obtained are remarkably similar. Thus, differences in stimulation paradigm do not qualitatively change the imaged topography or the alignment of the maps. These results confirm the equivalence of the maps regardless of the particular stimulation paradigm.
Precision of alignment
Alignment precision depends heavily on the precision of map coregistration and variability in signal/noise. Possible contributors to signal variability include variability in physiological baseline and proximity to large blood vessels. As a result, alignment may be better in some cases than others (e.g., in Fig. 6, D2 and D3 exhibit better alignment than D4, which is near two large vessels). In summary, despite the limitations imposed by signal variability, coregistration errors, and differences in stimulation paradigms, there was robust agreement of the OIS and fMRI topographies.
Previous studies showing high spatial resolution of BOLD signal
Because cortical columns are believed to be the building blocks of cerebral cortical function, revealing functional structures at the millimeter and submillimeter scale is critical to understanding brain function. Higher-field-strength fMRI allows higher spatial and temporal resolution mapping in both animals and humans (Duong et al., 2000; Cheng et al., 2006) (for review, see Harel et al., 2006b). At the submillimeter level, for example, previous studies have shown that the initial negative BOLD (the initial dip) (Duong et al., 2000, 2001), CBF signal (Duong et al., 2001; Kim and Duong, 2002) and CBV-based fMRI (Zhao et al., 2005) can resolve columnar and laminar organization in sensory cortices and retina (Logothetis et al., 2002; Silva and Koretsky, 2002; Lu et al., 2004; Sheth et al., 2004; Zhao et al., 2005; Cheng et al., 2006; Fukuda et al., 2006; Harel et al., 2006a). Although our BOLD images were acquired at the same field strength (9.4T) as reported by Duong et al. (2000), we did not detect any initial negative BOLD signal. This may be because of our lower temporal sampling rate [TR, 1.5–2 s vs 500 ms in the study by Duong et al. (2000)], differences in baseline vascular and hemodynamic status, and differences in stimulus characteristics (low-intensity focal vs high-intensity large visual field stimulation). In humans, resolution of millimeter-scale ocular dominance and orientation domains in primary visual cortex was achieved at 4T in subjects with optimal cortical geometries using optimized surface coils and extreme head stabilization efforts (Cheng et al., 2001). Additional refinement of these approaches (Yacoub et al., 2005; Harel et al., 2006b; Norris, 2006) promises to provide answers to many functional organizational and evolutionary questions on cortical organization (e.g., whether submillimeter functional units exist in human cerebral cortex).
Correlation of BOLD, OIS, and electrophysiology: linkage between human and animal studies
In human studies, OIS maps showed better correlation with electrophysiological maps than did BOLD maps, although better correlation with the initial negative BOLD component has been suggested (Cannestra et al., 2001). In line with this observation, BOLD activation maps exhibited considerable spatial variation compared with electrophysiologically defined maps in monkeys (Disbrow et al., 2000). These findings focused attention on whether differences in maps obtained with different techniques are caused by technical limitations, the specific cortical area studied, or inherent differences in the different mapping signals (Kim et al., 2000; Cannestra et al., 2001, 2004). The current study suggests parallels between the BOLD and OIS, at least for our mapping paradigm in SI of the anesthetized monkey. The possibility remains that such parallels may not always be obtained. It is worth noting that, although in general the fMRI and OIS maps appear very similar, the degree of similarity must be interpreted with caution, because quantitative comparison is dependent on the precision of map coregistration methods.
The relationships between the BOLD signal and local electrophysiology remain poorly understood, but fMRI studies in nonhuman primates have contributed dramatically to system and cognitive neuroscience, as well as to our understanding of the biophysical basis of the fMRI signal (Denys et al., 2004; Gamlin et al., 2006; Gretton et al., 2006; Shmuel et al., 2006). Furthermore, fMRI studies on nonhuman primates can provide a link between decades of studies with single/multiple unit and/or local field potential recordings conducted in behaving monkeys and fMRI studies in humans (Vanduffel et al., 2002; Orban et al., 2003; Tsao et al., 2006). The positive BOLD signal has been shown to correlate more strongly with local field potentials than with single-unit recordings (Logothetis et al., 2001; Kayser et al., 2004), and negative BOLD signal changes are associated with reduced neuronal activity (Shmuel et al., 2006). Interestingly however, apparent mismatches between electrophysiological and BOLD (or OIS) responses have been reported in the prefrontal cortex of awake monkeys (Disbrow et al., 2000; Sawamura et al., 2006). Thus, whether other possible contributions to the BOLD become more prominent under certain contexts remains to be further established.
Conclusions
This study reports the first direct comparison of somatotopic maps in the same animal obtained using high-field BOLD fMRI and optical imaging, and also demonstrates sub-submillimeter spatial resolution mapping of cortical activity using high-field positive BOLD fMRI (without contrast agents). These results confirm the topographic equivalence of these methods and suggest that fMRI is an effective and appropriate tool for mapping the functional topography of brain areas not easily accessible using other methods. Moreover, these results suggest a significant correlation between the intrinsic optical signal, believed to correspond to the negative initial dip, and the late positive BOLD.
Footnotes
This work was supported by National Institutes of Health Grants NS044375 (A.W.R.), DE16606 (L.M.C.), EB000461, and EB002326 (J.C.G.), and a Vanderbilt University Medical Center Discovery grant (M.J.A.). We thank Dr. Haidong Lu for assistance on optical imaging data analysis, Dr. Tuhin Sinha for his help on BOLD and OIS image alignment, and Heather Scott for excellent technical assistance. The Vanderbilt Center for Integrative and Cognitive Neuroscience and the Vanderbilt University Institute of Imaging Science provided essential engineering and technical support.
References
- Cannestra AF, Pouratian N, Bookheimer SY, Martin NA, Beckerand DP, Toga AW. Temporal spatial differences observed by functional MRI and human intraoperative optical imaging. Cereb Cortex. 2001;11:773–782. doi: 10.1093/cercor/11.8.773. [DOI] [PubMed] [Google Scholar]
- Cannestra AF, Pouratian N, Forage J, Bookheimer SY, Martin NA, Toga AW. Functional magnetic resonance imaging and optical imaging for dominant-hemisphere perisylvian arteriovenous malformations. Neurosurgery. 2004;55:804–812. doi: 10.1227/01.neu.0000137654.27826.71. [DOI] [PubMed] [Google Scholar]
- Chen LM, Friedman RM, Ramsden BM, LaMotte RH, Roe AW. Fine-scale organization of SI (area 3b) in the squirrel monkey revealed with intrinsic optical imaging. J Neurophysiol. 2001;86:3011–3029. doi: 10.1152/jn.2001.86.6.3011. [DOI] [PubMed] [Google Scholar]
- Chen LM, Heider B, Williams GV, Healy FL, Ramsden BM, Roe AW. A chamber and artificial dura method for long-term optical imaging in the monkey. J Neurosci Methods. 2002;113:41–49. doi: 10.1016/s0165-0270(01)00475-7. [DOI] [PubMed] [Google Scholar]
- Chen LM, Friedman RM, Roe AW. Optical imaging of a tactile illusion in area 3b of the primary somatosensory cortex. Science. 2003;302:881–885. doi: 10.1126/science.1087846. [DOI] [PubMed] [Google Scholar]
- Cheng H, Nair G, Walker TA, Kim MK, Pardue MT, Thule PM, Olson DE, Duong TQ. Structural and functional MRI reveals multiple retinal layers. Proc Natl Acad Sci USA. 2006;103:17525–17530. doi: 10.1073/pnas.0605790103. [DOI] [PMC free article] [PubMed] [Google Scholar]
- Cheng K, Waggoner RA, Tanaka K. Human ocular dominance columns as revealed by high-field functional magnetic resonance imaging. Neuron. 2001;32:359–374. doi: 10.1016/s0896-6273(01)00477-9. [DOI] [PubMed] [Google Scholar]
- Denys K, Vanduffel W, Fize D, Nelissen K, Sawamura H, Georgieva S, Vogels R, Van Essen D, Orban GA. Visual activation in prefrontal cortex is stronger in monkeys than in humans. J Cogn Neurosci. 2004;16:1505–1516. doi: 10.1162/0898929042568505. [DOI] [PubMed] [Google Scholar]
- Disbrow EA, Slutsky DA, Roberts TP, Krubitzer LA. Functional MRI at 1.5 tesla: a comparison of the blood oxygenation level-dependent signal and electrophysiology. Proc Natl Acad Sci USA. 2000;97:9718–9723. doi: 10.1073/pnas.170205497. [DOI] [PMC free article] [PubMed] [Google Scholar]
- Duong TQ, Kim DS, Ugurbil K, Kim SG. Spatiotemporal dynamics of the BOLD fMRI signals: toward mapping submillimeter cortical columns using the early negative response. Magn Reson Med. 2000;44:231–242. doi: 10.1002/1522-2594(200008)44:2<231::aid-mrm10>3.0.co;2-t. [DOI] [PubMed] [Google Scholar]
- Duong TQ, Kim DS, Ugurbil K, Kim SG. Localized cerebral blood flow response at submillimeter columnar resolution. Proc Natl Acad Sci USA. 2001;98:10904–10909. doi: 10.1073/pnas.191101098. [DOI] [PMC free article] [PubMed] [Google Scholar]
- Frostig RD, Lieke EE, Ts'o DY, Grinvald A. Cortical functional architecture and local coupling between neuronal activity and the microcirculation revealed by in vivo high-resolution optical imaging of intrinsic signals. Proc Natl Acad Sci USA. 1990;87:6082–6086. doi: 10.1073/pnas.87.16.6082. [DOI] [PMC free article] [PubMed] [Google Scholar]
- Fukuda M, Moon CH, Wang P, Kim SG. Mapping iso-orientation columns by contrast agent-enhanced functional magnetic resonance imaging: reproducibility, specificity, and evaluation by optical imaging of intrinsic signal. J Neurosci. 2006;26:11821–11832. doi: 10.1523/JNEUROSCI.3098-06.2006. [DOI] [PMC free article] [PubMed] [Google Scholar]
- Gamlin PD, Ward MK, Bolding MS, Grossmann JK, Twieg DB. Developing functional magnetic resonance imaging techniques for alert macaque monkeys. Methods. 2006;38:210–220. doi: 10.1016/j.ymeth.2005.08.004. [DOI] [PubMed] [Google Scholar]
- Gardner EP, Spencer WA. Sensory funneling. II. Cortical neuronal representation of patterned cutaneous stimuli. J Neurophysiol. 1972;35:954–977. doi: 10.1152/jn.1972.35.6.954. [DOI] [PubMed] [Google Scholar]
- Gretton A, Belitski A, Murayama Y, Scholkopf B, Logothetis N. The effect of artifacts on dependence measurement in fMRI. Magn Reson Imaging. 2006;24:401–409. doi: 10.1016/j.mri.2005.12.036. [DOI] [PubMed] [Google Scholar]
- Grinvald A, Lieke E, Frostig RD, Gilbert CD, Wiesel TN. Functional architecture of cortex revealed by optical imaging of intrinsic signals. Nature. 1986;324:361–364. doi: 10.1038/324361a0. [DOI] [PubMed] [Google Scholar]
- Harel N, Lin J, Moeller S, Ugurbil K, Yacoub E. Combined imaging-histological study of cortical laminar specificity of fMRI signals. NeuroImage. 2006a;29:879–887. doi: 10.1016/j.neuroimage.2005.08.016. [DOI] [PubMed] [Google Scholar]
- Harel N, Ugurbil K, Uludag K, Yacoub E. Frontiers of brain mapping using MRI. J Magn Reson Imaging. 2006b;23:945–957. doi: 10.1002/jmri.20576. [DOI] [PubMed] [Google Scholar]
- Hashimoto I, Yoshikawa K, Kimura T. Sensory funneling of liminal multiple-point air-puff stimulation produces dramatic reduction in reaction time but relatively invariant P300 somatosensory evoked potential. NeuroReport. 1999;10:3201–3205. doi: 10.1097/00001756-199910190-00014. [DOI] [PubMed] [Google Scholar]
- Hill DL, Hawkes DJ, Crossman JE, Gleeson MJ, Cox TC, Bracey EE, Strong AJ, Graves P. Registration of MR and CT images for skull base surgery using point-like anatomical features. Br J Radiol. 1991;64:1030–1035. doi: 10.1259/0007-1285-64-767-1030. [DOI] [PubMed] [Google Scholar]
- Kalatsky VA, Stryker MP. New paradigm for optical imaging: temporally encoded maps of intrinsic signal. Neuron. 2003;38:529–545. doi: 10.1016/s0896-6273(03)00286-1. [DOI] [PubMed] [Google Scholar]
- Kayser C, Kim M, Ugurbil K, Kim DS, Konig P. A comparison of hemodynamic and neural responses in cat visual cortex using complex stimuli. Cereb Cortex. 2004;14:881–891. doi: 10.1093/cercor/bhh047. [DOI] [PubMed] [Google Scholar]
- Kim DS, Duong TQ, Kim SG. High-resolution mapping of iso-orientation columns by fMRI. Nat Neurosci. 2000;3:164–169. doi: 10.1038/72109. [DOI] [PubMed] [Google Scholar]
- Kim SG, Duong TQ. Mapping cortical columnar structures using fMRI. Physiol Behav. 2002;77:641–644. doi: 10.1016/s0031-9384(02)00901-0. [DOI] [PubMed] [Google Scholar]
- Lee SP, Silva AC, Ugurbil K, Kim SG. Diffusion-weighted spin-echo fMRI at 9.4 T: microvascular/tissue contribution to BOLD signal changes. Magn Reson Med. 1999;42:919–928. doi: 10.1002/(sici)1522-2594(199911)42:5<919::aid-mrm12>3.0.co;2-8. [DOI] [PubMed] [Google Scholar]
- Logothetis N, Merkle H, Augath M, Trinath T, Ugurbil K. Ultra high-resolution fMRI in monkeys with implanted RF coils. Neuron. 2002;35:227–242. doi: 10.1016/s0896-6273(02)00775-4. [DOI] [PubMed] [Google Scholar]
- Logothetis NK, Pauls J, Augath M, Trinath T, Oeltermann A. Neurophysiological investigation of the basis of the fMRI signal. Nature. 2001;412:150–157. doi: 10.1038/35084005. [DOI] [PubMed] [Google Scholar]
- Lu H, Patel S, Luo F, Li SJ, Hillard CJ, Ward BD, Hyde JS. Spatial correlations of laminar BOLD and CBV responses to rat whisker stimulation with neuronal activity localized by Fos expression. Magn Reson Med. 2004;52:1060–1068. doi: 10.1002/mrm.20265. [DOI] [PubMed] [Google Scholar]
- Malonek D, Grinvald A. Vascular regulation at sub millimeter range. Sources of intrinsic signals for high resolution optical imaging. Adv Exp Med Biol. 1997;413:215–220. [PubMed] [Google Scholar]
- Marota JJ, Ayata C, Moskowitz MA, Weisskoff RM, Rosen BR, Mandeville JB. Investigation of the early response to rat forepaw stimulation. Magn Reson Med. 1999;41:247–252. doi: 10.1002/(sici)1522-2594(199902)41:2<247::aid-mrm6>3.0.co;2-u. [DOI] [PubMed] [Google Scholar]
- Nelken I, Bizley JK, Nodal FR, Ahmed B, Schnupp JW, King AJ. Large-scale organization of ferret auditory cortex revealed using continuous acquisition of intrinsic optical signals. J Neurophysiol. 2004;92:2574–2588. doi: 10.1152/jn.00276.2004. [DOI] [PubMed] [Google Scholar]
- Norris DG. Principles of magnetic resonance assessment of brain function. J Magn Reson Imaging. 2006;23:794–807. doi: 10.1002/jmri.20587. [DOI] [PubMed] [Google Scholar]
- Orban GA, Fize D, Peuskens H, Denys K, Nelissen K, Sunaert S, Todd J, Vanduffel W. Similarities and differences in motion processing between the human and macaque brain: evidence from fMRI. Neuropsychologia. 2003;41:1757–1768. doi: 10.1016/s0028-3932(03)00177-5. [DOI] [PubMed] [Google Scholar]
- Pouratian N, Sicotte N, Rex D, Martin NA, Becker D, Cannestra AF, Toga AW. Spatial/temporal correlation of BOLD and optical intrinsic signals in humans. Magn Reson Med. 2002;47:766–776. doi: 10.1002/mrm.10096. [DOI] [PubMed] [Google Scholar]
- Sato K, Nariai T, Sasaki S, Yazawa I, Mochida H, Miyakawa N, Momose-Sato Y, Kamino K, Ohta Y, Hirakawa K, Ohno K. Intraoperative intrinsic optical imaging of neuronal activity from subdivisions of the human primary somatosensory cortex. Cereb Cortex. 2002;12:269–280. doi: 10.1093/cercor/12.3.269. [DOI] [PubMed] [Google Scholar]
- Sawamura H, Orban GA, Vogels R. Selectivity of neuronal adaptation does not match response selectivity: a single-cell study of the fMRI adaptation paradigm. Neuron. 2006;49:307–318. doi: 10.1016/j.neuron.2005.11.028. [DOI] [PubMed] [Google Scholar]
- Schafer JR, Kida I, Xu F, Rothman DL, Hyder F. Reproducibility of odor maps by fMRI in rodents. NeuroImage. 2006;31:1238–1246. doi: 10.1016/j.neuroimage.2005.12.060. [DOI] [PubMed] [Google Scholar]
- Schwartz TH. The application of optical recording of intrinsic signals to simultaneously acquire functional, pathological and localizing information and its potential role in neurosurgery. Stereotact Funct Neurosurg. 2005;83:36–44. doi: 10.1159/000085025. [DOI] [PubMed] [Google Scholar]
- Sheth SA, Nemoto M, Guiou M, Walker M, Pouratian N, Hageman N, Toga AW. Columnar specificity of microvascular oxygenation and volume responses: implications for functional brain mapping. J Neurosci. 2004;24:634–641. doi: 10.1523/JNEUROSCI.4526-03.2004. [DOI] [PMC free article] [PubMed] [Google Scholar]
- Shmuel A, Augath M, Oeltermann A, Logothetis NK. Negative functional MRI response correlates with decreases in neuronal activity in monkey visual area V1. Nat Neurosci. 2006;9:569–577. doi: 10.1038/nn1675. [DOI] [PubMed] [Google Scholar]
- Silva AC, Koretsky AP. Laminar specificity of functional MRI onset times during somatosensory stimulation in rat. Proc Natl Acad Sci USA. 2002;99:15182–15187. doi: 10.1073/pnas.222561899. [DOI] [PMC free article] [PubMed] [Google Scholar]
- Silva AC, Lee SP, Iadecola C, Kim SG. Early temporal characteristics of cerebral blood flow and deoxyhemoglobin changes during somatosensory stimulation. J Cereb Blood Flow Metab. 2000;20:201–206. doi: 10.1097/00004647-200001000-00025. [DOI] [PubMed] [Google Scholar]
- Sur M, Nelson RJ, Kaas JH. Representations of the body surface in cortical areas 3b and 1 of squirrel monkeys: comparisons with other primates. J Comp Neurol. 1982;211:177–192. doi: 10.1002/cne.902110207. [DOI] [PubMed] [Google Scholar]
- Toth LJ, Rao SC, Kim DS, Somers D, Sur M. Subthreshold facilitation and suppression in primary visual cortex revealed by intrinsic signal imaging. Proc Natl Acad Sci USA. 1996;93:9869–9874. doi: 10.1073/pnas.93.18.9869. [DOI] [PMC free article] [PubMed] [Google Scholar]
- Tsao DY, Freiwald WA, Tootell RB, Livingstone MS. A cortical region consisting entirely of face-selective cells. Science. 2006;311:670–674. doi: 10.1126/science.1119983. [DOI] [PMC free article] [PubMed] [Google Scholar]
- Vanduffel W, Fize D, Peuskens H, Denys K, Sunaert S, Todd JT, Orban GA. Extracting 3D from motion: differences in human and monkey intraparietal cortex. Science. 2002;298:413–415. doi: 10.1126/science.1073574. [DOI] [PubMed] [Google Scholar]
- Vanzetta I, Slovin H, Omer DB, Grinvald A. Columnar resolution of blood volume and oximetry functional maps in the behaving monkey; implications for fMRI. Neuron. 2004;42:843–854. doi: 10.1016/j.neuron.2004.04.004. [DOI] [PubMed] [Google Scholar]
- Yacoub E, Van De Moortele PF, Shmuel A, Ugurbil K. Signal and noise characteristics of Hahn SE and GE BOLD fMRI at 7 T in humans. NeuroImage. 2005;24:738–750. doi: 10.1016/j.neuroimage.2004.09.002. [DOI] [PubMed] [Google Scholar]
- Zhao F, Wang P, Hendrich K, Kim SG. Spatial specificity of cerebral blood volume-weighted fMRI responses at columnar resolution. NeuroImage. 2005;27:416–424. doi: 10.1016/j.neuroimage.2005.04.011. [DOI] [PubMed] [Google Scholar]