

Abstract
Metachromatic leukodystrophy is a lysosomal storage disorder caused by deficiency in the sulfolipid degrading enzyme arylsulfatase A (ASA). In the absence of a functional ASA gene, 3-O-sulfogalactosylceramide (sulfatide; SGalCer) and other sulfolipids accumulate. The storage is associated with progressive demyelination and various finally lethal neurological symptoms. Lipid storage, however, is not restricted to myelin-producing cells but also occurs in neurons. It is unclear whether neuronal storage contributes to symptoms of the patients. Therefore, we have generated transgenic ASA-deficient [ASA(−/−)] mice overexpressing the sulfatide synthesizing enzymes UDP-galactose:ceramide galactosyltransferase (CGT) and cerebroside sulfotransferase (CST) in neurons to provoke neuronal lipid storage. CGT-transgenic ASA(−/−) [CGT/ASA(−/−)] mice showed an accumulation of C18:0 fatty acid-containing SGalCer in the brain. Histochemically, an increase in sulfolipid storage could be detected in central and peripheral neurons of both CGT/ASA(−/−) and CST/ASA(−/−) mice compared with ASA(−/−) mice. CGT/ASA(−/−) mice developed severe neuromotor coordination deficits and weakness of hindlimbs and forelimbs. Light and electron microscopic analyses demonstrated nerve fiber degeneration in the spinal cord of CGT/ASA(−/−) mice. CGT/ASA(−/−) and, to a lesser extent, young ASA(−/−) mice exhibited cortical hyperexcitability, with recurrent spontaneous cortical EEG discharges lasting 5–15 s. These observations suggest that SGalCer accumulation in neurons contributes to disease phenotype.
Keywords: arylsulfatase A, galactosyltransferase, galactosylceramide, lysosomal storage disorder, metachromatic leukodystrophy, sulfatide
Introduction
Metachromatic leukodystrophy (MLD) is an autosomal recessively inherited lysosomal storage disorder caused by deficiency of arylsulfatase A (ASA; EC 3.1.6.8) (von Figura et al., 2001). ASA is a lysosomal enzyme catalyzing the first step in the degradation of various sulfolipids, including 3-O-sulfogalactosylceramide (SGalCer), sulfolactosylceramide (SLacCer), sulfoglucosylceramide, and seminolipid (von Figura et al., 2001). The enzyme deficiency causes lysosomal storage mainly of sulfatide in nervous and extraneural tissues. Patients suffer from ataxia, initially flaccid and later spastic tetraparesis, optical atrophy, epileptic seizures, and other neurological symptoms.
Because the major pathological feature of MLD is a progressive demyelination, the various neurological symptoms have been solely ascribed to the loss of myelin. Although SGalCer is, in general, regarded as a myelin-specific sphingolipid, SGalCer is also present in neurons and astrocytes (Pernber et al., 2002). Accordingly, neuronal storage of SGalCer has been observed in ASA(−/−) mice (Molander-Melin et al., 2004) and in MLD patients (von Figura et al., 2001). It remains unclear, however, whether storage in neurons contributes to the disease phenotype.
To develop a murine model for MLD, ASA-deficient [ASA(−/−)] mice have been generated (Hess et al., 1996). These mice accumulate sulfolipids in neurons, microglia, and other glial cells, but also in non-neural tissues, such as kidney and gallbladder (Lüllmann-Rauch et al., 2001; Schott et al., 2001; Sandhoff et al., 2002; Wittke et al., 2004; Isaac et al., 2006). The distribution of sulfolipid storage in these mice is very similar to that observed in MLD patients (von Figura et al., 2001). The mice, however, accumulate less sulfatide than humans and therefore do not demyelinate. The mild phenotype of these mice offers the opportunity to investigate the consequences of lipid storage in particular cell types. Thus, increasing the storage of sulfatide in neurons in the absence of demyelination can reveal the consequences of neuronal lipid storage.
To enhance neuronal lipid storage, transgenic ASA(−/−) mice were generated, expressing the two enzymes catalyzing the synthesis of SGalCer in neurons (Fig. 1). These are the UDP-galactose:ceramide galactosyltransferase (CGT; EC 2.4.1.45) (Morell and Radin, 1969) and the 3′-phosphoadenosine-5′-phosphosulfate:cerebroside sulfotransferase (CST; EC 2.8.2.11) (Benjamins et al., 1982). The accelerated accumulation of SGalCer, but not of other sulfolipids, was accompanied by an impairment in neuromotor coordination, ataxia, and nerve fiber degeneration in the spinal cord. Furthermore, abnormalities in electroencephalogram (EEG) recordings were significantly intensified in CGT-transgenic (CGT-tg) ASA(−/−) compared with ASA(−/−) mice. These observations suggest that neuronal SGalCer storage contributes to the pathogenesis of MLD.
Figure 1.

Biosynthesis and degradation of sulfolipids. GalCer is synthesized in the endoplasmic reticulum by UDP-galactose:CGT (EC 2.4.1.45). Sulfatide is formed by CST (EC 2.8.2.11) in the Golgi apparatus. In the Golgi apparatus, UDP-glucose:ceramide glycosyltransferase (GlcT-1; EC 2.4.1.80) and UDP-galactose:glucosylCGT (GalT-1; EC 2.4.1.) synthesize LacCer, which can then be 3-O-sulfated by CST to form SLacCer. Lysosomal degradation of sulfatide, SLacCer, and related lipids (3-O-sulfogalactolipids) is initiated by ASA (EC 3.1.6.8), which hydrolyzes the sulfate ester bond.
Materials and Methods
Generation of CGT- and CST-tg mice.
A 2.4 kb rat CGT cDNA containing the protein coding region, 50 bp of the 5′-noncoding and 740 bp of the 3′-noncoding, was amplified by PCR from a rat CGT cDNA (a kind gift from Dr. B. Popko, University of Chicago, Chicago, IL) as described previously (Fewou et al., 2005). Murine CST was amplified from a cDNA template as described previously (Eckhardt et al., 2002). The PCR products were subcloned into the blunted XhoI site of the Thy1 cassette plasmid (Lüthi et al., 1997). The Thy1-CGT- and Thy1-CST-tg constructs were separated from vector sequences by digesting with NotI, followed by gel purification and electroelution. Eluted DNA was precipitated and further purified using Elutip (Schleicher & Schuell, Dassel, Germany). DNA was precipitated and dissolved in 10 mm Tris-HCl, pH 7.4, and 1 mm EDTA. Pronucleus injection into fertilized eggs from C57BL/6J mice was performed at the Karolinska Center for Transgene Technologies (Stockholm, Sweden). Transgenic mice were identified by Southern blot analysis of mouse tail DNA. Genomic DNA (10 μg) was digested with SspI (CGT) and StyI (CST), respectively, separated in 1% agarose gels and transferred onto Hybond N+ nylon membranes (Amersham Biosciences, Freiburg, Germany). Membranes were hybridized with a 32P-labeled rat CGT and murine CST cDNAs, respectively, using standard procedures (Sambrook et al., 1989). Two independent CGT-tg mouse lines were established (tg4743 and tg4747). Three independent CST-tg lines were established (tg4786, tg296, and tg298). However, all experiments reported here were performed with the line tg4786. CST-tg and CGT-tg mice were crossed with ASA-deficient [ASA(−/−)] mice (Hess et al., 1996). Genotypes of transgenic mice were determined by multiplex PCR on genomic tail DNA using primers specific for ASA wild-type and knock-out alleles (5′-TGACCCAGGCCTTGTTCCCAT-3′, 5′-TAGGGTGGAAGTTACCCTAGA-3′, and 5′-GGAGAGGCTATTCGGCTATGAC-3′), murine CST (5′-ATGACTCTGCTGCCAAAGAAGC-3′ and 5′-CCACCTTAGAAAGTCCCTAAGG-3′) and rat CGT transgenes (5′-GCTGGTGTCAAGTATCTGTC-3′ and 5′-AACTGTGCTGTGCGTACTCC-3′). PCR products were as follows: 480 bp (ASA wild-type allele), 1100 bp (ASA knock-out allele), 1272 bp (CST transgene), 2146 bp (endogenous CST), and 663 bp (CGT). PCR conditions were as follows: denaturation at 94°C for 5 min, followed by 32 cycles of 94°C for 30 s, 56°C for 30 s, and 72°C for 60 s.
In situ hybridization.
In situ hybridization was performed as described previously (Fewou et al., 2005). Briefly, mice anesthetized with 2,2,2-tribromoethanol were perfused through the left cardiac ventricle with 4% paraformaldehyde in PBS. Brains were isolated and immersed in 4% formaldehyde for 48 h at room temperature. Brains were then washed in water for 3 d, dehydrated, paraffin embedded, and cut at a thickness of 8 μm using a microtome (HM 355 S; Leica, Nussloch, Germany). A 760 bp rat CGT cDNA fragment (harboring 50 bp of the 5′-untranslated region and 710 bp of the coding region) was subcloned into pBluescript SK(−) (Stratagene, La Jolla, CA) and used as the template for transcription of digoxigenin-11-UTP-labeled antisense and sense CGT cRNA probes using T3 and T7 RNA polymerase (Roche Diagnostic, Mannheim, Germany) following the instructions of the manufacturer. Hybridization was done overnight at 65°C in 50% formamide, 1% Denhardt's solution, 0.2% SDS, 0.25 mg/ml salmon sperm DNA, 0.25 mg/ml yeast tRNA, 300 mm NaCl, 10 mm PIPES, and 10 mm EDTA. Sections were washed twice with 2× SSC for 5 and 30 min (60°C) and once with 0.1× SSC for 45 min (70°C). The sections were finally equilibrated in maleic acid buffer (100 mm maleic acid and 150 mm NaCl, pH 7.5) and incubated in maleic acid buffer containing 2% blocking reagent (Roche Diagnostic) for 1 h at room temperature. Bound RNA probes were detected using alkaline phosphatase-conjugated anti-digoxigenin Ig (Roche Diagnostic) at a dilution of 1:5000 at 4°C overnight in a humid chamber. Sections were washed with Tris buffer (100 mm Tris-HCl, 100 mm NaCl, and 50 mm MgCl2, pH 9.5) at room temperature for 5 h and stained using nitroblue tetrazolium and 5-bromo-4-chloro-3-indolyl phosphate.
Northern blot analysis.
Total brain RNA was prepared by CsCl gradient centrifugation according to Chirgwin et al. (1979). RNA (20 μg) was separated in a 1% formaldehyde agarose gel and transferred onto nylon membrane as described previously (Sambrook et al., 1989). Membranes were hybridized with the 2.4 kb rat CGT cDNA and β-actin cDNA probes, respectively, as described recently (Yaghootfam et al., 2005). DNA fragments were labeled with [α-32P]-dCTP by random priming using the Megaprime DNA Labeling System (Amersham Biosciences). Hybridization was done overnight in 50% formamide, 4.8× SSC, 10 mm Tris-HCl, pH 7.5, 1% SDS, 1× Denhardt's solution, and 10% dextran sulfate at 42°C. Posthybridization washes were done in 2× SSC and 0.1% SDS at room temperature, followed by 0.2× SSC and 0.1% SDS at 65°C. Membranes were exposed to Fuji (Tokyo, Japan) Bioimager screens and subsequently to x-ray films.
UDP-galactose:CGT assay.
UDP-galactose:CGT activity was measured as described recently (Zöller et al., 2005). Briefly, tissue samples of the cortex were homogenized in 250 mm sucrose, 10 mm HEPES/NaOH, pH 7.2, 1 mm EDTA, and 1 mm PMSF. A postnuclear supernatant was prepared and treated with 0.4% saponin for 30 min on ice. One hundred twenty micrograms of the homogenate were incubated with 100 μm [14C]-UDP-galactose (30 kBq/ml) (Amersham Biosciences), 15 μm C6-ceramide (Biomol, Hamburg, Germany), 1% bovine serum albumin, 1 mm EDTA, 2 mm MgCl2, 2 mm MnCl2, 250 mm sucrose, and 10 mm HEPES, pH 7.2, at 37°C for 30 min. Reactions were stopped by adding 500 μl of chloroform:methanol (2:1) and 100 μl of 150 mm NaCl. The aqueous phase was washed once with chloroform, and the combined organic phases were dried and separated by thin-layer chromatography (TLC) on silica gel 60 HPTLC plates (Merck, Darmstadt, Germany) using chloroform/methanol/water (70:30:4). Radioactivity was detected using a Fuji Bio-Imager BAS 1000 and quantified using AIDA software (Raytest, Straubenhardt, Germany). Data were tested for a significant increase in CGT activity using one-tailed t test.
Lipid analysis.
Cortices and spinal cords were homogenized in at least 20 vol of chlorofom/methanol (2:1), and sphingolipids were isolated as described recently (Yaghootfam et al., 2005). Care was taken to confine the cortical specimens taken to gray matter. However, even after careful dissection of cortical gray matter, the lipid analysis showed a substantial amount of oligodendrocyte-derived sphingolipids in the samples. Dried sphingolipids were dissolved in methanol/chloroform (1:1) and applied onto TLC or HPTLC silica gel 60 plates (Merck). Standard substances used were SGalCer, sphingomyelin, and galactosylceramide from bovine brain (all from Sigma, Taufkirchen, Germany). Lipids were separated by TLC using chloroform/methanol/water (70:30:4) or chloroform/methanol/0.22% CaCl2 (60:35:8). Lipids were visualized by spraying TLC plates with cupric sulfate in aqueous phosphoric acid, followed by 10 min incubation at 150°C (Yao and Rastetter, 1985). Stained TLC plates were scanned and quantified by densitometry using AIDA software (Raytest) as described recently (Yaghootfam et al., 2005). Data were tested for significant differences by one-way ANOVA, followed by post hoc Fisher's least significant difference (LSD) test.
Apoptosis detection.
Brains were quickly frozen in cold isopentan and stored at −80°C. Parasagittal sections (16 μm) were cut in a cryostat and postfixed in 4% paraformaldehyde in PBS. To detect apoptotic cells, the terminal deoxynucleotidyl transferase-mediated biotinylated UTP nick end labeling (TUNEL) assay was performed on cryosections using a BrdUTP-FragELT DNA fragmentation detection kit (Merck Bioscience) following the manufacturer's instruction. Sections were mounted in Kaiser's gelatin (Merck).
Matrix-assisted laser desorption/ionisation time-of-flight mass spectrometry.
Total sphingolipids or individual lipids, cut out from TLC plates and reextracted with chloroform:methanol (2:1), were dissolved in chloroform/methanol (1:1). One microliter of the sample was mixed with 1 μl of 2,5-dihydroxybenzoic acid (10 mg/ml in 70% acetonitrile). One microliter of this mixture was loaded into a well of a 100-well sample plate. Mass spectra were recorded with a Voyager-DE STR mass spectrometer (Applied Biosystems, Foster City, CA) in positive (detection of galactosylceramide) or negative [lactosylceramide sulfate (SGalCer)] ion mode.
Rotarod test.
Two different paradigms were used to test motor coordination and balance with a rotarod. In the first paradigm, mice at 6–7 weeks of age were trained to stay on a rotating rod for 60 s at 7 rpm. Mice were trained four times per day on 3 consecutive days. When mice fell of the rod during the training session, they were placed back onto the rod (time off). Testing was done every 2 weeks between 8 and 18 weeks of age at two different speeds (4 and 7 rpm). Mice were placed on the rotating rod, and the time interval during which they stayed on the rod was determined (cutoff, 60 s). Testing was done twice for each speed. The percentage of mice of a given genotype able to stay on the rotating rod for 60 s was calculated, and differences in the time intervals mice were able to stay on the rotarod were tested for significance using the Kolmogorov–Smirnov test. In the second paradigm (Kuhn et al., 1995), mice at 2 and 8 months of age were acclimated to the rotarod for 3 d by placing them on the rotating rod (3 rpm) for 10 s. On the fourth day, mice were tested for 1 min at 3 rpm, and the number of falls was recorded (timing was stopped when the mouse was off the rod, and a cutoff of 30 s was used). The number of cumulative falls (mean ± SD) were calculated and tested for significant differences using one-way ANOVA, followed by Fisher's LSD test.
Morphological evaluation.
Animals with the following genotypes were examined: wild type (n = 10), CGT/ASA(+/+) (n = 10), ASA(−/−) (n = 15), CST/ASA(−/−) (n = 6), CGT/ASA(−/−) (n = 10), and CST/CGT/ASA(−/−) (n = 2). The age of most animals was 5–6 months. Additional experiments were done with CGT/ASA(−/−) (n = 4) and ASA(−/−) (n = 5) at 2 months of age. Under deep anesthesia (intraperitoneal injection of tribromoethanol), the animals were killed by transcardial vascular perfusion with PBS (containing 1% procaine), followed by perfusion fixation either with glutaraldehyde (6% in 0.1 m phosphate buffer, pH 7.4) for preparing vibratome slices and for embedding in Araldite or with Bouin's mixture (diluted with PBS to 25% of the original formula) for embedding in paraffin. Selective histochemical staining of sulfolipids (without differentiation of the individual sulfolipid species) was achieved by means of the cationic dye alcian blue (AB; Alcec Blue; Aldrich, Steinheim, Germany) as described previously (Schott et al., 2001). This method warrants selective demonstration of accumulating sulfolipid without staining of, for example, sulfated proteoglycans (Schott et al., 2001). Sulfolipid storage was examined in the following preparations: (1) serial vibratome slices (100 μm) of cervical spinal cord, brainstem, and forebrain were incubated with the dye; (2) blocks of spinal cord, brain samples, whole trigeminal ganglia, and sciatic nerves were incubated with the dye for 2–3 weeks, postfixed with 2% OsO4, and embedded in paraffin or Araldite; sections (5 and 1 μm, respectively) were examined without additional staining. For ultrastructural examination, tissue blocks of spinal cord and phrenic nerves were postfixed with 2% OsO4 and embedded in Araldite. Semithin sections were stained with toluidine blue, and ultrathin sections were stained with uranyl acetate and lead citrate. Nissl-stained paraffin sections served for morphometric determination of neuron density in the facial nucleus, and semithin Araldite sections served for determining of myelin debris in spinal cords. Morphometry was performed by means of the analySIS program (version 3.1; Soft Imaging System, Munster, Germany).
EEG recordings.
We recorded cortical EEG invasively using a telemetric EEG/video monitoring system (DSI, St. Paul, MN). Mice of all genotypes were implanted with cortical electrodes at the coordinates in millimeters relative to bregma (posterior,1.5; lateral, 1.5) under deep anesthesia [6 mg/kg xylazine (Rompun; Bayer, Leverkusen, Germany) plus 90–120 mg/kg ketamine (Ketavet; Amersham Biosciences)]. Electrodes were fixed with dental cement, and the wireless EEG transmitter was implanted subcutaneously on the right side. All mice received analgetic treatment for 2 d (5 mg/kg Carprofen, s.c., twice per day; Rimadyl; Pfizer, Karlsruhe, Germany) as well as antibiotic treatment throughout the monitoring period (5 mg/kg, p.o.; Enrofloxacin, Baytril oral; Bayer). The animals were allowed to recover from the surgical procedure for 3 d before commencing EEG recordings. The EEG data were analyzed off-line using a custom-programmed EEG analysis software. The power was determined in different defined EEG frequency bands (δ, 0.5–3.99 Hz; θ, 4–7.99 Hz; α, 8–12.99 Hz; β, 13–30 Hz; γ, 30–48 Hz). Group comparisons were performed with ANOVA, with post hoc Bonferroni tests. In EEG experiments, we compared CGT/ASA(−/−) with ASA(−/−) littermates with an C57BL/6 × 129/Ola mixed background, whereas CGT/ASA(+/+) and ASA(+/+) mice had a pure C57BL/6 background, to facilitate breeding.
Results
Generation of CGT- and CST-tg ASA(−/−) mice
Transgenic mice overexpressing CGT or CST in neurons (CGT-tg and CST-tg mice, respectively) were generated by pronucleus injection of DNA construct, which drives the expression of CGT or CST under the control of the murine Thy1.2 promoter (Fig. 2A,B). Two independent CGT-tg lines and three independent CST-tg lines were generated. All experiments shown here were performed with the two CGT-tg lines, tg4743 and tg4747, and with the CST-tg line tg4786. Expression of the transgenes was confirmed by Northern blotting (Fig. 2C,D) and in situ hybridization (Fig. 2F–W). Expression levels were different in the two transgenic lines (tg4743>tg4747) (Fig. 2C). In situ hybridization demonstrated transgene expression throughout the forebrain, in the brain stem, and spinal cord (Fig. 2F,O). Strong expression of both CGT and CST transgenes were observed in the hippocampus and cortex, with the highest expression level in lamina 5 (Fig. 2H,Q) and in CA1 and dentate gyrus of the hippocampus (Fig. 2M,V). CGT and CST transgene expression was not detectable in Purkinje cells and was weak in granule cells of the cerebellum (Fig. 2K,T), in contrast to the deep cerebellar nuclei, which showed strong transgene expression (Fig. 2K, arrow). This transgene expression pattern is similar to that of other transgenic lines, generated using the same Thy1.2 promoter construct (van der Putten et al., 2000).
Figure 2.

Generation of CGT- and CST-tg mice. A, B, Schematic representation of the transgenic constructs. Rat CGT (A) or murine CST (B) cDNAs were subcloned into the XhoI site of the Thy1.2 cassette. C, Northern blot analysis of CGT-tg (lines tg4743 and tg4747) and wild-type mice. Total brain RNAs (20 μg per lane) were hybridized to a CGT-specific 32P-labeled cDNA probe. Gel loading was controlled by ethidium bromide staining. D, Northern blot analysis of CST-tg and wild-type mice. Total brain RNAs (20 μg per lane) were separated by gel electrophoresis, transferred onto nylon membranes, and hybridized to a CST-specific 32P-labeled cDNA probe. Gel loading was controlled by ethidium bromide staining. Both transgene and endogenous CST mRNA have a size of 1.8 kb. E, CGT enzymatic activity (mean + SD; n = 3) was measured in brain homogenates of 5-month-old CGT-tg mice (line tg4743) and wild-type controls (left column) as well as 8-month-old CGT-tg mice (line tg4747) and wild-type controls (right column). Asterisks indicate a significant increase in CGT activity in transgenic mice (one-tailed t test, p < 0.05). F–N, In situ hybridization of sagittal brain sections of CGT-tg mice (line tg4743) (F, H, I, K, M) or wild-type controls (G, J, L, N). Sections were hybridized with digoxigenin-labeled rat CGT cRNA antisense (CGT-as) or sense (CGTsense) probes. CGT transgene expression was found throughout the forebrain and in the brainstem (F). In the cortex, the highest CGT expression levels were seen in lamina 5 (H). A similar transgene expression pattern was observed in the CGT-tg line tg4747, although the staining intensities were reduced compared with mice of the line tg4743 (data not shown). No specific signals were detected with a sense probe (I). Longer incubations in staining solution revealed that CGT expression in wild type was restricted to white matter tracts, as expected (J). CGT expression was not detectable in cerebellar Purkinje cells of CGT-tg (K) or wild-type controls (L). CGT transgene was expressed in the deep cerbellar nuclei (K, arrow). CGT transgene was highly expressed in CA1 and dentate gyrus of the hippocampus (M). O–W, In situ hybridization of sagittal brain sections of CST-tg mice (line tg4786) (O, Q, R, T, V) or wild-type controls (P, S, U, W). Sections were hybridized with digoxigenin-labeled CST cRNA antisense (CST-as) or sense (CSTsense) probes. CST transgene expression was found throughout the forebrain and in the brainstem (O). In the cortex, the highest CST expression levels were seen in lamina 5 (Q). No specific signals were detected with a sense probe (R). In wild-type mice, CST expression was found in white matter tracts (e.g., corpus callosum), and weak staining was also found in the cortex (S). CST expression was not detectable in cerebellar Purkinje cells of CST-tg (T) or wild-type controls (U). CST-tg was highly expressed in CA1 and dentate gyrus of the hippocampus (V). Scale bars: H–J, Q–S, 500 μm; K–N, T–W, 200 μm. wt, Wild type; EtBr, ethidium bromide; cc, corpus callosum; cx, cortex; g, granule cell layer.
To prove that CGT transgene expression led to an increase in CGT enzymatic activity, homogenates of the cortex, which showed the highest CGT transgene expression level, were subjected to a CGT enzyme assay. As shown in Figure 2E, even after careful dissection of cortical gray matter, CGT activity in the cortex of transgenic mice was only slightly increased compared with wild-type controls. Because GalCer levels and CGT expression in neurons and astrocytes of wild-type mice is very low, CGT activity measured in wild-type is mainly derived from oligodendrocytes. Because of this high endogenous background provided by cortical oligodendrocytes, we believe that the actual increase in CGT activity in the neurons of CGT-tg mice is strongly underestimated by the CGT assay. Because of this limitation, we did not measure CGT activity at other time points or CST activity in CST-tg mice.
Lipid analysis of CGT/ASA(−/−) and CST/ASA(−/−) mice
Alkaline stable lipids were isolated from the cortex of CGT/ASA(−/−), CST/ASA(−/−), CGT/ASA(+/−), ASA(−/−), and ASA(+/−) mice. In addition, lipids were isolated from double-transgenic CST/CGT/ASA(−/−) mice. With the exception of C18:0-GalCer, which was not detectable in the absence of the CGT transgene, no significant differences were observed in the composition and amount of long-chain non-hydroxy fatty acid (NFA)-GalCer, hydroxy fatty acid (HFA)-GalCer, and gangliosides (Fig. 3A,C). Although oligodendrocytes synthesize sphingolipids containing very long chain fatty acids (VLCFAs; mainly C22 and C24), sphingolipids containing stearic acid (C18:0) are predominant in neurons (Raghavan and Kanfer, 1972; Isaac et al., 2006), and the selective increase in C18:0-GalCer is therefore a clear indication for GalCer increase in neurons. SGalCer levels in the cortex were quantified by densitometry of TLC plates using serial dilutions of reference lipids applied onto the same TLC plates. SGalCer was significantly increased in 5- to 6-month-old CGT/ASA(−/−) mice compared with ASA(+/−) and ASA(−/−) mice but not in 2.5-month-old mice (Fig. 3B). The actual increase in SGalCer within neurons, however, is probably much higher than suggested by the TLC analysis, because of the considerable “contamination” with oligodendrocyte-derived SGalCer. Because in wild-type mice SGalCer and GalCer levels in neurons are very low, compared with oligodendrocytes, the lipid analysis probably underestimates the real SGalCer increase in neurons of CGT/ASA(−/−) mice. A separate quantification of the two SGalCer bands [top band, NFA-SGalCer with VLCFAs (>C18); bottom band, HFA-SGalCer and NFA-SGalCer with LCFA (C18–C16)] revealed a significant increase in the latter only, as expected for an increase in neuronal C18:0-SGalCer (Fig. 3B). Total SGalCer levels were not significantly increased in CST/ASA(−/−) compared with ASA(−/−) mice. However, quantification of the LCFA/HFA-SGalCer fraction also showed a slight increase in CST/ASA(−/−) mice (Fig. 3B). Because we did not yet identify all sulfolipids accumulating in CST/ASA(−/−) mice, we cannot exclude the possibility that other lipids comigrating with SGalCer led to the apparant SGalCer increase. In contrast to LCFA/HFA-SGalCer, the VLCFA-SGalCer level was not significantly increased in CGT/ASA(−/−) mice compared with ASA(−/−) (Fig. 3B). Because VLCFA-SGalCer is the predominant SGalCer species in oligodendrocytes, this indicates that SGalCer accumulation in oligodendrocytes was not accelerated in CGT/ASA(−/−) mice.
Figure 3.
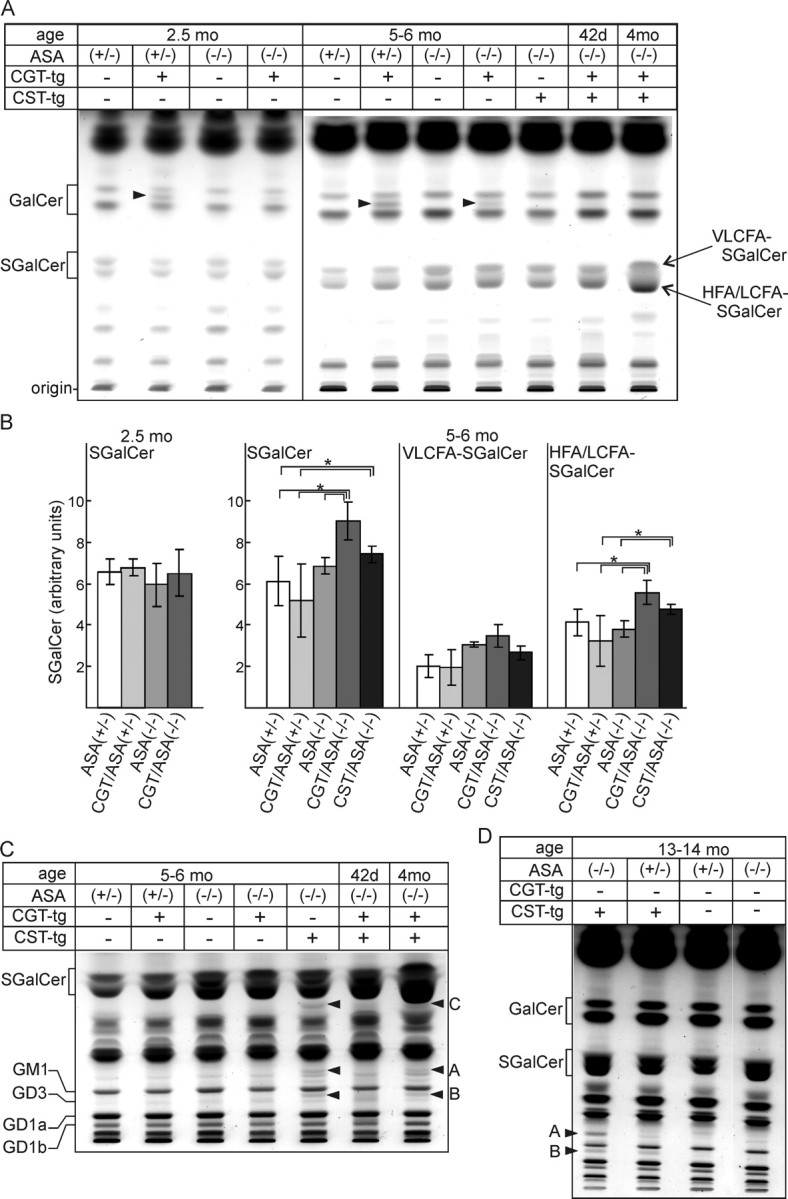
Lipid analysis of cortical sphingolipids. Lipids of the cortex were isolated from mice of the indicated ages and genotypes, subjected to mild alkaline methanolysis, and separated by TLC. A, The amount of lipids that corresponds to 0.5 mg (2.5 months) or 1 mg (5–6 months) of tissue wet weight was loaded per lane of silica gel 60 HPTLC plates, which was developed using chloroform/methanol/water (70:30:4). In CGT-tg mice, a lipid migrating between the NFA-GalCer (top band) and HFA-GalCer (bottom band) appeared (arrowhead). This lipid could be identified as C18:0-hexosylceramide and, because of its migration behavior in borate-treated TLC plates, as GalCer (data not shown). B, SGalCer was quantified by densitometry as described in Materials and Methods. Shown are the total SGalCer concentrations (total) and the concentrations of VLCFA-SGalCer (top band of the SGalCer douplet) and LCFA/HFA-containing SGalCer (bottom band). Data shown are mean ± SD [n = 3; except for 2.5-month-old ASA(−/−) (n = 6) and CGT/ASA(−/−) mice (n = 4)]. Asterisks indicate a significant difference (p < 0.05, ANOVA with post hoc Fisher's LSD test). C, Cortical lipids of the indicated genotypes and ages were separated by TLC using chloroform/methanol/0.22% CaCl2 (60:35:8). Lipids (A–C) increased in CST/ASA(−/−) mice are marked by arrowheads. D, TLC of cortical lipids from 13- to 14-month-old CST/ASA(−/−), CST/ASA(+/−), ASA(+/−), and ASA(−/−) mice (solvent system as in C). The position of standard lipids (GalCer, SGalCer, and gangliosides GM3, GM1, GD1a, GD1b) run on the same TLCs are indicated on the left in A, C, and D.
In additional experiments, samples were separated in chloroform/methanol/0.22% CaCl2 (60:35:8), to better resolve acidic sphingolipids (Fig. 3C,D). Under these conditions, the accumulation of three additional lipids (Fig. 3C,D, labeled A, B, C) was observed in CST/ASA(−/−) and CST/CGT/ASA(−/−) mice (Fig. 3C,D, arrowheads). These lipids have not yet been identified, but according to its migration position, lipid C might be SLacCer. The specific increase in C18:0-SGalCer in CGT/ASA(−/−) was also found in lipid extracts of the spinal cord (data not shown). Overall, the relative increase in SGalCer appeared to be very low, which is attributable to the high background contributed by oligodendrocytes.
Matrix-assisted laser desorption/ionization time-of-flight mass spectrometry analysis
Matrix-assisted laser desorption/ionization time-of-flight (MALDI-TOF) analysis of the cerebroside fraction of CGT/ASA(+/+) mice (Fig. 4A) and ASA(+/+) controls (Fig. 4B) isolated from TLC plates clearly indicated a selective increase in the amount of C18:0-fatty acid-containing hexosylceramide (Fig. 4A,B, arrow), most likely GalCer. This is in agreement with neuronal GalCer production, because C18:0-fatty acid-containing ceramide is the predominant ceramide species in neurons, whereas oligodendrocytes synthesize ceramides containing mainly VLCFAs (C20–C24) (Raghavan and Kanfer, 1972; Isaac et al., 2006).
Figure 4.

MALDI-TOF MS of cortical lipids. A, B, The GalCer fraction from the cortex of wild-type [ASA(+/+)] (A) and CGT/ASA(+/+) (line tg4743) (B) mice, isolated by TLC, was examined by MALDI-TOF MS in positive ion mode. Mass-to-charge ratios (m/z) of individual GalCer species ([M+Na]+ molecular ions) are shown in the insets. sb, Sphingosine base; fa, fatty acid; h, hydroxylated. Note the specific increase in the mass peak at m/z = 750, which corresponds to C18:0-GalCer. C–H, MALDI-TOF MS (negative ion mode) of lipids from the cortex of 1-year-old ASA(−/−) (C), 1-year-old ASA(+/−) (D), 5-month-old CGT/ASA(−/−) (E), 1-year-old CST/ASA(−/−) (F), 6-week-old CST/CGT/ASA(−/−) (G), and 1-year-old CST/ASA(+/−) mice (H). Lipids were subjected to mild alkaline methanolysis and examined by MALDI-TOF MS in negative ion mode. Mass-to-charge ratios (m/z) of individual SGalCer and SLacCer species ([M-H]− molecular ions) are shown in the insets.
Because of the selective increase in C18:0-GalCer in CGT/ASA(+/+) mice, we expected a selective accumulation of C18:0-fatty acid-containing SGalCer in CGT/ASA(−/−) mice. Although the MALDI-TOF mass spectrometry (MS) technique does not allow an accurate quantification, it is obvious that C18:0-SGalCer increased significantly in CGT/ASA(−/−) (Fig. 4E, arrow) compared with ASA(−/−) (Fig. 4C, arrow). In contrast, mass spectra of ASA(+/−) (Fig. 4D) and ASA(−/−) (Fig. 4C) mice were very similar, suggesting only low amounts of SGalCer accumulation in the latter. We found no indication for an increase in any other sulfoglycolipid in CGT/ASA(−/−) mice.
SGalCer was only sligthly increased in CST/ASA(−/−) mice (Fig. 4F). It should be noted that the mass peak at m/z = 823 corresponds to 2-hydroxylated C18:0-SGalCer. Because neurons do not synthesize 2-hydroxylated sphingolipids (Raghavan and Kanfer, 1972), the ratio of C18:0-SGalCer (m/z = 807) to 2-hydroxy-C18:0-SGalCer (m/z = 823) is a better indicator for neuronal SGalCer storage than the intensity of the C18:0-SGalCer mass peak alone. The ratio of m/z = 807 to m/z = 823 was only slightly increased in CST/ASA(−/−) mice (Fig. 4F) compared with ASA(−/−) mice (Fig. 4C), suggesting that neuronal sulfatide accumulation in the former was not strongly increased.
In CST/CGT/ASA(−/−) mice, which coexpress both transgenes, CST and CGT, SGalCer accumulation was increased to a much higher degree than in CGT/ASA(−/−) mice (Fig. 4, compare G, E, arrows). However, because transgenic mice could not be bread to homozygosity, only a limited number of CST/CGT/ASA(−/−) mice were generated, and most experiments were done with CGT/ASA(−/−) mice. In the case of CST/ASA(−/−) mice, MALDI-TOF MS showed accumulation of lipids with m/z = 969 and m/z = 997 corresponding to sulfated dihexosylceramides, most likely SLacCer (Fig. 4F, arrows). Sulfated dihexosylceramides were not detectable in ASA(−/−) (Fig. 4C) and CST/ASA(+/−) mice (Fig. 4H).
Behavioral phenotype of CGT/ASA(−/−) and CST/ASA(−/−) mice
CST-tg mice on a wild-type background, as well as CST/ASA(−/−) mice, had a normal life span (data not shown). Moreover, CST/ASA(−/−) mice were indistinguishable from ASA(−/−) mice throughout their life. In contrast, survival of CGT/ASA(−/−) mice was significantly reduced (Fig. 5A) to 149 ± 35 d (mean ± SD; n = 50; line tg4743) and 214 ± 64 d (n = 9; line tg4747), respectively. The life span of CGT/ASA(+/−) mice was not significantly different from ASA(+/−) or wild-type controls, although occasionally CGT/ASA(+/−) mice died prematurely for unknown reasons (Fig. 5A), whereas all ASA(−/−) and ASA(+/−) mice survived for more than 1 year. CGT/ASA(−/−) lost weight before their premature death. Therefore, the significantly reduced life span of CGT/ASA(−/−) mice might be attributable to difficulties with food ingestion. Some CGT/ASA(−/−) mice (∼10%), however, died suddenly at an age between 8 and 10 weeks, for unknown reasons, before signs of feeding problems were observed.
Figure 5.

Survival and behavioral phenotype of CGT/ASA(−/−) mice. A, Survival of CGT/ASA(−/−) [filled squares, line tg4743 (n = 50); filled triangles, line tg4747 (n = 9)], CGT/ASA(+/−) [open squares, line tg4743 (n = 12); open triangle, line tg4747 (n = 11)], ASA(−/−) (n = 12), and ASA(+/−) mice (n = 6) (open circles). No significant difference between male and female mice was observed, and therefore data for both genders were combined. B, Rotarod test with CGT/ASA(−/−) (line tg4743, n = 6; filled squares), CGT/ASA(+/−) (n = 5; filled circles), ASA(−/−) (n = 11; open squares), and ASA(+/−) (n = 6; open circles) mice. Mice were trained to stay on the rotating rod at 6–7 weeks of age and tested, starting at 8 weeks of age, every second week on the rotarod, rotating at 7 rpm. The time interval mice stayed on the rotarod was recorded and the percentage of mice able to stay on the rotarod for 1 min was calculated. C, Rotarod experiment with mice of the indicated genotypes were performed at 2 and 8 months of age (in this experiment, all CGT-tg mice were from the line tg4747). The number of cumulative falls (mean ± SD) within 1 min was determined (speed, 3 rpm). The number of mice analyzed per genotype (n) is shown in brackets. Asterisks indicate a significant difference compared with ASA(−/−) of the same age group (p < 0.05, one-way ANOVA followed by Fisher's LSD test). Data for 2-month-old CGT/ASA(−/−) were not significantly different from ASA(−/−) but were from all other genotypes. D, Typical posture of a transgenic CGT/ASA(−/−) mouse, indicating limb weakness (line tg4743; age, 5 months). E, Normal position of toes of the forelimbs of an ASA(−/−) mouse. F, Unusual lifting of toes of a CGT/ASA(−/−) mouse.
At the age of 2–3 months, CGT/ASA(−/−) mice started to exhibit obvious deficits in their neuromotor coordination. CGT/ASA(−/−) mice developed a tremor of the head, developed ataxia, and displayed weakness of their hindlimbs and forelimbs (Fig. 5D). Mice did not develop paralysis. Movement, however, appeared uncoordinated. Resting CGT/ASA(−/−) mice often lifted their toes (Fig. 5F), in contrast to ASA(−/−) mice, which might indicate an increased tonus of extension muscles, comparable to the sign of Babinski indicative for spasticity. Although older ASA(−/−) mice (>1 year) also developed hindlimb weakness and motor coordination deficits (D'Hooge et al., 2001), their symptoms appeared to be less severe than in CGT/ASA(−/−) mice, and 6-month-old ASA(−/−) mice displayed no significant motor coordination deficits. CGT/ASA(+/−) or CGT/ASA(+/+) mice did not show any obvious behavioral abnormalities, demonstrating that behavioral deficits in CGT/ASA(−/−) mice are not caused by an increase in GalCer synthesis but by sulfolipid storage.
Motor coordination in CGT/ASA(−/−) mice (line tg4743) was examined using a rotarod experiment. Mice were trained on a rotating rod (7 rpm) at 6–7 weeks of age four times each on 3 consecutive days and thereafter were tested every second week (Fig. 5B). The percentage of mice able to stay on the rotating rod for at least 1 min was determined. ASA(−/−) mice at 5 months of age did not perform worse than ASA(+/−) mice, in contrast to older ASA(−/−) mice (Hess et al., 1996). CGT/ASA(+/−) mice were indistinguishable from ASA(+/−) controls. In contrast, CGT/ASA(−/−) mice showed a progressive decline in rotarod performance starting at 10 weeks of age (Fig. 5B). In a second rotarod approach, the number of cumulative falls of CGT/ASA(−/−) (line tg4747), CST/ASA(−/−), as well as CST/CGT/ASA(−/−) mice and various controls was determined (Fig. 5C). At 2 months of age, the number of cumulative falls of CGT/ASA(−/−) mice was slightly but not significantly increased compared with ASA(−/−) mice. At 8 months of age, however, CGT/ASA(−/−) were no longer able to stay on the rotating rod. CST/ASA(−/−) mice, in contrast, did not differ from ASA(−/−) mice at both 2 and 8 months of age (Fig. 5C). However, in agreement with the significant increase in SGalCer storage, CST/CGT/ASA(−/−) mice performed worse than CGT/ASA(−/−) mice at 2 months of age. In contrast, CST/CGT/ASA(+/−) mice were indistinguishable from wild-type controls. The life span of CST/CGT/ASA(−/−) mice (71 ± 32 d; mean ± SD; n = 11) was significantly reduced compared with CGT/ASA(−/−) mice and therefore could not be tested at 8 months of age. Together, these data demonstrate a clear correlation between SGalCer storage and motor coordination deficits, whereas increased neuronal SGalCer synthesis per se did not affect motor coordination capabilities.
Sulfolipid storage as detected by AB staining
Sulfolipid storage was demonstrated by means of the cationic dye AB. If applied under incubation conditions as described (Schott at al. 2001), this method warrants selective staining of sulfated lipids but does not allow to differentiate between the various sulfolipid species. Nervous tissues of the following regions were examined: cervical spinal cord, lower brainstem, cerebellum, forebrain, and trigeminal ganglion of mice at the age of 5–6 months. In the CNS of wild-type and transgenic ASA(+/+) mice, AB staining material was entirely lacking as shown for spinal cord in Figure 6A. In the ASA(−/−) mice of the present study, significant amounts of AB-positive material were seen in the spinal cord (Fig. 6B,C), whereas AB staining was rather weak in brainstem nuclei and in the forebrain (Fig. 6G,K). All CGT- and CST-tg ASA(−/−) mice showed an increase in sulfolipid storage in the spinal cord (Fig. 6D,E). The difference between CGT- and CST-tg ASA(−/−) and ASA(−/−) mice was even more pronounced in brain. A rough grading on the basis of histochemical stainings of brain samples yielded the following order: ASA(−/−) < CST/ASA(−/−) ≤ CGT/ASA(−/−) < CST/CGT/ASA(−/−), although the degree was somewhat variable in CST/ASA(−/−) and CGT/ASA(−/−) mice, as far as the forebrain is concerned. The increase in AB-positive material could be attributed mainly to storage within neuronal perikarya. A representative example is shown in Figure 6F. In the CST/CGT/ASA(−/−) mice, the occurrence of AB-positive activated microglia in the white matter was increased additionally (data not shown). The ultrastructure of the intralysosomal storage material in the CGT- and CST-tg ASA(−/−) (data not shown) was cell type dependent and identical to the patterns previously described for ASA(−/−) mice (Hess et al., 1996; Wittke et al., 2004). We did not observe an increase in sulfatide storage in oligodendrocytes, microglia, or astrocytes of CGT/ASA(−/−) mice compared with ASA(−/−) mice (data not shown).
Figure 6.

Sulfolipid storage in the CNS. A–F, Sulfolipid storage in the spinal cord. Vibratome slices (100 μm) stained with AB (A, B, D, E) and paraffin sections of tissue blocks subjected to pre-embedding incubation with AB (C, F). Genotypes are as indicated. In CGT/ASA(+/+) (A), AB-positive structures are lacking. In ASA(−/−) (B), CST/ASA(−/−) (D), and CGT/ASA(−/−) (E), the gray matter and, less markedly, also the white matter display alcianophilic material. The amount of storage material in the gray matter is increased in CST/ASA(−/−) and CGT/ASA(−/−) mice compared with the ASA(−/−) mouse. The alcianophilic structures in the gray matter correspond mainly to neuronal perikarya filled with sulfolipid inclusions (C, F). The small AB-positive profiles mainly correspond to storage in glial cells, most probably oligodendrocyte processes. Scale bars: A, B, D, E, 200 μm; C, F, 20 μm. DH, Dorsal horn; VH, ventral horn. G–J, Sulfolipid storage in the medulla oblongata. Vibratome slices are as above. Genotypes are as indicated. Scale bar, 200 μm. In G, some AB staining is present in the reticular formation (Rt) and gracile nucleus (Gr) (although hardly recognizable at this low magnification), whereas the hypoglossal nucleus (12N) is unstained. CC, Central canal. H–J show AB-positive material in 12N and increased staining in Rt and Gr. Some regions, however, remain mostly unstained such as the dorsal vagal nucleus (10N), nucleus of solitary tract (Sol), and area postrema (AP). K–N, Sulfolipid storage in forebrain. Vibratome slices are as above. Genotypes are as indicated. Scale bar, 500 μm. In K, the cortex does not display AB-positive structures at this magnification; AB-positive material is present only in the hippocampal fimbria (fi) (mainly within macrophages). In L, the isocortical lamina 5 and the hippocampal CA1 region show prominent staining; moderate staining is seen in the hippocampal CA3 region. In M, AB-positive staining is seen in laminas 5 and 2/3 of the isocortex and in the CA3 region. In the double-trangenic ASA(−/−)mouse (N), increased amounts of AB-positive material are observed in the laminas 5, 6, and 2/3 of the isocortex as well as in the hippocampus including the dentate gyrus (DG). In all CGT- and CST-tg ASA(−/−) mice, increased storage is seen in the thalamus (T).
As to the topographic distribution of sulfolipid storage in ASA(−/−) mice, the pattern, in many respects, resembled that previously described for ASA(−/−) mice at ages of 1–2 years (Wittke et al., 2004), although there were additional locations that displayed intense storage. Thus, in the brainstem of ASA(−/−) mice, the motoneurons of the facial and hypoglossal nuclei displayed relatively intense storage (Fig. 6H–J), which is not a feature of ASA(−/−) mice (Fig. 6G), even not at old age (Wittke et al., 2004). As to forebrain, CST/ASA(−/−) mice showed prominent sulfolipid storage in the isocortical lamina 5, CA1 and CA3 regions of the hippocampus (Fig. 6L), in the thalamus, and in amygdaloid nucleus (data not shown). CGT/ASA(−/−) mice showed intense storage in lamina 5, somewhat less so in laminas 2/3, and very prominently in most thalamic nuclei, whereas in the hippocampus, the storage was confined to CA3 (Fig. 6M). In this context, it is important to note that the AB method detects not only SGalCer but also other sulfoglycolipids (e.g., SLacCer). Thus, stronger AB staining in some brain areas of CST/ASA(−/−) mice, compared with CGT/ASA(−/−) mice, suggest more sulfolipid storage material but not necessarily more SGalCer. It should be mentioned that in ASA(−/−) mice, sulfolipid storage in the hippocampus, as far as detectable by AB histochemistry and ultrastructural examination, is rather low even at old ages (Wittke et al., 2004). The CST/CGT/ASA(−/−) mice showed intraneuronal sulfolipid storage in most regions of the CNS (Fig. 6J,N) with an intensity exceeding that observable in ASA(−/−) up to the age of 2 years. In contrast, some areas, which neurons are known to be rather reluctant to develop sulfolipid storage in ASA(−/−) mice, continued to be without significant neuronal storage in the CGT- and CST-tg ASA(−/−) mice; examples are the area postrema, dorsal vagal nucleus, nucleus of solitary tract (Fig. 6H–J) and, furthermore, the inferior olive, cerebellar Purkinje cells, and the caudatoputamen (data not shown). The absence of sulfolipid storage in Purkinje cells was in accordance with the absence of transgene expression in these cells. However, because ≥1-year-old ASA(−/−) mice exhibit degeneration of Purkinje cells without any sign of sulfolipid accumulation (Hess et al., 1996; D'Hooge et al., 1999b), we examined Purkinje cells of 4- to 6-month-old CGT/ASA(−/−) and CST/CGT/ASA(−/−) mice. We found no indications for Purkinje cell degeneration (data not shown).
The trigeminal ganglion served as a representative of peripheral sensory neurons, which are known to show hardly any sulfolipid storage in ASA(−/−) mice [except for spiral and vestibular ganglia (Coenen et al., 2001)]. For each ASA-deficient genotype, the ganglion of one mouse was examined (results not shown). The trigeminal perikarya of the ASA(−/−) mouse were free of alcianophilic material. In the CST/ASA(−/−) mouse, <50% of the perikarya showed small AB-positive inclusions. In the CGT/ASA(−/−) mouse, ∼50% of the perikarya contained numerous AB-positive inclusions. In the CST/CGT/ASA(−/−) mouse, >50% of the perikarya were stuffed with AB-positive material.
Nerve fiber degeneration in the spinal cord of CGT/ASA(−/−) mice
In CGT/ASA(−/−) mice, the white matter of the cervical spinal cord displayed osmiophilic, but AB-negative rosette-like, structures, which rarely occurred in the other genotypes (Fig. 7A,B). Ultrastructurally, such structures corresponded to myelin debris (Fig. 7C,D). Additionally, several axons in the spinal cord of CGT/ASA(−/−) mice displayed increased electron density of their axoplasm. This feature together with the myelin debris was taken as indicating Wallerian degeneration of nerve fibers. The occurrence of myelin debris was quantified for the anterior spinothalamic tract of the cervical spinal cord and turned out to be significantly more frequent in CGT/ASA(−/−) mice than in any of the other genotypes (Fig. 7E), except for the CST/CGT/ASA(−/−) mice, where myelin debris were still more frequent (data not shown). In 2-month-old CGT/ASA(−/−) mice, the degree of axonal degeneration was significantly less than in 5- to 6-month-old CGT/ASA(−/−) mice (Fig. 7E). Thus, the degree of axonal degeneration correlated with the increase in neuronal sulfatide storage. For CST/ASA(−/−) and ASA(−/−), no significant difference was found compared with wild-type controls.
Figure 7.
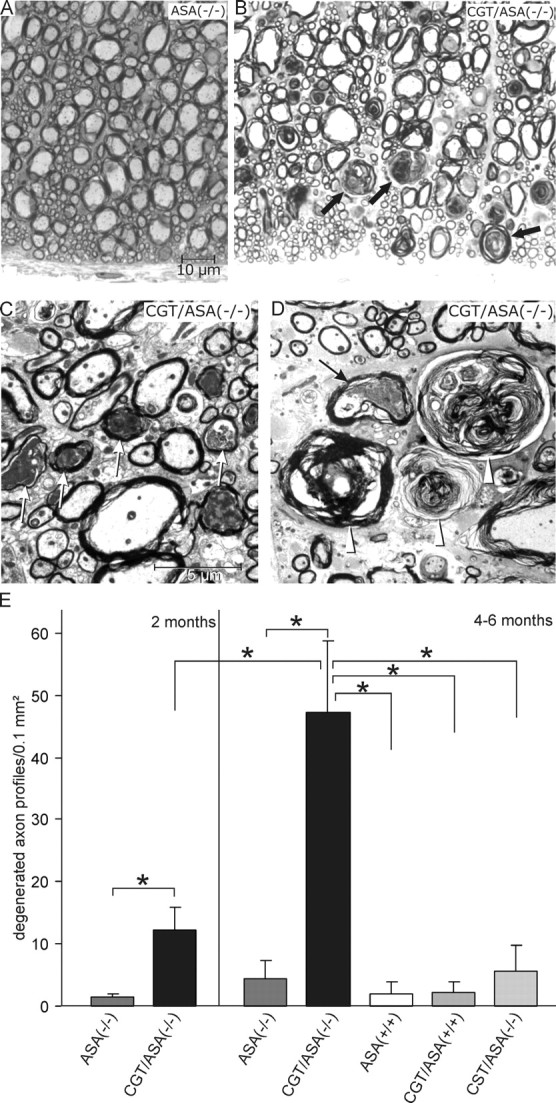
Degeneration of nerve fibers in the spinal cord (anterior spinothalamic tract) of CGT/ASA(−/−)mice. A, B, Toluidine blue staining of semithin sections showing the anterior spinothalamic tract. Genotypes are as indicated. In CGT/ASA(−/−) mice (B), numerous rosette-like myelin debris (some indicated by arrows) are seen, which are absent from ASA(−/−) mice (A). C, D, Electron micrographs of CGT/ASA(−/−) spinal cord. In C, several degenerating axons (arrows) are seen. In D, several concentric membranous whorls consisting of myelin debris (arrowheads) are seen, which correspond to the rosette-like structures observed at light microspopic level. The arrow in D points to a degenerating axon. E, Morphometric evaluation. The myelin debris in the anterior spinothalamic tract (in a test area of 0.1 mm2) as observed in semithin sections were quantified in mice of the indicated genotypes (age, 2 and 4–6 months). All data are expressed as mean + SD. Asterisks indicate a significant difference (p < 0.05, ANOVA followed by the LSD test). Scale bars: A, B, 10 μm; C, D, 5 μm.
Concerning demyelination, which is a hallmark of the human MLD, histological analysis of the present mice did not reveal indications of demyelination, neither in the CNS nor in the phrenic nerve. This is in line with the finding that in brain the levels of myelin basic protein, as determined by Western blotting, were not reduced in CGT- and CST-tg ASA(−/−) mice (data not shown).
Viability of sulfolipid storing neurons was unaffected
We examined whether the sulfolipid storage in neurons affected their viability. In the twitcher mouse, which is a natural mutant and a model for Krabbe disease (galactocerebrosidase deficiency), oligodendendrocytes and neurons die by apoptosis (Taniike et al., 1999). We therefore examined the possibility of apoptosis in neurons of the cortex, which displayed high levels of SGalCer storage (see above) in 4- and 6-month-old CGT/ASA(−/−) mice. Despite the increased sulfolipid accumulation observed by AB staining (Fig. 6M), apoptotic (TUNEL assay) nuclei could not be detected (data not shown). We can, however, not exclude the possibility that apoptosis occurred over a long period and that the number of apoptotic cells was too low to be detectable with certainty.
In addition, the facial nucleus, the neurons of which in CGT- and CST-tg ASA(−/−) mice displayed intense of sulfolipid storage in AB preparations, was investigated by morphometry. The densities of neuronal perikarya were similar in all genotypes without significant differences (data not shown) arguing also against apoptosis.
Abnormal cortical EEG in CGT/ASA(−/−) mice
Epileptic seizures are a frequent symptom in MLD and other leukodystrophies. To examine the consequences of altered sulfolipid storage on cortical excitability, we recorded cortical EEGs from CGT/ASA(−/−), ASA (−/−), CGT/ASA(+/+), and ASA(+/+) mice at 5–6 months of age. It was readily apparent that CGT/ASA(−/−) mice exhibited abnormal, large-amplitude episodes of spontaneous discharges (n = 8 mice) (Fig. 8A). Such discharges were virtually never observed in ASA(+/+) or CGT/ASA(+/+) mice (both n = 5 mice) (Fig. 8C). ASA(−/−) mice displayed similar events, albeit with a lower frequency of occurrence (n = 6 mice) (Fig. 8C). A closer analysis of these episodes revealed that discharges were associated with an increased power in the δ, θ, α, and β bands (Fig. 8B) [data shown only for ASA(+/+) and CGT/ASA(−/−) mice]. In CGT/ASA(−/−) mice, the recurrent discharges occurred with a frequency of 11.3 ± 3.6/h [n = 8 mice; significant difference from ASA(+/+) and CGT/ASA(+/+) mice; ANOVA with post hoc Bonferroni test). The events had an average duration of 5 ± 1 s in CGT/ASA(−/−) mice (n = 499 events in 8 mice) and of 5.3 ± 1.2 s in ASA(−/−) mice (n = 45 events in 4 mice).
Figure 8.

Cortical hyperexcitability in CGT/(ASA(−/−) mice. A, Representative cortical EEG recordings from CGT/ASA(−/−), ASA(−/−), CGT/ASA(+/+), and ASA(+/+) mice. Note the aberrant discharge episode depicted in an exemplary manner for the CGT/ASA(−/−) mouse. Such discharges were virtually never observed in ASA(+/+) or CGT/ASA(+/+) mice and rarely in ASA(−/−) mice. B, Analysis of the power in the different frequency bands over time for ASA(+/+) mice (left) and CGT/ASA(−/−) mice (right). C, Quantification of the average frequency of recurrent discharges in the different genotypes at 5–6 months of age. Asterisks indicate significant differences (ANOVA with post hoc Bonferroni test). D, Quantification of the average frequency of recurrent discharges in ASA(−/−) and CGT/ASA(−/−) mice at 8–10 weeks of age. The frequency of recurrent discharges was significantly increased in CGT/ASA(−/−) compared with ASA(−/−) mice (ANOVA with post hoc Bonferroni test). E, The frequency of polyspikes in cortical EEG recordings was not significantly different between genotypes at 5–6 months of age (ANOVA with post hoc Bonferroni test). F, The frequency of polyspikes in cortical EEG recordings in ASA(−/−) and CGT/ASA(−/−) mice at 8–10 weeks of age was significantly increased in CGT/ASA(−/−) compared with ASA(−/−) mice (ANOVA with post hoc Bonferroni test). G, Representative example of a recurrent polyspike discharge in a CGT/ASA(−/−) mouse.
In addition to the above-mentioned longer aberrant discharges, we observed recurrent polyspike discharges that also seemed to occur more often in CGT/ASA(−/−) mice (representative example depicted in Fig. 8G). When we quantified the frequency of these polyspikes in cortical EEG recordings, however, the differences between genotypes were not significant (ANOVA with post hoc Bonferroni test; numbers of mice as above) (Fig. 8E).
To examine whether EEG abnormalities are present at earlier stages, additional groups of mice were analyzed at 8–10 weeks of age. At this age, spontaneous discharges and polyspikes were observed at a much higher frequency in both CGT/ASA(−/−) and ASA(−/−) mice (both n = 5 mice) (Fig. 8D,F) compared with the older animals of any genotype. Both spontaneous discharges and polyspikes occurred significantly more often in young CGT/ASA(−/−) than in ASA(−/−) mice.
Basal EEG activity was not different between the different genotypes. We analyzed EEG segments of identical duration devoid of abnormal activity and computed the power in the different frequency bands (Fig. 9). These analyses revealed no significant differences in the frequency components of the EEG between ASA(+/+), ASA(−/−), CGT/ASA(+/+), and CGT/ASA(−/−) mice.
Figure 9.

Basal EEG activity. Basal EEG activity in the different genotypes is shown. Bar graphs show the power in the different frequency bands for all genotypes when analyzing EEG segments without any trace of abnormal activity. There was no significant difference in the frequency components of the EEG between ASA(+/+), ASA(−/−), CGT/ASA(+/+), and CGT/ASA(−/−) mice.
Discussion
As far as the pattern of lipid storage is concerned, ASA(−/−) mice resemble human MLD (Wittke et al., 2004). The mice, however, do not develop the severe neurological symptoms of the advanced stage of the human disease (Gieselmann et al., 1998). Sulfolipid storage in MLD is not restricted to oligodendrocytes and Schwann cells but is also found in other glial cells and in neurons (von Figura et al., 2001). To examine consequences of a neuron-specific increase in sulfolipid storage, we generated transgenic ASA(−/−) mice overexpressing CST and CGT under the control of the Thy1.2 promoter.
Sulfatide accumulation in neurons correlates with axonal degeneration
We show here that the overexpression of CGT in neurons caused a massive increase in neuronal sulfolipid storage in various brain regions including the cortex, the hippocampus CA3 region, thalamic nuclei, nuclei of the medulla oblongata, and neurons in the spinal cord. C18:0-SGalCer was the only lipid exhibiting an accelerated accumulation in CGT/ASA(−/−) mice, suggesting that it is responsible for the phenotype of these mice. In the spinal cord, elevated SGalCer levels in neurons were accompanied by a significant age-dependent increase in axonal degeneration in the spinal cord of CGT/ASA(−/−), which was not detectable in ASA(−/−) mice or CST/ASA(−/−) mice. Nerve fiber pathology has been observed frequently in demyelinating diseases and is generally considered to be secondary to demyelination (Bjartmar et al., 1999). Reports in the literature on morphological examinations of the spinal cord in MLD are scarce. It is therefore unclear to what extent nerve fiber degeneration occurs in the human disease.
The increase in SGalCer accumulation in CGT/ASA(−/−) mice did not lead to a significant loss of neurons. So far, the only neuron population with survival that appears to be directly affected by SGalCer storage is the spiral ganglion cells of the inner ear (D'Hooge et al., 1999a; Coenen et al., 2001). Thus, loss of spiral ganglion cells appears to indicate a high sensitivity of this cell type, whereas most neurons are able to tolerate relatively large amounts of storage material. In contrast, degeneration of cerebellar Purkinje cells in older ASA(−/−) mice occurs without any detectable SGalCer storage (D'Hooge et al., 1999b).
Cortical hyperexcitability in ASA(−/−) mice
Several studies showed modulation of ion channels and Na+/K+-ATPase by SGalCer (Buschard et al., 2002; Lingwood et al., 2004; Chi and Qi, 2006). The hyperexcitability observed in cortical EEG recordings of ASA(−/−) and CGT/ASA(−/−) mice is a clear indicator that increasing SGalCer intracellularly and/or in the plasma membrane affects electrophysiological properties of neurons. The frequency of these abnormalities were significantly increased in CGT/ASA(−/−), suggesting that neuronal SGalCer storage is responsible for the hyperexcitability. Interestingly, however, these abnormalities were less severe in older ASA(−/−) and CGT/ASA(−/−) mice. Thus, the amount of neuronal SGalCer storage does not correlate with the EEG abnormalities. This may have several reasons. First, although our data show that most of the SGalCer accumulates intracellularly, SGalCer is also present at the plasma membrane (Molander-Melin et al., 2004). It is reasonable to assume that only plasma membrane-located SGalCer may impact ion channel activity directly. Excitability may thus depend on SGalCer concentrations in the plasma membrane, such that increasing concentrations are inhibitory. Alternatively, the subcellular distribution of SGalCer may vary, depending on the extent of storage. Finally, overall excitability may be a result of two overlapping effects: increased storage and axonal degeneration. The first accounts for the hyperexcitability in younger mice, and the latter accounts for its decrease in older mice.
In MLD patients, abnormal EEG has been observed even before the appearance of clinical symptoms, including asymmetric slow-wave activity and bursts of spikes (von Figura et al., 2001). In infantile and juvenile MLD, seizures are frequently observed (von Figura et al., 2001). In CGT/ASA(−/−) mice, we did not observe behavioral seizures. However, we did observe frequent, spontaneous abnormal discharges of 5–15 s duration in these animals that occurred significantly more often than in ASA(+/+) or CGT-tg mice. The occurrence of such discharges at high frequencies is an indicator that accumulation of sulfolipids does cause cortical hyperexcitability. It should also be noted that spontaneous seizures are also rare in late-onset, adult forms of MLD (von Figura et al., 2001).
Together, our results suggest that intracellular storage of SGalCer and/or the increase in this lipid in the neuronal plasma membrane cause cortical hyperexcitability. To what extent, however, neuronal SGalCer accumulation or SGalCer storage in myelin/oligodendrocytes and subsequent demyelination contributes to EEG abnormalities and seizures observed in MLD patients will require additional investigations.
Neuronal accumulation of other sulfolipids did not affect the phenotype of ASA(−/−) mice
AB staining showed comparable sulfolipid storage in CST/ASA(−/−) and CGT/ASA(−/−) mice in the cortex. Lipid analysis, however, revealed a weaker increase in C18:0-SGalCer in CST/ASA(−/−) mice compared with ASA(−/−) mice than in CGT/ASA(−/−) mice. Because at least three different sphingolipids beside SGalCer accumulated in CST/ASA(−/−) mice, as shown by TLC, the AB-reactive material in tissue sections most likely is composed of these different sulfolipids in addition to SGalCer. Other accumulating sulfo-sphingolipids might be SLacCer, sulfated glucosylceramide, trihexosylceramides, and tetrahexosylceramides, such as SB1a (gangliotetraosylceramide II3, IV3-bis-sulfate), which has been found to accumulate in the kidney of ASA(−/−) mice (Sandhoff et al., 2002). In contrast to CGT/ASA(−/−) mice, however, accelerated accumulation of these sulfolipids in CST/ASA(−/−) mice did not at all lead to a deterioration of the behavioral phenotype of ASA(−/−) mice and did not cause nerve fiber degeneration. Whether the absence of any functional deficits in CST/ASA(−/−) mice is attributable to the different composition of the storage material or the variation in their regional distribution between CGT/ASA(−/−) and CST/ASA(−/−) is currently not clear. At least in the spinal cord, the amount of alcianophilic material in CST/ASA(−/−) appeared to be slightly less than in CGT/ASA(−/−) mice, and this might explain that nerve fiber degeneration was only observed in the latter. Notably, despite the relatively large amount of alcianophilic storage material in neurons of aged (>1-year-old) ASA(−/−) mice (Wittke et al., 2004), SLacCer was undetectable in the brain of ASA(−/−) mice in a recent study (Molander-Melin et al., 2004), which is in agreement with our mass spectrometry analysis. Together with the data presented here [i.e., accumulation of SLacCer in CST/ASA(−/−) mice], this suggests that accumulation of SLacCer does not have a major impact on the pathogenesis of MLD.
The pattern of sulfolipid accumulation revealed some significant differences between CGT/ASA(−/−) and CST/ASA(−/−) mice. The differences in storage pattern between CGT/ASA(−/−) and CST/ASA(−/−) mice can be explained by differences in the expression pattern of the endogenous CST, CGT, and the other galactosyltransferases involved in the synthesis of sulfolipids (Fig. 1). For example, the presence of significant sulfolipid accumulation in CA1 pyramidal neurons of CST/ASA(−/−) mice, but its absence in CGT/ASA(−/−) mice, can be explained by the absence of endogenous CST expression in CA1 neurons. The apparent regional differences between the two mouse lines, concerning the amount of storage material, is probably attributable to differences in expression or activity of endogenous CST and CGT. At present, we cannot rule out the possibility that these regional differences in sulfolipid storage pattern could also, in part, account for the differences between the phenotypes of CGT/ASA(−/−) and CST/ASA(−/−) mice.
Neuronal sulfatide storage and forms of MLD
MLD can be classified into infantile, juvenile, and adult forms (von Figura et al., 2001). The early-onset forms are caused by a complete loss of ASA activity. Characteristic symptoms of infantile and juvenile MLD are blindness, loss of speech, quadriparesis, peripheral neuropathy, and seizures. Late-onset (adult) MLD is characterized by low residual ASA activity (von Figura et al., 2001). Characteristic symptoms in adult MLD are schizophrenia-like behavioral abnormalities [in patients with the I179S mutation (Tylki-Szymanska et al., 1996)] or clumsiness of movement and spastic paresis of arms and legs [in patients with the P426L mutation (Berger et al., 1997)]. In contrast, nerve conduction velocity is sometimes normal, and signs of peripheral neuropathy and demyelination are often absent (Kolodny and Fluharty, 1995). The reason for the differences between early- and late-onset forms of MLD might be the very low myelin lipid turnover after the initial formation of myelin (Norton and Cammer, 1984). CGT/ASA(−/−) developed tremor of the head, ataxia, and weakness of hindlimbs and forelimbs, but we did not find indications for demyelination or peripheral neuropathy. Thus, symptoms in CGT/ASA(−/−) appear to be more related to adult MLD than to infantile MLD, supporting the hypothesis of a relationship between neuronal SGalCer accumulation and some neurological symptoms in late-onset (adult) MLD, as suggested by Betts et al. (1969).
Together, transgenic overexpression of CGT in neurons of ASA(−/−) mice strongly impairs neuromotor coordination in a similar but much more pronounced way as in old ASA(−/−) mice. Neurological symptoms of CGT/ASA(−/−) mice are reminiscent of symptoms observed in MLD patients, particularly those observed in the late-onset type. Thus, it might be possible that at least some of the symptoms observed in MLD are caused by SGalCer accumulation in neurons and are not secondary to SGalCer accumulation in and functional impairments of oligodendrocytes/Schwann cells and demyelination.
Footnotes
This work was supported by Deutsche Forschungsgemeinschaft Grant SFB 645 to the University of Bonn. We thank Ivonne Becker, Dagmar Niemeier, and Clemens Franke for expert technical assistance and Dr. H. van der Putten for providing the Thy1.2 cassette plasmid.
References
- Benjamins JA, Hadden T, Skoff RP. Cerebroside sulfotransferase in Golgi-enriched fractions from rat brain. J Neurochem. 1982;38:233–241. doi: 10.1111/j.1471-4159.1982.tb10875.x. [DOI] [PubMed] [Google Scholar]
- Berger J, Loschl B, Bernheimer H, Lugowska A, Tylki-Szymanska A, Gieselmann V, Molzer B. Occurrence, distribution, and phenotype of arylsulfatase A mutations in patients with metachromatic leukodystrophy. Am J Med Genet. 1997;69:335–340. [PubMed] [Google Scholar]
- Betts TA, Smith WT, Kelly RE. Adult metachromatic leukodystrophy (sulphatide lipidosis) simulating acuteschizophrenia. Report of a case. Neurology. 1968;18:1140–1142. doi: 10.1212/wnl.18.11.1140. [DOI] [PubMed] [Google Scholar]
- Bjartmar C, Yin X, Trapp BD. Axonal pathology in myelin disorders. J Neurocytol. 1999;28:383–395. doi: 10.1023/a:1007010205037. [DOI] [PubMed] [Google Scholar]
- Buschard K, Hoy M, Bokvist K, Olsen HL, Madsbad S, Fredman P, Gromada J. Sulfatide controls insulin secretion by modulation of ATP-sensitive K+-channel activity and Ca(2+)-dependent exocytosis in rat pancreatic β-cells. Diabetes. 2002;51:2514–2521. doi: 10.2337/diabetes.51.8.2514. [DOI] [PubMed] [Google Scholar]
- Chi S, Qi Z. Regulatory effect of sulphatides on BKCa channels. Br J Pharmacol. 2006;149:1031–1038. doi: 10.1038/sj.bjp.0706947. [DOI] [PMC free article] [PubMed] [Google Scholar]
- Chirgwin JM, Przybyla AE, MacDonald RJ, Rutter WJ. Isolation of biologically active ribonucleic acid from sources enriched inribonuclease. Biochemistry. 1979;18:5294–5299. doi: 10.1021/bi00591a005. [DOI] [PubMed] [Google Scholar]
- Coenen R, Gieselmann V, Lüllmann-Rauch R. Morphological alterations in the inner ear of the arylsulfatase A-deficientmouse. Acta Neuropathol (Berl) 2001;101:491–498. doi: 10.1007/s004010000318. [DOI] [PubMed] [Google Scholar]
- D'Hooge R, Coenen R, Gieselmann V, Lüllmann-Rauch R, De Deyn PP. Decline in brainstem auditory-evoked potentials coincides with loss of spiral ganglion cells in arylsulfatase A-deficient mice. Brain Res. 1999a;847:352–356. doi: 10.1016/s0006-8993(99)02085-5. [DOI] [PubMed] [Google Scholar]
- D'Hooge R, Hartmann D, Manil J, Colin F, Gieselmann V, De Deyn PP. Neuromotor alterations and cerebellar deficits in aged arylsulfataseA-deficient transgenic mice. Neurosci Lett. 1999b;273:93–96. doi: 10.1016/s0304-3940(99)00647-3. [DOI] [PubMed] [Google Scholar]
- D'Hooge R, Van Dam D, Franck F, Gieselmann V, De Deyn PP. Hyperactivity, neuromotor defects, and impaired learning and memory in a mouse model for metachromatic leukodystrophy. Brain Res. 2001;907:35–43. doi: 10.1016/s0006-8993(01)02374-5. [DOI] [PubMed] [Google Scholar]
- Eckhardt M, Fewou SN, Ackermann I, Gieselmann V. N-glycosylation is required for full enzymic activity of the murine galactosylceramide sulphotransferase. Biochem J. 2002;368:317–324. doi: 10.1042/BJ20020946. [DOI] [PMC free article] [PubMed] [Google Scholar]
- Fewou SN, Büssow H, Schaeren-Wiemers N, Vanier MT, Macklin WB, Gieselmann V, Eckhardt M. Reversal of non-hydroxy:alpha-hydroxy galactosylceramide ratio and unstable myelin in transgenic mice overexpressing UDP-galactose:ceramide galactosyltransferase. J Neurochem. 2005;94:469–481. doi: 10.1111/j.1471-4159.2005.03221.x. [DOI] [PubMed] [Google Scholar]
- Gieselmann V, Matzner U, Hess B, Lüllmann-Rauch R, Coenen R, Hartmann D, D'Hooge R, DeDeyn P, Nagels G. Metachromatic leukodystrophy: molecular genetics and an animal model. J Inherit Metab Dis. 1998;21:564–574. doi: 10.1023/a:1005471106088. [DOI] [PubMed] [Google Scholar]
- Hess B, Saftig P, Hartmann D, Coenen R, Lüllmann-Rauch R, Goebel HH, Evers M, von Figura K, D'Hooge R, Nagels G, De Deyn P, Peters C, Gieselmann V. Phenotype of arylsulfatase A-deficient mice: relationship to human metachromatic leukodystrophy. Proc Natl Acad Sci USA. 1996;93:14821–14826. doi: 10.1073/pnas.93.25.14821. [DOI] [PMC free article] [PubMed] [Google Scholar]
- Isaac G, Pernber Z, Gieselmann V, Hansson E, Bergquist J, Mansson JE. Sulfatide with short fatty acid dominates in astrocytes and neurons. FEBS J. 2006;273:1782–1790. doi: 10.1111/j.1742-4658.2006.05195.x. [DOI] [PubMed] [Google Scholar]
- Kolodny EH, Fluharty AL. Metachromatic leukodystrophy and multiple sulfatase deficiency: sulfatide lipidosis. In: Scriver CR, Beaudet AL, Sly WS, Valle D, editors. The metabolic and molecular bases of inherited disease. New York: McGraw-Hill; 1995. pp. 2693–2739. [Google Scholar]
- Kuhn PL, Petroulakis E, Zazanis GA, McKinnon RD. Motor function analysis of myelin mutant mice using a rotarod. Int J Dev Neurosci. 1995;13:715–722. doi: 10.1016/0736-5748(96)81215-9. [DOI] [PubMed] [Google Scholar]
- Lingwood D, Fisher LJ, Callahan JW, Ballantyne JS. Sulfatide and Na+-K+-ATPase: a salinity-sensitive relationship in the gill basolateral membrane of rainbow trout. J Membr Biol. 2004;201:77–84. doi: 10.1007/s00232-004-0708-3. [DOI] [PubMed] [Google Scholar]
- Lüllmann-Rauch R, Matzner U, Franken S, Hartmann D, Gieselmann V. Lysosomal sulfoglycolipid storage in the kidneys of mice deficient for arylsulfatase A (ASA) and of double-knockout mice deficient for ASA and galactosylceramide synthase. Histochem Cell Biol. 2001;116:161–169. doi: 10.1007/s004180100286. [DOI] [PubMed] [Google Scholar]
- Lüthi A, Van der Putten H, Botteri FM, Mansuy IM, Meins M, Frey U, Sansig G, Portet C, Schmutz M, Schroder M, Nitsch C, Laurent JP, Monard D. Endogenous serine protease inhibitor modulates epileptic activity and hippocampal long-term potentiation. J Neurosci. 1997;17:4688–4699. doi: 10.1523/JNEUROSCI.17-12-04688.1997. [DOI] [PMC free article] [PubMed] [Google Scholar]
- Molander-Melin M, Pernber Z, Franken S, Gieselmann V, Mansson JE, Fredman P. Accumulation of sulfatide in neuronal and glial cells of arylsulfatase A deficient mice. J Neurocytol. 2004;33:417–427. doi: 10.1023/B:NEUR.0000046572.53905.2c. [DOI] [PubMed] [Google Scholar]
- Morell P, Radin NS. Synthesis of cerebroside by brain from uridine diphosphate galactose and ceramide containing hydroxy fatty acid. Biochemistry. 1969;8:506–512. doi: 10.1021/bi00830a008. [DOI] [PubMed] [Google Scholar]
- Norton WT, Cammer W. Chemical pathology of diseases involving myelin. In: Morell P, editor. Myelin. New York: Plenum; 1984. pp. 147–195. [Google Scholar]
- Pernber Z, Molander-Melin M, Berthold CH, Hansson E, Fredman P. Expression of the myelin and oligodendrocyte progenitor marker sulfatide in neurons and astrocytes of adult rat brain. J Neurosci Res. 2002;69:86–93. doi: 10.1002/jnr.10264. [DOI] [PubMed] [Google Scholar]
- Raghavan S, Kanfer JN. Ceramide galactoside of enriched neuronal and glial fractions from rat brain. J Biol Chem. 1972;247:1055–1056. [PubMed] [Google Scholar]
- Sambrook J, Fritsch EF, Maniatis T. Molecular cloning: a laboratory manual. Cold Spring Harbor, NY: Cold Spring Harbor Laboratory; 1989. [Google Scholar]
- Sandhoff R, Hepbildikler ST, Jennemann R, Geyer R, Gieselmann V, Proia RL, Wiegandt H, Grone HJ. Kidney sulfatides in mouse models of inherited glycosphingolipid disorders:determination by nano-electrospray ionization tandem mass spectrometry. J Biol Chem. 2002;277:20386–203978. doi: 10.1074/jbc.M110641200. [DOI] [PubMed] [Google Scholar]
- Schott I, Hartmann D, Gieselmann V, Lüllmann-Rauch R. Sulfatide storage in visceral organs of arylsulfatase A-deficient mice. Virchows Arch. 2001;439:90–96. doi: 10.1007/s004280000360. [DOI] [PubMed] [Google Scholar]
- Taniike M, Mohri I, Eguchi N, Irikura D, Urade Y, Okada S, Suzuki K. An apoptotic depletion of oligodendrocytes in the twitcher, a murine model of globoid cell leukodystrophy. J Neuropathol Exp Neurol. 1999;58:644–653. doi: 10.1097/00005072-199906000-00009. [DOI] [PubMed] [Google Scholar]
- Tylki-Szymanska A, Berger J, Loschl B, Lugowska A, Molzer B. Late juvenile metachromatic leukodystrophy (MLD) in three patients with a similar clinical course and identical mutation on one allele. Clin Genet. 1996;50:287–292. doi: 10.1111/j.1399-0004.1996.tb02376.x. [DOI] [PubMed] [Google Scholar]
- van der Putten H, Wiederhold KH, Probst A, Barbieri S, Mistl C, Danner S, Kauffmann S, Hofele K, Spooren WP, Rueg MA, Lin S, Caroni P, Sommer B, Tolnay M, Bilbe G. Neuropathology in mice expressing human α-synuclein. J Neurosci. 2000:6021–6029. doi: 10.1523/JNEUROSCI.20-16-06021.2000. [DOI] [PMC free article] [PubMed] [Google Scholar]
- von Figura K, Gieselmann V, Jaeken J. Metachromatic leukodystrophy. In: Scriver CR, Beaudet AL, Valle D, Sly WS, editors. The metabolic and molecular basis of inherited disease. New York: McGraw-Hill; 2001. pp. 3695–3724. [Google Scholar]
- Wittke D, Hartmann D, Gieselmann V, Lüllmann-Rauch R. Lysosomal sulfatide storage in the brain of arylsulfatase A-deficient mice:cellular alterations and topographic distribution. Acta Neuropathol (Berl) 2004;108:261–271. doi: 10.1007/s00401-004-0883-6. [DOI] [PubMed] [Google Scholar]
- Yaghootfam A, Gieselmann V, Eckhardt M. Delay of myelin formation in arylsulphatase A-deficient mice. Eur J Neurosci. 2005;21:711–720. doi: 10.1111/j.1460-9568.2005.03891.x. [DOI] [PubMed] [Google Scholar]
- Yao JK, Rastetter GM. Microanalysis of complex tissue lipids by high-performance thin-layer chromatography. Anal Biochem. 1985;150:111–116. doi: 10.1016/0003-2697(85)90447-6. [DOI] [PubMed] [Google Scholar]
- Zöller I, Büssow H, Gieselmann V, Eckhardt M. Oligodendrocyte-specific ceramide galactosyltransferase (CGT) expression phenotypically rescues CGT-deficient mice and demonstrates that CGT activity does not limit brain galactosylceramide level. Glia. 2005;52:190–198. doi: 10.1002/glia.20230. [DOI] [PubMed] [Google Scholar]