

Abstract
Whether conventional gradient-echo (GE) blood oxygenation-level-dependent (BOLD) functional magnetic resonance imaging (fMRI) is able to map submillimeter-scale functional columns remains debatable mainly because of the spatially nonspecific large vessel contribution, poor sensitivity and reproducibility, and lack of independent evaluation. Furthermore, if the results from optical imaging of intrinsic signals are directly applicable, regions with the highest BOLD signals may indicate neurally inactive domains rather than active columns when multiple columns are activated. To examine these issues, we performed BOLD fMRI at a magnetic field of 9.4 tesla to map orientation-selective columns of isoflurane-anesthetized cats. We could not convincingly map orientation columns using conventional block-design stimulation and differential analysis method because of large fluctuations of signals. However, we successfully obtained GE BOLD iso-orientation maps with high reproducibility (r = 0.74) using temporally encoded continuous cyclic orientation stimulation with Fourier data analysis, which reduces orientation-nonselective signals such as draining artifacts and is less sensitive to signal fluctuations. We further reduced large vessel contribution using the improved spin-echo (SE) BOLD method but with overall decreased sensitivity. Both GE and SE BOLD iso-orientation maps excluding large pial vascular regions were significantly correlated to maps with a known neural interpretation, which were obtained in contrast agent-aided cerebral blood volume fMRI and total hemoglobin-based optical imaging of intrinsic signals at a hemoglobin iso-sbestic point (570 nm). These results suggest that, unlike the expectation from deoxyhemoglobin-based optical imaging studies, the highest BOLD signals are localized to the sites of increased neural activity when column-nonselective signals are suppressed.
Keywords: CBV, CBF, optical imaging, hemodynamic response, ocular dominance column, orientation column
Introduction
Conventional gradient-echo (GE) blood oxygenation-level-dependent (BOLD) functional magnetic resonance imaging (fMRI) has become the dominant methodology for brain studies at supramillimeter resolution. However, in-depth investigations of cortical information processing require submillimeter-resolution fMRI to map functional modules such as orientation columns (Hubel and Wiesel, 1962; Blasdel and Salama, 1986). Iso-orientation maps have been obtained by fMRI techniques based on the metabolically related early negative BOLD dip (Kim et al., 2000), hemodynamic cerebral blood flow (CBF) (Duong et al., 2001), or cerebral blood volume (CBV) (Zhao et al., 2005) but not with GE BOLD fMRI (Duong et al., 2000b; Kim et al., 2000). Because the BOLD dip and CBF-based fMRI have poor sensitivity and because the CBV-based fMRI uses exogenous contrast agents, they cannot be easily used for high-resolution human fMRI studies. Additionally, because the commonly used GE BOLD technique is highly sensitive to less-specific large venous vessels (Kim et al., 2000), suppressing draining vessel contributions to positive BOLD (i.e., hyperoxygenated) signal is essential for detecting small neurally activated signals.
Although the draining artifacts can be suppressed and BOLD columnar maps can be obtained (Menon et al., 1997; Menon and Goodyear, 1999; Dechent and Frahm, 2000; Cheng et al., 2001; Goodyear and Menon, 2001), interpreting these maps requires evidence that the BOLD signals are spatially correlated with sites of increased neural activity (Duong et al., 2000b; Cheng et al., 2001). The BOLD signal point spread function (PSF) is determined by a mismatch between the cerebral metabolic rate of oxygen (CMRO2) and CBF responses (Fig. 1). When multiple columns are active, the highest BOLD signals could originate from neurally active domains if CBF PSF is narrow relative to an intercolumn distance (Duong et al., 2001), or the highest BOLD signal could originate from neurally inactive domains if the CBF response is broad as suggested by optical spectroscopic imaging (Malonek and Grinvald, 1996). Therefore, it is critical to determine the neural interpretation of positive BOLD fMRI maps at submillimeter columnar resolution.
Figure 1.

Schematics for spatial profiles of fMRI signals in response to 0° orientation stimulation when multiple 0° iso-orientation columns are activated. BOLD signal (red lines) depends on changes in dHb amounts resulting from alterations in CMRO2 (green lines) and CBF (blue lines) in response to increased neuronal activity (white regions). If a CBF PSF is rather narrow (solid blue line) and/or if the amplitude difference between active and inactive columns for CBF is much larger than that for CMRO2 response, the highest change of the BOLD signal (solid red line) will mark the sites of increased neural activity. In contrast, if the CBF response is rather broad or has relatively small amplitude difference between active and inactive columns (dashed blue line), the highest change of the BOLD signal (dashed red line) could mark the sites of no neural activity as seen in dHb-weighted OIS and dHb signals obtained from optical spectroscopy during the hyperoxygenated phase. Thus, the assignment of orientation preference to BOLD fMRI maps is dependent on both PSF and magnitude of CBF responses. CBV PSF may be similar to or a little broader than CBF PSF, but that is not shown here.
In the present study, we examined active column-specific and nonspecific BOLD signals using the cat iso-orientation columns. We also aimed to improve the sensitivity of orientation-selective BOLD signals and to interpret the BOLD iso-orientation maps. To reduce large orientation-nonspecific signals, we evaluated two approaches on continuously acquired data at 9.4 tesla: a continuous stimulation paradigm and spin-echo (SE) BOLD. The continuous cyclic stimulation paradigm with the Fourier analysis approach (Engel et al., 1994; Sereno et al., 1995) is known to be effective for suppressing large orientation-nonspecific signals to detect small orientation-specific signals (Kalatsky and Stryker, 2003); we compared this continuous temporally encoded method to conventional block-design method with differential data analysis. The SE BOLD technique at high magnetic fields, which is known to be mostly sensitive to microvessels (Lee et al., 1999; Zhao et al., 2004), was used for comparison with GE BOLD fMRI. For neural interpretation, BOLD iso-orientation maps were directly compared with CBV fMRI maps and to CBV-weighted optical intrinsic signal (OIS) maps, where spatial neural correlations are known (Fukuda et al., 2006a).
Materials and Methods
Animal preparation.
All experiments were approved by the Institutional Animal Care and Use Committee of the University of Pittsburgh. Six cats (1.3–2.5 kg; 13.6–21.7 weeks of age) were used for fMRI studies, and three of these cats were studied by optical imaging for comparison. Each cat was initially treated with atropine sulfate (0.05 mg/kg, i.m.). Anesthesia was induced by a mixture of ketamine (10–20 mg/kg, i.m.) and xylazine (1 mg/kg, i.m.); surgery was performed under a mixture of air and O2 (maintaining a 30–35% O2 level) with 2% isoflurane, and all experiments were performed at a 0.8–1.2% isoflurane level. The cat was paralyzed with pancuronium bromide (0.2 mg/kg/hr, i.v.), and appropriate contact lenses were used. For fMRI studies, the cat was placed in a cradle and secured in a normal postural position by a custom-designed head frame. After fMRI experiments, the cat was moved to the room adjacent to the MR system for the purpose of optical imaging and secured in a stereotaxic apparatus. A cranial window was made over the location of the MRI coil, and the exposed cortical surface was covered by agarose (∼1% in saline). Throughout all experiments, rectal temperature and end-tidal CO2 were maintained at 37.9 ± 0.2°C and 3.5 ± 0.1%, respectively, as in typical anesthetized cat experiments but slightly lower than the awake condition (Herbert and Mitchell, 1971).
Visual stimulation.
To activate multiple iso-orientation columns (Fig. 1), high-contrast square-wave full-field moving gratings (0.15 cycle/°; 2 cycles/s; moving direction reversal per 0.5 s) (Movshon et al., 1978) were presented binocularly. Visual stimulation was generated using either software from Cogent Graphics (John Romaya, The Wellcome Department of Imaging Neuroscience, University College London, London, UK; http://www.vislab.ucl.ac.uk/Cogent/index.html) or VSG2/5 (Cambridge Research Systems, Rochester, UK). For each continuous stimulation run, one stimulation cycle consisting of eight consecutive orientations (0–157.5°; 22.5° increments; 10 s each) was repeated 11 times without gaps between stimuli (80 s per cycle; 880 s per run). To obtain functional responses in a single-orientation stimulation paradigm, 20 s one-orientation stimulation (67.5°) was presented at 50 s before and 110 s after each continuous stimulation run. For comparison, a block-design stimulation run consisting of four 10 s orientations (0, 45, 90, and 135°) alternated with 20 s homogeneous gray (“blank” control) was performed (10 cycles; 1200 s) using GE BOLD fMRI. Stimulation was synchronized with the image acquisition.
MRI experiments.
All MR imaging was performed on a 9.4 tesla MR system (Varian, Palo Alto, CA) with a horizontal magnet (clear bore size, 31 cm) and an actively shielded gradient coil (inner diameter, 12 cm; maximal strength, 40 gauss/cm; rise time, 130 μs) using a custom-made surface radio frequency coil (inner diameter, 1.6 cm) positioned over the primary visual cortex. The position of the functional imaging slice was determined based on a flow-compensated, gradient-recalled, three-dimensional (3-D) venographic image [repetition time (TR), 50 ms; echo time (TE), 20 ms; data matrix, 512 × 256 × 256; field of view (FOV), 3.5 × 2.2 × 2.2 cm3; resolution, 68 × 86 × 86 μm3] (Park and Kim, 2005). Using the 3-D venographic image, a single 1-mm-thick imaging slice was selected with the aid of a homemade C++ visualization program (Microsoft, San Francisco, CA) based on two criteria: (1) avoiding large surface veins that induce large susceptibility artifacts in echo planar imaging (EPI) and may have large nonspecific GE BOLD signal changes (Kim et al., 2000); and (2) including a flat dorsal surface area as large as possible and tangential to the marginal gyrus. In this slice, the intracortical veins perpendicular to the surface of gyrus appear as dark spots (Fig. 2 B) (columns are supposed to be arranged parallel to these intracortical veins). Once a slice position was determined, a two-dimensional (2-D) vessel-weighted GE image was acquired (TR, 50 ms; TE, 15–20 ms; data matrix, 256 × 256; FOV, 2 × 2 cm2; thickness, 1 mm) as an anatomical reference of fMRI data.
Figure 2.

Slice selection for functional imaging and block-design BOLD fMRI results. A, Coronal view (thickness, 1 mm) reconstructed from 3-D venogram data. From the 3-D venogram, a 1-mm-thick slice (white rectangle) was selected for functional imaging studies. B, Dorsal view of the 1-mm-thick slice selected in A. Black dashed rectangles excluding edges of the brain are chosen as ROIs for the subsequent analysis. Either black or white dashed contours roughly trace the boundary between the brain and background and are used for images in B, C, and E and in Figures 4 A, 6 A–D, and 7 A. C, Left to right, Single-condition maps of 0 and 90° stimulation and differential map of 0 versus 90° stimulation. Black arrowheads indicate the draining vessel artifacts in the single-condition maps, and white arrowheads indicate the remaining draining artifacts in the differential map. D, Pixel-wise correlation coefficients between the averaged differential map over 10 cycles and differential maps of an individual cycle within two rectangles shown in B. The dashed horizontal line indicates the mean correlation value in noise area (0.32 ± 0.05; n = 10 cycles). E, Left, Mask image of activation pixels for 0 and 90° stimulation. Blue and red pixels correspond to 0 and 90° activation ROIs, respectively, within the rectangles in B; pixels with values of top 25% and bottom 25% were assigned to 0 and 90° activation ROIs. Middle and right, BOLD responses to 0° (blue traces) and 90° (red traces) stimulation are plotted from 0 and 90° ROIs as a function of time; their differential signals (green traces) are also shown. Each cycle's response was normalized with the average for 5 s prestimulus baseline, and 10 cycles were averaged. Stimulation was applied for 10 s (gray area). For clarity, only one-side error bars indicating 1 SD are shown. D, Dorsal; R, right; A, anterior; LS, lateral sulcus; SSPL, suprasplenial sulcus; SPL, splenial sulcus; mg, marginal gyrus; ML, midline. These abbreviations are used in subsequent figures.
Three different fMRI images were obtained using EPI techniques with data matrix, 64 × 64, and FOV, 2 × 2 cm2 (thickness, 1 mm): (1) GE BOLD fMRI with TR = 0.5 s and TE = 18 ms; (2) SE BOLD fMRI with TR = 2.0 s and TE = 40 ms (Lee et al., 1999); and (3) CBV-weighted fMRI with TR = 1.0 s and TE = 10 ms after an intravascular bolus injection of a dextran-coated monocrystalline iron oxide nanoparticles (MION) contrast agent (10–20 mg Fe/kg body weight) (Zhao et al., 2005, 2006; Fukuda et al., 2006a). Average repetitions of continuous stimulation runs (n = 6 cats) were 3.3 ± 1.8 for GE BOLD, 5.7 ± 1.0 for SE BOLD, and 2.5 ± 0.5 for CBV-weighted fMRI.
OIS experiments.
After the fMRI experiments, all OIS imaging with 570 ± 10 nm wavelength light (n = 3 cats; three runs) was performed on a custom-built imaging system (Moon et al., 2004). The 570 nm wavelength was chosen to record CBV-weighted OIS because of its high sensitivity compared with deoxyhemoglobin-weighted 620 nm OIS when continuous stimulation is used. Temporally encoded orientation maps obtained from these two wavelengths were almost identical [Fukuda et al. (2006a), their supplemental Fig. 2]. The camera (FOV, 1.9 × 1.4 cm2; 29 × 29 μm2 per pixel) was positioned above the MR imaging area and adjusted so that the pial vessel pattern closely matched that of the MR image. The focus plane was 200–500 μm below the cortical surface. Images were acquired with a temporal resolution of 33.3 ms.
Data analysis.
All data were analyzed with homemade programs coded by Visual C++ (Microsoft, Seattle, WA) or Matlab (The MathWorks, Natick, MA). Quantitative comparisons were performed on 10 hemispheres in six cats for fMRI studies and four hemispheres in three cats for fMRI versus OIS studies.
Preprocessing.
All MR images were interpolated by zero-padding in k-space from 64 × 64 matrix to 128 × 128 matrix, resulting in nominal in-plane resolution of 156 × 156 μm2 per pixel. Before zero-filling, a low-pass Hanning filter with a cutoff frequency of 1.60 mm−1 (Oppenheim and Schafer, 1989) was applied to avoid the ringing artifact that resulted from subsequent zero-filling. This procedure did not change activation patterns (supplemental Fig. 1, available at www.jneurosci.org as supplemental material).
Because the initial 80 s (one-cycle data after the onset of continuous stimulation) included the time to reach steady state, the following continuous stimulation (800 s, 10-cycle) data were selected for additional analysis. To remove slow signal fluctuations observed in all brain pixels (referred to as global signal), signal intensity in each pixel at each time point was divided by the global signal intensity at the corresponding time point. The global signal was calculated by averaging over all brain pixels (with intensity higher than 80% of the mean intensity of the image). The underlying assumption of the global normalization is that the orientation-specific signal within the large region of interest (ROI) remains constant over varying orientation stimulation. Because each pixel has an orientation-specific temporal modulation with a phase corresponding to orientation preference and the phases are distributed evenly from 0 to 2π in the large ROI, the sum of orientation-specific signals of all pixels in the large ROI is close to constant. Therefore, the global normalization procedure did not affect orientation-specific BOLD signals. It should be noted that global signal normalization was applied only to continuous stimulation data, not to block-design stimulation data.
For CBV-weighted fMRI data, we first extracted CBV responses from the CBV-weighted and BOLD fMRI signals by adjusting different echo times (Zhao et al., 2006). Stimulation simultaneously induces CBV increase and deoxyhemoglobin (dHb) content decrease (i.e., hyperoxygenation); an increase in MION content induced by CBV increase decreases fMRI signals, whereas a decrease in dHb content increases fMRI signals (i.e., positive BOLD response). To determine only stimulation-induced CBV responses without the contribution of dHb change, BOLD contribution to the CBV-weighted fMRI signals was corrected as (CBV-weighted response) minus (BOLD response) × (10 ms/18 ms), where 10 ms and 18 ms are TE of CBV-weighted and BOLD measurements, respectively. This correction assumes that the intravascular contribution to BOLD signals is minimal in our experimental conditions. Columnar patterns of fMRI signals with MION injection did not change before and after BOLD correction (r = 0.96 ± 0.01; n = 10 hemispheres; p < 0.001 for each) (supplemental Fig. 2, available at www.jneurosci.org as supplemental material), because the effect of MION in vessels almost overcomes the BOLD effect.
Generation of functional maps.
For block-design stimulation data, single-condition maps were obtained by subtracting an average of 5 s prestimulus baseline images from an average of images obtained between 5 and 10 s after the onset of each orientation stimulus (i.e., 0, 45, 90, and 135°). Differential maps were determined by subtracting the single-condition maps obtained from two orthogonal 0 and 90° stimuli.
For continuous stimulation data, iso-orientation maps were determined by two different approaches: differential method and Fourier analysis (Engel et al., 1997; Kalatsky and Stryker, 2003). For the differential method, an average image obtained at 5–10 s after the onset of 90° stimulation was subtracted from that corresponding to 0° stimulation. To generate temporally encoded iso-orientation maps with Fourier analysis, the orientation-specific fMRI signal induced by continuous stimulation was modeled using a sinusoidal function with magnitude and phase at an orientation-specific frequency, f s, as follows:
where ΔS(x, y, t) is the orientation-specific signal intensity at position x and y at time t (i.e., “activation” map or iso-orientation map); M(x, y) and φ(x, y) are the absolute magnitude and phase of the frequency f s component [i.e., 1/(80 s) = 0.0125 Hz for orientation-specific stimulation cycle]. Phase φ(x, y) is a sum of the stimulation onset time and a slow hemodynamic delay. Therefore, the hemodynamic delay must be considered for assignment of orientation preference to each pixel; it was found to be ∼5 s for BOLD fMRI and ∼13 s for CBV fMRI and OIS data (Fukuda et al., 2006a) (supplemental Fig. 3, available at www.jneurosci.org as supplemental material). Thus, the iso-orientation map of 0° orientation presented at t of 0–10 s was obtained at t of 5 s for BOLD and t of 13 s for CBV studies. Because the orientation-specific signal intensity is dependent on the sensitivity of the method used, it is normalized by corresponding mean magnitude (M̄) of M(x, y) within the region of interest for comparisons between different activation maps. Note that iso-orientation maps obtained from Fourier analysis are similar to “differential” maps.
Stimulation-induced hyperoxygenation increases the BOLD signal from its baseline because of decreases of dHb amount, whereas an increase in CBV decreases CBV-weighted fMRI signal and OIS from their baselines. Thus, the polarity of the BOLD fMRI signal is opposite to both CBV-weighted fMRI signal and OIS. To match the polarity of BOLD and CBV maps, values of CBV-weighted fMRI and OIS maps were inverted. Thus, brighter pixels in functional maps indicate higher positive BOLD signals or higher CBV changes. It should be noted that the polarity of the CBV signal is not inverted when its time course is presented in figures.
All iso-orientation maps were spatially filtered using a bandpass filter with a cutoff-frequency of 0.20–1.66 mm−1 to remove high-frequency noise and low spatial frequency change (supplemental Fig. 1, available at www.jneurosci.org as supplemental material). To coregister between MRI and OIS images, commonly identifiable vessels were selected in anatomic MR and optical images, and then their positions were coregistered by the linear affine transformation (Zwillinger, 1995). The same transformation was applied to functional maps.
Quantitative analyses.
All quantitative analyses [percentage signal change, reproducibility, intercolumn distance, contrast-noise ratio (CNR), spatial specificity ratio, and similarity] were performed on an active ROI (17–33 mm2) in each hemisphere, which was determined based on an activation map of CBV-weighted fMRI or OIS. As a control, similar analyses were also performed on a noise ROI (20–35 mm2), which consists of a similar number of pixels used for the active ROI but around the four corners of the image.
To obtain percentage changes for block-design stimulation data, the signal intensity in single-condition maps was normalized with the average prestimulus baseline intensity. For the continuous stimulation data, the modeled signal with a sinusoidal function (see Eq. 1) oscillates between −M(x, y) and M(x, y), thus an orientation-specific response is 2 × M(x, y). Then, percentage changes were calculated from dividing 2 × M(x, y) of the orientation-specific frequency by the magnitude of zero frequency component.
Reproducibility was examined cycle-by-cycle and run-by-run. For cycle-by-cycle reproducibility, either differential or 0° iso-orientation maps for each cycle were compared with the averaged 0° iso-orientation map obtained from all cycles using linear correlation analysis. For run-by-run reproducibility, an iso-orientation map was obtained from each 800 s run using Fourier analysis, and then a pixel-wise correlation between the maps obtained from the first run and subsequent runs was calculated and averaged for all eight orientations.
To calculate an average distance between iso-orientation columns, activation foci were determined, and then the average distance of neighboring foci was determined by the nearest-neighbor spatial analysis technique (Murphy et al., 1998) within the range of interpeak distances between 313 μm and 2 mm. The CNR of the orientation-selective signal was calculated by dividing the signal magnitude at 0.0125 Hz in the active ROI by that in the noise ROI.
Hemodynamic response induced by orientation-selective stimulation in the primary visual cortex consists of small orientation-specific and large orientation-nonspecific components. The ratio of orientation-specific to total (total = orientation-specific + orientation-nonspecific) response can be used to evaluate spatial specificity of the signals [Fukuda et al. (2006b), their Fig. 8]. Briefly, the ratio will be close to 1.0 if the orientation-specific signal is dominant in the total signal (i.e., narrow hemodynamic PSF in Fig. 1), whereas the ratio will be close to 0.0 if the orientation-nonspecific signal is dominant in the total signal (i.e., broad PSF in Fig. 1). For continuous stimulation data, the orientation-nonspecific response is saturated because of continuous cyclic stimulation without gaps and cannot be accurately determined. Therefore, the total response induced by orientation-selective stimulation was not obtained from continuous stimulation data but instead from the 20 s one-orientation stimulation data before the initiation of continuous stimulation.
Figure 8.
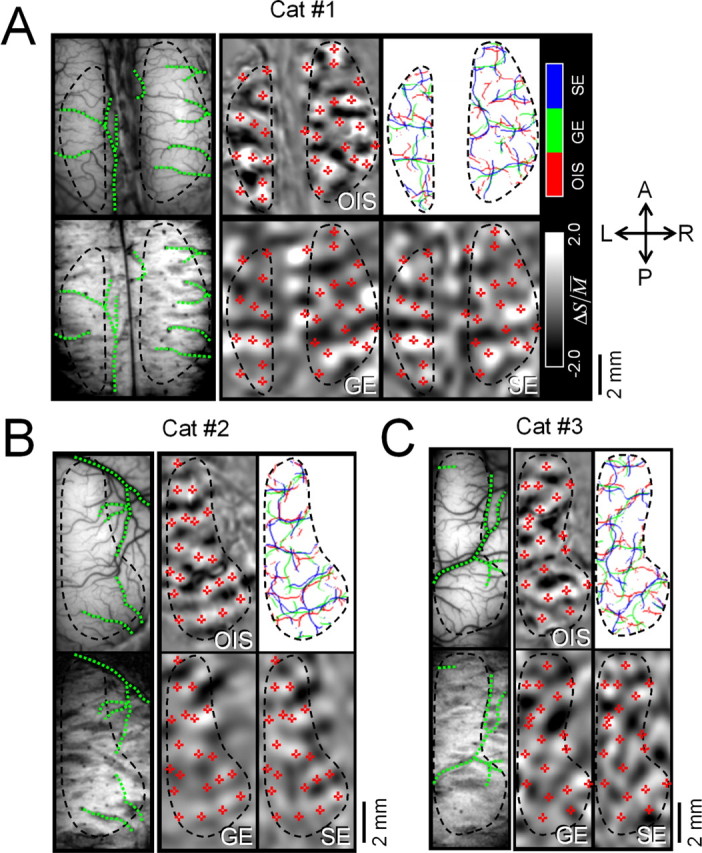
Comparison of OIS, GE BOLD, and SE BOLD iso-orientation maps. Data in A were obtained from the same cat shown in Figures 5 A, 6, and 7. Data in B were obtained from the same cat shown in Figure 5 B. A–C, Left, Cortical surface vessel images of a 570 nm optical image (top) and 1-mm-thick MR images reconstructed from 3-D venogram data (bottom). After the coregistration of two different modality images (see Materials and Methods), the large vessels tracking with green dotted lines in an OIS image were overlaid on an MR anatomic image. Right, 0° iso-orientation maps of OIS, GE BOLD fMRI, and SE BOLD fMRI and traces of local maxima of each orientation map (counter-clockwise from top left). Note that all of the values of the OIS map are inverted for direct comparison with BOLD maps. The M̄ of orientation-specific signals for OIS, GE BOLD, and SE BOLD are 0.25, 0.20, and 0.12% in A, 0.32, 0.10, and 0.09% in B, and 0.20, 0.09, and 0.08% in C, respectively. Average least distances for OIS versus GE BOLD and OIS versus SE BOLD are 0.23 and 0.23 mm in A, 0.22 and 0.23 mm in B, and 0.20 and 0.21 mm in C, respectively. Red plus signs indicating an increase in light absorption for 0° stimulation based on the OIS iso-orientation map are overlaid on fMRI maps. Black dashed contours indicating the OIS activation area are overlaid on all panels.
To determine the similarity of iso-orientation maps obtained from different fMRI methods, normalized iso-orientation maps [ΔS(x, y, t)/M̄] of the same stimulus orientation were compared using a linear correlation analysis, and correlation coefficient values (R) for all eight stimulus orientations were averaged. To quantify the similarity of columnar patterns between BOLD fMRI and OIS iso-orientation maps, the least-distance for local maxima of iso-orientation domains between two 0° iso-orientation maps was determined.
Statistical analyses.
All data were analyzed by Student's t test (paired, two-tailed) or one-way ANOVA. The p value of the correlation coefficient was determined after Bonferroni correction. Data are presented as mean ± 1 SD.
Results
Orientation-specific signal of conventional BOLD fMRI
To reconfirm that orientation columns are very difficult to be detected with standard block-design stimulation (Duong et al., 2000b; Kim et al., 2000), conventional GE BOLD images were acquired during the four-orientation stimulation protocol in a single cat. If the BOLD fMRI signal is highly orientation selective, the activation patterns of orthogonal stimuli should be complementary to each other (Blasdel and Salama, 1986; Blasdel, 1992). In single-condition maps (one orientation vs blank control), activation with an average signal change of 2.4% within the ROIs (Fig. 2 B, black dashed rectangles) was diffused across the whole brain imaging area and similarly inhomogeneous regardless of stimulus orientations (Fig. 2 C, first and second panel) (45 and 135° not shown), indicating that the orientation-nonspecific signal is dominant over the orientation-specific signal. The sites of the largest BOLD activation were located at the midline and at the edges of the brain where large draining vessels exist (Fig. 2 C, black arrowheads). To remove orientation-nonspecific signals, which could mask small orientation-specific modulations, differential maps were obtained from two single-condition maps of orthogonal stimuli (0 vs 90°) (Fig. 2 C, third panel). Signal intensities in the differential map are at a background noise level except for a few patchy areas that correspond to large veins (Fig. 2 C, white arrowheads). Consequently, the cycle-by-cycle reproducibility of differential maps was quite poor in the active ROI, similar to noise (Fig. 2 D). To further explore signal properties, regions with higher signals responding to 0 or 90° stimulus were determined from the differential map, and time courses within 0 and 90° ROIs (Fig. 2 E, first panel) were obtained during 0 and 90° stimulation (Fig. 2 E, second and third panels). Clearly, the difference of signal changes during 0 and 90° stimulation (green traces) was very small relative to total stimulation-induced responses (red and blue traces). A cycle-by-cycle variation of single-condition signals for 5–10 s after stimulation onset was ∼2.5–4.5% (see error bars in red and blue traces), whereas the average intensity of the differential signal (green traces) was ∼0.3–0.7%. The average differential signal was also smaller than variations of the differential signals: 0.28–0.44 times SDs of differential signals across 10 cycles. As a result, large variations of both single-condition and differential signals will reduce the detectability of orientation-selective signals. It should be noted that unlike BOLD signals in the previous study (Kim et al., 2000), the early dip was not observed in the present study. One obvious discrepancy between the previous and present studies is temporal dynamics of positive BOLD signals [time-to-peak, 8–10 s (Kim et al., 2000) vs ∼5 s (in present studies)]. The magnitude of the early dip is closely dependent on the animal's condition [Harel et al. (2002), their Fig. 4]; when a relatively higher end-tidal CO2 level was used, stimulation-induced hemodynamic response is delayed (Cohen et al., 2002), resulting in a higher probability to detect the early dip. Note that the differential method robustly detected the ocular dominance column-specific signals in humans, the amplitude of which seems larger, ∼0.6–1.2% [TE, 15 ms at 4T (Cheng et al., 2001)], than our orientation-specific signal, 0.3–0.7% (TE, 18 ms at 9.4 T).
Figure 4.

Run-by-run reproducibility of temporally encoded GE BOLD iso-orientation maps. Data were obtained from the same cat shown in Figures 2 and 3. A, Iso-orientation maps of 0° stimulation for three different runs. Each map was presented as orientation-selective signals, ΔS normalized by the mean magnitude of the orientation-specific signals, M̄ within the tissue ROI (within yellow and black dashed contours), which is 0.22, 0.20, and 0.22% for each run. Bright and dark regions indicate increases in the orientation-specific BOLD signal during the presentation of 0 and 90° stimulation, respectively. It should be noted that iso-orientation patches in the midline are not likely because of artifacts produced by spatial filtering (see supplemental Fig. 1, available at www.jneurosci.org as supplemental material); because both hemispheres are contacted at the dorsoventral position of the imaging slice (see Fig. 2 A,B), patches in both hemispheres appear as one single contiguous patch in the middle area. B, Scatter plots for 0° iso-orientation signals from first run versus those of the second (red dots) and third (blue dots) runs within the left hemisphere ROI (yellow contour in A). Both correlation coefficients were significantly high (0.78 and 0.87; p < 0.001 for each).
To effectively reduce dominant, unstable orientation-nonspecific signals, continuous stimulation without blank control was adopted. Global signal fluctuations over a whole brain imaging area (see above, Data analysis) is likely because of changes in animal physiology, including blood pressure and blood gases (Fig. 3 A, black trace). Similar signal fluctuation observed in the small ROI (red trace) masks a small orientation-specific signal (i.e., a modulation of 80 s cycle). Thus, signal intensity in each pixel at each time point was divided by the global signal intensity at the corresponding time point to remove the slow fluctuation of baseline signal over a long experiment (blue trace). To examine the effects of continuous stimulation, cycle-by-cycle reproducibility of differential maps was calculated within the same ROI shown in Figure 2 B. The continuous stimulation paradigm dramatically improved the sensitivity of orientation-specific signals compared with the block-design stimulation paradigm (compare Figs. 3 B and 2 D); average correlation coefficients across 10 cycles were 0.44 ± 0.17 for continuous stimulation data versus 0.28 ± 0.29 for block-design stimulation data.
Figure 3.

Improved sensitivity of orientation-specific BOLD signal with temporally encoded continuous stimulation. Data were obtained from the same cat shown in Figure 2. A, Time courses over 10 cycles obtained from a whole brain imaging area (black trace) and from a 3 × 3 pixel ROI (469 × 469 μm2) indicated by the red square in the inset image before (red) or after (blue) normalization with the global signal (black trace). Inset, A 1-mm-thick MR anatomic image with a red ROI. B, Pixel-wise correlation coefficients between the mean differential map (0–90°) of 10 cycles and differential maps of individual cycles within the ROIs shown in Figure 2 B. C, Averaged time course over 10 cycles of normalized data obtained from the small ROI (red square in the inset image in A). Signals in response to changes in stimulation orientation from 0 to 157.5° (indicated by orientation of black bars) are plotted during one 80 s cycle (blue dots). Data are fitted with a sinusoidal function (brown trace). Left and right y axes are in the unit of arbitrary intensity and percentage change from the mean intensity, respectively. D, Pixel-wise correlation coefficients between the temporally encoded 0° orientation map averaged for 10 cycles and those of individual cycles calculated with Fourier analysis within the ROIs shown in Figure 2 B. The 0° orientation maps were obtained with and without the application of a spatial filer, which did not change the shapes of orientation patches (see supplemental Fig. 1, available at www.jneurosci.org as supplemental material). Dashed lines in B and D indicate mean correlation of maps in noise area. a.u., Arbitrary units.
To explore different methods of analyzing the same data obtained with continuous temporally encoded stimulation, normalized data of the 80 s stimulus cycle were averaged over 10 cycles and signal intensities from the small ROI were plotted as a function of time (Fig. 3 C, blue dots). The modulation induced by a change of stimulation orientation is well approximated by a sinusoidal function (Fig. 3 C, brown trace) because of the smooth change in orientation selectivity of neurons in primary visual cortex (Swindale, 1998) and the linear transform characteristics of hemodynamic responses (Boynton et al., 1996) and can easily be extracted by a frequency analysis method (Engel et al., 1997; Kalatsky and Stryker, 2003). The cycle-by-cycle reproducibility of orientation-selective maps from 800 s continuous stimulation data analyzed with Fourier analysis at the orientation-selective frequency (1/80 s−1) is highly significant within the ROI shown in Figure 2 B (Fig. 3 D). This demonstrates that the Fourier analysis of continuous temporally encoded stimulation data further improves the sensitivity of orientation-specific signals; average correlation coefficients across 10 cycles were 0.57 ± 0.11 with Fourier analysis (supplemental Fig. 4, available at www.jneurosci.org as supplemental material). The spatial filter did not change the shapes of the isoorientation patches (supplemental Fig. 1, available at www.jneurosci.org as supplemental material), but it did improve the spatial homogeneity of the orientation map, which resulted in better reproducibility; the average correlation coefficient for eight orientation stimulations across 10 runs with filter (0.60 ± 0.07) was significantly higher (p = 6.66 × 10−43) than without filter (0.57 ± 0.11). Thus, the continuous temporally encoded stimulation paradigm and Fourier analysis with a spatial filter can be used to obtain temporally encoded iso-orientation maps.
Temporally encoded BOLD orientation columnar mapping
To test the reproducibility of temporally encoded iso-orientation maps obtained using conventional GE BOLD fMRI across different runs, the maps of 0° stimulation determined from three consecutive 800 s runs were compared (Fig. 4 A). Bright pixels indicate increased BOLD signals during 0° stimulation, whereas dark pixels correspond to increased BOLD signals during 90° stimulation (i.e., decreased signal during 0° stimulation relative to the mean intensity). The average interdistance of iso-orientation patches for all eight orientations was 1.40 ± 0.05 mm (n = 10 hemispheres), which is consistent with previous reports of 1.1–1.4 mm (Lowel and Singer, 1990; Duong et al., 2000b, 2001; Kim et al., 2000; Zhao et al., 2005; Fukuda et al., 2006a). Patchy patterns were quite reproducible across three 800 s runs (Fig 4 A, yellow or black dashed regions); pixel-wise correlation coefficients (Fig. 4 B) within the left hemisphere ROI (Fig. 4 A, yellow dashed contour) are significantly high (r = 0.78 at first vs second runs and 0.87 at first vs third runs; p < 0.001 for each). The average pixel-wise correlation coefficient for all eight orientations across three runs was 0.74 ± 0.12 (p < 0.001 for each hemisphere) for 10 hemispheres, which is similar to the reproducibility of iso-orientation maps obtained by CBV-weighted fMRI (Fukuda et al., 2006a) (r = 0.75 ± 0.10; n = 5 at first vs second runs with 128 × 128 data collection and 512 × 512 interpolation). It should be noted that the correlation coefficients in noise regions were close to zero (r = −0.01 ± 0.06 at first vs second runs and 0.00 ± 0.12 at first vs third runs; n = 6 cats).
To further examine the reproducibility of BOLD maps, iso-orientation maps were compared with the maps obtained 1 week later (Fig. 5 A) and 1 month later (Fig. 5 B). Because imaging slice positions were varied at different sessions, images were coregistered based on intracortical vessels in anatomical images (Fig. 5, blue rectangles). Most patches appeared in the same locations even 1 week and 1 month later (Fig. 5, plus signs). The results suggest that the temporally encoded BOLD iso-orientation map is highly reproducible.
Figure 5.

Longitudinal reproducibility of temporally encoded GE BOLD iso-orientation maps. A, A comparison of maps was performed 1 week apart. The M̄ of the orientation-specific signals were 0.20% for both sessions. Run-by-run reproducibility was 0.88 in the first session and 0.86 (p < 0.001) in the session the following week. B, One month apart. M̄ values of the orientation-specific signals were 0.07% in the first session and 0.10% in the session of the following month. Run-by-run reproducibility was 0.64 and 0.62, respectively (p < 0.001). Left panels, Two anatomic images were coregistered manually based on intracortical veins indicated by blue rectangles. Right panels, 0° iso-orientation maps of BOLD fMRI obtained in the first (top) and second (bottom) sessions. Red plus signs indicating the activation sites of 0° orientation in the first session are overlaid on iso-orientation maps in the second session. Black-dotted contours roughly indicate common active areas between different imaging sessions.
Comparison of GE and SE BOLD orientation-specific activation
Despite the high reproducibility of iso-orientation maps obtained from conventional BOLD signals, the maps may be distorted by stimulation-related draining signals, because the GE BOLD signal is extremely sensitive to large draining veins (Lai et al., 1993; Menon et al., 1993; Frahm et al., 1994; Kim et al., 1994, 2000; Lee et al., 1999; Duong et al., 2000a,b). To examine this issue, SE BOLD fMRI (Lee et al., 1999; Zhao et al., 2004) was performed during exactly the same continuous stimulation paradigm, and the GE and SE BOLD magnitude maps of orientation-specific signals were compared. Artifacts from large draining vessels at the edges and at the midline of the brain were determined by the single-condition GE BOLD map obtained from block-design stimulation (Fig. 6 A,B, white arrowed regions). The magnitude of orientation-specific signals in continuous stimulation data are ∼20% of the signal intensity in single-condition maps because of the reduction of orientation-nonspecific contributions. However, the high signal intensity regions observed in the single-condition map still remained at the edges and midline of the brain in the GE BOLD magnitude map but not in the SE BOLD magnitude map (Fig. 6 C,D, white arrowed regions). Thus, large vessel contributions can distort GE BOLD-based functional maps obtained even from continuous stimulation and Fourier analysis. In the internal cortical regions excluding large pial vessel areas (within the magenta rectangles in Fig. 6 C,D), the orientation-specific activation patterns are similar between the normalized GE and SE BOLD fMRI magnitude maps (Fig. 6 E); a pixel-by-pixel correlation between these two maps is significantly high (r = 0.62; p < 0.001) (Fig. 6 F). A major difference between GE and SE BOLD signals in the internal cortical region was sensitivity. Without normalization by M̄, the actual signal intensity of orientation-specific signals in the internal cortical region for GE BOLD (0.31 ± 0.10%; n = 10 hemispheres) was significantly higher (p < 0.001) than that for SE BOLD fMRI (0.19 ± 0.07%; n = 10). The mean CNR of averaged runs for the orientation-specific GE BOLD signal (7.39 ± 2.66; n = 10; 3.3 runs) was significantly higher (p < 0.001) than that for the orientation-specific SE BOLD signal (3.09 ± 0.99; n = 10; 5.7 runs); CNRs of single runs for GE and SE BOLD signals were 4.73 ± 1.65 and 1.78 ± 0.40 (n = 10), respectively.
Figure 6.

Comparison of vascular artifacts in GE and SE BOLD fMRI maps. Data were obtained from the same cat shown in Figure 5 A. A, A 1-mm-thick anatomic image. B, Single-condition map obtained from GE BOLD data with one 20 s single-orientation stimulation before the initiation of continuous stimulation. Large surface veins in the anatomic image and with high GE BOLD changes marked by white arrowheads are overlaid on all images. C, D, Normalized magnitude maps of orientation-specific GE and SE BOLD signals obtained from continuous stimulation data. The M̄ of orientation-specific signals for GE BOLD and SE BOLD (within black dashed contours in A) are 0.20 and 0.12%, respectively. The same scale in A is used for B–D. E, Magnified normalized magnitude maps of orientation-specific GE and SE BOLD signals in the internal cortical region excluding large pial vessels (magenta rectangles in C and D). F, Pixel-wise comparison of normalized orientation-specific GE and SE BOLD magnitude maps shown in E.
To obtain insights into the orientation-nonselective contribution of parenchymal vessels on BOLD signals, the spatial specificity ratio (see Materials and Methods) was obtained. The spatial specificity ratio of GE BOLD fMRI within the internal cortical region (0.17 ± 0.06; n = 10 hemispheres) was significantly lower (p = 0.007) than that of SE BOLD fMRI (0.26 ± 0.09; n = 10), suggesting that GE BOLD signal is more spread than the SE BOLD signal, possibly because of artifacts in and around draining intracortical veins.
Assignment of stimulus orientation to temporally encoded BOLD maps
Higher BOLD signal changes could occur at cortical columns with lower CBF and CBV responses, depending on the relationship between PSFs in oxygen consumption and CBF changes (Fig. 1). To examine this issue, BOLD maps were compared with CBV fMRI maps with the known neural interpretation (Fukuda et al., 2006a). The CBV iso-orientation maps are well matched with GE and SE BOLD maps except for the regions at the edge of the brain (Fig. 7 A, white arrowheads) (for another example, see supplemental Fig. 5, available at www.jneurosci.org as supplemental material). Pixel-wise scatter plots within the active ROI in the right hemisphere (Fig. 7 B) show that both the GE and SE BOLD maps are significantly correlated with the CBV fMRI map (r = 0.83 and 0.86, respectively; p < 0.001 for each), and that the GE BOLD map is significantly correlated with the SE BOLD map (r = 0.82; p < 0.001) (Fig. 7 C). Similar results were obtained from all six cats. Average pixel-wise correlation coefficients within an active ROI across 10 hemispheres are 0.78 ± 0.06 for GE BOLD versus CBV fMRI, 0.76 ± 0.08 for SE BOLD versus CBV fMRI, and 0.72 ± 0.10 for GE versus SE BOLD fMRI maps. One-way ANOVA revealed that the correlation coefficients among iso-orientation maps from the three fMRI techniques have no statistical difference (F (2,29) = 1.386; p = 0.267). These results suggest that, except for the large vessel regions, higher orientation-specific BOLD signals are located at larger orientation-specific CBV response regions and likely mark the sites of increased neural activity.
Figure 7.

Comparisons of iso-orientation maps of GE BOLD, CBV, and SE BOLD fMRI. Data were obtained from the same cat shown in Figures 5 A and 6. A, Iso-orientation maps of 0° stimulation with GE BOLD, CBV, and SE BOLD fMRI (from left to right). Bright pixels indicate BOLD or CBV increase during 0° stimulation. Red plus signs indicating the increase of CBV response for 0° stimulation are overlaid on the GE and SE BOLD orientation maps. The M̄ of orientation-specific signals for GE BOLD, CBV, and SE BOLD are 0.19, 0.66, and 0.13% in ROIs (black dashed contours in CBV map), respectively. Large vein areas (see Fig. 6 B) are shown with white arrowheads. B, Enlarged iso-orientation maps of the right hemisphere including the black dashed ROI. To assist comparisons, red plus signs indicating an increase in CBV for 0° stimulation are overlaid on the GE and SE BOLD 0° iso-orientation maps. C, Pixel-wise comparison of normalized 0° iso-orientation maps obtained from three different fMRI methods: GE BOLD versus CBV (blue dots), SE BOLD versus CBV (red dots), and GE versus SE BOLD fMRI (green dots). All correlation coefficients of the comparisons were highly significant (r = 0.83, 0.86, and 0.82; p < 0.001 for each, respectively).
To further evaluate the assignment of BOLD iso-orientation maps to neuronal activation, optical imaging with a 570 nm wavelength was performed after fMRI in three cats. OIS maps can serve as a reference to a spatial pattern of neuronal activity; a good correlation between neural activity and OIS has already been observed in the visual cortex (Grinvald et al., 1986; Shmuel and Grinvald, 1996; Maldonado et al., 1997; Bosking et al., 2002). Although neural correlates to OIS in visual cortex have been demonstrated only with dHb-weighted wavelengths (e.g., 610–650 nm), good agreement between iso-orientation maps of 570 nm OIS and those of dHb-weighted OIS (Fukuda et al., 2005, 2006a) suggests that 570 nm OIS is also a good neural correlate. To compare BOLD fMRI and OIS orientation maps, vessel patterns in OIS anatomical images were coregistered with those in the MR surface image (Fig. 8 A–C, left panels, green traces). After the coregistration, BOLD fMRI iso-orientation maps generally agree well with the OIS iso-orientation map (Fig. 8 A–C, right panels, plus signs). If the cortical surface of the coregistered region is slightly curved, signals of OIS and fMRI at the coregistered pixels have different anatomical origins. Thus, small differences between BOLD fMRI and OIS orientation maps are expected. The average least distances of local maxima (Fig. 8 A–C, top right panels) for GE BOLD versus OIS (0.22 ± 0.02 mm; n = 4 hemispheres), SE BOLD versus OIS (0.22 ± 0.02 mm), and GE BOLD versus SE BOLD fMRI iso-orientation maps (0.23 ± 0.01 mm) were similar (F (2,11) = 0.673; p = 0.534). Because these distances are shorter than a column width (i.e., a half of the measured intercolumnar distance, ∼0.70 mm), we consider the BOLD iso-orientation maps to match with OIS iso-orientation maps. Thus, the region of highest orientation-specific BOLD signal is likely to indicate the site of increased neural activity.
Discussion
We demonstrated for the first time that highly reproducible iso-orientation maps can be obtained using the conventional positive BOLD fMRI in combination with continuous temporally encoded stimulation and Fourier analysis. Our major finding is that both GE and SE BOLD fMRI orientation maps excluding large pial vessel regions are significantly correlated with CBV fMRI and CBV-weighted OIS orientation maps. Thus, the PSF of BOLD response is sufficiently narrow to resolve iso-orientation columns (Fig. 1, solid red line); the highest orientation-selective BOLD signals indicate the sites of increased neural activity. In other words, the magnitude of BOLD response to preferred stimulation should be larger than the magnitude of response to nonpreferred stimulation (Fig. 9). Because intercolumnar distance of human ocular dominance columns revealed by a positive BOLD signal (Cheng et al., 2001) is similar to the cat iso-orientation columns, our finding suggests that the higher BOLD signal changes induced by left (right) eye stimulation in humans properly indicate left (right) ocular dominance columns.
Figure 9.

Hypothetical time courses of dHb-weighted optical imaging and BOLD signals. A, Observation based on dHb-weighted optical imaging of intrinsic signals. The optical imaging studies revealed that nonpreferred stimulation induced a larger hyperoxygenation (consequently decrease in dHb amount) compared with preferred stimulation. Thus, it expects that preferred stimulation induces a less positive BOLD signal than nonpreferred stimulation. B, Finding from BOLD fMRI studies. Preferred stimulation induced a larger hyperoxygenation compared with nonpreferred stimulation. Note that although the presence of BOLD dip is controversial, the polarity of the early dip, if exists, is consistent between A and B. a.u., Arbitrary units.
Mapping orientation columns with BOLD fMRI
We confirmed that a conventional positive BOLD signal responding to single orientation stimulation is widespread and strongly weighted to draining vessels and thus may not be used for single-condition mapping at submillimeter columnar resolution (Kim et al., 2000). Because the orientation-specific signal is much smaller than variations of orientation-nonspecific signals in our study, the differential method cannot effectively separate the orientation-specific signal from the orientation-nonspecific signal. In contrast, the continuous stimulation approach minimizes relatively large time-variable orientation-nonspecific responses during a long data acquisition time, because it almost saturates the orientation-nonspecific signals, including draining artifacts. The continuous stimulation with Fourier data analysis is also expected to increase the detectability or power of the orientation-specific signal as follows. First, the orientation-selective response to the gradual change of stimulus orientation is well fitted by a sinusoidal function (Fig. 3 C) (supplemental Fig. 3, available at www.jneurosci.org as supplemental material). In other words, previous knowledge about a neural tuning curve is needed. If the hemodynamic response is not modulated smoothly over time even with cyclic continuous stimulation, the power of BOLD orientation-specific signal should be significantly reduced (supplemental Fig. 4, available at www.jneurosci.org as supplemental material). Thus, if a single orientation is presented repeatedly as a block-design stimulation paradigm, “single-condition” mapping of orientation columns is extremely difficult with BOLD data collection and Fourier analysis. Second, this orientation-specific stimulation cycle can be set at a frequency far from the physiological periodic components to avoid any contamination of artifacts. Therefore, Fourier analysis in combination with temporally encoded continuous stimulation is more efficient at detecting orientation-selective responses compared with the differential method with the block-design stimulation paradigm (Kim et al., 2000; Duong et al., 2001; Zhao et al., 2005).
Spatial specificity and sensitivity of BOLD techniques
The draining artifact from GE BOLD signal cannot be completely eliminated by continuous stimulation and frequency analysis (Fig. 6), and it is further reduced using the SE BOLD fMRI technique. Consequently, SE BOLD fMRI increases the spatial specificity to active cortical columns (0.26 for SE BOLD vs 0.17 for GE BOLD). Although the draining artifact is negligibly small in the SE BOLD signal, the spatial specificity of the SE BOLD signal is still lower than that of other fMRI signals: an early CMRO2-related signal (0.4–1.0) (Kim et al., 2000), CBF fMRI (0.7) (Duong et al., 2001), and CBV-weighted fMRI (0.4) (Zhao et al., 2005). We believe that the poor spatial specificity of the BOLD signal results from a mismatch of CMRO2 and CBF responses; an increase in CMRO2 response decreases the BOLD signal, whereas an increase in CBF response increases the BOLD signal. Thus, the relative signal difference between active and inactive columns for BOLD signals should be much smaller than that for either CMRO2 or CBF signals.
In addition to specificity, sensitivity is another indispensable factor for utility of brain-mapping techniques. CNR of the GE BOLD signal was approximately three times higher than that of SE BOLD. Thus, to achieve CNR comparable with GE BOLD, the SE BOLD measurement requires a signal averaging ∼32 times more. Similarly, measurements of CBF (Kwong et al., 1992; Edelman et al., 1994; Kim, 1995; Duong et al., 2001) and early negative dip signals (Kim et al., 2000) have poor sensitivity despite their high spatial specificity. Compared with these techniques, the CBV-weighted measurement (Kennan et al., 1998; Mandeville et al., 1998; van Bruggen et al., 1998; Mandeville and Marota, 1999; Kim and Ugurbil, 2003) has the highest sensitivity (CNR 7.15 in CBV vs 4.73 in GE BOLD per run), but this approach cannot be easily used in human studies, because a large amount of exogenous contrast agent is required. Therefore, in practice, the GE BOLD technique would be an appropriate choice for mapping human functional columns within a limited recording time in the parenchymal region excluding the large pial vessels. However, if the recording time is sufficiently long to improve CNR, the SE BOLD technique at high fields should be used because of its reduced sensitivity to large draining vessels.
Orientation-specific BOLD signal source
Our BOLD studies revealed that the preferred stimulation induced a larger positive BOLD signal than the nonpreferred stimulation. Because positive BOLD signal results from a decrease in dHb content resulting from hyperoxygenation, this finding suggests that dHb content decreases more during the preferred stimulation than during the nonpreferred stimulation (i.e., more hyperoxygenation during preferred stimulation). However, this result contradicts the expectation of dHb content changes obtained from optical spectroscopic imaging (Malonek and Grinvald, 1996); the preferred stimulation induced a smaller decrease in the dHb amount than the nonpreferred stimulation (Fig. 9). More hyperoxygenation for nonpreferred stimulation is also consistently observed in OIS at dHb-weighted wavelengths (Grinvald et al., 2000; Fukuda et al., 2005).
In our study, the fMRI signal originates from a 1-mm-thick slice centered on the middle cortical layer, whereas the OIS is from the pia mater and upper cortical layers because of limited light penetration into the cortex (Kennerley et al., 2005). However, this difference of anatomical origins unlikely leads to the opposite polarity of dHb signals between fMRI and optical imaging signals. It should be noted that when the CBF and CBV responses induced by neural activity are minimal at the vasodilator-induced hypotension condition (Nagaoka et al., 2006), both BOLD signal (Fukuda et al., 2006a) and OIS (Fukuda et al., 2006b) have similarly larger hypo-oxygenated changes at active columns than inactive columns, similar to the condition of the early dip. This indicates that the dHb contribution is dominant in both BOLD signal and OIS when CBF and CBV responses are minimal, suggesting that the difference between BOLD signal and OIS at the normal condition appears to relate to CBF and/or CBV responses.
In fMRI studies, the stimulation-induced arterial blood velocity increase results in a large delivery of fresh (unexcited) water into the imaging slice, which gives rise to an increase in the signal change (commonly referred to as “inflow effect”) (Duyn et al., 1994; Frahm et al., 1994; Kim et al., 1994; Gao et al., 1996). In our SE BOLD fMRI, the inflow contribution to fMRI can be <0.1% based on a previous study with the same pulse sequence and similar imaging parameters (Jin et al., 2006). This small amount of inflow contribution could not be ignored because of the extremely small orientation-specific SE BOLD signal (∼0.2%). If the inflow effect significantly contributes to the orientation-specific signal in BOLD measurements, the polarity of the orientation-selective signal may follow that of the CBF response (Duong et al., 2001). However, our preliminary result suggests that the inflow effect is unlikely to change the polarity of the orientation-selective BOLD signal (supplemental Fig. 6, available at www.jneurosci.org as supplemental material).
In OIS studies, when dHb-weighted wavelengths are used, the contribution of oxy-hemoglobin signal to dHb-weighted OIS is not negligible if the CBV response is significant. An increase in CBV makes hypo-oxygenated OIS (i.e., dip) larger and hyperoxygenated OIS smaller because of an increase in light absorption. Additionally, blood velocity changes in microvessels will induce light scattering, which may contribute to the observed OIS data. To separate possible contribution of CBV (total hemoglobin) and light scattering signals from dHb signal, OIS can be decomposed into components of oxy-hemoglobin, deoxy-hemoglobin (total hemoglobin is the sum of oxy- and deoxy-hemoglobin) and light scattering using spectroscopic analysis. Results from decomposed dHb signal were similar to those from dHb-weighted OIS. However, a model used for OIS decomposition in cat and monkey visual cortex (Malonek and Grinvald, 1996; Shtoyerman et al., 2000; Fukuda et al., 2005) was oversimplified (Mayhew et al., 1999; Nemoto et al., 1999; Lindauer et al., 2001; Sato et al., 2002) and may contain a substantial error.
Apparent contradiction between BOLD signal and OIS is also found in the magnitude of early dip. Typically, the early dip has not been observed consistently in BOLD fMRI but is a robust feature in OIS. The source of this discrepancy is also unknown. Additional systematic studies are necessary to understand the differences between BOLD and OIS signal sources at a submillimeter scale.
Footnotes
This work was supported by National Institutes of Health (NIH) Grants NS44589, EB003324, and EB003375 and by the McKnight Foundation. The 9.4 T MR system was funded in part by NIH Grant RR17239. We thank Ping Wang and Michelle Tasker for animal preparation and Kristy Hendrich for MR system management.
References
- Blasdel GG. Differential imaging of ocular dominance and orientation selectivity in monkey striate cortex. J Neurosci. 1992;12:3115–3138. doi: 10.1523/JNEUROSCI.12-08-03115.1992. [DOI] [PMC free article] [PubMed] [Google Scholar]
- Blasdel GG, Salama G. Voltage-sensitive dyes reveal a modular organization in monkey striate cortex. Nature. 1986;321:579–585. doi: 10.1038/321579a0. [DOI] [PubMed] [Google Scholar]
- Bosking WH, Crowley JC, Fitzpatrick D. Spatial coding of position and orientation in primary visual cortex. Nat Neurosci. 2002;5:874–882. doi: 10.1038/nn908. [DOI] [PubMed] [Google Scholar]
- Boynton GM, Engel SA, Glover GH, Heeger DJ. Linear systems analysis of functional magnetic resonance imaging in human V1. J Neurosci. 1996;16:4207–4221. doi: 10.1523/JNEUROSCI.16-13-04207.1996. [DOI] [PMC free article] [PubMed] [Google Scholar]
- Cheng K, Waggoner RA, Tanaka K. Human ocular dominance columns as revealed by high-field functional magnetic resonance imaging. Neuron. 2001;32:359–374. doi: 10.1016/s0896-6273(01)00477-9. [DOI] [PubMed] [Google Scholar]
- Cohen ER, Ugurbil K, Kim S-G. Effect of basal conditions on the magnitude and dynamics of the blood oxygenation-level dependent fMRI response. J Cereb Blood Flow Metab. 2002;22:1042–1053. doi: 10.1097/00004647-200209000-00002. [DOI] [PubMed] [Google Scholar]
- Dechent P, Frahm J. Direct mapping of ocular dominance columns in human primary visual cortex. NeuroReport. 2000;11:3247–3249. doi: 10.1097/00001756-200009280-00039. [DOI] [PubMed] [Google Scholar]
- Duong TQ, Silva AC, Lee S-P, Kim S-G. Functional MRI of calcium-dependent synaptic activity: cross correlation with CBF and BOLD measurements. Magn Reson Med. 2000a;43:383–392. doi: 10.1002/(sici)1522-2594(200003)43:3<383::aid-mrm10>3.0.co;2-q. [DOI] [PubMed] [Google Scholar]
- Duong TQ, Kim D-S, Ugurbil K, Kim S-G. Spatio-temporal dynamics of the BOLD fMRI signals: toward mapping submillimeter columnar structures using the early negative response. Magn Reson Med. 2000b;44:231–242. doi: 10.1002/1522-2594(200008)44:2<231::aid-mrm10>3.0.co;2-t. [DOI] [PubMed] [Google Scholar]
- Duong TQ, Kim D-S, Ugurbil K, Kim S-G. Localized cerebral blood flow response at submillimeter columnar resolution. Proc Natl Acad Sci USA. 2001;98:10904–10909. doi: 10.1073/pnas.191101098. [DOI] [PMC free article] [PubMed] [Google Scholar]
- Duyn JH, Moonen CTW, Van Yperen GH, De Boer RW, Luyten PR. Inflow versus deoxyhemoglobin effects in BOLD functional MRI using gradient echoes at 1.5T. NMR Biomed. 1994;7:83–88. doi: 10.1002/nbm.1940070113. [DOI] [PubMed] [Google Scholar]
- Edelman RR, Siewert B, Darby DG, Thangaraj V, Nobre AC, Mesulam MM, Warach S. Qualitative mapping of cerebral blood flow and functional localization with echo-planar MR imaging and signal targeting with alternating radio frequency. Radiology. 1994;192:513–520. doi: 10.1148/radiology.192.2.8029425. [DOI] [PubMed] [Google Scholar]
- Engel SA, Rumelhart DE, Wandell BA, Lee AT, Glover GH, Chichilnisky EJ, Shadlen MN. fMRI of human visual cortex. Nature. 1994;369:525. doi: 10.1038/369525a0. [DOI] [PubMed] [Google Scholar]
- Engel SA, Glover GH, Wandell BA. Retinotopic organization in human visual cortex and the spatial precision of functional MRI. Cereb Cortex. 1997;7:181–192. doi: 10.1093/cercor/7.2.181. [DOI] [PubMed] [Google Scholar]
- Frahm J, Merboldt K-D, Hanicke W, Kleinschmidt A, Boecker H. Brain or vein-oxygenation or flow? On signal physiology in functional MRI of human brain activation. NMR Biomed. 1994;7:45–53. doi: 10.1002/nbm.1940070108. [DOI] [PubMed] [Google Scholar]
- Fukuda M, Rajagopalan UM, Homma R, Matsumoto M, Nishizaki M, Tanifuji M. Localization of activity-dependent changes in blood volume to submillimeter-scale functional domains in cat visual cortex. Cereb Cortex. 2005;15:823–833. doi: 10.1093/cercor/bhh183. [DOI] [PubMed] [Google Scholar]
- Fukuda M, Moon CH, Wang P, Kim S-G. Mapping iso-orientation columns by contrast agent-enhanced functional MRI: reproducibility, specificity and evaluation by optical imaging of intrinsic signal. J Neurosci. 2006a;26:11821–11832. doi: 10.1523/JNEUROSCI.3098-06.2006. [DOI] [PMC free article] [PubMed] [Google Scholar]
- Fukuda M, Wang P, Moon CH, Tanifuji M, Kim S-G. Spatial specificity of the enhanced dip inherently induced by prolonged oxygen consumption in cat visual cortex: implication for columnar resolution functional MRI. NeuroImage. 2006b;30:70–87. doi: 10.1016/j.neuroimage.2005.09.026. [DOI] [PubMed] [Google Scholar]
- Gao JH, Miller I, Lai S, Xiong J, Fox PT. Quantitative assessment of blood inflow effects in functional MRI signals. Magn Reson Med. 1996;36:314–319. doi: 10.1002/mrm.1910360219. [DOI] [PubMed] [Google Scholar]
- Goodyear BG, Menon RS. Brief visual stimulation allows mapping of ocular dominance in visual cortex using fMRI. Hum Brain Mapp. 2001;14:210–217. doi: 10.1002/hbm.1053. [DOI] [PMC free article] [PubMed] [Google Scholar]
- Grinvald A, Lieke E, Frostig RD, Gilbert CD, Wiesel TN. Functional architecture of cortex revealed by optical imaging of intrinsic signals. Nature. 1986;324:361–364. doi: 10.1038/324361a0. [DOI] [PubMed] [Google Scholar]
- Grinvald A, Slovin H, Vanzetta I. Non-invasive visualization of cortical columns by fMRI. Nat Neurosci. 2000;3:105–107. doi: 10.1038/72045. [DOI] [PubMed] [Google Scholar]
- Harel N, Lee SP, Nagaoka T, Kim D-S, Kim S-G. Origin of negative blood oxygenation level-dependent fMRI signals. J Cereb Blood Flow Metab. 2002;22:908–917. doi: 10.1097/00004647-200208000-00002. [DOI] [PubMed] [Google Scholar]
- Herbert DA, Mitchell RA. Blood gas tensions and acid-base balance in awake cats. J Appl Physiol. 1971;30:434–436. doi: 10.1152/jappl.1971.30.3.434. [DOI] [PubMed] [Google Scholar]
- Hubel D, Wiesel T. Receptive fields, binocular interactions and functional architecture in the cat's visual cortex. J Physiol (Lond) 1962;160:106–154. doi: 10.1113/jphysiol.1962.sp006837. [DOI] [PMC free article] [PubMed] [Google Scholar]
- Jin T, Wang P, Tasker M, Zhao F, Kim S-G. Source of nonlinearity in echo-time-dependent BOLD fMRI. Magn Reson Med. 2006;55:1281–1290. doi: 10.1002/mrm.20918. [DOI] [PubMed] [Google Scholar]
- Kalatsky VA, Stryker MP. New paradigm for optical imaging: temporally encoded maps of intrinsic signal. Neuron. 2003;38:529–545. doi: 10.1016/s0896-6273(03)00286-1. [DOI] [PubMed] [Google Scholar]
- Kennan RP, Scanley BE, Innis RB, Gore JC. Physiological basis for BOLD MR signal changes due to neuronal stimulation: separation of blood volume and magnetic susceptibility effects. Magn Reson Med. 1998;40:840–846. doi: 10.1002/mrm.1910400609. [DOI] [PubMed] [Google Scholar]
- Kennerley AJ, Berwick J, Martindale J, Johnston D, Papadakis N, Mayhew JE. Concurrent fMRI and optical measures for the investigation of the hemodynamic response function. Magn Reson Med. 2005;54:354–365. doi: 10.1002/mrm.20511. [DOI] [PubMed] [Google Scholar]
- Kim D-S, Duong TQ, Kim S-G. High-resolution mapping of iso-orientation columns by fMRI. Nat Neurosci. 2000;3:164–169. doi: 10.1038/72109. [DOI] [PubMed] [Google Scholar]
- Kim S-G. Quantification of relative cerebral blood flow change by flow-sensitive alternating inversion recovery (FAIR) technique: application to functional mapping. Magn Reson Med. 1995;34:293–301. doi: 10.1002/mrm.1910340303. [DOI] [PubMed] [Google Scholar]
- Kim S-G, Ugurbil K. High-resolution functional magnetic resonance imaging of the animal brain. Science Direct Methods. 2003;30:28–41. doi: 10.1016/s1046-2023(03)00005-7. [DOI] [PubMed] [Google Scholar]
- Kim S-G, Hendrich K, Hu X, Merkle H, Ugurbil K. Potential pitfalls of functional MRI using conventional gradient-recalled echo techniques. NMR Biomed. 1994;7:69–74. doi: 10.1002/nbm.1940070111. [DOI] [PubMed] [Google Scholar]
- Kwong K, Hoppel B, Weisskoff R, Kiihne S, Barrere B, Moore J, Poncelet B, Rosen B, Thulborn K. Regional cerebral tissue oxygenation studied with EPI at clinical field strengths. J Magn Reson Imag. 1992;2:44. [Google Scholar]
- Lai S, Hopkins AL, Haacke EM, Li D, Wasserman BA, Buckley P, Friedman H, Meltzer H, Hedera, Friedland R. Identification of vascular structures as a major source of signal contrast in high resolution 2D and 3D functional activation imaging of the motor cortex at 1.5T: preliminary results. Magn Reson Med. 1993;30:387–392. doi: 10.1002/mrm.1910300318. [DOI] [PubMed] [Google Scholar]
- Lee SP, Silva AC, Ugurbil K, Kim S-G. Diffusion-weighted spin-echo fMRI at 9.4 T: microvascular/tissue contribution to BOLD signal changes. Magn Reson Med. 1999;42:919–928. doi: 10.1002/(sici)1522-2594(199911)42:5<919::aid-mrm12>3.0.co;2-8. [DOI] [PubMed] [Google Scholar]
- Lindauer U, Royl G, Leithner C, Kuhl M, Gold L, Gethmann J, Kohl-Bareis M, Villringer A, Dirnagl U. No evidence for early decrease in blood oxygenation in rat whisker cortex in response to functional activation. NeuroImage. 2001;13:988–1001. doi: 10.1006/nimg.2000.0709. [DOI] [PubMed] [Google Scholar]
- Lowel S, Singer W. Tangential intracortical pathways and the development of iso-orientation bands in cat striate cortex. Brain Res Dev Brain Res. 1990;56:99–116. doi: 10.1016/0165-3806(90)90168-x. [DOI] [PubMed] [Google Scholar]
- Maldonado PE, Godecke I, Gray CM, Bonhoeffer T. Orientation selectivity in pinwheel centers in cat striate cortex. Science. 1997;276:1551–1555. doi: 10.1126/science.276.5318.1551. [DOI] [PubMed] [Google Scholar]
- Malonek D, Grinvald A. Interactions between electrical activity and cortical microcirculation revealed by imaging spectroscopy: implications for functional brain mapping. Science. 1996;272:551–554. doi: 10.1126/science.272.5261.551. [DOI] [PubMed] [Google Scholar]
- Mandeville JB, Marota JA. Vascular filters of functional MRI: spatial localization using BOLD and CBV contrast. Magn Reson Med. 1999;42:591–598. doi: 10.1002/(sici)1522-2594(199909)42:3<591::aid-mrm23>3.0.co;2-8. [DOI] [PubMed] [Google Scholar]
- Mandeville JB, Marota JJ, Kosofsky BE, Keltner JR, Weissleder R, Rosen BR. Dynamic functional imaging of relative cerebral blood volume during rat forepaw stimulation. Magn Reson Med. 1998;39:615–624. doi: 10.1002/mrm.1910390415. [DOI] [PubMed] [Google Scholar]
- Mayhew J, Zheng Y, Hou Y, Vuksanovic B, Berwick J, Askew S, Coffey P. Spectroscopic analysis of changes in remitted illumination: the response to increased neural activity in brain. NeuroImage. 1999;10:304–326. doi: 10.1006/nimg.1999.0460. [DOI] [PubMed] [Google Scholar]
- Menon RS, Goodyear BG. Submillimeter functional localization in human striate cortex using BOLD contrast at 4 Tesla: implications for the vascular point-spread function. Magn Reson Med. 1999;41:230–235. doi: 10.1002/(sici)1522-2594(199902)41:2<230::aid-mrm3>3.0.co;2-o. [DOI] [PubMed] [Google Scholar]
- Menon RS, Ogawa S, Tank DW, Ugurbil K. 4 Tesla gradient recalled echo characteristics of photic stimulation-induced signal changes in the human primary visual cortex. Magn Reson Med. 1993;30:380–386. doi: 10.1002/mrm.1910300317. [DOI] [PubMed] [Google Scholar]
- Menon RS, Ogawa S, Strupp JP, Ugurbil K. Ocular dominance in human V1 demonstrated by functional magnetic resonance imaging. J Neurophysiol. 1997;77:2780–2787. doi: 10.1152/jn.1997.77.5.2780. [DOI] [PubMed] [Google Scholar]
- Moon CH, Fukuda M, Kim S-G. Analysis of continuous intrinsic optical imaging data. Soc Neurosci Abstr. 2004;30:920–13. [Google Scholar]
- Movshon JA, Thompson ID, Tolhurst DJ. Spatial and temporal contrast sensitivity of neurones in areas 17 and 18 of the cat's visual cortex. J Physiol (Lond) 1978;283:101–120. doi: 10.1113/jphysiol.1978.sp012490. [DOI] [PMC free article] [PubMed] [Google Scholar]
- Murphy KM, Jones DG, Fenstemaker SB, Pegado VD, Kiorpes L, Movshon JA. Spacing of cytochrome oxidase blobs in visual cortex of normal and strabismic monkeys. Cereb Cortex. 1998;8:237–244. doi: 10.1093/cercor/8.3.237. [DOI] [PubMed] [Google Scholar]
- Nagaoka T, Zhao F, Wang P, Harel N, Kennan RP, Ogawa S, Kim SG. Increases in oxygen consumption without cerebral blood volume change during visual stimulation under hypotension condition. J Cereb Blood Flow Metab. 2006;26:1043–1051. doi: 10.1038/sj.jcbfm.9600251. [DOI] [PubMed] [Google Scholar]
- Nemoto M, Nomura Y, Sato C, Tamura M, Houkin K, Koyanagi I, Abe H. Analysis of optical signals evoked by peripheral nerve stimulation in rat somatosensory cortex: dynamic changes in hemoglobin concentration and oxygenation. J Cereb Blood Flow Metab. 1999;19:246–259. doi: 10.1097/00004647-199903000-00002. [DOI] [PubMed] [Google Scholar]
- Oppenheim AV, Schafer RW. Englewood Cliffs, NJ: Prentice-Hall; 1989. Discrete-time signal processing; p. 447. [Google Scholar]
- Park S-H, Kim S-G. MR venography using BOLD contrast at 9.4T. Proc Int Soc Magn Res Med. 2005;13:1718. [Google Scholar]
- Sato C, Nemoto M, Tamura M. Reassessment of activity-related optical signals in somatosensory cortex by an algorithm with wavelength-dependent path length. J Physiol (Japan) 2002;52:301–312. doi: 10.2170/jjphysiol.52.301. [DOI] [PubMed] [Google Scholar]
- Sereno MI, Dale AM, Reppas JB, Kwong KK, Belliveau JW, Brady TJ, Rosen BR, Tootell RB. Borders of multiple visual areas in humans revealed by functional magnetic resonance imaging. Science. 1995;268:889–893. doi: 10.1126/science.7754376. [DOI] [PubMed] [Google Scholar]
- Shmuel A, Grinvald A. Functional organization for direction of motion and its relationship to orientation maps in cat area 18. J Neurosci. 1996;16:6945–6964. doi: 10.1523/JNEUROSCI.16-21-06945.1996. [DOI] [PMC free article] [PubMed] [Google Scholar]
- Shtoyerman E, Arieli A, Slovin H, Vanzetta I, Grinvald A. Long-term optical imaging and spectroscopy reveal mechanisms underlying the intrinsic signal and stability of cortical maps in V1 of behaving monkeys. J Neurosci. 2000;20:8111–8121. doi: 10.1523/JNEUROSCI.20-21-08111.2000. [DOI] [PMC free article] [PubMed] [Google Scholar]
- Swindale NV. Orientation tuning curves: empirical description and estimation of parameters. Biol Cybern. 1998;78:45–56. doi: 10.1007/s004220050411. [DOI] [PubMed] [Google Scholar]
- van Bruggen N, Busch E, Palmer JT, Williams S-P, de Crespigny AJ. High-resolution functional magnetic resonance imaging of the rat brain: mapping changes in cerebral blood volume using iron oxide contrast media. J Cereb Blood Flow Metab. 1998;18:1178–1183. doi: 10.1097/00004647-199811000-00003. [DOI] [PubMed] [Google Scholar]
- Zhao F, Wang P, Kim SG. Cortical depth-dependent gradient-echo and spin-echo BOLD fMRI at 9.4T. Magn Reson Med. 2004;51:518–524. doi: 10.1002/mrm.10720. [DOI] [PubMed] [Google Scholar]
- Zhao F, Wang P, Hendrich K, Kim S-G. Spatial specificity of cerebral blood volume-weighted fMRI responses at columnar resolution. NeuroImage. 2005;27:416–424. doi: 10.1016/j.neuroimage.2005.04.011. [DOI] [PubMed] [Google Scholar]
- Zhao F, Wang P, Hendrich K, Ugurbil K, Kim SG. Cortical layer-dependent BOLD and CBV responses measured by spin-echo and gradient-echo fMRI: insights into hemodynamic regulation. NeuroImage. 2006;30:1149–1160. doi: 10.1016/j.neuroimage.2005.11.013. [DOI] [PubMed] [Google Scholar]
- Zwillinger D. Ed 30. Boca Raton, FL: CRC; 1995. CRC standard mathematical tables and formulae; pp. 265–266. [Google Scholar]