

Abstract
Interaction between the entorhinal cortex (EC) and basolateral amygdala (BLA) may be a fundamental component in the consolidation of many forms of affective memory, such as inhibitory avoidance. Dopamine (DA) in the EC is necessary for, and may facilitate, this form of learning. This effect of DA on affective behaviors may be accomplished in part through modulation of amygdala inputs. Although it is known that DA can modulate neuronal activity in the EC, it is not known whether DA modulates inputs from the BLA. In this study, we used in vitro patch-clamp recordings and Ca2+ imaging of layer V neurons in the rat lateral EC to determine whether DA modulates the integration of inputs from the BLA and the mechanism for this modulation. We found that DA exerted actions that depended on the neuronal state. Near resting membrane potentials, DA suppressed integration of inputs, whereas at depolarized potentials, DA enhanced integration. DA enhanced the integration by a D2-mediated enhancement of Na+ currents, via phospholipase C. These experiments demonstrate that DA can exert actions in the EC that depend on the membrane voltage. This effect of DA may affect a wide range of inputs. Functionally, by enhancement of amygdala inputs that arrive in concert with other inputs, or during depolarized states, DA can facilitate the impact of affect on memory in a subset of conditions.
Keywords: dopamine, dendrite, sodium channel, synaptic integration, entorhinal cortex, rat
Introduction
The temporal lobe is composed of several structures, the interaction of which is necessary for many forms of learning and memory (Zola-Morgan et al., 1986; Squire et al., 2004), including the hippocampus, amygdala, and entorhinal cortex (EC). Abnormalities of the EC are seen in several disorders, such as Alzheimer's disease (Hyman et al., 1984; Hejl et al., 2004) and schizophrenia (Falkai et al., 1988; Arnold et al., 1991; Krimer et al., 1997; Prasad et al., 2004), and may provoke disruptions of memory and context-dependent behaviors (Otto et al., 1991; Baxter and Murray, 2001; Buckmaster et al., 2004). The rat EC receives a large input from the basolateral complex of the amygdala (BLA) (Krettet and Price, 1977; Pikkarainen et al., 1999), a region necessary for many forms of emotional learning. The interaction between the amygdala and the EC may be especially significant in the formation of memories that contain an affective component (Maren and Fanselow, 1997; Coutureau et al., 1999; Ferbinteanu et al., 1999; Ferry et al., 1999). For example, pharmacological suppression of EC activity interferes with consolidation of inhibitory avoidance (Ferreira et al., 1992; Quillfeldt et al., 1996), and neurons in the amygdala that project to the EC are activated during fear conditioning (Majak and Pitkanen, 2003).
Pathology of the dopamine (DA) system in the EC has been observed in postmortum examination of the brains of patients with Alzheimer's disease (Ryoo and Joyce, 1994) and schizophrenia (Goldsmith et al., 1997; Lahti et al., 1998; Akil et al., 2000). Pharmacological manipulations of the entorhinal DA system, and its second messengers, have a potent impact on several forms of emotional learning, including inhibitory avoidance and latent inhibition (Izquierdo et al., 1998; Barros et al., 2001; Roesler et al., 2002). However, it is not known whether DA modulates amygdala inputs to the EC. Given the behavioral effects of DA in the EC on emotional behaviors, it is hypothesized that DA will enhance the impact of amygdala inputs on EC neurons.
Layer V pyramidal neurons of the lateral EC have long apical dendrites that are potential targets for BLA inputs. DA may influence integration of synaptic inputs by modulation of dendritic properties. Layer V neurons contain mRNA for DA receptors (Weiner et al., 1991) and DA receptor proteins, and tyrosine hydroxylase (TH)-positive fibers are present in most layers of the EC (Diop et al., 1988; Huang et al., 1992; Goldsmith and Joyce, 1994; Tarazi et al., 1998, 1999). A previous study has examined the effects of DA on the excitability of layer V pyramidal neurons of the EC (Rosenkranz and Johnston, 2006). In addition, studies have demonstrated that DA can modulate single postsynaptic events in the EC (Pralong and Jones, 1993; Caruana et al., 2006). This study uses in vitro whole-cell recordings and calcium imaging to test how DA modifies amygdala inputs to the EC, the underlying ionic mechanisms, and whether a portion of this modulation occurs by effects on layer V apical dendrites.
Materials and Methods
Slice preparation.
Male Sprague Dawley rats (age, 4–6 weeks) were anesthetized with an intraperitoneal injection of a combination of ketamine (42 mg/ml), xylazine (8 mg/ml), and, in some experiments, acepromazine (1.4 mg/ml). No differences were observed in the results from animals in which acepromazine was included in the anesthetic mixture. Once anesthetized, rats were perfused intracardially with an ice-cold solution containing (in mm) 110 choline chloride, 2.5 KCl, 1.25 NaH2PO4, 25 NaHCO3, 0.5 CaCl2, 7 MgCl2, 7 dextrose, 1.3 ascorbic acid, and 3 pyruvic acid (all drugs were from Sigma, St. Louis, MO, unless specified otherwise). The solution was saturated with a 95% O2/5% CO2 gas mixture. After perfusion, the rat was quickly decapitated, and the brain was removed and sliced in 350 μm sections in the same solution (Vibratome Series 1000; Vibratome, St. Louis, MO). Brain slices were then incubated at 37°C for 10–15 min in a solution containing (in mm) 125 NaCl, 2.5 KCl, 1.25 NaH2PO4, 25 NaHCO3, 2 CaCl2, 2 MgCl2, 10 dextrose, 1.3 ascorbic acid, and 3 pyruvic acid. After incubation, brain slices stabilized at room temperature for at least 50 min before transfer to the recording chamber.
Whole-cell recordings.
Brain slices were transferred to the recording chamber perfused with a solution containing (in mm) 125 NaCl, 2.5 KCl, 1.25 NaH2PO4, 25 NaHCO3, 2 CaCl2, 2 MgCl2, 10 dextrose, and 0.075 sodium metabisulfite (an antioxidant that prevents degradation of DA). Layer V of the lateral EC was visually identified using infrared differential interference contrast microscopy. Pyramidal neurons were selected based on the protrusion of a long apical dendrite and a nonstellate appearance. Patch electrodes were constructed from borosilicate glass with an outer diameter of 2.0 mm and an inner diameter of 1.16 mm (Sutter Instruments, Novato, CA). Electrodes were pulled using a Flaming/Brown micropipette puller (model P-97; Sutter Instruments). Electrodes were filled with (in mm) 120 potassium methylsulfate, 20 KCl, 0.2 EGTA, 10 HEPES, and 2 MgCl2, with a pH of 7.3. On the day of recordings, 4 mm Na2-ATP, 0.3 mm Tris-GTP, 7 mm phosphocreatine, and 0.1% neurobiotin were added to the internal recording solution (yielding an osmolarity of ∼290–295 mOsm). Whole-cell recordings were performed at 32–34°C. The electrode junction potential was corrected in the bath, but the diffusion potential was not compensated after seal formation and membrane rupture. Based on relative ionic mobilities and charge, this potential was calculated to be 7–8 mV. Therefore, the actual membrane potentials could be up to 8 mV more hyperpolarized than the measured voltage. The liquid junction potential between the intracellular and extracellular solutions was measured to be 3–4 mV using the method described by Neher (1992), suggesting that this difference between measured and actual membrane potentials may be even less. In some experiments, Sylguard was applied to the electrode tips, or the tips were wrapped with Parafilm, to minimize electrode capacitance. Before formation of a seal, the electrode tip potential was negated, and the open-tip resistance was measured (typically 4–6 MΩ). After successful transition to whole-cell configuration, the neuron was given at least 5 min to stabilize before data were collected. Voltage signals were amplified and filtered in most experiments at 3 kHz (SEC-05L; NPI, Tamm, Germany). When action potential (AP) parameters were examined, voltage signals were filtered at no less than 5 kHz. Series resistance was monitored and compensated throughout the experiment using built-in bridge circuitry. Membrane potential was tracked throughout the experiment in the presence and absence of a holding current. Only neurons that had a resting membrane potential of at least −60 mV and APs that overshoot 0 mV were examined. To hold the membrane at various potentials, direct current was applied through the recording electrode. After completion of the experiment, brain slices were transferred to a solution containing 4% paraformaldehyde in 8% sucrose, where they remained for at least 24 h. Slices were stained for neurobiotin using the ABC Vectastin kit (Vector Laboratories, Burlingame, CA).
Calcium imaging.
In some of the whole-cell experiments, 100 μm bis-Fura-2 was included in the recording pipette, and EGTA and neurobiotin were excluded. After whole-cell configuration was achieved, dye was permitted to diffuse and equilibrate throughout the cell for at least 15 min before experiments began. Bis-Fura-2 was excited with 380 nm light via a xenon lamp and a 380/13 excitation filter. Fluorescent emissions were filtered through a high-pass 495 nm filter and collected with a modified Photometrics CH250A cooled CCD camera (Roper Scientific, Duluth, GA) at a minimum of 40 Hz. Changes of intracellular calcium were quantified as ΔF/F, where F was the background fluorescence of the cell before stimulation and ΔF was the change of fluorescence during stimulation. F values were corrected by subtraction of autofluorescence, and ΔF was corrected for bleaching during each exposure. A decrease in ΔF/F indicates an increase in intracellular calcium. Calcium signals were inverted for quantification and display in figures. Electrical and optical signals were simultaneously acquired and synchronized (IgorPro; Wavemetrics, Lake Oswego, OR).
Cell-attached recordings.
To directly measure Na+ currents, cell-attached recordings were obtained from the soma of layer V EC pyramidal neurons in the slice. Patch electrode shafts were coated with Sylguard. In these conditions, the extracellular solution was the same as above (in mm: 125 NaCl, 2.5 KCl, 1.25 NaH2PO4, 25 NaHCO3, 2 CaCl2, 2 MgCl2, 10–15 dextrose, and 0.075 sodium metabisulfite). The solution inside the patch electrode contained (in mm) 110 NaCl, 10 HEPES, 2 CaCl2, 2 MgCl2, 1–3 3,4-diaminopyridine (3,4-DAP), 5 4-aminopyridine (4-AP), 30 tetraethylammonium (TEA)-Cl, and 10 dextrose. In some experiments, 1 μm TTX was also included in the pipette. Cell-attached recordings were performed at room temperature (∼23°C). Signals were collected and filtered at 5 kHz with an Axopatch 200B (Molecular Devices, Sunnyvale, CA). Electrode capacitance was compensated. Leak was arithmetically subtracted during analysis using scaled traces from smaller voltage steps that did not evoke a Na+ current. To examine activation of this current, the membrane patch was held 20 mV hyperpolarized to rest, and depolarizing steps were applied at 10 mV intervals. A liquid junction potential of −2.1 mV was calculated, based on the relative ionic mobilities of the internal and external solutions. Mean values used in activation curves were corrected by 2.1 mV. The actual membrane potential was determined at the end of the experiment by rupturing the patch and measuring Vrest in whole-cell configuration. DA, when used, was applied before the patch recording was obtained. These neurons that were exposed to DA were compared with unexposed control neurons. Because DA was shown to cause a small depolarization of the membrane potential of these neurons (Rosenkranz and Johnston, 2006), DA was not applied during the course of an individual recording to avoid the potentially difficult interpretation of apparent shifts in the activation curve that could be the result of an unquantified shift of membrane potential during the experiment.
Nucleated patch recordings.
To examine the effects of DA on Na+ currents within the same neuron, without potential space-clamp errors or problems attributable to a change of membrane potential after application of DA, nucleated patch recordings were obtained from layer V pyramidal neurons at 32°C. After a whole-cell configuration was obtained, the pipette was slowly withdrawn while maintaining negative pressure at the tip of the pipette. The same intracellular solution was used for nucleated patch recordings and whole-cell current clamp recordings (above). To block K+ currents, 20 mm TEA-Cl, 3 mm 3,4-DAP, and 5 mm 4-AP were included in the bath, in addition to 0.2 mm CdCl2 to block Ca+ currents. The amount of dextrose in the bath solution was decreased (2 mm) to maintain an osmolarity near 300 mOsm. A liquid junction potential of ∼8.1 mV was calculated based on relative ionic mobilities. All voltage values were corrected by 8.1 mV. Currents were activated with voltage steps from a holding potential of approximately −100 mV (−90 mV before liquid junction correction). Inactivation was examined by stepping the membrane potential to 0 mV, starting from −100 mV and progressing to more depolarized holding potentials in 10 mV steps.
Synaptic stimulation.
Synaptic inputs to the recorded neuron were activated by discrete electrical stimulation using theta glass pipettes with a tip size between 2 and 4 μm [filled with (in mm) 125 NaCl, 2.5 KCl, 1.25 NaH2PO4, 10 HEPES, 2 CaCl2, 2 MgCl2, and 25 dextrose] or self-assembled bipolar tungsten electrodes that tapered to a fine tip (made of parts from A-M Systems, Carlsborg, WA). The electrodes were positioned 10–20 μm to the side of the apical dendrite, at a distance of 0–450 μm from the soma. Stimulations were performed as single pulses (0.2 ms duration; 0.005–0.05 mA) or as trains (five stimuli, 20 Hz, unless indicated otherwise). A horizontal slicing procedure has been used that preserves connections between the lateral nucleus of the amygdala (LAT) and EC, as demonstrated by von Bohlen und Halbach and Albrecht (2002). Amygdala inputs were activated by positioning the stimulating electrode in the LAT. Stimulation parameters were the same as above. The distance between the amygdala stimulation electrode and the entorhinal recording electrode ranged from ∼1.5 to 3.0 mm. Synaptic responses that did not have a monotonic rise, or had a variable latency, or had clear multiple events indicative of polysynaptic inputs were excluded from analysis.
Drug application.
Chemicals were bath applied in the recording solution, unless noted otherwise, and included DA (10 μm), 6-chloro-2,3,4,5-tetrahydro-1-phenyl-1H-3-benzazepine hydrobromide (SKF81297; 10 μm), quinpirole (10 μm), 7-chloro-8-hydroxy-3-methyl-5-phenyl-2,3,4,5-tetrahydro-1H-3-benzazepine (SCH23390; 5 μm), sulpiride (5 μm), TTX (0.5–2 μm), 4-AP (3 mm), BaCl2 (250 μm), NiCl2 (50 μm), nimodipine (10 μm), and 4-ethylphenylamino-1,2-dimethyl-6-methylaminopyrimidinium chloride (ZD7288; 20 μm applied in bath solution for 10 min before patching). To examine signaling cascades, kinase inhibitors 2-[1-(3-dimethylaminopropyl)indol-3-yl]-3-(indol-3-yl) maleimide (GF109203X; 1 μm) and chelerythrine chloride (2 μm) were bath applied at least 15 min before patching a neuron. Alternatively, chelerythrine chloride (2 μm), 1-[6-[[(17β)-3-methoxyestra-1,3,5(10)-trien-17-yl]amino]hexyl]-1H-pyrrole-2,5-dione [U73122; 3 μm in DMSO; phospholipase C (PLC) inhibitor], forskolin (5 μm or 25 μm in DMSO; adenylyl cyclase activator), cyclosporin A [1 μm; protein phosphatase 2B (PP2B; calcineurin) inhibitor], or okadaic acid (100 nm in DMSO; PP2A/PP1 inhibitor) was applied alone during the recording, 15 min before quinpirole. The kinase inhibitor (9R,10S,12S)-2,3,9,10,11,12-hexahydro-10-hydroxy-9-methyl-1-oxo-9,12-epoxy-1H-diindolo[1,2,3-fg:3′,2′,1′kl]pyrrolo[3,4-i][1,6]benzodiazocine-10-carboxylic acid, hexyl ester (KT5720; 1 μm) and the PP2B inhibitor calcineurin autoinhibitory peptide (100 μm) were included in the recording pipette. When BAPTA was included in the pipette, the following internal solution was used (in mm): 20 BAPTA-tetrapotassium, 40 KMeSO4, and 10 sucrose (to adjust solution to ∼290–295 mOsm). The remainder of the solution was the same as above. Where indicated, synaptic transmission was blocked by the inclusion of CNQX (10 μm), dl-AP-5 (50 μm), bicuculline (10 μm; in DMSO), and (2S)-3-[[(1S)-1-(3,4-dichlorophenyl)ethyl]amino-2-hydroxypropyl](phenylmethyl)phosphinic acid (CGP55845) (2 μm; in DMSO) in the bath solution. All other experiments were performed with dl-AP-5 (50 μm), bicuculline (10 μm; in DMSO), and CGP55845 (2 μm; in DMSO) in the extracellular recording solution, but only 1 μm CNQX to allow examination of the evoked AMPA/kainate EPSP without contamination by epileptiform activity that could be evoked when GABA receptors were blocked. Higher concentrations of dl-APV did not exert additional actions, indicating that the NMDA component of the EPSP was blocked by 50 μm dl-APV. The total concentration of DMSO in the bath remained below 0.15%.
In a subset of experiments, drugs were applied by puff application through a small-tipped glass pipette (1–2 μm, similar to recording electrodes). Drugs were added to a puffing solution of (in nm) 125 NaCl, 10 HEPES, 2.5 KCl, 1.25 NaH2PO4, 2 MgCl2, 2 CaCl2, 10 dextrose, and 0.075 sodium metabisulfite, pH 7.3. The drugs that were puff applied included 1–2 μm TTX and 50 μm DA. Puffing pipettes were placed within 20 μm of the apical dendritic trunk or the soma and were pulled back when not in use. The spatial specificity of dendritic puff application was verified by puffing TTX (1–2 μm) to the dendritic region. In contrast to somatic application, dendritic puff application had no effect on somatic AP amplitude or threshold using these methods, indicative of a spatially limited action of puff application.
Data collection and analysis.
Signals were collected and digitized at 20–50 kHz via an ITC-18 interface board (Instrutech Corporation, Port Washington, NY), transmitting to an Apple Computer (Cupertino, CA) PowerPC G5 running Igor Pro software (WaveMetrics).
The AP rise time was quantified as the peak of the first derivative (dV/dT) of the AP waveform. The AP amplitude was defined as the difference between the AP peak voltage and the initial membrane potential (−70 mV in these experiments). AP firing adaptation was quantified as the ratio of the first interspike interval to the last interspike interval within a 700 ms current injection. A current amplitude that evoked four to five APs was used for analysis. PSP amplitude was measured as the peak voltage deflection in response to synaptic stimulation. PSP summation was quantified as the ratio of the amplitude of the last PSP to the first PSP. The PSP rise time was quantified as the time between 10 and 90% of the PSP amplitude. The decay time constant of PSPs was fit with a least-squares best-fit double-exponential function. Paired-pulse facilitation was quantified as the amplitude of the second PSP divided by the amplitude of the first PSP. In some experiments, a current shaped similar to a synaptic current was injected into the neuron [αPSP, current shape described by A(t/α)e(−ατ), where A is the amplitude of the injected current, t is time, and 1/α is the time to peak]. The αPSPs evoked by this current injection were quantified and analyzed in the same manner as synaptic PSPs. For determination of V1/2 of activation and inactivation of Na+ currents in nucleated patches, a sigmoidal curve was fit to the data from each neuron. A V1/2 value was determined from this fit for each neuron before and after DA treatment.
All planned comparisons were made with paired t tests, with an α level of 0.05 considered significant. Additional post hoc comparisons were made with Student's t tests. Bonferroni corrections of p values were used for multiple comparisons. In all plots, markers and error bars indicate the mean value ± SEM.
Results
Pyramidal neurons in layer V of the lateral EC were selected based on soma size and shape and the presence of a prominent apical dendrite directed toward the pial surface. The lateral EC was targeted because it receives the heaviest projections from the LAT (Pikkarainen et al., 1999). A total of 469 neurons were included in the analysis. The neurons recorded within layer V of the lateral EC were located between the lamina dissecans, which was apparent because of the density of fibers and layer VI, which had neurons that appeared smaller and closer to the external capsule. When recorded in current clamp, these neurons displayed electrophysiological characteristics consistent with previously described entorhinal cortical pyramidal neurons (Hamam et al., 2002). In current clamp, the mean resting membrane potential was −71.3 ± 0.8 mV, and input resistance was 87.5 ± 3.3 MΩ. These neurons displayed a range of regular or adapting AP firing patterns (adaptation ratio ranging from 0.77 to 0.21), a baseline AP amplitude of 106.1 ± 0.7 mV, and a half-width of 1.14 ± 0.02 ms. Furthermore, when filled with neurobiotin (Fig. 1A) or the calcium-sensitive dye bis-Fura 2 (below), the neurons displayed pyramidal neuron morphology.
Figure 1.
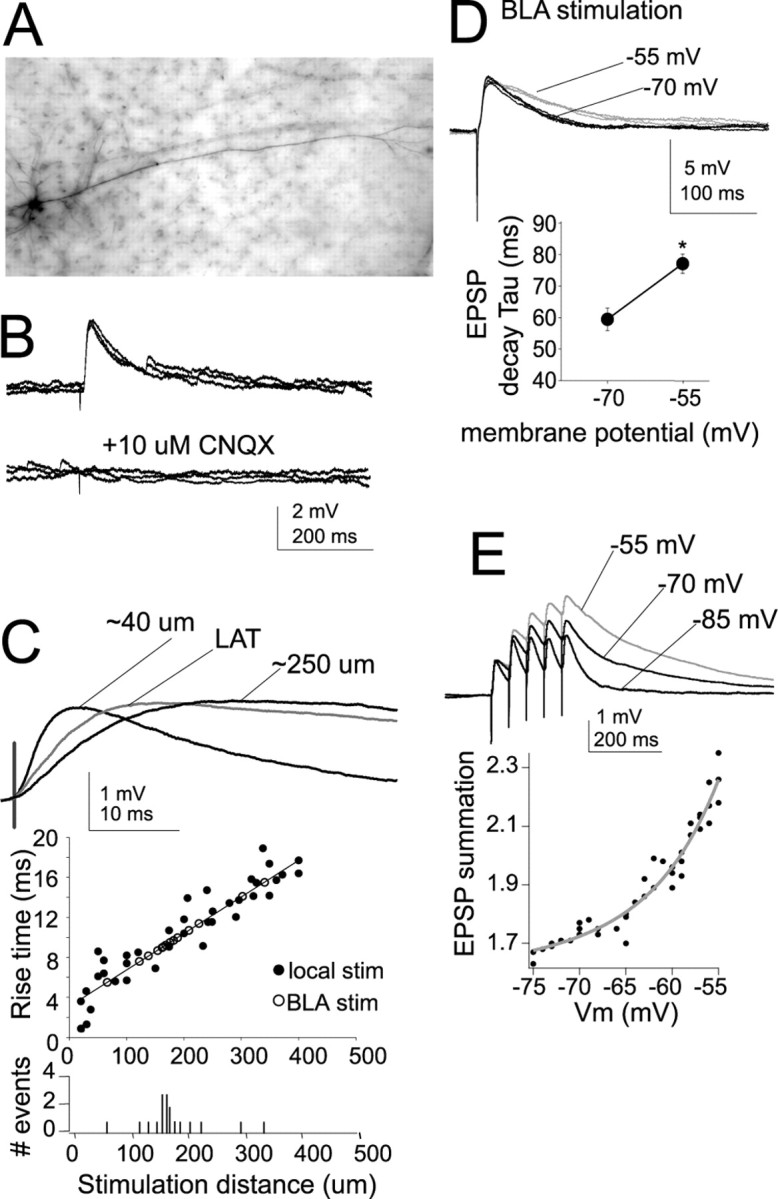
Characteristics of EPSPs. A, Example of a neurobiotin-filled layer V pyramidal neuron recorded in lateral EC. B, Stimulation of the LAT or local stimulation close to the apical dendrite of layer V EC neurons evokes an EPSP in the presence of blockers of NMDA, GABAA, and GABAB receptors. The remaining component of this EPSP is entirely blocked by 10 μm CNQX, an AMPA/kainate receptor blocker. For maximal clarity, in all panels, examples of LAT or local stimulation are shown, unless indicated otherwise. C, Traces show an EPSP evoked by stimulating electrodes ∼40 and 250 μm from the soma and an EPSP evoked by LAT stimulation (stim; average of 5 traces). The rise time of EPSPs is a rough index of the distance of a synapse from the recording electrode at the soma. The rise time of the locally evoked EPSPs is plotted as a function of distance of the stimulation electrode from the soma. By plotting the rise times of EPSPs evoked by LAT stimulation along the regression constructed from locally evoked EPSPs, one can derive a rough estimate of the distance of the LAT inputs from the soma. The histogram plots the number of LAT-evoked events as a function of their extrapolated input distance. The majority of LAT inputs display rise times that correspond to EPSPs evoked by local stimulation at 150–200 μm from the soma. D, The decay time of EPSPs was strongly voltage dependent, with a slower decay time constant observed at depolarized membrane potentials (gray). Three overlayed traces at each voltage are displayed. E, A consequence of this slower decay time was increased summation of EPSPs at depolarized membrane potentials (traces displayed are averages of 5 sweeps). Membrane potentials of −70 and −55 mV were chosen for statistical comparison. *p < 0.05, significant difference in a paired t test comparison between the two membrane potentials.
Voltage dependence of EPSP shape and summation
Synaptic inputs were activated by electrical stimulation in the LAT or 10–20 μm from the apical dendrite. Although study of the modulation of inputs from the amygdala to the EC was the main goal, locally evoked EPSPs were examined in addition to LAT-evoked EPSPs to facilitate Ca-imaging experiments of evoked EPSPs (below). Furthermore, it allows more direct comparisons with previous studies. In the presence of blockers for GABA and NMDA receptors (see Materials and Methods), an EPSP was evoked, the amplitude of which depended on the intensity of the electrical stimulation. An intensity of electrical stimulation was chosen that evoked a somatic EPSP of 2–4 mV (mean, 2.8 ± 0.2 mV; n = 39). With the addition of 10 μm CNQX, the remaining component of the EPSP was entirely blocked (n = 8) (Fig. 1B). When the LAT was stimulated, the measured rise time of the evoked EPSP was 10.2 ± 2.9 ms (n = 17). For initial experiments that used local stimulation, the distance of the stimulation electrode from the soma varied from 20 to 400 μm along the apical dendrite. The rise time of these evoked EPSPs was measured and plotted as a function of the distance of the stimulation electrode from the soma. The measured rise time correlated with the distance of the stimulation electrode from the soma (Fig. 1C) (r2 = 0.76; slope of change, 1 ms/36 μm). In theory, from this slope and the mean measured rise times of LAT-evoked EPSPs (10.2 ms), one can extrapolate the approximate distance from the soma of synapses of LAT inputs. The average mean rise time of LAT inputs is similar to synaptic inputs activated by a stimulation electrode ∼175 μm from the soma. Therefore, for the remainder of the experiments, the stimulation electrode was placed along the dendrite at ∼150–200 μm from the soma, unless noted otherwise.
To further characterize the LAT-evoked and locally evoked EPSPs, the decay time was measured. It was found that the EPSP decay time strongly depended on the membrane voltage (Fig. 1D). For comparison, a voltage near Vrest (−70 mV) was chosen and compared with a depolarized subthreshold membrane voltage (−55 mV) that is close to the depolarized “up” state in EC neurons observed during in vivo intracellular recordings (J. A. Rosenkranz and A. A. Grace, unpublished observation). The mean decay time of LAT-evoked EPSPs near Vrest (−70 mV) was 59.5 ± 3.6 ms, whereas the decay time at the depolarized membrane potential (−55 mV) was 77.3 ± 3.1 ms (n = 17; t = 3.75; p < 0.001, paired t test). A similar difference was observed with EPSPs evoked by local stimulation (near Vrest: −70 mV, 56.4 ± 4.0 ms; depolarized potential: −55 mV, 74.5 ± 3.8 ms). One consequence of this voltage-dependent difference in EPSP decay time was that when a train of five EPSPs was evoked by stimulation at 50 ms intervals, there was greater EPSP summation at the depolarized membrane potential (Fig. 1E) (LAT evoked: −70 mV, 1.73 ± 0.26, −55 mV, 2.17 ± 0.25 mV, n = 17, t = 2.77, p < 0.05, paired t test; locally evoked: −70 mV, 1.61 ± 0.19, −55 mV, 2.13 ± 0.13, n = 22, t = 2.85, p < 0.05, paired t test). For the remainder of this study, summation of PSPs in this manner was used as an assay for temporal integration.
DAergic modulation of EPSPs
To examine modulation of EPSP integration, 10 μm DA was bath applied for 2–3 min. This application of DA did not have a significant effect on the peak amplitude of evoked EPSPs near Vrest (Fig. 2A) [−70 mV; LAT-evoked EPSP: amplitude baseline, 2.7 ± 0.2 mV; post-DA, 2.6 ± 0.3 mV; n = 17; t = 1.87; not significant (n.s.); paired t test; local-evoked EPSP: amplitude baseline, 2.9 ± 0.3 mV; post-DA, 2.3 ± 0.5 mV; n = 22; t = 1.81; n.s.; paired t test] or at a depolarized membrane potential (−55 mV; LAT-evoked EPSP: amplitude baseline, 2.4 ± 0.4 mV; post-DA, 2.4 ± 0.4 mV; n = 17; t = 1.64; n.s.; paired t test; local-evoked EPSP: amplitude baseline, 2.6 ± 0.3 mV; post-DA, 2.7 ± 0.4 mV; n = 22; t = 1.72; n.s.; paired t test). To obtain preliminary indication of a presynaptic or postsynaptic locus of action, paired-pulse facilitation of EPSCs was examined at a range of interstimulus intervals (5–140 ms). There was no significant change of the paired-pulse ratio at any interval (Fig. 2B).
Figure 2.

DA has minimal effects on EPSP amplitude. A, Application of DA (10 μm for 2–3 min) did not have a significant effect on the amplitude of a single LAT- or local-evoked EPSP, regardless of the membrane potential. Five traces in baseline and five after DA are overlayed and displayed for each panel. Black traces are baseline, and gray traces are after DA. B, Paired-pulse facilitation of EPSCs did not change after application of DA, examined over a range of frequencies. Displayed are overlays of averaged traces of paired stimulations at varying intervals. C, Application of DA resulted in a slower decay time of EPSPs (see A). This was observed specifically at depolarized membrane potentials. *p < 0.05, significant difference compared with baseline conditions (paired t test).
When briefly examined in a previous study, and replicated here, we found that application of DA can suppress the summation of a train of EPSPs. However, when examined in further detail, there was a membrane state dependency for this effect of DA, and DA only suppressed the summation of EPSPs near Vrest (Fig. 3A). Thus, despite no significant effect on the amplitude of a single EPSP, at depolarized membrane potentials DA enhanced the summation of a train of EPSPs (Fig. 3A). As demonstrated previously (Rosenkranz and Johnston, 2006), the effect of DA on EPSP summation near Vrest was blocked by ZD7288 (10 μm, intracellular; n = 6), without blocking the effect of DA at depolarized membrane potentials (Fig. 3B). Below we will examine the mechanism of this DAergic facilitation of EPSP integration at depolarized membrane potentials, which contributes to the state dependency of the effects of DA. To examine this, trains of 5 EPSPs were used below instead of 10 EPSPs for two reasons: (1) a shorter train of EPSPs can minimize the potential long-term effects of repeated synaptic stimulation, and (2) using a shorter train of EPSPs allows further isolation of the DAergic effect to be examined here, because the effect of DA on EPSP integration at Vrest is weaker when a shorter train of EPSPs is examined (Fig. 3). This is consistent with DAergic modulation of h-channels near Vrest, which is expected to have a temporally constrained impact on EPSP summation because of its slower kinetics.
Figure 3.

DA modulates integration of EPSPs. A, Overlayed traces of a train of 10 EPSPs demonstrate that DA (gray traces) enhances summation at a depolarized membrane potential but decreases summation near the resting membrane potential. The right panel plots the time course of the effects of DA in two neurons (black circles are summation of 10 EPSPs; gray circles are summation of 5 EPSPs). The time course of the effects of DA in this example indicate that it began shortly after application of DA (at solid bar) and returned close to baseline. B, As demonstrated previously, the effects of DA on summation near Vrest are blocked by ZD7288 but not the effects of DA at a depolarized membrane potential. C, DAergic modulation of the summation of five EPSPs also displayed a voltage dependence and allows more isolated examination of processes involved in DAergic enhancement of integration at depolarized membrane potentials because effects on summation of EPSPs near Vrest are minimal. *p < 0.05, significant difference in a paired t test comparison between baseline and post-DA conditions.
When using a train of five EPSPs, DA significantly increased the summation of LAT-evoked and locally evoked EPSPs at a depolarized Vm (Fig. 3A,C) (−55 mV; LAT-evoked EPSP: summation baseline, 2.17 ± 0.25; post-DA, 2.59 ± 0.19; n = 17; t = 2.67; p < 0.05, paired t test; local-evoked EPSP: summation baseline, 2.1 ± 0.13; post-DA, 2.47 ± 0.18; n = 22; t = 2.52; p < 0.05, paired t test). This effect was not observed near Vrest when five EPSPs are evoked (−70 mV; LAT-evoked EPSP: summation baseline, 1.73 ± 0.26; post-DA, 1.54 ± 0.28; n = 17; t = −1.94; n.s.; paired t test; local-evoked EPSP: summation baseline, 1.61 ± 0.19; post-DA, 1.55 ± 0.19; n = 22; t = −1.83; n.s.; paired t test). The effect of DA on EPSP summation was at least partly reversible after extended washout in all cases examined (Fig. 3A) (after 60 min washout, EPSP summation was measured at −55 mV; LAT-evoked EPSP: summation, 2.21 ± 0.30; n = 11; t = 1.51; n.s.; paired t test with baseline; local-evoked EPSP: summation, 2.19 ± 0.31; n = 11; t = 1.44; n.s.; paired t test with baseline).
To further test whether postsynaptic factors are sufficient to account for the effects of DA, synaptic inputs were blocked, and EPSC-shaped currents were injected to the soma. The voltage responses evoked (αPSPs) by these currents mimicked synaptic inputs. The EPSC-shaped current amplitude and decay time were modified until they approached the kinetics of EPSPs evoked by electrical stimulation ∼150–200 μm from the soma (mean amplitude, 2.9 ± 0.7 mV; n = 19) including the voltage dependence of the αPSP decay time (mean decay time constant: −70 mV, 57.5 ± 3.6 ms; −55 mV, 72.7 ± 3.1 ms; n = 19; t = 3.13; p < 0.001, paired t test). Similar to synaptic EPSPs, depolarization enhanced summation of a train of five αEPSPs (supplemental Fig S1A, available at www.jneurosci.org as supplemental material) (summation −70 mV, 1.63 ± 0.26; summation −55 mV, 2.0 ± 0.27; n = 19; t = 2.98; p < 0.01, paired t test).
To test whether two separate mechanisms that use different temporal kinetics and voltage parameters contribute to the effects of DA at depolarized and resting membrane potentials, αPSPs were injected at different frequencies and different numbers, and the membrane potential was shifted between two different membrane potentials, −70 and −55 mV. The effects of DA on αPSPs summation near Vrest were minimal throughout a range of frequencies when five αPSPs were examined (supplemental Fig S1A, available at www.jneurosci.org as supplemental material). When longer trains of αPSPs were used, DA caused a suppression of αPSP integration near Vrest. However, at depolarized membrane potentials, DA greatly enhanced summation of five αPSPs at a variety of frequencies. Longer trains of αPSPs (n = 10) facilitated the actions of DA when the membrane potential was depolarized to −55 mV. The voltage dependence of the direction of the effects of DA indicates that DAergic modulation of voltage-dependent ion channels may contribute to this voltage state dependency. The dependence on the number of αPSPs (functionally, the duration of the input) near Vrest, but not at depolarized membrane potentials, implies that DA modulates a faster conductance at depolarized membrane potentials and a slower conductance near Vrest. What emerges is a divergent DAergic modulation of PSP integration that depends on the membrane potential.
To gain initial insight into the mechanism of the effect of DA on EPSP summation, the EPSP decay time was examined. DA significantly prolonged the EPSP decay time, specifically at depolarized membrane potentials (Fig. 2A,C) (−55 mV; LAT-evoked EPSP decay time: baseline, 77.3 ± 3.1 ms; post-DA, 88.6 ± 3.9 ms; n = 17; t = 2.57; p < 0.05, paired t test; local-evoked EPSP decay time: baseline, 74.5 ± 3.8 ms; post-DA, 86.2 ± 4.0 ms; n = 22; t = 2.71; p < 0.05, paired t test). There was no significant effect near Vrest (−70 mV; LAT-evoked EPSP decay time: baseline, 59.5 ± 3.6 ms; post-DA, 53.8 ± 3.0 ms; n = 17; t = −1.99; n.s.; paired t test; local-evoked EPSP decay time: baseline, 56.4 ± 4.0 ms; post-DA, 52.7 ± 3.9 ms; n = 22; t = −2.08; n.s.; paired t test). This prolongation of the EPSP can increase the time window for EPSP integration and may account for the facilitation of EPSP summation.
To determine what DA receptor subtypes were involved in the actions of DA on summation of LAT-evoked or locally evoked EPSPs, specific agonists and antagonists were applied. The DA D2 agonist quinpirole (10 μm) mimicked the effects of DA on EPSP summation at depolarized membrane potentials (Table 1). The DA D1 agonist SKF81297 (10 μm) exerted the opposite effects (Table 1). Furthermore, the actions of DA on EPSP decay and summation were blocked by sulpiride (5 μm) but not SCH23390 (10 μm) (Table 1).
Table 1.
Effects of DA receptor subtype on EPSP decay time and summation
| Stimulation site | EPSP decay time (ms) |
EPSP summation |
||||||
|---|---|---|---|---|---|---|---|---|
| LAT |
Local |
LAT |
Local |
|||||
| −70 mV | −55 mV | −70 mV | −55 mV | −70 mV | −55 mV | −70 mV | −55 mV | |
| Quinpirole | ||||||||
| Baseline | 57.7 ± 3.3 | 75.4 ± 3.9 | 56.6 ± 3.7 | 72.7 ± 3.5 | 1.77 ± 0.21 | 2.44 ± 0.22 | 1.70 ± 0.19 | 2.55 ± 0.24 |
| Drug | 57.1 ± 3.7 | 87.6 ± 4.0* | 56.2 ± 3.8 | 92.2 ± 3.7* | 1.71 ± 0.27 | 3.13 ± 0.30* | 1.76 ± 0.19 | 3.20 ± 0.22* |
| SKF81297 | ||||||||
| Baseline | 58.4 ± 3.5 | 73.7 ± 3.6 | 57.4 ± 3.4 | 77.5 ± 3.4 | 1.68 ± 0.32 | 2.31 ± 0.27 | 1.63 ± 0.26 | 2.48 ± 0.29 |
| Drug | 52.9 ± 3.6 | 73.1 ± 3.6 | 54.1 ± 3.2 | 69.5 ± 3.6* | 1.41 ± 0.16* | 2.18 ± 0.22 | 1.43 ± 0.24 | 2.04 ± 0.24* |
| Sulpiride | ||||||||
| Sulpiride | 55.8 ± 3.4 | 71.6 ± 3.3 | 53.6 ± 3.5 | 69.4 ± 3.6 | 1.61 ± 0.19 | 2.37 ± 0.21 | 1.79 ± 0.24 | 2.42 ± 0.24 |
| +DA | 53.3 ± 3.3 | 71.9 ± 3.3 | 50.8 ± 3.5 | 68.9 ± 3.5 | 1.48 ± 0.25 | 2.28 ± 0.24 | 1.51 ± 0.25 | 2.11 ± 0.26 |
| SCH23390 | ||||||||
| SCH23390 | 57.2 ± 3.5 | 76.7 ± 3.6 | 58.5 ± 3.7 | 78.0 ± 3.7 | 1.68 ± 0.22 | 2.41 ± 0.23 | 1.66 ± 0.27 | 2.46 ± 0.26 |
| +DA | 58.2 ± 3.7 | 89.3 ± 3.6* | 58.1 ± 3.7 | 90.8 ± 3.7* | 1.67 ± 0.21 | 2.98 ± 0.22* | 1.59 ± 0.27 | 3.19 ± 0.28* |
Quinpirole, SKF81297, and SCH23390 were administered at 10 μm. Sulpiride was administered at 5 μm. LAT stimulation was as follows: quinpirole, n = 7; SKF81297, n = 7; sulpiride, n = 6; SCH23390, n = 6. Local stimulation was as follows: quinpirole, n = 6; SKF81297, n = 7; sulpiride, n = 6; SCH23390, n = 7. *p < 0.05 with paired t test comparison to previous condition at the same Vm.
DAergic modulation of postsynaptic channels
To verify the postsynaptic locus of this action of DA and to probe the mechanism involved, two approaches were used: (1) a blocker of ion channels [N-(2,6-dimethylphenylcarbamoylmethyl)-triethylammonium bromide (QX-314)] was included in the intracellular solution, or (2) all synaptic inputs were blocked, and the mechanism of DAergic modulation of αPSPs were examined. Intracellular QX-314 (3 mm) suppressed the enhancement of EPSP summation observed at depolarized membrane potentials (supplemental Fig S2A, available at www.jneurosci.org as supplemental material) (EPSP summation: −70 mV, 2.17 ± 0.16; −55 mV, 1.77 ± 0.21; n = 7; t = −2.60; p < 0.05, paired t test; LAT-evoked EPSPs were examined). In addition, intracellular QX-314 blocked the DAergic enhancement of EPSP summation at depolarized membrane potentials (supplemental Fig S2B, available at www.jneurosci.org as supplemental material) (EPSP summation at −55 mV: baseline, 1.77 ± 0.21; post-DA, 1.68 ± 0.20; n = 7; t = -1.52; n.s.; paired t test; EPSP summation at −70 mV: baseline, 2.17 ± 1.6; post-DA, 2.04 ± 0.28; n = 7; t = 1.77; n.s.; paired t test). Blockade of the effects of DA with a postsynaptic manipulation is consistent with a postsynaptic action of DA.
To further examine postsynaptic mechanisms, αPSPs were examined in more detail. An additional advantage of αPSPs is that DAergic modulation of postsynaptic glutamate receptors can be excluded. In accord with synaptic EPSPs, DA prolonged the αPSP decay time constant only at depolarized membrane potentials (Fig. 4A) (−55 mV decay time: baseline, 72.7 ± 3.1 ms; post-DA, 84.3 ± 3.1 ms; n = 19; t = 2.21; p < 0.05, paired t test) but not near Vrest (−70 mV decay time: baseline, 57.5 ± 3.3 ms; post-DA, 52.6 ± 3.1 ms; n = 19; t = −1.81; n.s.; paired t test). Furthermore, as noted above, DA enhanced the summation of five αPSPs at depolarized membrane potentials (Fig. 4B) (αPSP summation at −55 mV: baseline, 2.0 ± 0.27; post-DA, 2.8 ± 0.23; n = 19; t = 2.53; p < 0.05, paired t test) but not near Vrest (αPSP summation at −70 mV: baseline, 1.63 ± 0.26; post-DA, 1.50 ± 0.30; n = 19; t = 1.64; n.s.; paired t test). This indicates that the DAergic modulation of PSP time constant and summation can be accounted for with postsynaptic mechanisms. These effects of DA on αPSP were mimicked by the DA D2 agonist quinpirole (supplemental Fig S3A, available at www.jneurosci.org as supplemental material) and not mimicked by the DA D1 agonist SKF81297 (Table 2).
Figure 4.

DAergic modulation of postsynaptic PSPs is blocked by TTX. All synaptic inputs were blocked, and an EPSC-shaped current was injected. The resulting αPSP displayed similarities to EPSPs. A, There was a slower αPSP decay time at depolarized membrane potentials. DA (gray) caused an additional prolongation of the αPSP decay. B, Also similar to EPSPs, there was greater αPSP summation at depolarized membrane potentials, and DA further enhanced summation at depolarized membrane potentials. C, D, Bath application of TTX (1 μm; gray) blocked the prolongation of the EPSP decay that is observed at depolarized membrane potentials in baseline conditions (C) and blocked the enhanced summation of αPSP observed at depolarized membrane potentials in baseline conditions (D). E, Preapplication of TTX blocked the effect of DA on EPSP decay time and summation at depolarized membrane potentials. All αPSP traces are averages of five sweeps. *p < 0.05, significant difference in a paired t test comparison between baseline and drug conditions.
Table 2.
Effects of DA receptor subtype on αPSP decay time and summation
| Stimulation site | αPSP decay time (ms) |
αPSP summation | ||
|---|---|---|---|---|
| −70 mV | −55 mV | −70 mV | −55 mV | |
| Quinpirole (n = 9) | ||||
| Baseline | 58.9 ± 3.4 | 74.5 ± 3.0 | 1.69 ± 0.09 | 2.26 ± 0.21 |
| Drug | 59.3 ± 3.3 | 90.7 ± 3.5* | 1.73 ± 0.08 | 2.99 ± 0.24* |
| SKF81297 (n = 9) | ||||
| Baseline | 56.8 ± 3.2 | 70.2 ± 3.5 | 1.57 ± 0.07 | 2.11 ± 0.17 |
| Drug | 51.8 ± 3.1 | 68.8 ± 3.4 | 1.45 ± 0.09 | 2.20 ± 0.20 |
| Sulpiride (n = 6) | ||||
| Sulpiride | 56.6 ± 3.0 | 71.8 ± 3.0 | 1.66 ± 0.12 | 2.16 ± 0.23 |
| +DA | 51.3 ± 3.1 | 69.1 ± 3.2 | 1.53 ± 0.14 | 1.99 ± 0.23 |
| SCH23390 (n = 6) | ||||
| SCH23390 | 57.4 ± 3.0 | 73.6 ± 3.1 | 1.56 ± 0.14 | 2.31 ± 0.16 |
| +DA | 57.7 ± 2.9 | 89.7 ± 3.2* | 1.65 ± 0.17 | 3.03 ± 0.17 |
Quinpirole, SKF81297, and SCH23390 were administered at 10 μm. Sulpiride was administered at 5 μm. *p < 0.05 with paired t test compared with previous condition at the same Vm.
To gain insight into the second-messenger cascade altered by DA D2 receptor activation, the effects of quinpirole (10 μm) on αPSP summation were examined after preincubation with protein kinase inhibitors. The specific PKA blocker KT5720 (1 μm, intracellular) diminished the effects of quinpirole on αPSP summation (Table 3 and supplemental Fig S3B, available at www.jneurosci.org as supplemental material) but did not completely block these effects. However, the protein kinase C (PKC) inhibitor chelerythrine (2 μm) caused two effects: the summation at depolarized membrane potentials was much greater when PKC was blocked, and the effects of quinpirole were reversed (Table 3 and supplemental Fig S3C, available at www.jneurosci.org as supplemental material). This implies that DA D2 receptors may exert their actions on αPSP summation by reduction in PKC activity, or by actions that oppose PKC.
Table 3.
Effect of the DA D2 receptor agonist quinpirole of α PSP summation when protein kinases are inhibited
| Drug | Condition | αPSP summation |
|
|---|---|---|---|
| −70 mV | −55 mV | ||
| GF109203X (10 μm) (n = 4) | Baseline | 1.50 ± 0.09 | 2.37 ± 0.27 |
| Quinpirole | 1.46 ± 0.17 | 2.40 ± 0.17 | |
| KT5720 (1 μm) (n = 8) | Baseline | 1.56 ± 0.05 | 2.22 ± 0.22 |
| Quinpirole | 1.64 ± 0.08 | 2.55 ± 0.15* | |
| Chelerythrine (2 μm) (n = 7) | Baseline | 1.59 ± 0.06 | 2.31 ± 0.15 |
| Chelerythrine | 1.58 ± 0.06 | 2.97 ± 0.23* | |
| Quinpirole | 1.59 ± 0.05 | 2.27 ± 0.17* | |
| TTX (0.5 μm) + chelerythrine (2 μm) (n = 5) | TTX | 1.49 ± 0.20 | 1.50 ± 0.16 |
| +Chelerythrine | 1.47 ± 0.06 | 1.32 ± 0.14 | |
| U73122 (3 μm) (n = 6) | Baseline | 1.38 ± 0.07 | 2.13 ± 0.16 |
| U73122 | 1.37 ± 0.10 | 2.16 ± 0.22 | |
| Quinpirole | 1.36 ± 0.07 | 2.20 ± 0.24 | |
| BAPTA (20 mm) (n = 6) | Baseline | 1.39 ± 0.08 | 2.09 ± 0.18 |
| Quinpirole | 1.34 ± 0.04 | 2.28 ± 0.16 | |
| Cyclosporin A (1 μm) (n = 5) | Baseline | 1.41 ± 0.14 | 2.42 ± 0.20 |
| Cyclosporin A | 1.36 ± 0.15 | 1.96 ± 0.21* | |
| Quinpirole | 1.36 ± 0.11 | 1.88 ± 0.17 | |
| Calcineurin autoinhibitory peptide (100 μm) (n = 6) | Baseline | 1.21 ± 0.09 | 1.14 ± 0.07 |
| Quinpirole | 1.68 ± 0.18 | 1.61 ± 0.16 | |
| Okadaic acid (100 nm) (n = 6) | Baseline | 1.70 ± 0.15 | 2.26 ± 0.15 |
| Okadaic acid | 1.61 ± 0.14 | 2.02 ± 0.14 | |
| Quinpirole | 1.52 ± 0.15 | 1.96 ± 0.21 | |
| SQ22536 (100 μm) (n = 5) | Baseline | 1.68 ± 0.10 | 2.15 ± 0.17 |
| Quinpirole | 1.77 ± 0.13 | 2.41 ± 0.20* | |
| Forskolin (5 μm) (n = 5) | Baseline | 1.57 ± 0.13 | 2.14 ± 0.13 |
| Forskolin | 1.50 ± 0.08 | 1.81 ± 0.08* | |
| Forskolin (25 μm) (n = 6) | Baseline | 1.55 ± 0.09 | 2.31 ± 0.14 |
| Forskolin | 1.42 ± 0.09 | 1.99 ± 0.13* | |
| Quinpirole | 1.48 ± 0.10 | 2.38 ± 0.15* | |
Quinpirole was applied at 10 μm. BAPTA, calcineurin autoinhibitory peptide, and SQ22536 were all applied intracellularly. *p < 0.05, significant difference with paired t test compared with baseline (or previous) condition at the same Vm.
To verify that PKC may be exerting action by modulation of Na+ channels, TTX (0.5 μm) was applied before chelerythrine (2 μm). TTX blocked the effects of chelerythrine. However, as seen above, TTX diminished αPSP summation at depolarized membrane potentials. To compensate for this, the size of the αPSP was increased, and its decay prolonged to enhance the maximal potential reached by the summating PSPs. Even when the αPSPs were increased in this manner, TTX still blocked the effect of chelerythrine (Table 3).
To further examine the potential role of a PKC-dependent path in the effects of D2 receptor activation, other inhibitors were also applied. The PLC inhibitor U73122 (3 μm) and internal BAPTA (20 mm) also blocked the effect of quinpirole (Table 3 and supplemental Fig S3C, available at www.jneurosci.org as supplemental material). A combination of nickel and nimodipine (50 μm and 10 μm) did not block the effects of DA (below), indicating that internal calcium stores are likely involved in the actions of D2 receptor activation. The PP2B inhibitors cyclosporin A (1 μm) (supplemental Fig S3C, available at www.jneurosci.org as supplemental material) and calcineurin autoinhibitory peptide (100 μm, intracellular) also both blocked the effects of quinpirole (Table 3), whereas the PP2A/PP1 inhibitor okadaic acid (100 nm) diminished but did not block the effect of quinpirole (Table 3). This implies that D2 receptor activation likely modulates PP2B via PLC and internal Ca2+ stores and thereby induces an action on PSP summation opposite to PKC activation, similar to the effects of PKC inhibition. To further exclude a role for PKA in this effect of DA, modulators of adenylyl cyclase were examined. SQ22536 (100 μm, intracellular) did not block the effect of quinpirole (Table 3 and supplemental Fig S3B, available at www.jneurosci.org as supplemental material), whereas forskolin (5 μm) decreased αPSP summation and higher doses of forskolin (25 μm) did not block the effect of quinpirole on αPSP summation (Table 3 and supplemental Fig S3B, available at www.jneurosci.org as supplemental material).
However, it was unclear why quinpirole reduced αPSP summation when PKC was blocked with chelerythrine (above). When PKC activity was blocked with GF109203X at a concentration that also reduces PKA activity (10 μm), the effects of quinpirole on αPSP summation are completely blocked (Table 3). Blockade of PKC may unmask PKA-dependent effects, or PKC can bias the coupling of DA receptors between G-proteins that may be preferentially linked to PLC (such as Gq) or adenylyl cyclase (i.e., Gs and Gi/o).
To verify that DA uses a similar signaling cascade in enhancement of αPSP summation, its effects (10 μm DA) were examined in the presence of blockers of PLC or PP2B (Table 4). Both U73122 (3 μm) and cyclosporin A (1 μm) blocked the DAergic enhancement of αPSP summation.
Table 4.
The enhanced summation of αPSPs after DA is blocked by inhibitors of PLC and PP2B
| Drug | Condition | αPSP summation |
|
|---|---|---|---|
| −70 mV | −55 mV | ||
| U73122 (3 μm) (n = 5) | Baseline | 1.46 ± 0.11 | 2.29 ± 0.25 |
| Dopamine | 1.37 ± 0.06 | 2.09 ± 0.23 | |
| Cyclosporin A (1 μm) (n = 5) | Baseline | 1.45 ± 0.05 | 2.42 ± 0.24 |
| Dopamine | 1.35 ± 0.04 | 2.22 ± 0.11 | |
To confirm that DA uses the same signaling cascade as the DA D2 agonist in modulating αPSP summation, inhibitors of PLC and PP2B were applied for at least 15 min before application of DA (10 μm).*p < 0.05 (paired t test) compared with baseline at the same membrane potential.
We observed above that intracellular application of the ion channel blocker QX-314 blocked the effects of DA on EPSP summation. To examine what ion channels may underlie this postsynaptic effect of DA, blockers of ion channels were applied. QX-314 blocks several ion channels, including Na+ channels. The effect of a more specific blocker of Na+ channels, TTX, on αPSPs was examined. Application of TTX (1 μm) abolished the voltage-dependent enhancement of αPSP summation (Fig. 4D, Table 5). Thus, whereas depolarization usually enhanced αPSP summation, in the presence of TTX, summation was reduced at depolarized membrane potentials (αPSP summation at −55 mV: baseline, 2.35 ± 0.15; TTX, 0.76 ± 0.07; n = 9; t = −4.07; p < 0.01, paired t test). TTX had minimal effects near Vrest (αPSP summation at −70 mV: baseline, 1.37 ± 0.14; TTX, 1.33 ± 0.20; n = 9; t = 1.77; n.s.; paired t test). Furthermore, TTX blocked the effect of DA on αPSP summation (Fig. 4E) (−55 mV: TTX, 0.76 ± 0.07; TTX plus DA, 0.80 ± 0.20; n = 9; t = 1.85; n.s.; paired t test). Similar to baseline conditions, there was a minimal effect of DA on αPSP summation near Vrest in the absence (above) or presence of TTX (αPSP summation at −70 mV: TTX, 1.33 ± 0.20; TTX plus DA, 1.10 ± 0.20; n = 9; t = 2.16; n.s.; paired t test). Application of 4-AP (3 mm), while greatly enhancing αPSP summation, did not block the DAergic enhancement of αPSP summation at depolarized membrane potentials (Table 5). Neither did application of blockers of several other voltage-dependent ion channels (Table 5), such as BaCl2 (250 μm), ZD7288 (20 μm), and NiCl2 (10 μm) with nimodipine (50 μm). These data are consistent with a postsynaptic DAergic enhancement of signal integration via modulation of Na+ channel activity.
Table 5.
The effects of DA are diminished by Na+ channel blockers but not by blockers of other voltage-gated ion channels
| Drug | Condition | αPSP summation |
|
|---|---|---|---|
| −70 mV | −55 mV | ||
| TTX (1 μm) (n = 9) | Baseline | 1.37 ± 0.14 | 2.35 ± 0.15 |
| TTX | 1.33 ± 0.2 | 0.76 ± 0.07* | |
| +DA | 1.10 ± 0.2 | 0.80 ± 0.20 | |
| 4-AP (3 mm) (n = 7) | Baseline | 1.47 ± 0.18 | 2.14 ± 0.2 |
| 4-AP | 1.68 ± 0.20* | 4.63 ± 0.21* | |
| +DA | 1.61 ± 0.20 | 5.07 ± 0.2* | |
| BaCl2 (250 μm) (n = 6) | Baseline | 1.42 ± 0.17 | 2.37 ± 0.16 |
| BaCl2 | 1.72 ± 0.18* | 2.98 ± 0.17* | |
| +DA | 1.75 ± 0.17 | 3.32 ± 0.18* | |
| ZD7288 (20 μm) (n = 7) | Baseline | 1.49 ± 0.15 | 2.28 ± 0.2 |
| ZD7288 | 1.89 ± 0.18* | 2.31 ± 0.2 | |
| +DA | 2.02 ± 0.16 | 2.79 ± 0.2* | |
| NiCl2/nimodipine (50/10 μm) (n = 6) | Baseline | 1.55 ± 0.19 | 2.38 ± 0.2 |
| NiCl2/nim | 1.61 ± 0.18 | 2.44 ± 0.17 | |
| +DA | 1.57 ± 0.21 | 2.96 ± 0.18* | |
Application of DA causes an increase in PSP summation at depolarized membrane potentials, even when blockers of K+, Ca2+, or h-channels are present. *p < 0.05 (paired t test) compared with previous condition at the same voltage.
If Na+ channels, in fact, underlie the actions of DA, one may expect modification of other indices of Na+ channel activation, such as AP parameters. Consistent with enhancement of Na+ channel activity, DA increased the amplitude and rise time of antidromic APs (supplemental Fig S4, available at www.jneurosci.org as supplemental material) (AP amplitude: baseline, 101.3 ± 2.7 mV; post-DA, 107.1 ± 2.5 mV; n = 14; t = 2.26; p < 0.05, paired t test; AP rise time: baseline, 167.2 ± 13.8 mV/ms; post-DA, 175.0 ± 13.2 mV/ms; n = 14; t = 2.19; p < 0.05, paired t test).
Modulation of Na+ channels can be more directly examined by measurement of Na+ currents. Nucleated patch recordings were used to measure the activation, inactivation, and peak amplitude of the Na+ current (see Materials and Methods). TTX (1 μm) entirely blocked this current in a separate group of neurons (n = 5) and in a portion of the neurons examined below after application of DA (n = 4). Application of DA induced a small leftward shift in the activation of Na+ currents (Fig. 5B) (baseline V1/2, −38.7 ± 0.6 mV; post-DA V1/2, −42.3 ± 0.7 mV; n = 11; t = 2.74; p < 0.05, paired t test) without a significant shift in the inactivation (baseline V1/2, −70.3 ± 0.7 mV; post-DA V1/2, −69.3 ± 0.7 mV; n = 6; t = 1.69; n.s.; paired t test). There was a small increase in the peak Na+ current (Fig. 5A) (baseline, 326.5 ± 29.7 pA; post-DA, 352.9 ± 30.15 pA; n = 11; t = 2.34; p < 0.05, paired t test). The DA D2 agonist quinpirole (10 μm) also increased the peak Na+ current (Fig. 5C) (baseline peak Na+ current, 337.8 ± 32.5 pA; post-quinpirole, 372.1 ± 34.4 pA; n = 5; t = 2.72; p < 0.05, paired t test) and induced a leftward shift in the activation curve (baseline V1/2, −39.5 ± 0.7 mV; post-quinpirole, −43.7 ± 0.7 mV; n = 5; t = 3.28; p < 0.08, paired t test). The DA D1 agonist SKF81297 (10 μm) did not mimic the effect of DA but decreased the peak Na+ current (Fig. 5C) (baseline, 311.1 ± 32.8 pA; post-SKF81297, 282.5 ± 33.5 pA; n = 5; t = −2.95; p < 0.05) and had minimal effects on activation (baseline V1/2, −38.8 ± 0.8 mV; post-SKF81297 V1/2, −39.1 ± 0.8 mV; n = 5; t = 1.73; n.s.; paired t test).
Figure 5.

DA modulates Na+ current measured from nucleated patches. A, Application of DA caused a small increase in the peak INa. B, DA (gray) caused a leftward shift in the voltage of activation of INa, without a significant change in the inactivation. C, The effects of DA were mimicked by a D2 agonist quinpirole (10 μm). A D1 agonist, SKF81297 (10 μm), exerted the opposite effect, decreasing Na+ currents. D, To test whether INa was modulated within the limited voltage ranges examined in current-clamp recordings (above), INa was evoked with a 10 mV step to −55 mV, grossly mimicking the depolarization evoked by summation of EPSPs at depolarized membrane potentials. The peak amplitude of this INa was greatly enhanced by DA. Overlayed are averaged traces of the current evoked by a 10 mV step to −55 mV (black) and to −80 mV (gray) for comparison. E, DA also prolonged the decay time of a Na+ current evoked by a voltage step from −100 mV to approximately −60 mV. All INa traces depicted are averages of 5–10 sweeps. *p < 0.05, significant difference in a paired t test comparison between baseline and DA conditions.
To examine whether DA modulates Na+ currents activated within the voltage range applicable to modulation of EPSP integration at depolarized membrane potentials, a Na+ current was activated with a 10 mV step to approximately −55 mV to grossly mimic a train of EPSPs evoked from depolarized membrane potentials. This current was greatly enhanced by DA (Fig. 5D) (baseline, 6.9 ± 1.2 pA; post-DA, 17.7 ± 2.5 pA; n = 7; t = 3.10; p < 0.05, paired t test).
To further examine modulation of Na+ channels, cell-attached recordings were performed. One advantage of this approach is that less cellular disruption occurs compared with nucleated patch recordings. Macropatch recordings of multiple Na+ channels were performed from control neurons and in other neurons within 5–10 min after application of DA (Fig. 6A). Na+ channels were activated with voltage steps in 10 mV increments from a holding potential 20 mV hyperpolarized to Vrest. The slope conductance was 18.0 ± 0.9 pS, measured with voltage steps from 20 mV hyperpolarized to between 80 and 110 mV depolarized from rest (approximately between membrane potentials of +10 and +40 mV from a Vinitial of −90 mV). No current was observed when TTX (1 μm) was included in the recording pipette (n = 5). There was no significant difference in the peak Na+ current between control neurons and DA-exposed neurons (Figs. 6B, C) (control neurons: 5.2 ± 0.8 pA, n = 12; DA: 6.3 ± 1.2 pA, n = 13; t = 0.81; n.s.; unpaired t test). Similar to nucleated patch recordings, neurons exposed to DA displayed a more hyperpolarized activation curve (Fig. 6D) (control: V1/2, −30.6 ± 0.9 mV; n = 12; DA: V1/2, −36.0 ± 0.6 mV; n = 13; t = 5.07; p < 0.001, unpaired t test). In control neurons, Na+ channel activation was typically brief and lasted for a short duration after the onset of the voltage step between −50 to −60 mV. In neurons exposed to DA, the activity of the channels lasted longer (Fig. 6A). In some rare instances (∼1–2 of every 100 voltage steps), the channel openings appeared persistent throughout the duration of the voltage step. To quantify this, the current responses were averaged, and the decay of the current was fit with a single exponential. DA prolonged the decay time constant of the averaged current (Fig. 6B,C) (control, 2.46 ± 0.77 ms; range, 1.37–7.29 ms; n = 12; DA, 5.36 ± 0.67; range, 1.41–16.54 ms; n = 13; t = 2.85; p < 0.01, unpaired t test). Based on this finding, we also measured the decay time constants of Na+ currents activated by voltage steps from approximately −100 mV to approximately −60 mV in nucleated patches. Two time constants could be seen: a faster time constant, τ1, of 3.69 ± 1.44 ms and a slower time constant, τ2, of 18.01 ± 4.93 ms. Application of DA significantly prolonged the slower time constant (Fig. 5E) (τ1, 7.19 ± 2.01 ms; n = 11, t = 1.88; n.s.; paired t test with baseline τ1; τ2, 46.42 ± 11.29 ms; n = 11; t = 2.64; p < 0.05, paired t test with baseline τ2).
Figure 6.
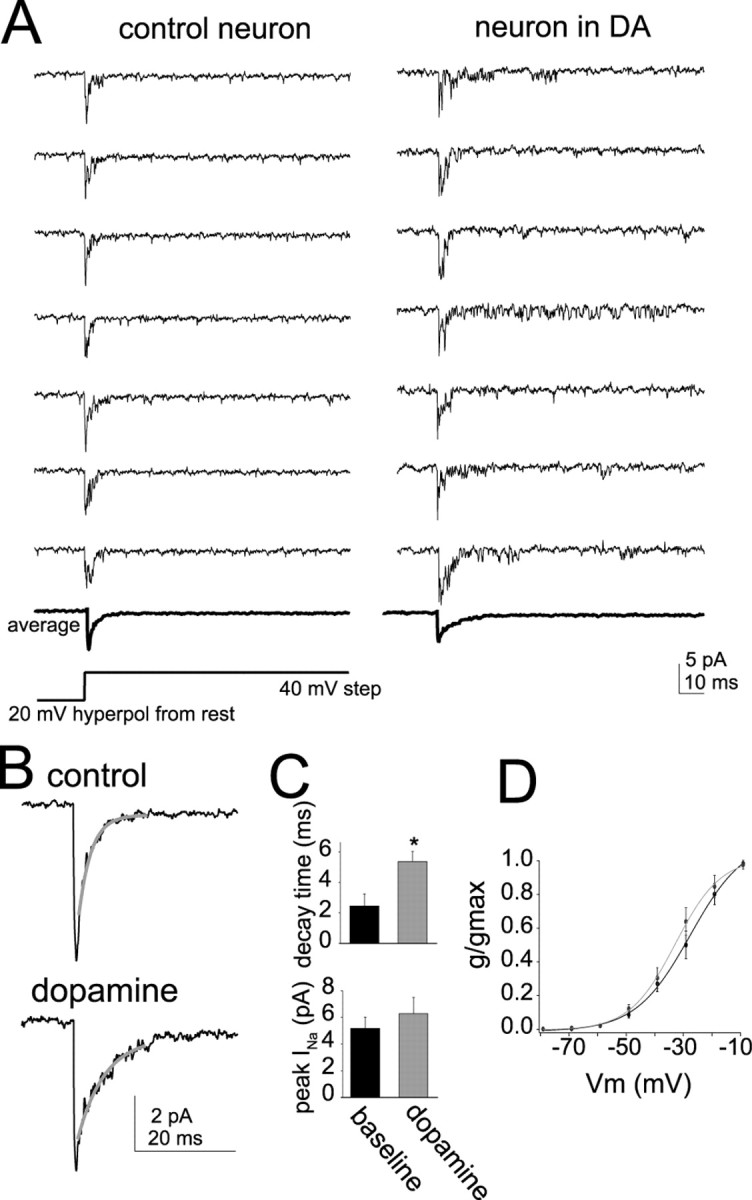
DA increases the activity of Na+ channels. A, Cell-attached recordings of multiple Na+ channels activated by a 40 mV step from 20 mV hyperpolarized to rest. Neurons exposed to DA (right) displayed a greater tendency for longer-lasting channel activity than nonexposed control neurons (left). B, The decay time of the averaged Na+ current was fit with a single exponential (gray). Neurons that were exposed to DA (bottom) displayed averaged current that decayed slower compared with control neurons. C, The decay time of the current was prolonged in neurons exposed to DA, and there was a trend toward increased average peak amplitude. The asterisk indicates a significant difference in a t test of control neurons compared with a separate group of neurons exposed to DA. D, Similar to nucleated patch recordings of INa, there was a shift in the activation of Na+ channels in neurons exposed to DA (gray).
Dendritic participation in modulation
Excitatory inputs predominantly synapse on spines in the dendrites of cortical pyramidal neurons. Dopaminergic modulation in the dendrites may be a means to potently modify synaptic integration. To gain preliminary insight into whether DA modulates dendritic signal propagation, calcium imaging of the apical dendrite was performed. A train of five APs (20–50 Hz) was evoked using either antidromic stimulation or five brief (2–5 ms) suprathreshold current injections, each evoking a single AP. The change in fluorescence normalized by baseline fluorescence (ΔF/F) was measured over the length of the dendrite (see Materials and Methods) (Fig. 7A). This train of APs evoked a submaximal calcium response; more APs, or higher-frequency stimulation, evoked a greater response. As observed in other regions, there was a fairly steep decrement in the amplitude of the calcium signal as a function of distance from the soma (Fig. 7B). Application of DA enhanced the peak calcium signal at all dendritic regions examined (Fig. 7A,B) (n = 21; F = 64.1; p < 0.001, repeated-measures ANOVA), including apical branches. Furthermore, the percentage change in the calcium signal after DA increased as a function of distance from the soma (Fig. 7B). This provides preliminary evidence that DA modulates signal propagation in the dendrites. If the effects of DA were limited to the soma, one would expect that the absolute amplitude of the changes induced by DA would decrement as a function of the amplitude of the signal (or in this case, the distance of the signal from the soma). However, this was not observed. The relatively greater effect of DA as a function of distance implies that this effect is unlikely to be entirely accounted by somatic changes. Similar to DAergic enhancement of EPSP summation, the effects of DA were mimicked by the DA D2 agonist quinpirole (Fig. 7C) (n = 6; F = 158.6; p < 0.001, repeated-measures ANOVA). The DA D1 agonist SKF81297 exerted the opposite action (Fig. 7) (n = 6; F = 61.0; p < 0.01, repeated-measures ANOVA).
Figure 7.

DA increases backpropagation of signals into dendrites. A, Calcium imaging of the backpropagation of APs was used as an initial index of dendritic signal propagation. DA enhanced this signal along the apical dendrite. Line trace color corresponds to the color of the box at a location on the dendrite. B, DA increased the amplitude of the signal along the entire extent of the apical dendrite examined. The effectiveness of DA on dendritic signals (percentage change) was greater at dendritic sites further from the soma (right). C, Similar to the effects of DA on EPSPs summation and INa, the effects of DA on the dendritic signal was mimicked by the DA D2 agonist quinpirole (10 μm), whereas the opposite effect was seen after application of the DA D1 agonist SKF81297 (10 μm).
Direct dendritic electrophysiological recordings of the backpropagating AP (bAP; 200–300 μm from the soma) (Fig. 8A) indicate that the enhancement of the calcium signal after application of DA can be explained by enhancement of the amplitude of the bAP (Fig. 8B) (baseline, 46.6 ± 4.1 mV; post-DA, 58.3 ± 4.4 mV; n = 11; t = 2.73; p < 0.05, paired t test). The percentage change of the dendritic bAP was greater than the percentage change of the somatic AP observed above (7.7 vs 25.1%).
Figure 8.
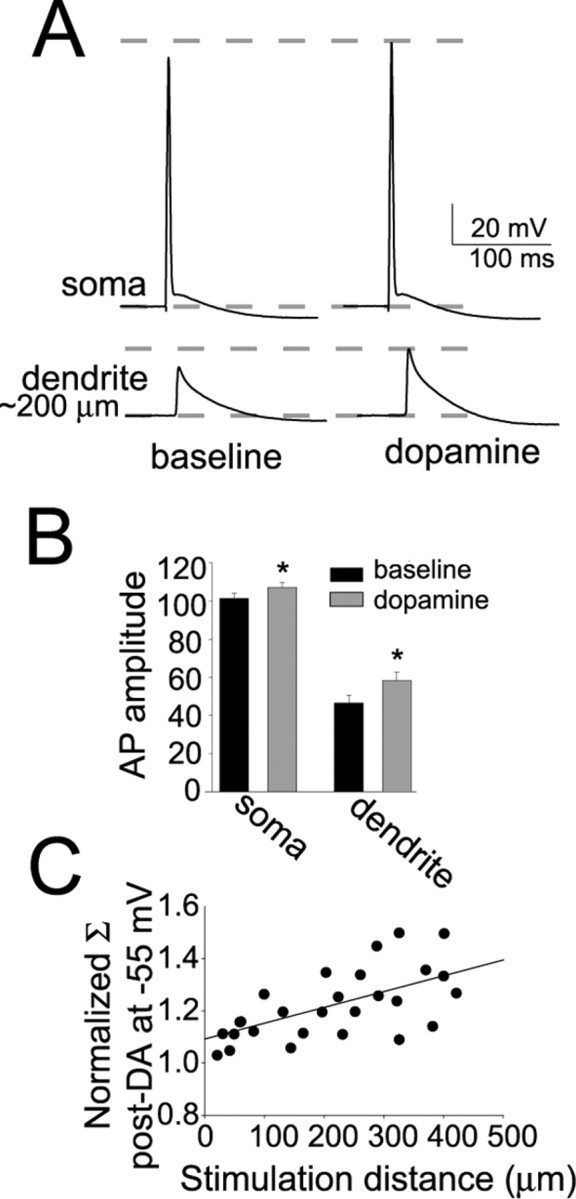
DA increases the amplitude of antidromic bAPs. A, The amplitude of bAPs recorded in the dendrite 150–300 μm from the soma was increased by DA (right; in this example the bAP was recorded ∼200 μm from the soma). Top traces are recordings from the soma, and bottom traces are recordings from the apical dendrite. B, Plots of group data indicate that a significant increase in the amplitude of antidromic APs was observed in the soma and dendrites after DA. Similar to the calcium signal, the percentage change of the dendritic AP was greater than the change in the somatic AP. *p < 0.05, significant difference with a paired t test comparison between baseline and DA conditions. C, Inputs of varying distances from the soma were activated by varying the distance of the stimulation electrode from the soma, along the apical dendrite. Summation of five EPSPs after DA was normalized to baseline summation (see Results). DA had a greater impact on summation of EPSPs that were evoked more distally. Σ indicates summation.
Although these data indicate that DA may facilitate dendritic signal propagation, modulation of subthreshold events that initiate in the dendrites are more relevant to the experiments above. To gain preliminary indication of whether DAergic modulation of dendrites contributes to its effects on EPSP summation, summation of EPSPs was examined as a function of the distance of the local stimulation electrode from the soma. When the distance of the stimulation electrode along the apical dendrite was varied, it was found that the effect of DA was greatest when the stimulation electrode was farther from the soma (Fig. 8C) (r2 = 0.71; p < 0.05; for the relationship between the stimulation electrode distance and the normalized effect of DA on summation at −55 mV; this was quantified as the amplitude of summation after DA divided by the amplitude of summation before DA). This is preliminary evidence that the dendrites are involved in the modulatory effect of DA on EPSP summation.
To more directly examine a role of dendrites in EPSP modulation, the calcium signal evoked by local synaptic stimulation was examined. As above, train stimulation (five stimuli at 20 or 50 Hz) evoked EPSPs that could be measured electrically at the soma. In some instances, a calcium signal could be detected at a dendritic site in the vicinity of the stimulation electrode when the intensity of the stimulus trains was increased to evoke larger EPSPs (mean amplitude, 7.1 ± 1.2 mV; n = 9). This calcium signal could only be detected within 10–15 μm of the peak calcium signal at the apical dendritic trunk (Fig. 9A). Application of DA had no significant effect on the peak calcium signal evoked by subthreshold synaptic stimulation but increased the spread of the calcium signal further from the site of the peak response (Fig. 9B) [measured as the width of the Gaussian fit to the data (√2) times the SD of the peak; baseline, 3.58 ± 0.25; post-DA, 5.36 ± 0.33; n = 9; t = 2.57; p < 0.05, paired t test]. This indicates that DA may facilitate propagation of signals that originate in the dendrite without contribution from the soma.
Figure 9.
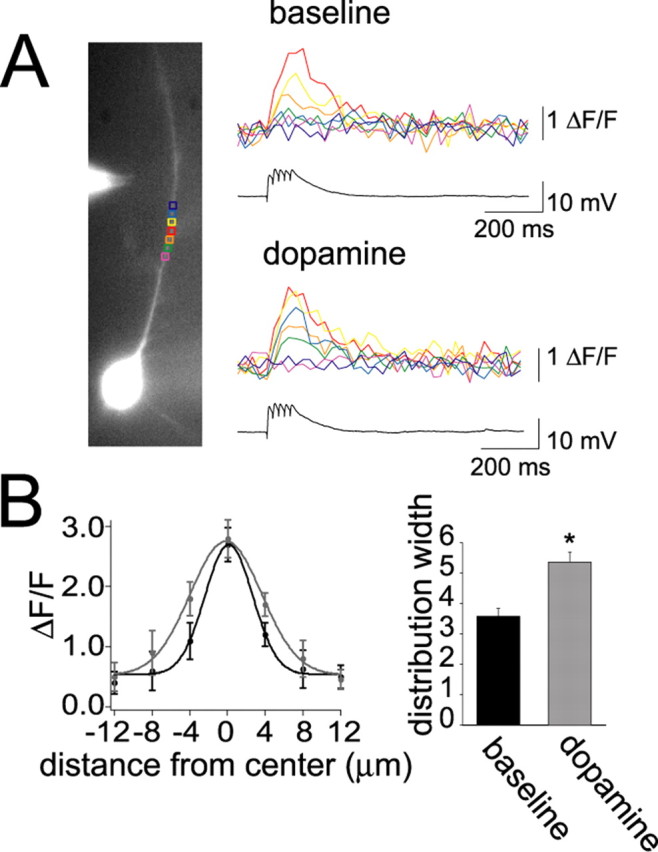
DA enhances orthograde propagation of dendritic signals. A, In some neurons, a synaptically evoked calcium signal was observed in a discrete region. Application of DA increased the signal along some parts of this region (e.g., compare green or blue traces between baseline and DA conditions). B, To quantify the spread of this signal, the location of the peak signal was found, and the signal was measured at this dendritic site and at regions on either side of this site, in increments of 4 μm regions of interest. The spread of the signal can be plotted as the change in fluorescence as a function of distance from the site of the peak signal. From this plot, it can be seen that DA (gray) does not significantly increase the peak signal but increases the amplitude of the signal on either side of the peak, indicative of increased spread of EPSP-evoked depolarization. This can be quantified as a significant increase in the width of the distribution. *p < 0.05, significant difference with a paired t test comparison between baseline and DA conditions.
To further examine dendritic modulation by DA and the role of Na+ channels in this modulation, synaptic stimulation was performed distal to the soma (>400 μm) while DA (50 μm) or TTX (1 μm) was puffed near the soma or the dendrite (150–200 μm from the soma). Puff application of solution alone had only transient or no effects. Puff application of DA near the dendrite was sufficient to enhance the summation of EPSPs (Fig. 10A) (baseline, 1.8 ± 0.2; immediately after puffing at dendrite, 2.8 ± 0.25; n = 7; t = 3.23; p < 0.05, paired t test), likely by prolongation of the decay time constant (Fig. 10A) (baseline, 77 ± 3.7 ms; after dendritic puff, 86.0 ± 3.7 ms; n = 7; t = 2.61; p < 0.05, paired t test). This effect was greater than puffing of DA near the soma (EPSP summation: baseline, 1.9 ± 0.18; after somatic puff, 2.37 ± 0.21; n = 7; t = 2.94; p < 0.05, paired t test; EPSP decay time: baseline, 73 ± 3.7 ms; after somatic puff, 80 ± 3.3 ms; n = 7; t = 2.56; p < 0.05, paired t test). In a separate group of neurons, this effect was blocked by preapplication of the DA D2 antagonist sulpiride in the bath (5 μm; n = 4; data not shown).
Figure 10.
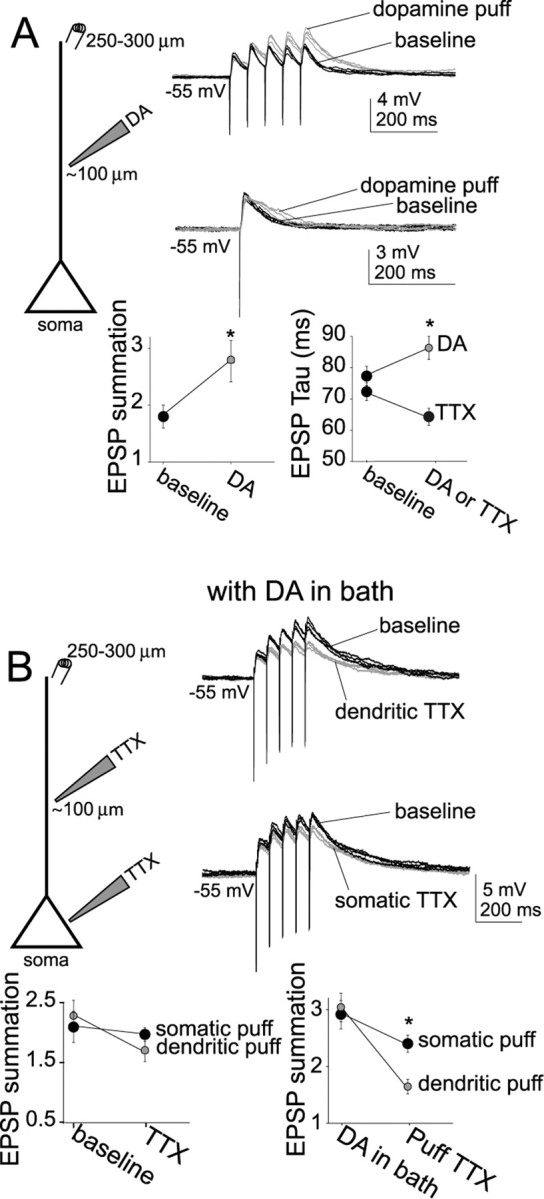
Direct puff application of DA to dendrites is sufficient to mimic the actions of DA. A, Puff application of DA (gray traces) to the dendrite was sufficient to mimic the effects of bath application of DA on EPSP summation (top) and decay time (bottom). B, At a depolarized membrane potential (−55 mV), with DA (10 μm) in the bath, dendritic TTX puff application (top traces) was more effective in reversing the actions of DA on EPSP summation than somatic puff (bottom traces). However, in baseline conditions without DA, dendritic puff application of TTX exerted only a slightly greater effect on EPSP summation than somatic puff application in baseline conditions (left plot). Puffing pipettes were placed ∼100 μm from the soma, whereas stimulating electrodes were placed 250–300 μm from the soma. Black traces represent baseline conditions, and gray traces are after puff application. *p < 0.05, significant difference with a paired t test between baseline conditions and after puff application of drug.
Puff application of TTX at the dendrites or the soma diminished the enhancement of EPSP summation usually observed after membrane depolarization (Fig. 10B) (dendritic puff: baseline EPSP summation at −55 mV, 2.26 ± 0.17; post-TTX puff, 1.72 ± 0.13; n = 7; t = −2.66; p < 0.05, paired t test; somatic puff: baseline, 2.10 ± 0.19; post-TTX puff, 1.88 ± 0.18; n = 7; t = −2.47; p < 0.05, paired t test). However, puff application of TTX to the dendrite was much more efficient at reversing the effect of bath application of DA on summation of distally evoked EPSPs (Fig. 10B) (−55 mV; somatic puff: baseline, 2.39 ± 0.20; post-DA summation, 2.97 ± 0.16; somatic TTX, 2.31 ± 0.17; n = 6; change of −1.07 ± 0.09; dendritic puff: baseline, 2.21 ± 0.18; post-DA summation, 3.06 ± 0.19; dendritic TTX, 1.73 ± 0.13; n = 6; change of −1.53 ± 0.11; t = 3.24; p < 0.01, unpaired t test between somatic and dendritic change).
If DA does modulate the dendrites and this modulation contributes to the enhancement of EPSP summation, one would postulate that signals that must propagate down the dendrite should be modulated to a greater degree than signals that do not. This was directly examined with dual patch recordings from the soma and dendrite (∼200–250 μm from the soma). A train of αPSCs was injected through the dendritic electrode, and the voltage response was measured at the dendrite and soma. Similar to somatic recordings during somatic αPSC injection (as above and replicated in this experiment), DA enhanced αPSP summation recorded at the dendritic site in response to dendritic αPSCs when depolarized to −55 mV (Fig. 11) (baseline, 1.96 ± 0.20; post-DA, 2.52 ± 0.24; n = 5; t = 2.88; p < 0.05, paired t test). However, the effect of DA on αPSP summation was much greater for αPSCs that had to travel down the dendrite (i.e., those that were injected at the dendrite and recorded at the soma) (Fig. 11) (baseline, 2.46 ± 0.14; post-DA, 3.6 ± 0.23; n = 5; t = 3.12; p < 0.05, paired t test). These data demonstrate that dendrites participate in DAergic modulation of synaptic integration.
Figure 11.

DA has a greater impact on integration of signals that propagate down the dendrite compared with local signals. A, Dual recordings of the dendrite and soma of neurons were performed to examine propagation of αPSPs from the dendrite to the soma. αPSPs injected into the dendrite and recorded in the dendrite display similar features as αPSPs injected to the soma and recorded in the soma (see Fig. 3): the summation at depolarized membrane potentials is greater, and DA enhanced summation at depolarized membrane potentials. However, when examining αPSPs initiated in the dendrite while recording at the soma, the effect of DA on summation is significantly greater. B, The effect of DA on αPSPs that travel to the soma from the dendrite is much greater, indicating that DA facilitates signals that must travel down the dendrite. This figure depicts recordings at the soma and the apical dendrite, ∼200 μm from the soma. Black traces represent baseline conditions, and gray traces represent DA conditions. *p < 0.05, significant difference in a paired t test comparison between baseline and DA conditions.
Discussion
Consolidation of some affective behaviors that depend on the amygdala can be enhanced by DA in the EC, perhaps by modulation of amygdala inputs to the EC. Here we demonstrate that DA can enhance integration of synaptic inputs from the LAT. This effect of DA is state dependent and will only occur for inputs that arrive when the neuron is depolarized. If not depolarized, integration of inputs will be unaffected or suppressed by DA. In testing the mechanism for this state dependency, we found that DA prolongs the decay of EPSPs at depolarized membrane potentials. Functionally, the time window for integration of these inputs is prolonged by DA, and EPSPs summate more readily, bringing the neuron closer to AP threshold. In contrast, near Vrest DA shortens the window of integration. The state dependency of this effect arises through modulation of two types of ion channels. Specifically, D1-mediated enhancement of h-channel activity suppresses integration near Vrest (Fig. 3) (Rosenkranz and Johnston, 2006), whereas D2-mediated enhancement of Na+ channel activity enhances integration at depolarized membrane potentials (Fig. 12). Consistent with this, the DAergic effect at depolarized membrane potentials is blocked by TTX but not other ion channel blockers. Furthermore, DA increases the amplitude and rise rate of antidromic APs and enhances INa activated in the voltage range of these effects. There were two changes of INa observed here: an increase in peak amplitude and a prolongation in the duration of the current. The prolongation of the duration may point to increased contribution of “persistent” Na+ channels or other change in the inactivation of these channels. In either instance, a greater contribution of INa to EPSP-induced membrane depolarization, and enhanced integration, should result. Although there is some evidence for a D2-mediated enhancement of EPSP integration (Wang and Goldman-Rakic, 2004) and Na+ channel activity (Surmeier et al., 1992; Aizman et al., 2000), most previous studies have found that DA reduces INa (Cepeda et al., 1995; Geijo-Barrientos and Pastore, 1995) via activation of DA D1 receptors (Surmeier et al., 1992; Schiffmann et al., 1995; Cantrell et al., 1997; Maurice et al., 2001). Although a D1-mediated reduction in INa was also seen, the effect that predominated in current clamp mirrored the D2-mediated enhancement of INa observed here. It is unclear why DA exerts different actions in EC neurons. Perhaps it is related to a different balance of D1 and D2 receptors, differences in localization, or effectors that are linked to these receptors. However, it is possible that under different conditions, or if other parameters were examined, reduction in INa by DA D1 receptors would be more prominent. For instance, it may contribute to the D1-mediated reduction in excitability previously observed in the EC (Rosenkranz and Johnston, 2006). In addition, differences in slicing protocols, the final recording temperature, or differences in DAergic modulation because of age-related effects may also contribute to differences in results among laboratories.
Figure 12.

Summary of the effects of DA on synaptic integration. A, DA exerts two primary actions on summation of PSPs: (1) increase in summation (Σ) at depolarized membrane potentials (Vdepol) by enhancement of Na currents, and (2) reduction in summation near Vrest by enhancement of h-currents. B, Activation of DA D1 receptors reduced summation near Vrest by a pathway dependent on adenylyl cyclase and cAMP (Rosenkranz and Johnston, 2006). C, Activation of DA D2 receptors increased summation by a pathway dependent on PLC, internal Ca2+, and PP2B. Blockade of PKC exerted an opposing influence, consistent with a D2-mediated enhancement of summation through reduction in Na-channel phosphorylation (∼P), which increases Na-channel activity. This, however, does not rule out other ion channels or signaling molecules in the actions of DA. Our data indicate that these are the most prominent signaling cascades and ion channels involved in the DAergic actions under these conditions. In addition, although our data are consistent with D2-mediated modulation of dendritic excitability, it is possible that this does not occur via modulation of Na+ channels and does not rule out potential involvement of D1 receptors. Signaling molecules in bold lettering indicate evidence from the current study. Signaling molecules in italics represent evidence from a previous study (Rosenkranz and Johnston, 2006). Gray lettering indicates signaling molecules that are known to usually be in that signaling cascade but that were not examined in this study. AC, Adenylyl cyclase; PIP2, phosphatidylinositol 4,5-bisphosphate; IP3, inositol 1,4,5-trisphosphate; DAG, diacylglycerol; ER, endoplasmic reticulum.
The effects of DA in this study did not appear to be presynaptic, because DA exerted similar effects on αPSPs when synaptic inputs were blocked and minimal effects on paired-pulse facilitation. In fact, the effects of DA could be explained entirely by postsynaptic mechanisms. Studies have indicated that DA can modulate dendritic excitability in other neurons (Hoffman and Johnston, 1999; Gentet and Williams, 2007). Some DA receptors are found on dendritic shafts and spines in other cortical regions where examined (Smiley et al., 1994; Negyessy and Goldman-Rakic, 2005). In the monkey EC, DA terminals are in apposition to dendritic shafts and spines (Erickson et al., 2000). Persistent Na+ channel activity is observed in EC layer V pyramidal neurons and can greatly impact neuronal function (Agrawal et al., 2001). The presence of Na+ channels in dendrites has been demonstrated in the EC and other regions (Huguenard et al., 1989; Stuart and Sakmann, 1994; Magee and Johnston, 1995b; Magistretti et al., 1999), and serotonergic modulation of dendritic Na+ channels can impact bAP propagation (Carr et al., 2002). Modulation of the apical dendrite likely plays a role in the DAergic effects on synaptic integration observed here. Thus, the effects of DA were greater when inputs further out along the dendrite were stimulated and were more closely mimicked by dendritic application of DA, and forward propagation and backpropagation of dendritic signals were enhanced by DA. The DAergic enhancement of Na+ channel activity and dendritic integration may result in a boosting of dendritic inputs (Magee and Johnston, 1995a; Lipowsky et al., 1996; Urban et al., 1998; Gonzalez-Burgos and Barrionuevo, 2001) or a shift in the balance of the influence of inputs, allowing a greater influence of more distal inputs when the dendrite is depolarized. This may overcome the dampening effects of other voltage-activated conductances. However, one previous study did not find an effect of DA on dendritic bAPs in the prefrontal cortex, as measured through calcium imaging and direct electrophysiological recordings, although differences in dendritic input resistance and excitability were seen (Gulledge and Stuart, 2003). This study examined neurons in a different region, using a different calcium-sensitive dye, which may account for some differences.
Although D2-mediated DAergic modulation of Na+ channels appears to enhance integration of synaptic inputs, DA also modulates other ion channels and activates other DA receptors in theses neurons (Rosenkranz and Johnston, 2006). It is likely that modulation of other ion channels and activation of D1 receptors contributes to the effects of DA on dendritic signal propagation (Hoffman and Johnston, 1999). Furthermore, although modulation of amygdala inputs was seen, this effect is not likely to be specific for inputs from the amygdala. Thus, DA exerted similar effects on synaptic inputs evoked by local stimulation, which likely activates inputs that originate in the amygdala, hippocampus, neighboring EC neurons, and other regions.
A previous study demonstrated a reduction in the amplitude of EPSPs in layer V neurons after application of DA (Pralong and Jones, 1993). The greatest effect in that study was on the NMDA component. Our data do not necessarily contradict, because our current study purposely eliminated NMDA components, the voltage dependence of which would confound the examination of voltage-dependent modulation of signals, and we previously demonstrated that DA may enhance h-channel activity (Rosenkranz and Johnston, 2006), which may suppress AMPA EPSPs near Vrest.
The signaling cascade used by DA in these neurons appears to be atypical. It is well documented that PKA and PKC can suppress INa (Cantrell et al., 1996, 2002; Chen et al., 2005; Hourez et al., 2005) (but see Astman et al., 1998; Franceschetti et al., 2000), so blockade of PKC is expected to enhance PSP summation at depolarized membrane potentials, whereas forskolin is expected to reduce PSP summation. D2 receptors may be linked to a reduction in PKC activity in these neurons, as observed in other regions (Giambalvo and Wagner, 1994). However, from our results, it is more likely the effects of D2 receptor activation on PSP summation is mediated by a change in PP2B activity. Thus, inhibition of PLC or buffering internal [Ca2+] blocked the effect of quinpirole (as did PP2B inhibition) but did not mimic the effects of PKC inhibition. A similar cascade has been seen to result in a D2-mediated reduction in L-type Ca2+ current (Hernandez-Lopez et al., 2000) and enhancement of INa; however, that was dependent on PKA and not PLC (Hu et al., 2005). Interestingly, inhibition of PP2A/PP1 also reduced the effects of quinpirole. In concert with the effects of PKA inhibition, this may indicate a role for DARPP-32 (dopamine- and cyclic adenosine 3′-5′-monophosphate-regulated phosphoprotein, 32 kDa) (Perez and Lewis, 1992; Nishi et al., 1997). Several potential reasons exist for signaling differences in this study, such as differences in the second-messenger localization or G-proteins that are linked to D2 receptors.
Although the capability for voltage-dependent modulation is interesting, it is important that the conditions necessary for a facilitatory action of DA can occur, such as when synaptic inputs coincide. In addition, EC neurons transition between bistable membrane states, including a depolarized “up state” (Isomura et al., 2006; Rosenkranz and Grace, unpublished observation). Voltage-dependent modulation by DA has been observed in several systems (Cantrell et al., 1999; Gorelova and Yang, 2000; Nicola et al., 2000; Lavin and Grace, 2001; Perez et al., 2006), with a hypothesized outcome of enhancement of some functions, such as gain of contrast in the neuronal response (Sawaguchi et al., 1990; Durstewitz et al., 2000; Nicola et al., 2004). The novelty found in this study is the enhanced contrast imposed by modulation of ion channels that exert opposite actions at different membrane potentials.
Behaviorally, it has been observed that DA in the EC enhances consolidation of some amygdala-dependent behaviors. This study provides a mechanism whereby DA can enhance the integration of inputs from the amygdala, but only at appropriate times. The functional consequence of this is expected to be a boosting of the impact of affect-related information on EC-dependent memory processes. However, it is expected that if DA levels are abnormally elevated, as may occur after drugs of abuse, the impact of amygdala inputs will be abnormally facilitated, and affect may gain an inappropriately large influence over ongoing memory processes.
Footnotes
This work was supported by the Wodecroft Foundation, NARSAD, National Institutes of Health (NIH) Grant MH48432 (D.J.), and NIH Kirschstein Award MH67460 (J.A.R.). We thank Drs. Randy Chitwood and Xixi Chen for their advice with experiments and analysis and Dr. Rick Gray for the acquisition and analysis Igor programs.
References
- Agrawal N, Hamam BN, Magistretti J, Alonso A, Ragsdale DS. Persistent sodium channel activity mediates subthreshold membrane potential oscillations and low-threshold spikes in rat entorhinal cortex layer V neurons. Neuroscience. 2001;102:53–64. doi: 10.1016/s0306-4522(00)00455-3. [DOI] [PubMed] [Google Scholar]
- Aizman O, Brismar H, Uhlen P, Zettergren E, Levey AI, Forssberg H, Greengard P, Aperia A. Anatomical and physiological evidence for D1 and D2 dopamine receptor colocalization in neostriatal neurons. Nat Neurosci. 2000;3:226–230. doi: 10.1038/72929. [DOI] [PubMed] [Google Scholar]
- Akil M, Edgar CL, Pierri JN, Casali S, Lewis DA. Decreased density of tyrosine hydroxylase-immunoreactive axons in the entorhinal cortex of schizophrenic subjects. Biol Psychiatry. 2000;47:361–370. doi: 10.1016/s0006-3223(99)00282-6. [DOI] [PubMed] [Google Scholar]
- Arnold SE, Hyman BT, Van Hoesen GW, Damasio AR. Some cytoarchitectural abnormalities of the entorhinal cortex in schizophrenia. Arch Gen Psychiatry. 1991;48:625–632. doi: 10.1001/archpsyc.1991.01810310043008. [DOI] [PubMed] [Google Scholar]
- Astman N, Gutnick MJ, Fleidervish IA. Activation of protein kinase C increases neuronal excitability by regulating persistent Na+ current in mouse neocortical slices. J Neurophysiol. 1998;80:1547–1551. doi: 10.1152/jn.1998.80.3.1547. [DOI] [PubMed] [Google Scholar]
- Barros DM, Mello e Souza T, De David T, Choi H, Aguzzoli A, Madche C, Ardenghi P, Medina JH, Izquierdo I. Simultaneous modulation of retrieval by dopaminergic D(1), beta-noradrenergic, serotonergic-1A and cholinergic muscarinic receptors in cortical structures of the rat. Behav Brain Res. 2001;124:1–7. doi: 10.1016/s0166-4328(01)00208-x. [DOI] [PubMed] [Google Scholar]
- Baxter MG, Murray EA. Opposite relationship of hippocampal and rhinal cortex damage to delayed nonmatching-to-sample deficits in monkeys. Hippocampus. 2001;11:61–71. doi: 10.1002/1098-1063(2001)11:1<61::AID-HIPO1021>3.0.CO;2-Z. [DOI] [PubMed] [Google Scholar]
- Buckmaster CA, Eichenbaum H, Amaral DG, Suzuki WA, Rapp PR. Entorhinal cortex lesions disrupt the relational organization of memory in monkeys. J Neurosci. 2004;24:9811–9825. doi: 10.1523/JNEUROSCI.1532-04.2004. [DOI] [PMC free article] [PubMed] [Google Scholar]
- Cantrell AR, Ma JY, Scheuer T, Catterall WA. Muscarinic modulation of sodium current by activation of protein kinase C in rat hippocampal neurons. Neuron. 1996;16:1019–1026. doi: 10.1016/s0896-6273(00)80125-7. [DOI] [PubMed] [Google Scholar]
- Cantrell AR, Smith RD, Goldin AL, Scheuer T, Catterall WA. Dopaminergic modulation of sodium current in hippocampal neurons via cAMP-dependent phosphorylation of specific sites in the sodium channel α-subunit. J Neurosci. 1997;17:7330–7338. doi: 10.1523/JNEUROSCI.17-19-07330.1997. [DOI] [PMC free article] [PubMed] [Google Scholar]
- Cantrell AR, Scheuer T, Catterall WA. Voltage-dependent neuromodulation of Na+ channels by D1-like dopamine receptors in rat hippocampal neurons. J Neurosci. 1999;19:5301–5310. doi: 10.1523/JNEUROSCI.19-13-05301.1999. [DOI] [PMC free article] [PubMed] [Google Scholar]
- Cantrell AR, Tibbs VC, Yu FH, Murphy BJ, Sharp EM, Qu Y, Catterall WA, Scheuer T. Molecular mechanism of convergent regulation of brain Na(+) channels by protein kinase C and protein kinase A anchored to AKAP-15. Mol Cell Neurosci. 2002;21:63–80. doi: 10.1006/mcne.2002.1162. [DOI] [PubMed] [Google Scholar]
- Carr DB, Cooper DC, Ulrich SL, Spruston N, Surmeier DJ. Serotonin receptor activation inhibits sodium current and dendritic excitability in prefrontal cortex via a PKC-dependent mechanism. J Neurosci. 2002;22:6846–6855. doi: 10.1523/JNEUROSCI.22-16-06846.2002. [DOI] [PMC free article] [PubMed] [Google Scholar]
- Caruana DA, Sorge RE, Stewart J, Chapman CA. Dopamine has bidirectional effects on synaptic responses to cortical inputs in layer II of the lateral entorhinal cortex. J Neurophysiol. 2006;96:3006–3015. doi: 10.1152/jn.00572.2006. [DOI] [PubMed] [Google Scholar]
- Cepeda C, Chandler SH, Shumate LW, Levine MS. Persistent Na+ conductance in medium-sized neostriatal neurons: characterization using infrared videomicroscopy and whole cell patch-clamp recordings. J Neurophysiol. 1995;74:1343–1348. doi: 10.1152/jn.1995.74.3.1343. [DOI] [PubMed] [Google Scholar]
- Chen Y, Cantrell AR, Messing RO, Scheuer T, Catterall WA. Specific modulation of Na+ channels in hippocampal neurons by protein kinase C epsilon. J Neurosci. 2005;25:507–513. doi: 10.1523/JNEUROSCI.4089-04.2005. [DOI] [PMC free article] [PubMed] [Google Scholar]
- Coutureau E, Galani R, Gosselin O, Majchrzak M, Di Scala G. Entorhinal but not hippocampal or subicular lesions disrupt latent inhibition in rats. Neurobiol Learn Mem. 1999;72:143–157. doi: 10.1006/nlme.1998.3895. [DOI] [PubMed] [Google Scholar]
- Diop L, Gottberg E, Briere R, Grondin L, Reader TA. Distribution of dopamine D1 receptors in rat cortical areas, neostriatum, olfactory bulb and hippocampus in relation to endogenous dopamine contents. Synapse. 1988;2:395–405. doi: 10.1002/syn.890020406. [DOI] [PubMed] [Google Scholar]
- Durstewitz D, Seamans JK, Sejnowski TJ. Dopamine-mediated stabilization of delay-period activity in a network model of prefrontal cortex. J Neurophysiol. 2000;83:1733–1750. doi: 10.1152/jn.2000.83.3.1733. [DOI] [PubMed] [Google Scholar]
- Erickson SL, Sesack SR, Lewis DA. Dopamine innervation of monkey entorhinal cortex: postsynaptic targets of tyrosine hydroxylase-immunoreactive terminals. Synapse. 2000;36:47–56. doi: 10.1002/(SICI)1098-2396(200004)36:1<47::AID-SYN5>3.0.CO;2-O. [DOI] [PubMed] [Google Scholar]
- Falkai P, Bogerts B, Rozumek M. Limbic pathology in schizophrenia: the entorhinal region–a morphometric study. Biol Psychiatry. 1988;24:515–521. doi: 10.1016/0006-3223(88)90162-x. [DOI] [PubMed] [Google Scholar]
- Ferbinteanu J, Holsinger RM, McDonald RJ. Lesions of the medial or lateral perforant path have different effects on hippocampal contributions to place learning and on fear conditioning to context. Behav Brain Res. 1999;101:65–84. doi: 10.1016/s0166-4328(98)00144-2. [DOI] [PubMed] [Google Scholar]
- Ferreira MB, Wolfman C, Walz R, Da Silva RC, Zanatta MS, Medina JH, Izquierdo I. NMDA-receptor-dependent, muscimol-sensitive role of the entorhinal cortex in post-training memory processing. Behav Pharmacol. 1992;3:387–391. [PubMed] [Google Scholar]
- Ferry B, Wirth S, Di Scala G. Functional interaction between entorhinal cortex and basolateral amygdala during trace conditioning of odor aversion in the rat. Behav Neurosci. 1999;113:118–125. doi: 10.1037//0735-7044.113.1.118. [DOI] [PubMed] [Google Scholar]
- Franceschetti S, Taverna S, Sancini G, Panzica F, Lombardi R, Avanzini G. Protein kinase C-dependent modulation of Na+ currents increases the excitability of rat neocortical pyramidal neurones. J Physiol (Lond) 2000;528:291–304. doi: 10.1111/j.1469-7793.2000.00291.x. [DOI] [PMC free article] [PubMed] [Google Scholar]
- Geijo-Barrientos E, Pastore C. The effects of dopamine on the subthreshold electrophysiological responses of rat prefrontal cortex neurons in vitro. Eur J Neurosci. 1995;7:358–366. doi: 10.1111/j.1460-9568.1995.tb00331.x. [DOI] [PubMed] [Google Scholar]
- Gentet LJ, Williams SR. Dopamine gates action potential backpropagation in midbrain dopaminergic neurons. J Neurosci. 2007;27:1892–1901. doi: 10.1523/JNEUROSCI.5234-06.2007. [DOI] [PMC free article] [PubMed] [Google Scholar]
- Giambalvo CT, Wagner RL. Activation of D1 and D2 dopamine receptors inhibits protein kinase C activity in striatal synaptoneurosomes. J Neurochem. 1994;63:169–176. doi: 10.1046/j.1471-4159.1994.63010169.x. [DOI] [PubMed] [Google Scholar]
- Goldsmith SK, Joyce JN. Dopamine D2 receptor expression in hippocampus and parahippocampal cortex of rat, cat, and human in relation to tyrosine hydroxylase-immunoreactive fibers. Hippocampus. 1994;4:354–373. doi: 10.1002/hipo.450040318. [DOI] [PubMed] [Google Scholar]
- Goldsmith SK, Shapiro RM, Joyce JN. Disrupted pattern of D2 dopamine receptors in the temporal lobe in schizophrenia. A postmortem study. Arch Gen Psychiatry. 1997;54:649–658. doi: 10.1001/archpsyc.1997.01830190077008. [DOI] [PubMed] [Google Scholar]
- Gonzalez-Burgos G, Barrionuevo G. Voltage-gated sodium channels shape subthreshold EPSPs in layer 5 pyramidal neurons from rat prefrontal cortex. J Neurophysiol. 2001;86:1671–1684. doi: 10.1152/jn.2001.86.4.1671. [DOI] [PubMed] [Google Scholar]
- Gorelova NA, Yang CR. Dopamine D1/D5 receptor activation modulates a persistent sodium current in rat prefrontal cortical neurons in vitro. J Neurophysiol. 2000;84:75–87. doi: 10.1152/jn.2000.84.1.75. [DOI] [PubMed] [Google Scholar]
- Gulledge AT, Stuart GJ. Action potential initiation and propagation in layer 5 pyramidal neurons of the rat prefrontal cortex: absence of dopamine modulation. J Neurosci. 2003;23:11363–11372. doi: 10.1523/JNEUROSCI.23-36-11363.2003. [DOI] [PMC free article] [PubMed] [Google Scholar]
- Hamam BN, Amaral DG, Alonso AA. Morphological and electrophysiological characteristics of layer V neurons of the rat lateral entorhinal cortex. J Comp Neurol. 2002;451:45–61. doi: 10.1002/cne.10335. [DOI] [PubMed] [Google Scholar]
- Hejl AM, Glenthoj B, Mackeprang T, Hemmingsen R, Waldemar G. Prepulse inhibition in patients with Alzheimer's disease. Neurobiol Aging. 2004;25:1045–1050. doi: 10.1016/j.neurobiolaging.2003.11.005. [DOI] [PubMed] [Google Scholar]
- Hernandez-Lopez S, Tkatch T, Perez-Garci E, Galarraga E, Bargas J, Hamm H, Surmeier DJ. D2 dopamine receptors in striatal medium spiny neurons reduce L-type Ca2+ currents and excitability via a novel PLCβ1–IP3–calcineurin-signaling cascade. J Neurosci. 2000;20:8987–8995. doi: 10.1523/JNEUROSCI.20-24-08987.2000. [DOI] [PMC free article] [PubMed] [Google Scholar]
- Hoffman DA, Johnston D. Neuromodulation of dendritic action potentials. J Neurophysiol. 1999;81:408–411. doi: 10.1152/jn.1999.81.1.408. [DOI] [PubMed] [Google Scholar]
- Hourez R, Azdad K, Vanwalleghem G, Roussel C, Gall D, Schiffmann SN. Activation of protein kinase C and inositol 1,4,5-triphosphate receptors antagonistically modulate voltage-gated sodium channels in striatal neurons. Brain Res. 2005;1059:189–196. doi: 10.1016/j.brainres.2005.08.031. [DOI] [PubMed] [Google Scholar]
- Hu XT, Dong Y, Zhang XF, White FJ. Dopamine D2 receptor-activated Ca2+ signaling modulates voltage-sensitive sodium currents in rat nucleus accumbens neurons. J Neurophysiol. 2005;93:1406–1417. doi: 10.1152/jn.00771.2004. [DOI] [PubMed] [Google Scholar]
- Huang Q, Zhou D, Chase K, Gusella JF, Aronin N, DiFiglia M. Immunohistochemical localization of the D1 dopamine receptor in rat brain reveals its axonal transport, pre- and postsynaptic localization, and prevalence in the basal ganglia, limbic system, and thalamic reticular nucleus. Proc Natl Acad Sci USA. 1992;89:11988–11992. doi: 10.1073/pnas.89.24.11988. [DOI] [PMC free article] [PubMed] [Google Scholar]
- Huguenard JR, Hamill OP, Prince DA. Sodium channels in dendrites of rat cortical pyramidal neurons. Proc Natl Acad Sci USA. 1989;86:2473–2477. doi: 10.1073/pnas.86.7.2473. [DOI] [PMC free article] [PubMed] [Google Scholar]
- Hyman BT, Van Hoesen GW, Damasio AR, Barnes CL. Alzheimer's disease: cell-specific pathology isolates the hippocampal formation. Science. 1984;225:1168–1170. doi: 10.1126/science.6474172. [DOI] [PubMed] [Google Scholar]
- Isomura Y, Sirota A, Ozen S, Montgomery S, Mizuseki K, Henze DA, Buzsaki G. Integration and segregation of activity in entorhinal-hippocampal subregions by neocortical slow oscillations. Neuron. 2006;52:871–882. doi: 10.1016/j.neuron.2006.10.023. [DOI] [PubMed] [Google Scholar]
- Izquierdo I, Medina JH, Izquierdo LA, Barros DM, de Souza MM, Mello e Souza T. Short- and long-term memory are differentially regulated by monoaminergic systems in the rat brain. Neurobiol Learn Mem. 1998;69:219–224. doi: 10.1006/nlme.1998.3825. [DOI] [PubMed] [Google Scholar]
- Krettek JE, Price JL. Projections from the amygdaloid complex and adjacent olfactory structures to the entorhinal cortex and to the subiculum in the rat and cat. J Comp Neurol. 1977;172:723–752. doi: 10.1002/cne.901720409. [DOI] [PubMed] [Google Scholar]
- Krimer LS, Herman MM, Saunders RC, Boyd JC, Hyde TM, Carter JM, Kleinman JE, Weinberger DR. A qualitative and quantitative analysis of the entorhinal cortex in schizophrenia. Cereb Cortex. 1997;7:732–739. doi: 10.1093/cercor/7.8.732. [DOI] [PubMed] [Google Scholar]
- Lahti RA, Roberts RC, Cochrane EV, Primus RJ, Gallager DW, Conley RR, Tamminga CA. Direct determination of dopamine D4 receptors in normal and schizophrenic postmortem brain tissue: a [3H]NGD-94–1 study. Mol Psychiatry. 1998;3:528–533. doi: 10.1038/sj.mp.4000423. [DOI] [PubMed] [Google Scholar]
- Lavin A, Grace AA. Stimulation of D1-type dopamine receptors enhances excitability in prefrontal cortical pyramidal neurons in a state-dependent manner. Neuroscience. 2001;104:335–346. doi: 10.1016/s0306-4522(01)00096-3. [DOI] [PubMed] [Google Scholar]
- Lipowsky R, Gillessen T, Alzheimer C. Dendritic Na+ channels amplify EPSPs in hippocampal CA1 pyramidal cells. J Neurophysiol. 1996;76:2181–2191. doi: 10.1152/jn.1996.76.4.2181. [DOI] [PubMed] [Google Scholar]
- Magee JC, Johnston D. Synaptic activation of voltage-gated channels in the dendrites of hippocampal pyramidal neurons. Science. 1995a;268:301–304. doi: 10.1126/science.7716525. [DOI] [PubMed] [Google Scholar]
- Magee JC, Johnston D. Characterization of single voltage-gated Na+ and Ca2+ channels in apical dendrites of rat CA1 pyramidal neurons. J Physiol (Lond) 1995b;487:67–90. doi: 10.1113/jphysiol.1995.sp020862. [DOI] [PMC free article] [PubMed] [Google Scholar]
- Magistretti J, Ragsdale DS, Alonso A. Direct demonstration of persistent Na+ channel activity in dendritic processes of mammalian cortical neurones. J Physiol (Lond) 1999;521:629–636. doi: 10.1111/j.1469-7793.1999.00629.x. [DOI] [PMC free article] [PubMed] [Google Scholar]
- Majak K, Pitkanen A. Activation of the amygdalo-entorhinal pathway in fear-conditioning in rat. Eur J Neurosci. 2003;18:1652–1659. doi: 10.1046/j.1460-9568.2003.02854.x. [DOI] [PubMed] [Google Scholar]
- Maren S, Fanselow MS. Electrolytic lesions of the fimbria/fornix, dorsal hippocampus, or entorhinal cortex produce anterograde deficits in contextual fear conditioning in rats. Neurobiol Learn Mem. 1997;67:142–149. doi: 10.1006/nlme.1996.3752. [DOI] [PubMed] [Google Scholar]
- Maurice N, Tkatch T, Meisler M, Sprunger LK, Surmeier DJ. D1/D5 dopamine receptor activation differentially modulates rapidly inactivating and persistent sodium currents in prefrontal cortex pyramidal neurons. J Neurosci. 2001;21:2268–2277. doi: 10.1523/JNEUROSCI.21-07-02268.2001. [DOI] [PMC free article] [PubMed] [Google Scholar]
- Negyessy L, Goldman-Rakic PS. Subcellular localization of the dopamine D2 receptor and coexistence with the calcium-binding protein neuronal calcium sensor-1 in the primate prefrontal cortex. J Comp Neurol. 2005;488:464–475. doi: 10.1002/cne.20601. [DOI] [PubMed] [Google Scholar]
- Neher E. Correction for liquid junction potentials in patch clamp experiments. Methods Enzymol. 1992;207:123–131. doi: 10.1016/0076-6879(92)07008-c. [DOI] [PubMed] [Google Scholar]
- Nicola SM, Surmeier J, Malenka RC. Dopaminergic modulation of neuronal excitability in the striatum and nucleus accumbens. Annu Rev Neurosci. 2000;23:185–215. doi: 10.1146/annurev.neuro.23.1.185. [DOI] [PubMed] [Google Scholar]
- Nicola SM, Woodward Hopf F, Hjelmstad GO. Contrast enhancement: a physiological effect of striatal dopamine? Cell Tissue Res. 2004;318:93–106. doi: 10.1007/s00441-004-0929-z. [DOI] [PubMed] [Google Scholar]
- Nishi A, Snyder GL, Greengard P. Bidirectional regulation of DARPP-32 phosphorylation by dopamine. J Neurosci. 1997;17:8147–8155. doi: 10.1523/JNEUROSCI.17-21-08147.1997. [DOI] [PMC free article] [PubMed] [Google Scholar]
- Otto T, Schottler F, Staubli U, Eichenbaum H, Lynch G. Hippocampus and olfactory discrimination learning: effects of entorhinal cortex lesions on olfactory learning and memory in a successive-cue, go-no-go task. Behav Neurosci. 1991;105:111–119. doi: 10.1037//0735-7044.105.1.111. [DOI] [PubMed] [Google Scholar]
- Perez MF, White FJ, Hu XT. Dopamine D(2) receptor modulation of K(+) channel activity regulates excitability of nucleus accumbens neurons at different membrane potentials. J Neurophysiol. 2006;96:2217–2228. doi: 10.1152/jn.00254.2006. [DOI] [PubMed] [Google Scholar]
- Perez RG, Lewis RM. Regional distribution of DARPP-32 (dopamine- and adenosine 3′,5′-monophosphate-regulated phosphoprotein of Mr = 32,000) mRNA in mouse brain. J Comp Neurol. 1992;318:304–315. doi: 10.1002/cne.903180307. [DOI] [PubMed] [Google Scholar]
- Pikkarainen M, Ronkko S, Savander V, Insausti R, Pitkanen A. Projections from the lateral, basal, and accessory basal nuclei of the amygdala to the hippocampal formation in rat. J Comp Neurol. 1999;403:229–260. [PubMed] [Google Scholar]
- Pralong E, Jones RS. Interactions of dopamine with glutamate- and GABA-mediated synaptic transmission in the rat entorhinal cortex in vitro. Eur J Neurosci. 1993;5:760–767. doi: 10.1111/j.1460-9568.1993.tb00540.x. [DOI] [PubMed] [Google Scholar]
- Prasad KM, Patel AR, Muddasani S, Sweeney J, Keshavan MS. The entorhinal cortex in first-episode psychotic disorders: a structural magnetic resonance imaging study. Am J Psychiatry. 2004;161:1612–1619. doi: 10.1176/appi.ajp.161.9.1612. [DOI] [PubMed] [Google Scholar]
- Quillfeldt JA, Zanatta MS, Schmitz PK, Quevedo J, Schaeffer E, Lima JB, Medina JH, Izquierdo I. Different brain areas are involved in memory expression at different times from training. Neurobiol Learn Mem. 1996;66:97–101. doi: 10.1006/nlme.1996.0050. [DOI] [PubMed] [Google Scholar]
- Roesler R, Roozendaal B, McGaugh JL. Basolateral amygdala lesions block the memory-enhancing effect of 8-Br-cAMP infused into the entorhinal cortex of rats after training. Eur J Neurosci. 2002;15:905–910. doi: 10.1046/j.1460-9568.2002.01924.x. [DOI] [PubMed] [Google Scholar]
- Rosenkranz JA, Johnston D. Dopaminergic regulation of neuronal excitability through modulation of Ih in layer V entorhinal cortex. J Neurosci. 2006;26:3229–3244. doi: 10.1523/JNEUROSCI.4333-05.2006. [DOI] [PMC free article] [PubMed] [Google Scholar]
- Ryoo HL, Joyce JN. Loss of dopamine D2 receptors varies along the rostrocaudal axis of the hippocampal complex in Alzheimer's disease. J Comp Neurol. 1994;348:94–110. doi: 10.1002/cne.903480105. [DOI] [PubMed] [Google Scholar]
- Sawaguchi T, Matsumura M, Kubota K. Catecholaminergic effects on neuronal activity related to a delayed response task in monkey prefrontal cortex. J Neurophysiol. 1990;63:1385–1400. doi: 10.1152/jn.1990.63.6.1385. [DOI] [PubMed] [Google Scholar]
- Schiffmann SN, Lledo PM, Vincent JD. Dopamine D1 receptor modulates the voltage-gated sodium current in rat striatal neurones through a protein kinase A. J Physiol (Lond) 1995;483:95–107. doi: 10.1113/jphysiol.1995.sp020570. [DOI] [PMC free article] [PubMed] [Google Scholar]
- Smiley JF, Levey AI, Ciliax BJ, Goldman-Rakic PS. D1 dopamine receptor immunoreactivity in human and monkey cerebral cortex: predominant and extrasynaptic localization in dendritic spines. Proc Natl Acad Sci USA. 1994;91:5720–5724. doi: 10.1073/pnas.91.12.5720. [DOI] [PMC free article] [PubMed] [Google Scholar]
- Squire LR, Stark CE, Clark RE. The medial temporal lobe. Annu Rev Neurosci. 2004;27:279–306. doi: 10.1146/annurev.neuro.27.070203.144130. [DOI] [PubMed] [Google Scholar]
- Stuart GJ, Sakmann B. Active propagation of somatic action potentials into neocortical pyramidal cell dendrites. Nature. 1994;367:69–72. doi: 10.1038/367069a0. [DOI] [PubMed] [Google Scholar]
- Surmeier DJ, Eberwine J, Wilson CJ, Cao Y, Stefani A, Kitai ST. Dopamine receptor subtypes colocalize in rat striatonigral neurons. Proc Natl Acad Sci USA. 1992;89:10178–10182. doi: 10.1073/pnas.89.21.10178. [DOI] [PMC free article] [PubMed] [Google Scholar]
- Tarazi FI, Tomasini EC, Baldessarini RJ. Postnatal development of dopamine D4-like receptors in rat forebrain regions: comparison with D2-like receptors. Brain Res Dev Brain Res. 1998;110:227–233. doi: 10.1016/s0165-3806(98)00111-4. [DOI] [PubMed] [Google Scholar]
- Tarazi FI, Tomasini EC, Baldessarini RJ. Postnatal development of dopamine D1-like receptors in rat cortical and striatolimbic brain regions: an autoradiographic study. Dev Neurosci. 1999;21:43–49. doi: 10.1159/000017365. [DOI] [PubMed] [Google Scholar]
- Urban NN, Henze DA, Barrionuevo G. Amplification of perforant-path EPSPs in CA3 pyramidal cells by LVA calcium and sodium channels. J Neurophysiol. 1998;80:1558–1561. doi: 10.1152/jn.1998.80.3.1558. [DOI] [PubMed] [Google Scholar]
- von Bohlen und Halbach O, Albrecht D. Reciprocal connections of the hippocampal area CA1, the lateral nucleus of the amygdala and cortical areas in a combined horizontal slice preparation. Neurosci Res. 2002;44:91–100. doi: 10.1016/s0168-0102(02)00092-5. [DOI] [PubMed] [Google Scholar]
- Wang Y, Goldman-Rakic PS. D2 receptor regulation of synaptic burst firing in prefrontal cortical pyramidal neurons. Proc Natl Acad Sci USA. 2004;101:5093–5098. doi: 10.1073/pnas.0400954101. [DOI] [PMC free article] [PubMed] [Google Scholar]
- Weiner DM, Levey AI, Sunahara RK, Niznik HB, O'Dowd BF, Seeman P, Brann MR. D1 and D2 dopamine receptor mRNA in rat brain. Proc Natl Acad Sci USA. 1991;88:1859–1863. doi: 10.1073/pnas.88.5.1859. [DOI] [PMC free article] [PubMed] [Google Scholar]
- Zola-Morgan S, Squire LR, Amaral DG. Human amnesia and the medial temporal region: enduring memory impairment following a bilateral lesion limited to field CA1 of the hippocampus. J Neurosci. 1986;6:2950–2967. doi: 10.1523/JNEUROSCI.06-10-02950.1986. [DOI] [PMC free article] [PubMed] [Google Scholar]