

Abstract
When synaptic vesicles fuse with the plasma membrane, they may completely collapse or fuse transiently. Transiently fusing vesicles remain structurally intact and therefore have been proposed to represent a form of rapid vesicle recycling. However, the impact of a transient synaptic vesicle fusion event on neurotransmitter release, and therefore on synaptic transmission, has yet to be determined. Recently, the molecular mechanism by which a serotonergic presynaptic G-protein-coupled receptor (GPCR) regulates synaptic vesicle fusion and inhibits synaptic transmission was identified. By making paired electrophysiological recordings in the presence and absence of low-affinity antagonists, we now demonstrate that activation of this presynaptic GPCR lowers the peak synaptic cleft glutamate concentration independently of the probability of vesicle fusion. Furthermore, this change in cleft glutamate concentration differentially inhibits synaptic NMDA and AMPA receptor-mediated currents. We conclude that a presynaptic GPCR regulates the profile of glutamate in the synaptic cleft through altering the mechanism of vesicle fusion leading to qualitative as well as quantitative changes in neural signaling.
Keywords: synaptic transmission, kiss-and-run, vesicle fusion, subquantal, kynurenate, serotonin, GPCR, l-AP-5, NMDA, AMPA, synaptic vesicle release
Introduction
Synaptic strength may be controlled presynaptically or postsynaptically, but the subcellular site of modulation has profound implications for information transfer in the synapse. Plasticity may arise from a change in vesicle fusion probability (Pr) at independent active zones (Hessler et al., 1993). This will alter the number of active synaptic sites in a pathway but not the glutamate concentration at each site. Alternatively, variations in concentration and time course of neurotransmitter in the synaptic cleft may mediate plasticity (Clements et al., 1992; Choi et al., 2000). Indeed, changes in synaptic cleft glutamate concentration may occur after manipulations in Pr either by multivesicular release (Tong and Jahr, 1994) or spillover (Asztely et al., 1997).
Increases in synaptic cleft glutamate concentration also occur independently of vesicle fusion Pr after long-term potentiation (Choi et al., 2000). In cultured hippocampal neurons, where the majority of vesicles retain their structure while transiently fusing (Aravanis et al., 2003; Gandhi and Stevens, 2003), the incidence of transient vesicle fusion events is reduced with increased stimulation frequency (Harata et al., 2006). Conversely, long-term depression reduces the rate of FM1-43 dye destaining from fusing vesicles independently of Pr (Zakharenko et al., 2002). These results are consistent with a shift to or from transient vesicle fusion (kiss-and-run) mediating synaptic plasticity, but it remains to be determined whether kiss-and-run fusion alters synaptic cleft glutamate concentrations (Krupa and Liu, 2004).
Recent studies of the lamprey reticulospinal synapse and PC12 cells reveal a molecular mechanism for inhibiting neurotransmitter release via presynaptic G-protein-coupled receptors (GPCRs). At the lamprey synapse, activation of presynaptic 5-HT1D/1B-like GPCRs inhibits synaptic transmission (Buchanan and Grillner, 1991; Schwartz et al., 2005) via Gβγ, acting downstream of Ca2+ entry (Blackmer et al., 2001; Takahashi et al., 2001) and targeting the vesicle fusion machinery late during fusion (Blackmer et al., 2005; Gerachshenko et al., 2005). In vitro, Gβγ directly interacts with proteins that mediate vesicle fusion in PC12 cells and the lamprey synapse (Jarvis et al., 2000; Blackmer et al., 2001). Direct inhibition of the release apparatus by Gβγ at the synapse opens the possibility that presynaptic GPCRs regulate synaptic efficacy by modifying vesicle fusion.
An intermediate dose of 5-hydroxytryptamine (5-HT; serotonin) completely blocks stimulus-evoked destaining of FM1-43 from fusing vesicles at reticulospinal synapses but only partially inhibits synaptic transmission (Photowala et al., 2006). This apparent contradiction may be resolved if 5-HT causes vesicles to undergo rapid fusion events in which lipophilic FM1-43 remains trapped in vesicles, but hydrophilic glutamate escapes through a transient fusion pore. Such a mechanism has been observed in chromaffin cells, where Gβγ modifies large dense-core vesicle fusion (Chen et al., 2005). Nevertheless, experimental validation that GPCRs regulate synaptic strength in this manner requires detection of a change in the peak synaptic cleft glutamate concentration during a GPCR-mediated shift in the vesicle fusion mode (Sullivan, 2006). We have used the low-affinity AMPA receptor antagonist kynurenate (Kyn) to directly monitor the peak synaptic cleft glutamate concentration before and during activation of 5-HT GPCRs or during manipulation of Pr.
Materials and Methods
The lamprey preparation.
Experiments were performed on isolated spinal cords of lampreys (Petromyzon marinus) anesthetized with tricaine methanesulfonate (MS222), decapitated in accordance with institutional guidelines, and dissected in a cold saline solution (Ringer's) of the following composition (in mm): 105 NaCl, 2.1 KCl, 2.6 CaCl2, 1.8 MgCl2, 4 glucose, and 5 HEPES adjusted to pH 7.6 with NaOH and bubbled with air (Cochilla and Alford, 1998). The spinal cord (12–20 segments) was isolated and removed from the meninx primitiva and placed in a cooled 1 ml Sylgard-lined chamber. The recording chamber was superfused continually with cold oxygenated Ringer's solution (8–10°C) or solutions of pharmacological agents bath applied at a perfusion rate of ∼1 ml/min. In experiments involving whole-cell patch recording, a 10–20 μm slice of tissue was removed from the surface of the spinal cord superior to the ventral horn using a vibrotome tissue slicer. Patch pipettes were then readily introduced to the cut ventral surface.
Electrophysiology.
Ventral horn neurons (motoneurons or interneurons) were whole-cell clamped (with an Axopatch 200A amplifier; Molecular Devices, Union City, CA) using a modified blind technique (Cochilla and Alford, 1997). The patch pipette solution contained (in mm) 102.5 cesium methane sulfonate, 1 NaCl, 1 MgCl2, 5 EGTA, and 5 HEPES, pH adjusted to 7.2 with CsOH. The microelectrode pipette solution was either 3 m potassium methane sulfonate or 3 m potassium acetate. Cell types were identified by their location in the tissue, and neurons were distinguished from the non-neuronal cells and axons by their membrane properties and their capacitive transient in response to a 10 ms, 10 mV step. Paired recordings were made between presynaptic reticulospinal axons and postsynaptic spinal neurons, and action potentials were evoked in the presynaptic axons at 15 s intervals. Pipettes had open-tip resistances of 5–10 MΩ. Series resistance was monitored continuously by giving a 10 mV voltage step before each episode, and if the change exceeded 10%, the cell was discarded. The order of drug application was reversed in at least 40% of experiments, and no rundown effects were observed with any of the drugs used. Microelectrode (sharp) recordings were made conventionally with thin-walled glass. Tip resistances of 20–50 MΩ when filled with 3 m potassium methane sulfonate allowed recording from presynaptic axons.
Data analysis.
For paired recordings, the mean was taken of at least 12 traces of EPSCs for each condition for each animal. For biphasic ESPCs, the decay of the electrical component was estimated by fitting an exponential to the visible portion of the electrical component. The validity of the fit was confirmed for synaptic responses in which the entire chemical component was blocked. The fit was then subtracted from the entire EPSC, leaving the chemical component to determine the peak amplitude. EPSC amplitudes measured were the difference between the current immediately before the stimulus and at the EPSC peak.
Data are given as means ± SEM. Student's paired two-tailed t test was used to calculate the significance of the data, unless noted otherwise.
Electrophysiological recordings of spontaneous miniature EPSCs (mEPSCs) were digitized at 5 kHz and low-pass filtered at 1 kHz. This filtering did not affect the peak amplitude of the events. Frequency and amplitude analysis of mEPSCs was performed using Igor Pro software (Wavemetrics, Lake Oswego, OR). A macro was written that automated the detection and extraction of mEPSCs, returning the time of occurrence and the amplitude. Raw data traces were smoothed with a ±2 ms box filter and differentiated. This technique corrected for any DC shift in baseline. A threshold level was manually determined for the control data set, and this threshold was maintained for all files taken from a given cell. All events that crossed the threshold were detected, and local minima (maximum inward current) were searched for within a window of 2 ms before and 10 ms after the detected event. This data set was mapped back onto the raw data for the visual comparison of detected events with mEPSCs. Cumulative histograms were constructed, and a two-population Kolmogorov–Smirnov goodness-of-fit test reduced to a modified χ2 variable (Hays, 1988) was used to determine statistical significance between control and Mg2+-free conditions [the algorithm runs as a macro under Igor Pro and is available from our website (http://alford.bios.uic.edu/Research/software.html)].
Imaging.
Confocal imaging was performed using a modified Bio-Rad (Hercules, CA) MRC 600 confocal microscope. Two excitation wavelengths were used (488 nm argon ion and 568 nm krypton–argon) through an acousto-optic tunable filter-coupled fiber optic launch (Prairie Technologies, Madison, WI). Excitation was applied through a custom dichroic mirror with sharp excitation bands matching the two laser wavelengths (Omega Optical, Brattleboro, VT). Two detectors were placed after a second dichroic, with a transmission band from 500 to 560 nm and long-pass reflection from 580 nm. Emission filters were bandpass (500–560 nm) and long pass (above 580 nm). The photomultiplier outputs were amplified with low-noise current amplifiers (Stanford Research Systems, Sunnyvale, CA) and digitized to 12 bits with a National Instruments (Austin, TX) board and custom software written under Matlab (Mathworks, Natick, MA). The scan-head mirrors were driven though the MRC 600 scan-head amplifiers with the same custom software. This software is available on our website (http://alford.bios.uic.edu/Research/software.html). Actin was visualized by pressure injection of Alexa 488 phalloidin (200 ms, 20 psi) through the presynaptic microelectrode. Alexa 586 dextran (10,000 molecular weight) was included in the patch solution and allowed it to passively diffuse throughout the dendrites to simultaneously localize paired postsynaptic neurons.
Imaging and uncaging.
A CCD system (ORCA; Hamamatsu, Hamamatsu City, Japan) was mounted onto an upright epifluorescence microscope (BX50WI; Olympus, Tokyo, Japan) with an attached fiber optic UV laser launch (Prairie Technologies) that allowed simultaneous imaging of dye-loaded cells and timed application of UV energy (4 ns) to a 4-μm-diameter focal point. For simultaneous glutamate uncaging and imaging, the postsynaptic patch pipette included fluorscein (50 μm). Glutamate in solutions containing either 2,3-dioxo-6-nitro-1,2,3,4-tetrahydrobenzo[f]quinoxaline-7-sulfonoamide (NBQX) or d-AP-5 was superfused over the dye-filled postsynaptic dendrites that were imaged using wavelengths longer than 490 nm to avoid uncaging glutamate. Under these conditions, the amplitude of flash-evoked postsynaptic currents varied with position over the dendrites. Dendritic regions giving the largest and fastest responses were used for analysis (Photowala et al., 2006).
Results
Structure of the reticulospinal synapse
A direct interaction of Gβγ with vesicle fusion proteins late in the fusion process opens intriguing possibilities for modification of transmitter release. GPCRs might inhibit synaptic transmission by (1) reducing the number of vesicles that fuse or (2) reducing glutamate release from each vesicle, resulting in a lower peak concentration of glutamate in the synaptic cleft. This latter possibility is supported by our recent finding that 5-HT-activated GPCRs cause transient vesicle fusion at this synapse (Photowala et al., 2006). To isolate the effects of 5-HT on synaptic transmission to just the contacts between one axon and one target neuron, we recorded all responses as paired cell recordings (Fig. 1C). This limits the number of stimulated synaptic release sites and therefore limits the likelihood of glutamate spillover from one synaptic site to another. Depending on the degree of spillover between presynaptic active zones under control conditions, decreasing the number of vesicles fusing in response to each action potential may lower the peak synaptic cleft glutamate concentration (Photowala et al., 2005).
Figure 1.
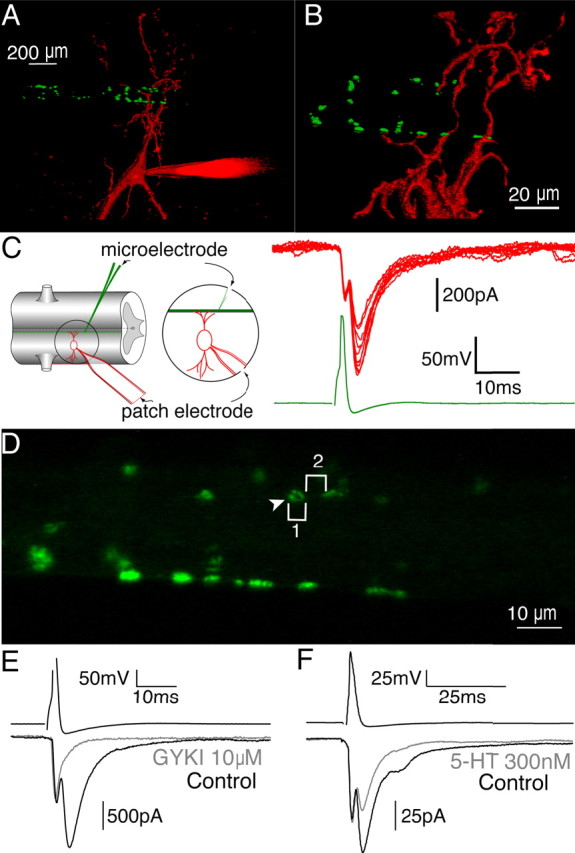
Three-dimensional reconstruction of a reticulospinal synapse. A, Actin clusters in presynaptic active zones of reticulospinal axons (green) are visualized by phalloidin toxin conjugated to Alexa 488 fluoro. Postsynaptic spinal neurons are filled with Alexa 568 fluoro dextran (red). The patch electrode is seen on the bottom right portion of the image. B, Enlargement of A. Dendrites of the spinal neuron (red) oppose presynaptic active zones (green) at several distinct locations along the axon. C, Left, Schematic for recording synaptically paired neurons. The presynaptic axon (green) is recorded with a microelectrode, and the postsynaptic spinal neuron is recorded with a patch electrode (red). Right, Action potentials evoked in the presynaptic axon (green trace) resulted in corresponding EPSCs in the spinal neuron (red traces). D, Enlargement of image in B. The arrowhead denotes the annular fluorescent pattern of phalloidin-labeled actin clusters. Measurements of the diameter (1) and shortest distance between actin clusters (2) were made. E, A concentration of 10 μm GYKI abolished the chemical component of synaptic transmission to reveal the isolated electrical component (gray). F, A low dose of 5-HT (300 nm; gray) partially inhibits the chemical component of the EPSC.
To determine whether the organization of the reticulospinal synapse is conducive to spillover, we characterized its structure by fluorescently labeling synaptic release sites in paired presynaptic axons. Actin, which congregates around synaptic vesicle clusters adjacent to the plasma membrane in lamprey reticulospinal axons (Shupliakov et al., 2002), was visualized by pressure injection of Alexa 488 phalloidin (200 ms, 20 psi) through the presynaptic microelectrode. To simultaneously localize paired postsynaptic neurons, we included Alexa 586 dextran (10,000 molecular weight) in the patch solution and allowed it to diffuse throughout the dendrites. Paired cell recordings confirmed a synaptic connection between the axon and the neuron (Fig. 1C). A three-dimensional confocal reconstruction demonstrates that presynaptic reticulospinal axons possess en passant synapses distributed around the axon periphery (Fig. 1A,B). Phalloidin labeled several distinct puncta forming close appositions with the labeled postsynaptic neuron. Each of these phalloidin puncta indicate synapses that actively undergo stimulus-evoked vesicle exocytosis and endocytosis (Photowala et al., 2005). Three-dimensional reconstructions of phalloidin-labeled puncta on the axons revealed that the shortest distance between active zones is, on average, 4.1 ± 0.5 μm (Fig. 1D) (range, 0.7–8.1 μm; 32 measurements; four axons). The diameters of the phalloidin-labeled puncta varied (0.8–9.6 μm) but were larger (mean, 2.9 ± 0.2 μm; 64 puncta, 4 axons) than the size of presynaptic densities reported in ultrastructural studies (1.2 μm; range, 0.8–1.8 μm) (Gustafsson et al., 2002), consistent with actin clusters bordering the perimeter of presynaptic vesicle clusters (Fig. 1D) (Shupliakov et al., 2002). The symmetrical shape of the phalloidin-labeled puncta is consistent with single clusters of presynaptic vesicles. Ultrastructural analysis of the reticulospinal synapse demonstrates that most presynaptic vesicle clusters (78%) are associated with a single active zone and a gap junction (Gustafsson et al., 2002). In comparison, glutamate diffusing between neighboring hippocampal CA1 synapses weakly activates NMDA receptors but not AMPA receptors. Because these synapses are one order of magnitude closer together (0.465 μm from their nearest neighbors) (Lozovaya et al., 1999) than in lamprey reticulospinal pairs, the distance between “simple synapses” indicated by phalloidin staining precludes spillover of glutamate affecting the peak EPSC amplitude, which occurs ∼1.2 ms after presynaptic action potential stimulation. This time to peak is not significantly altered by 5-HT (control, 1.1 ± 0.1 ms; 5-HT, 1.3 ± 0.1 ms; n = 3) (see Fig. 6). Interestingly, a portion of reticulospinal active zones (18%), described as “complex,” displayed more than one active zone associated with a single cluster of presynaptic vesicles (Gustafsson et al., 2002). The structure of these complex active zones raises the possibility of glutamate spillover at a minority of reticulospinal synapses (Gustafsson et al., 2002).
Figure 6.

5-HT slightly prolongs the decay of the EPSC. Subtraction of the electrical component from the traces reveals the isolated chemical component of the EPSCs. A, Top, Average of 12 consecutive traces in control (black) and 300 nm 5-HT (gray). Bottom, The average response in 300 nm 5-HT (gray) is scaled to control (black). Analysis of 12 individual EPSCs reveals that the decay (τ) of the EPSC is slightly prolonged in 5-HT (bottom). The mean of single exponential fits from 12 individual trials are shown for 5-HT (gray) and control (black). B, Average of 12 consecutive traces in control (black) and 3.8 mm Mg2+ (gray). Responses in 3.8 mm Mg2+ (gray) are scaled to control (black). The decay of the EPSC is unchanged in 3.8 mm Mg2+. Mean exponential fits from 12 individual trials are shown for 3.8 mm Mg2+ (gray) and control (black). C, Plot of values of τ in milliseconds versus amplitude of the EPSCs (in D) recorded in sequential stimuli. D, Individual traces (left) are scaled to the largest trace (right) to directly compare the decay of the EPSC.
AMPA receptor-mediated synaptic transmission is inhibited by 5-HT at the reticulospinal synapse
Action potentials, evoked by injecting a depolarizing current pulse (2 ms) through the presynaptic microelectrode, elicited biphasic EPSCs recorded in spinal neurons whole-cell patch clamped at −70 mV (Fig. 1C). The initial invariant phase of the EPSC is carried through gap junctions, whereas the slower variable phase is mediated through synaptic release of glutamate and activation of NMDA and AMPA receptors (Fig. 1C) (Buchanan et al., 1987). The electrical component of the EPSC is insensitive to 5-HT, allowing us to monitor the input impedance and space clamp of the postsynaptic patch-clamp recording throughout each experiment (supplemental Fig. S2, available at www.jneurosci.org as supplemental material) (Cochilla and Alford, 1997). Additionally, a 10 mV, 10 ms step before each episode was used to monitor the access resistance to the postsynaptic neuron.
It is apparent from the EPSC variability (Fig. 1C) and the structure of the synapse (Fig. 1A,B) that each paired synaptic response is a summed synaptic current from a number of release sites (close appositions, 5–12 per synaptic pair) (Photowala et al., 2005). Any change in the mean EPSC amplitude might therefore either result from a change in glutamate concentration at each site or result from a change in the number of vesicles released distributed across all sites. During voltage-clamp recordings of the postsynaptic neuron at −70 mV, NMDA receptors remain primarily blocked by Mg2+, and the chemical component of the current is carried almost entirely through AMPA receptors. Indeed, the selective AMPA receptor antagonist GYKI-52466 [4-(8-methyl-9H-1,3-dioxolo[4,5-h][2,3]benzodiazepin-5-yl)-benzenamine hydrochloride] (GYKI; 10 μm) abolishes the chemical component of the EPSC (Fig. 1E). Thus, the biphasic EPSC allows us to simultaneously monitor changes in AMPA receptor-mediated synaptic transmission, series resistance of the postsynaptic cell, and the space clamp of the recording.
Activation of presynaptic 5-HT GPCRs inhibits transmitter release at this synapse (Buchanan and Grillner, 1991; Blackmer et al., 2001; Gerachshenko et al., 2005; Schwartz et al., 2005; Photowala et al., 2006). Recently, we have demonstrated that the presynaptic inhibition coincides with an increase in the incidence of transient vesicle fusion (Photowala et al., 2006). We investigated the effects of 5-HT using a low-affinity AMPA receptor antagonist to monitor changes in synaptic cleft glutamate concentration. The dramatic inhibition and reduction in the signal-to-noise ratio of the EPSC observed in saturating doses of 5-HT (10 and 30 μm) prohibits further challenging the remaining EPSC with a low-affinity antagonist. Thus, to investigate the synaptic mechanism of 5-HT-mediated inhibition, we used a submaximal 5-HT concentration that only partially inhibits synaptic transmission. A concentration of 300 nm 5-HT reduced the chemical component of the EPSC to 48.6 ± 8.1% of control (Fig. 1F) (n = 9) (Schwartz et al., 2005). For each of the following experiments, it was necessary to compare the effects of 5-HT and a glutamate receptor antagonist within the same paired recording, because the absolute effect of 300 nm 5-HT varied between synapses (range, 72–14% inhibition of control). This is likely attributable to 300 nm 5-HT lying on the steepest region of the dose–response curve for 5-HT (see Fig. 8) (Schwartz et al., 2005).
Figure 8.
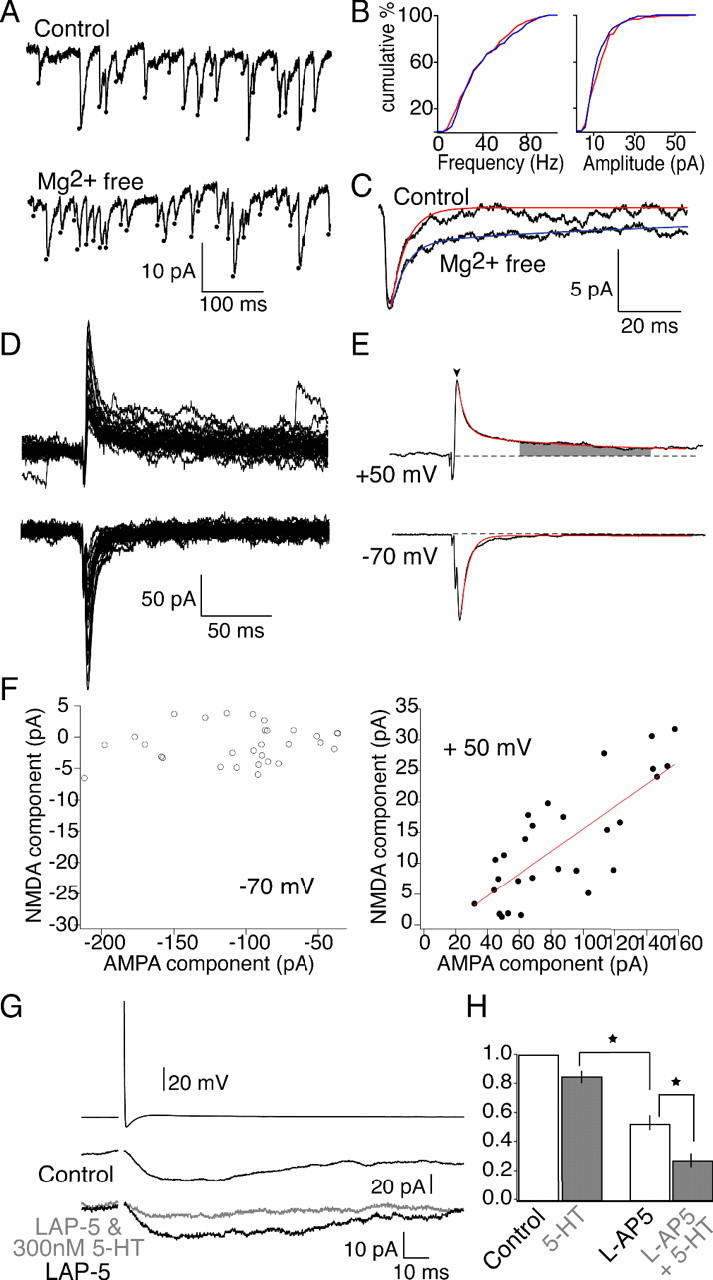
Confirming 5-HT GPCR-mediated reductions in synaptic cleft glutamate concentration at colocalized NMDA receptors. A, Spontaneous EPSCs recorded in control (top) and Mg2+-free external solution. B, Cumulative frequency and peak amplitude data are plotted for the same cell shown in A. No change in event frequency is seen after wash of Mg2+, indicating that no new event population is revealed. In addition, no change in peak amplitude of the data was recorded, consistent with a larger AMPA receptor-mediated event even after removal of Mg2+. C, Averaging the responses reveals the decay is prolonged in the Mg2+-free external solution, consistent with both NMDA and AMPA receptors mediating the responses. D, Overlaid traces of evoked NMDA and AMPA EPSCs (Vh = +50 mV) and AMPA EPSCs (Vh = −70 mV) recorded at the same synapse. E, Average of traces in D. The NMDA receptor component was measured as the average amplitude during the time points indicated by the shaded region, and the AMPA receptor component was measured as the peak (arrow). Red lines represent exponential fits to decay time constants for the AMPA and NMDA EPSCs. F, Plot of the amplitude of the NMDA versus AMPA EPSCs at −70 mV (left) and +50 mV (right). Linear fits demonstrate a strong correlation (right, red line). G, NMDA EPSCs isolated in Mg2+-free Ringer's solution and 20 μm GYKI. The magnitude of inhibition mediated by 300 nm 5-HT on NMDA receptor EPSCs is magnified by the low-affinity NMDA receptor antagonist l-AP-5 (200 μm). A concentration of 200 μm l-AP-5 inhibits the EPSC amplitude to 52.1 ± 10.2% of control (bottom black trace; n = 4). 5-HT and l-AP-5 inhibit the EPSC to 48.6 ± 6.5% of the response in l-AP-5 (top gray trace; n = 4). H, Bar graph depicting the magnified inhibitory effect of 300 nm 5-HT on NMDA EPSCs in the presence of the low-affinity NMDA receptor antagonist l-AP-5. A concentration of 300 nm 5-HT alone inhibits the EPSCs to 88.0 ± 6.6% of control (left; n = 10). The inhibitory effect of the same dose of 5-HT on NMDA EPSCs is significantly greater in 200 μm l-AP-5 (p < 0.05, two-sample equal-variance t test). *p < 0.05, significance. Error bars indicate SEM.
5-HT lowers the synaptic cleft glutamate concentration
We used a competitive low-affinity AMPA receptor antagonist, Kyn (Clements et al., 1992; Diamond and Jahr, 1997), to monitor changes in synaptic cleft glutamate concentration. By definition, a competitive low-affinity antagonist rapidly unbinds from the receptor after binding. If the antagonist affinity is sufficiently low, a portion of the EPSC will be attributable to non-equilibrium unbinding of the antagonist from the receptor and its subsequent competitive replacement by synaptically released glutamate (Clements et al., 1992). The degree to which antagonist, unbinding from the AMPA receptor, is replaced by glutamate is dependent on the cleft glutamate concentration. It is therefore possible to monitor changes in cleft glutamate concentration by measuring the degree of low-affinity antagonist replacement by glutamate. For example, in Kyn, if the synaptic cleft glutamate concentration is lowered by 5-HT, there will be less replacement of the antagonist by glutamate and the magnitude of inhibition mediated by the same dose of 5-HT on the EPSC will be greater than under control conditions. Likewise, the extent of inhibition mediated by application of Kyn will be greater in the presence of 5-HT than during application of Kyn alone.
To determine whether 5-HT alters the synaptic cleft glutamate concentration, paired recordings were performed as above. After recording control responses, an approximately half-maximal dose of 200 μm Kyn (Diamond and Jahr, 1997) reduced the chemical component of the EPSC to 48% of control for the paired recording shown in Figure 2A (red trace). Kyn was then washed from the bath until the EPSC amplitude returned to control levels (>10 min). A concentration of 300 nm 5-HT was applied to determine the effect of 5-HT alone. At this synapse, 300 nm 5-HT inhibited the EPSC to 46% of control (Fig. 2A, gray trace). To compare the potency of Kyn in 300 nm 5-HT to the control effect of Kyn alone at the same synapse, we simultaneously applied 200 μm Kyn and 300 nm 5-HT. The same dose of Kyn was much more potent in 5-HT, inhibiting the EPSC to 14% of the response in 5-HT alone (Fig. 2A, blue trace). After all conditions were recorded, application of 20 μm CNQX uncovered the electrical component of the EPSC (Fig. 2A, thin black trace). To reveal the isolated chemical component without adding to the recording noise, the electrical component of each EPSC was fitted with an exponential, and this exponential was subtracted from the trace (Fig. 2B, left). In addition, to compare the potency of Kyn alone and in 5-HT, we scaled the average EPSCs in Kyn alone and Kyn with 5-HT to the average EPSCs recorded in control (Fig. 2B, right). Scaling the traces in this manner illustrates that Kyn inhibits the EPSC more potently in 5-HT than under control conditions (compare red and blue traces).
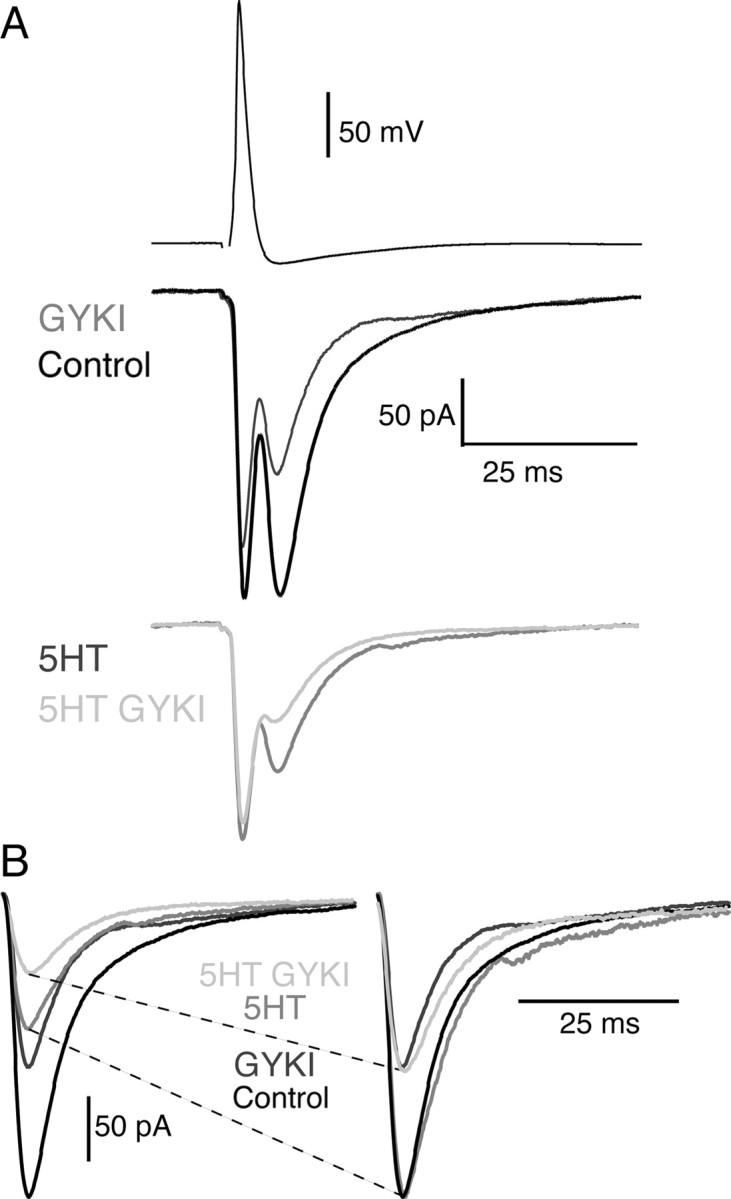
Figure 2.
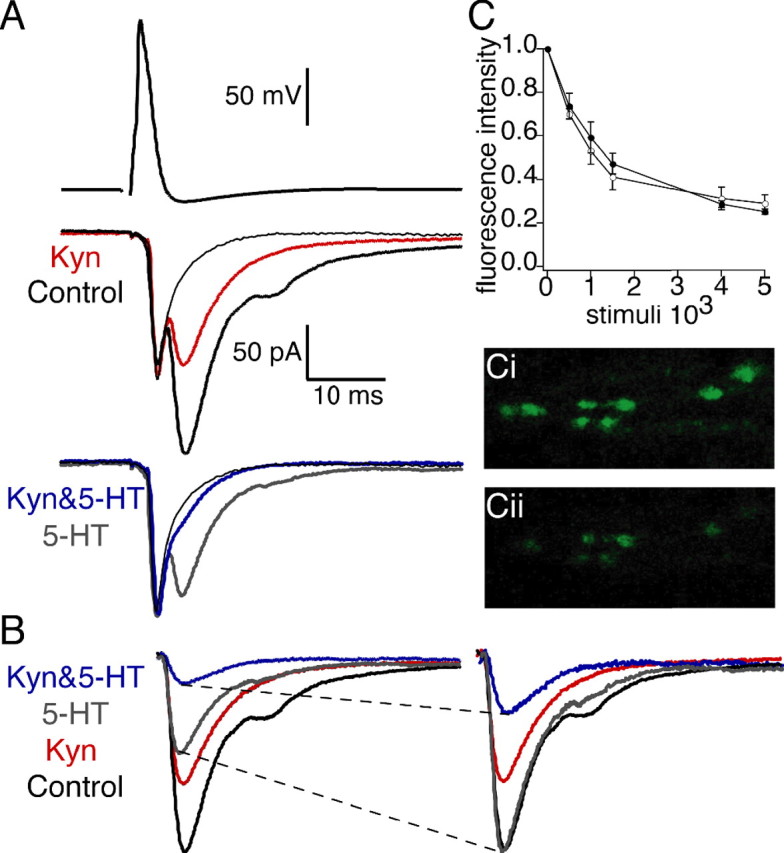
5-HT increases the potency of Kyn-mediated inhibition indicative of a reduction in the peak glutamate cleft concentration. A, A concentration of 200 μm Kyn (red) reduced the EPSC to 48% of control (black). A concentration of 300 nm 5-HT (bottom, gray) reduced the EPSC to 46% of control. Application of 200 μm Kyn with 5-HT (Kyn&5-HT; bottom, blue) reduced the EPSC to 14% of the EPSC in 5-HT alone. The pure electrical component was revealed by application of 20 μm CNQX (thin black traces). B, EPSCs for all four conditions. Subtraction of the electrical component of the EPSCs reveals isolated AMPA receptor responses (left). EPSCs recorded in 200 μm Kyn with 300 nm 5-HT (Kyn&5-HT; blue) and 300 nm 5-HT (gray) are scaled (dashed lines) to control (right, black). 5-HT increased the potency of 200 μm Kyn (blue vs red traces). C, FM2-10 dye destaining from synaptic vesicles. Ci, Cii, Image of axon stained with FM2-10 dye before (Ci) and after (Cii) stimulus-evoked destaining of FM1-43 dye from vesicles in control conditions (1 Hz, 5000 action potentials). The graph of normalized florescent intensity versus stimulus number demonstrates Kyn (open circles; 200 μm) does not alter FM2-10 dye destaining from fusing vesicles during synaptic transmission. Error bars indicate SEM.
The increased potency of the low-affinity antagonist in 5-HT held true for all synapses measured. Averaging the responses of four synapses revealed that 200 μm Kyn alone inhibited the chemical component of the EPSC to 47.7 ± 4.7% of control. However, in 300 nm 5-HT, the same dose of Kyn (200 μm) inhibited synaptic transmission to 26.5 ± 7.2% of the response in Kyn alone (significantly different; p < 0.05; n = 4). The increased inhibition of synaptic transmission in the presence of 5-HT by the same dose of Kyn demonstrates that 5-HT mediates a reduction in the synaptic cleft glutamate concentration. We may also present the data under the paradigm that the efficacy of 5HT is altered in the presence of the low-affinity antagonist. Presenting the data in this manner does not alter the significance or conclusions drawn from our results (supplemental Fig. S1, available at www.jneurosci.org as supplemental material).
To control for nonspecific effects of Kyn on neurotransmitter release, we assayed FM2-10 dye destaining from synaptic vesicles. Vesicles were loaded by stimulating reticulospinal axons (1 Hz, 2000 action potentials) during bath application of FM2-10 dye (4 μm). Excess dye was cleared from the tissue with Advasep 7 (Kay et al., 1999), and single confocal sections were imaged. Figure 2C displays an image of an axon stained with FM2-10 dye before (Ci) and after (Cii) stimulus-evoked destaining of FM2-10 dye from vesicles in control conditions (1 Hz, 5000 action potentials). To test the effects of Kyn on destaining, another three axons were loaded with FM2-10 as described above and destained in 200 μm Kyn. Plotting the normalized fluorescent intensity versus stimulus number demonstrates Kyn (filled circles) does not alter stimulus-evoked FM2-10 dye destaining from fusing vesicles (Fig. 2C). Additionally, Kyn (200 μm) had no effect on paired-pulse facilitation (see Fig. 5). Together, these results demonstrate Kyn does not alter the probability of vesicle fusion.
Figure 5.
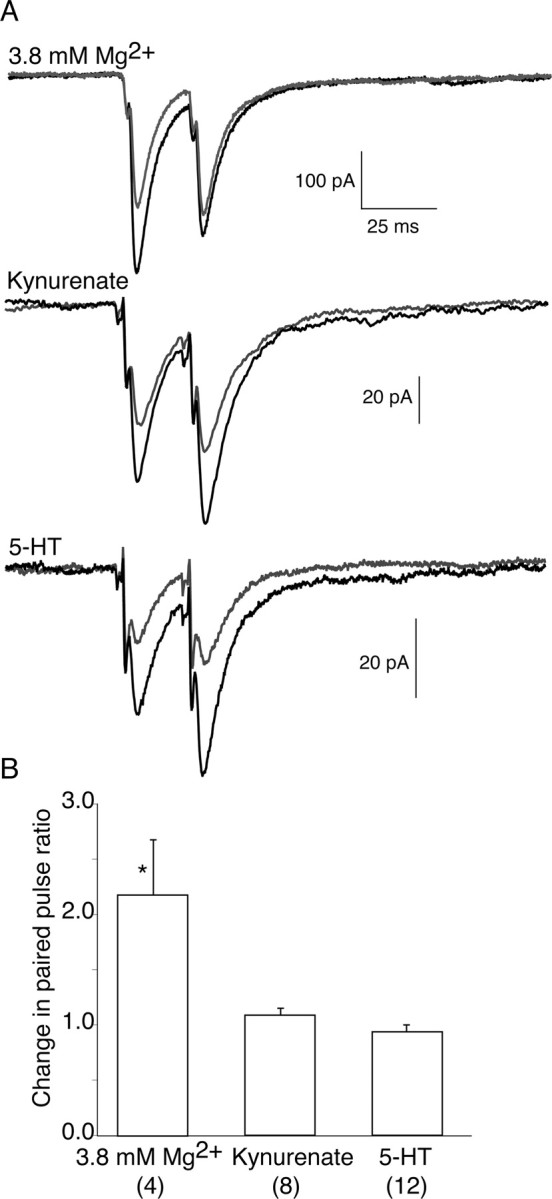
Paired-pulse facilitation. A, The effects of 3.8 mm Mg2+, Kyn, and 5-HT (gray traces) on paired-pulse facilitation were compared with control (black traces). Raising the Mg2+ concentration to 3.8 mm (top) nearly doubles the paired-pulse ratio, whereas neither Kyn (middle) nor 5-HT (bottom) altered the paired-pulse ratio. B, Bar graph depicting the paired-pulse ratios under the conditions of raised Mg2+ concentration (3.8 mm), Kyn (200 μm), and 5-HT (600 nm). The number of pairs recorded for each condition is shown in parentheses. Error bars indicate SEM.
A noncompetitive antagonist does not alter the potency of 5-HT
As an additional control, we repeated the above experiment with the high-affinity noncompetitive AMPA receptor antagonist GYKI. Because this antagonist will not compete with glutamate for receptor binding during synaptic transmission (or unbind from the receptor during the time course of synaptic transmission), there will not be a component of the EPSC resulting from non-equilibrium unbinding of the antagonist from the receptor and competitive replacement by glutamate. Thus, a noncompetitive antagonist should inhibit synaptic transmission equally in control conditions and after lowering the synaptic cleft glutamate concentration. For the synapse shown in Figure 3A, an intermediate dose of the high-affinity noncompetitive antagonist GYKI (3 μm) alone reduced the EPSC to 58% of control. Application of 300 nm 5-HT alone inhibited the chemical component of the EPSC to 48% of control (Fig. 3A). We then tested the magnitude of inhibition mediated by GYKI in 300 nm 5-HT. In contrast to the low-affinity antagonist, the degree of inhibition mediated by GYKI in 300 nm 5-HT was not significantly different from control (56% of the response in GYKI). This is seen more clearly in Figure 3B, where the EPSCs recorded in 3 μm GYKI and in 3 μm GYKI with 5-HT are scaled to control and the electrical components have been subtracted to isolate the chemical component. The degree of inhibition by GYKI in control and in 5-HT are similar (compare light gray and dark gray traces). For four pairs, 3 μm GYKI reduced the EPSCs to 53.1 ± 5.8% of control. This was not significantly different from the inhibition mediated by GYKI in 300 nm 5-HT (59.9 ± 12.1% of control; n = 5; p > 0.05). Thus, as predicted, a low-affinity competitive AMPA receptor antagonist, but not a noncompetitive antagonist, is capable of sensing changes in cleft glutamate concentration.
Figure 3.
5-HT does not increase the potency of high-affinity noncompetitive AMPA receptor antagonist GYKI-mediated inhibition. A, The high-affinity noncompetitive AMPA receptor antagonist GYKI (3 μm; dark gray) reduced the EPSC to 58% of control (black). 5-HT (300 nm) alone inhibited the EPSC to 48% of control (bottom, gray). Application of 3 μm GYKI with 300 nm 5-HT (light gray) reduced the EPSC to 56% of the EPSC in 5-HT alone. B, EPSCs recorded in control (black and dark gray traces) and 5-HT (gray and light gray traces) are scaled to the same size, and the electrical components are subtracted for clarity. In contrast to Kyn, the inhibitory potency of GYKI is not altered by 300 nm 5-HT (right, compare light gray vs dark gray traces).
Inhibiting synaptic transmission by lowering Pr does not alter the peak synaptic cleft glutamate concentration
Our findings demonstrate that 5-HT reduces the synaptic cleft glutamate concentration. If multivesicular release or spillover occurred at this synapse under control conditions, it is possible that 5-HT reduces the cleft glutamate concentration by reducing Pr. To determine whether a decrease in Pr could lower the cleft glutamate concentration, we monitored the synaptic cleft glutamate concentration while reducing Pr by inhibiting voltage-gated calcium entry by increasing the concentration of Mg2+.
For the synapse shown in Figure 4A, Kyn (150 μm) alone inhibited the EPSC to 83% of control. Increasing the concentration of Mg2+ from 1.8 to 3.8 mm inhibited the chemical component of the EPSC to 66% of control. To determine whether lowering Pr causes a reduction in cleft glutamate concentration, we simultaneously increased the Mg2+ concentration and applied Kyn (150 μm). In contrast to 5-HT, application of Kyn (150 μm) mediated similar inhibition (83%) in control conditions as in low Pr (82%, increasing the Mg2+ concentration). For clarity, we once again subtracted the electrical component of the EPSC and scaled the responses recorded in Mg2+ and in Mg2+ with Kyn to control (Fig. 4B). Comparison of the dark gray and light gray traces in Figure 4B demonstrates that raising the Mg2+ concentration inhibits synaptic transmission to a similar degree both in control and in the presence of a Kyn.
Figure 4.
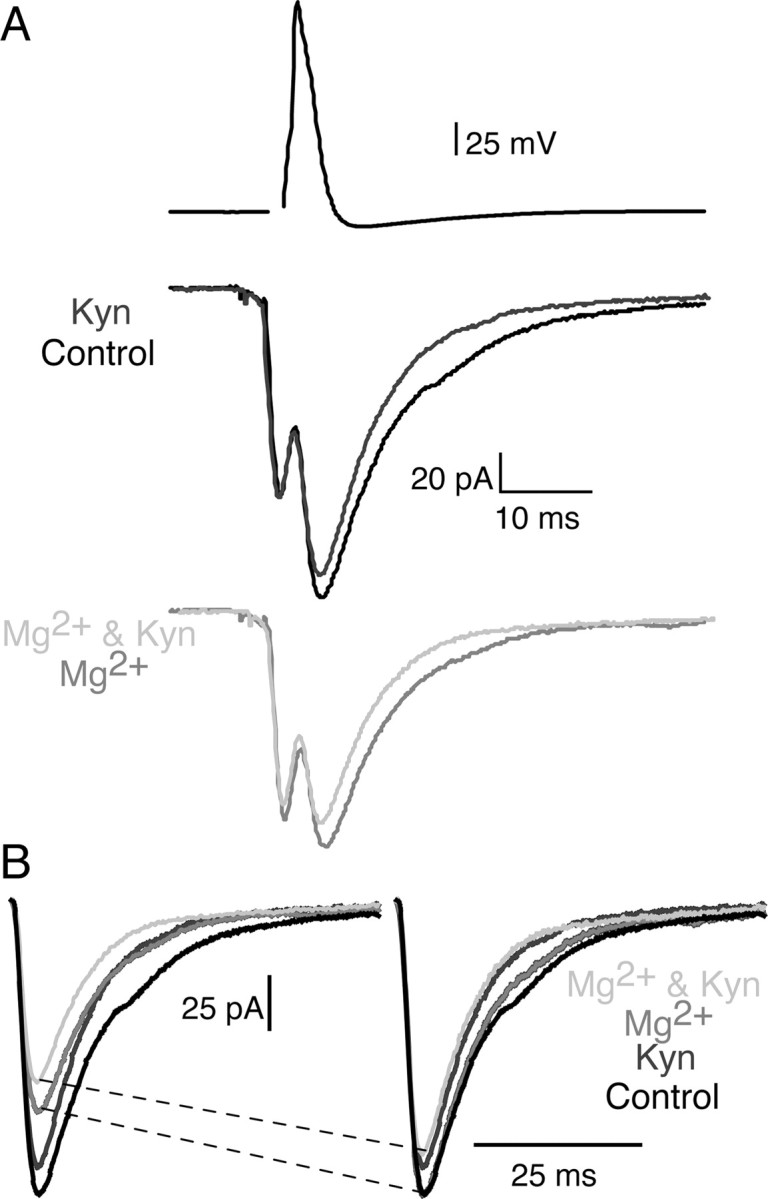
Inhibiting synaptic transmission by lowering Pr does not alter the peak concentration of synaptic glutamate transients. A, An intermediate dose of Kyn (150 μm; dark gray) inhibited synaptic transmission to 83% of control (black). Raising the concentration of Mg2+ (from 1.8 to 3.8 mm; gray trace) to decrease Pr reduced the EPSC to 66% of control. Simultaneously applying Kyn and raising the concentration of Mg2+ (light gray) reduced the EPSC to 82% of the EPSC in high-Mg2+ alone (gray). B, EPSCs recorded in control (black and dark gray traces) and in high Mg2+ (gray and light gray traces) are scaled (right) to the same size after subtraction of the electrical component. High Mg2+ does not increase the potency of inhibition mediated by Kyn (compare dark gray vs light gray traces).
In four different paired recordings, application of 200 μm Kyn alone reduced synaptic transmission to 67.2 ± 9.9% of control. Decreasing Pr (increasing Mg2+ from 1.8 to 3.8 mm) did not alter the effect of Kyn (69.9 ± 18% of the response in high Mg2+ alone; no significant difference; p > 0.05), demonstrating that reducing Pr does not alter synaptic cleft glutamate concentration. These results rule out inhibition of spillover or multivesicular release as a mechanism for 5-HT-mediated reductions in peak synaptic cleft glutamate concentration. Furthermore, these results, in combination with the 5-HT experiments, suggest that activation of a presynaptic GPCR reduces the synaptic cleft glutamate concentration independently of vesicle release probability.
Raising the Mg2+ concentration to 3.8 mm partially inhibited synaptic responses to 66% of control (Fig. 4). Inducing only moderate inhibition of synaptic transmission is essential because dramatic inhibition of EPSC prohibits further challenging the remaining EPSC with a low-affinity antagonist. To confirm that this modest change in synaptic transmission significantly decreases probability of release, we monitored paired-pulse facilitation (50 Hz) under control and high Mg2+ conditions. Indeed, raising the extracellular concentration of Mg2+ to 3.8 mm increased the paired-pulse ratio by a factor of 2.18 ± 0.50 over control conditions, as would be expected for an inhibitory effect on release probability (Dobrunz and Stevens 1997) (Fig. 5).
The above experiments demonstrate that lowering the probability does not alter the synaptic cleft glutamate concentration. However, it remains possible that raising the probability of vesicle fusion may promote multivesicular release or spillover and therefore raise the synaptic cleft glutamate concentration. To test this directly, we monitored paired-pulse facilitation in control and in the presence of 200 μm Kyn. Kyn displayed no effect on the paired-pulse ratio (relative paired-pulse ratio before and after Kyn was 1.09 ± 0.06). This confirms data obtained from destaining FM2-10 (Fig. 2C) and indicates that raising Pr does not alter the profile of glutamate in the synaptic cleft (Fig. 5). Paired-pulse facilitation was also unaffected by 5-HT (relative paired-pulse ratio before and after 5-HT was 0.94 ± 0.06), confirming that 5-HT does not alter release probability (Fig. 5) (Photowala et al., 2006). To summarize these data (Figs. 2–5), 5-HT enhanced the effect of Kyn alone on EPSC amplitude (further inhibition in Kyn was 1.8 times the inhibition in Kyn alone) but had no enhancing effect on GYKI inhibition (0.9 times the control inhibition), whereas reducing Pr with high concentrations of Mg2+ also did not enhance the effect of Kyn (1.0 times the control inhibition). Finally, although 5-HT acts presynaptically, it had no effect on paired-pulse ratios, implying that 5-HT does not alter Pr.
5-HT slightly prolongs the decay of the EPSC
Our results suggest that 5-HT reduces the peak synaptic cleft concentration of glutamate. To investigate whether this altered the shape of postsynaptic AMPA receptor-mediated currents, we analyzed the decay rates of biphasic (electrical and chemical components) EPSCs in intermediate doses of 5-HT (300 nm) versus control. The EPSC electrical component was carefully monitored to ensure that the input impedance of the postsynaptic cell and the action potential remained constant throughout the recordings (changes >10% of control were not included). Analysis of the isolated chemical component demonstrated that the decay rate (τ) of the EPSCs were slightly prolonged in 5-HT to 125 ± 5% of control (control τ = 5.8 ± 0.3; 5-HT τ = 7.2 ± 0.8; n = 3; p < 0.05) (Fig. 6A). No changes were observed in 10–90% rise time of the electrical component of the EPSCs for the same responses (0.7 ± 0.1 ms in both control and 300 nm 5-HT). Thus, 5-HT appears to slightly alter the time course of cleft glutamate. As an additional control, we also analyzed the decay rates of EPSCs in high Mg2+ that will lower Pr by inhibiting calcium entry, but based on our results with Kyn, this does not alter the peak concentration or duration of glutamate in the synaptic cleft. In high Mg2+ (3.8 mm), no significant change was observed in the rate of decay of the EPSC (control τ = 4.9 ± 0.5; high Mg2+ τ = 5.1 ± 0.3; n = 3; p > 0.05) (Fig. 6B).
We also determined whether the amplitude of control EPSCs had an effect on decay rates to ascertain whether larger responses with more active release sites might cause glutamate spillover. Plotting the amplitude of individual EPSCs versus the decay under control conditions revealed no correlation between the amplitude of the EPSC and the decay (Fig. 6C). Additionally, smaller-amplitude events recorded in control, in contrast to those recorded in 5-HT, did not exhibit a change in the decay rate (Fig. 6D). The modest prolongation of the decay of EPSCs in 5-HT is consistent with, at most, only a very slight change in the time course of glutamate in the synaptic cleft.
Probing the relative affinities of NMDA and AMPA receptor component with caged glutamate
AMPA and NMDA receptors display different glutamate binding characteristics (Patneau and Mayer, 1990; Clements et al., 1992; Renger et al., 2001). Thus, mechanisms altering the peak synaptic cleft glutamate concentration may lead to differential activation of these two ionotropic glutamate receptors expressed at the same synapse. To confirm this phenomenon at the lamprey reticulospinal synapse, we flash photolysized glutamate over pharmacologically isolated AMPA and NMDA receptors. Spinal neurons were recorded with an electrode containing fluorescein (50 μm). A double-barreled superfusion pipette was placed over the spinal cord, and the tissue was superfused with caged glutamate [l-glutamic acid, γ-(α-carboxy-2-nitrobenzyl) ester, trifluoroacetic acid salt] in Mg2+-free Ringer's solution plus either the selective NMDA antagonist d-AP-5 (50 μm) in one pipette to record isolated AMPA receptor-mediated responses or NBQX (2 μm) in the other pipette to record isolated NMDA receptor-mediated responses (Fig. 7). The applied antagonist was then alternated over the same-recorded neuron while applying an identical dose of caged glutamate.
Figure 7.

Probing the relative glutamate affinities of AMPA and NMDA receptors with caged glutamate. A, Neuron recorded with an electrode containing fluorescein (50 μm). The uncaging laser was targeted to the circled point in the bottom left region (contrast expanded to reveal dendrite). B, Experimental setup. Neurons were recorded with an electrode containing fluorescein (50 μm). A double-barreled pipette superfused caged glutamate over the recorded neuron, and NMDA (blue) or AMPA (red) receptor-mediated responses were isolated pharmacologically. C, At the time marked by the arrow and the dotted line, the region marked by the white dot in A was irradiated with 357 nm light (4 ns) at a relative intensity indicated by the numbers, while d-AP-5 and caged glutamate were applied. Increasing intensity revealed an AMPA receptor-mediated response. D, The experiment in C was repeated, but NBQX was substituted for d-AP-5. This evoked an NMDA receptor-mediated response with a lower activation threshold than that of AMPA and which saturated at intensities that only marginally activated AMPA responses. E, Relative flash intensity plotted versus current amplitude for NMDA (blue) and AMPA (red) receptor-mediated currents (n = 3). Error bars indicate SEM.
When the tissue was superfused with caged glutamate and d-AP-5, at the time marked by the arrow and by the dotted bar (Fig. 7), the region indicated by the white circle (Fig. 7A) was irradiated with 357 nm light (4 ns) at a relative intensity indicated by the numbers (Fig. 7C,D). Increasing the intensity revealed an AMPA receptor-mediated response at a relative intensity between 1 and 2 (Fig. 7C,E). In contrast, in the same neuron, when NMDA receptor responses were isolated with AMPA receptor antagonist NBQX (2 μm), an NMDA receptor-mediated response was evoked with a lower activation threshold than that of AMPA (Fig. 7D,E). We conclude that the glutamate concentration threshold to activate NMDA receptors is lower than AMPA receptors.
Colocalization of NMDA and AMPA receptors
The flash photolysis experiments indicate that NMDA and AMPA receptors colocalize at the resolution obtained with flash photolysis (2–4 μm spot), consistent with evidence from paired recordings (Buchanan et al., 1987). Nevertheless, it remained possible that individual synaptic boutons do not contain both receptors. To determine whether glutamate released from a single vesicle may activate both NMDA and AMPA receptors, spontaneous events were monitored in control and in Mg2+-free conditions. Whole-cell recordings were made from three neurons in Ringer's solution containing strychnine (5 μm) to block glycinergic responses and TTX (1 μm) to block evoked release. Events were detected using an algorithm to detect a threshold of the differential of the recording. Identical parameters were used in control and after wash of Mg2+. The frequency and peak amplitude of events were unchanged by wash of Mg2+ (Fig. 8A,B). Similarly, the mean rise time (time to peak) of the detected event was unchanged by removal of Mg2+ (Fig. 8A) (control, 3.2 ± 0.2; Mg2+-free solution, 3.1 ± 0.2). In addition, neither the range of rise times (control, 0.8–7.2 ms; Mg2+-free solution, 0.6–6.4 ms) or the SD of rise times (control, 1.6 ms2; Mg2+-free solution, 1.5 ms2) of each detected event was significantly altered by wash of Mg2+ (total of 300 events in three cells analyzed). Thus, no isolated NMDA receptor-mediated events were detected in Mg2+-free solution, because NMDA receptor-evoked events show a minimum time to peak of 15 ms (Fig. 8G). In contrast, analysis of the decays of these events reveals a pronounced prolongation in the decay of spontaneous events in Mg2+-free Ringer's solution, consistent with the coactivation of NMDA and AMPA receptors (Fig. 8A,C). In the control solution, the decay of the average of all events detected in each cell was fit with a single exponential (mean τ = 8.5 ± 0.9 ms). However, in contrast, after wash of Mg2+ from the Ringer's solution, the data were best fit with two exponentials (mean τ1 = 7.1 ± 1.6 ms and τ2 = 140 ± 37 ms). The slower of these exponentials is consistent with the decay of an NMDA receptor-mediated component of the EPSC. We conclude that AMPA and NMDA receptors are colocalized at synapses showing spontaneous activity. However, because these neurons receive synaptic input from several different presynaptic cells, these events are not restricted to release from reticulospinal axons. Thus, to provide a better analysis of whether transmitter released from reticulospinal neurons acts at both AMPA and NMDA receptors at the same postsynaptic sites, we analyzed covariance of the NMDA and AMPA components during evoked release.
Under control conditions, paired recordings reveal considerable quantal variability between individual responses (Photowala et al., 2006). Because the number of active synapses is limited and the action potential always invades the synaptic terminal (the axon is unbranched), quantal variation in AMPA receptor activation will be mirrored by quantal variation in NMDA receptor activation if the receptors are colocalized. Thus, to directly test NMDA and AMPA colocalization, paired recordings were made. Recordings at −70 mV display pure AMPA receptor-mediated EPSCs because NMDA receptors are inhibited by a voltage-dependant Mg2+ block (Fig. 8D,E). Raising the holding potential to +50 mV reveals a slowly decaying NMDA receptor component that follows the faster AMPA receptor-mediated component (Fig. 8D,E). Exponential fits to the average of the traces (Fig. 8E, red lines) demonstrate similar decay time constants for the AMPA receptor component at −70 mV (5.490 ms) and +50 mV (5.494 ms) and a time constant of the NMDA receptor component of 83.3 ms. Plotting the amplitude of the NMDA and AMPA receptor components during stimuli in which both components are simultaneously recorded shows variations in NMDA receptor-mediated EPSC size are tightly correlated with AMPA receptor EPSC size (Fig. 8F). This correlation held true for the three pairs tested (mean correlation coefficient, 0.84 ± 0.03; y intercept, −2.0 ± 5.5 pA). We conclude that NMDA and AMPA receptors are indeed colocalized at the reticulospinal synapse.
NMDA receptors colocalize at synapses with AMPA receptors and are consequently subject to the same reduction in cleft glutamate concentration in 5-HT. Therefore, we confirmed 5-HT-mediated reductions in synaptic cleft glutamate concentration using a low-affinity NMDA receptor antagonist while recording NMDA receptor-mediated responses. NMDA EPSCs were isolated by application of Mg2+-free Ringer's solution and 20 μm GYKI. The low-affinity NMDA receptor antagonist l-AP-5 (200 μm) reduced the synaptic response to 42.5% of control (Fig. 8G, bottom, black trace). Under control conditions, 300 nm 5-HT slightly inhibits NMDA receptor-mediated currents to 88.0 ± 6.6% of control (Fig. 9) (n = 12). However, in the presence of l-AP-5, the magnitude of inhibition mediated by the same dose of 5-HT was increased to 41.1% of the response in l-AP-5 alone (17.5% of control) (Fig. 8G, gray trace). Across all four synapses tested, 200 μm l-AP-5 significantly amplified the inhibitory effect of 300 nm 5-HT to 48.6 ± 6.5% of the response in l-AP-5 (Fig. 8H) (n = 4; p < 0.05, two-sample equal-variance t test). Thus, both low-affinity AMPA (Kyn) and NMDA (l-AP-5) receptor antagonists reveal 5-HT mediates a reduction in the synaptic cleft glutamate concentration.
Figure 9.
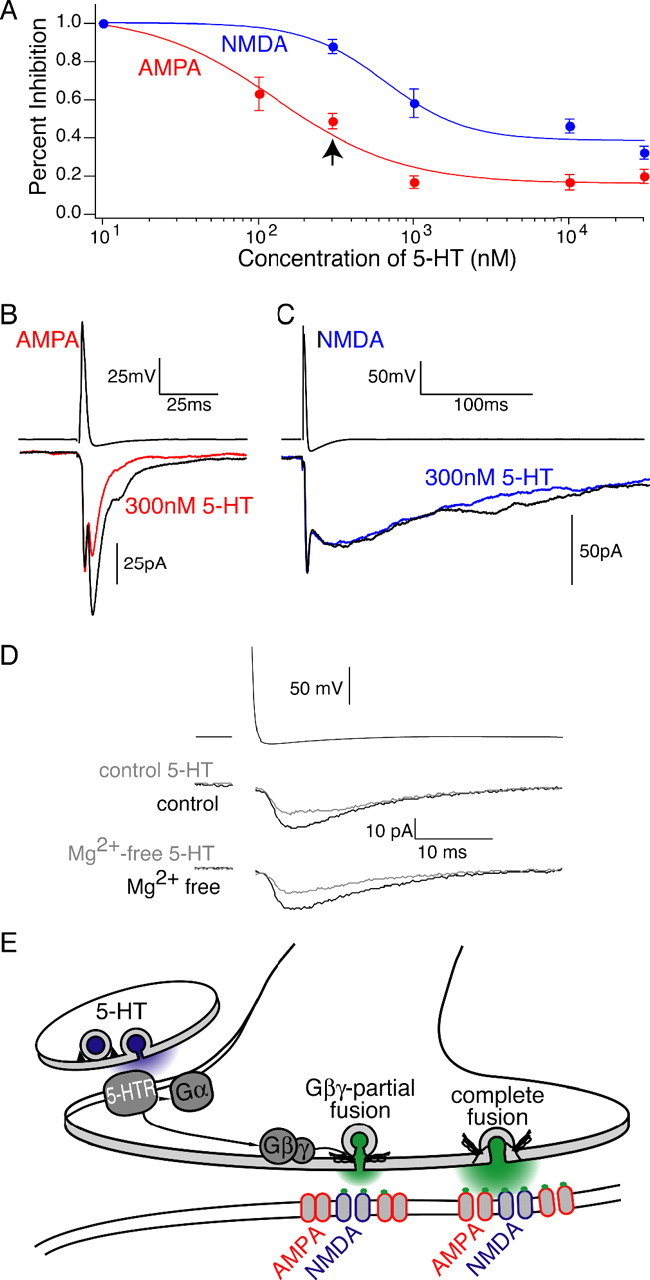
Differential effect of 5-HT on NMDA and AMPA receptor components. A, Dose–response curves for isolated AMPA (red) and NMDA (blue) synaptic responses at the reticulospinal synapse. The arrow denotes differential inhibition of NMDA and AMPA responses to 300 nm 5-HT. Error bars indicate SEM. B, Paired recording in which 300 nm 5-HT inhibits AMPA receptor-mediated synaptic currents (red). C, The same dose of 5-HT (300 nm) only modestly inhibits NMDA receptor-mediated synaptic currents (blue). D, Example traces of the effect of 300 nm 5-HT (gray) in control (top, black) Ringer's solution and 300 nm 5-HT (gray) in Mg2+-free Ringer's solution (bottom, black) for the same paired recording. E, Diagram depicting a possible mechanism of 5-HT GPCR-mediated reduction in synaptic cleft glutamate concentration. Activation of a presynaptic 5-HT GPCR promotes transient vesicle fusion and inhibits synaptic transmission through a direct interaction of Gβγ with the release machinery (Gβγ-partial fusion). Switching from complete fusion to Gβγ-partial fusion lowers the peak synaptic cleft glutamate (green) concentration. Because of the different glutamate binding characteristics of AMPA and NMDA receptors, reducing the synaptic cleft glutamate concentration differentially inhibits postsynaptic AMPA receptors (red) relative to NMDA receptors (blue). 5-HTR, 5-HT receptor.
Presynaptic 5-HT GPCRs mediate differential inhibition of AMPA and NMDA receptor-mediated currents
5-HT alters the peak synaptic cleft concentration of glutamate. Because of the distinct glutamate binding properties of NMDA and AMPA receptors colocalized at this synapse, variations in synaptic cleft glutamate concentration may cause disproportionate effects on these receptors (Mainen et al., 1999; Choi et al., 2000; Renger et al., 2001). To determine whether this was the case, we monitored NMDA receptor-mediated synaptic currents with increasing doses of 5-HT and compared these results to a previously published dose–response curve of 5-HT-mediated inhibition of AMPA receptor-mediated currents (Schwartz et al., 2005). NMDA receptor responses were isolated in Mg2+-free Ringer's solution to relieve the voltage-dependant Mg2+ block of NMDA receptors and 10 μm GYKI to block AMPA receptor-mediated currents. These experiments reveal a shift in the apparent Kd of 5-HT to inhibit AMPA synaptic currents from 143 ± 75 nm to an apparent Kd of 655 ± 290 nm to inhibit NMDA receptor currents (Fig. 9). At 300 nm, 5-HT inhibited AMPA receptor synaptic responses to 48.7 ± 8.0% of control (n = 9), while inhibiting NMDA receptor currents to 88.0 ± 6.6% of control (n = 12; p < 0.05) (Fig. 9B,C). Furthermore, at saturating doses of 5-HT (10 and 30 μm), AMPA synaptic currents were inhibited to a significantly greater extent (18.3 ± 3.2% of control; n = 8) than NMDA synaptic currents (39.8 ± 5.5% of control; n = 10; p < 0.05). The differential response of NMDA and AMPA receptors to changing synaptic cleft glutamate transients reveals a novel mechanism for selectively controlling the activity of glutamate receptor subtypes expressed at the same synapse. A differential response is also consistent with our hypothesis that activation of presynaptic 5-HT GPCRs inhibits synaptic transmission by altering the peak synaptic cleft glutamate concentration.
To determine whether the muted inhibitory effect of 5-HT on NMDA currents was attributable to a higher Pr in Mg2+-free Ringer's solution, we compared the effect of 5-HT on AMPA receptor-mediated EPSCs in Mg2+ free (high Pr) versus control (normal Pr) (Fig. 9). For the paired recording shown in Figure 9D, 300 nm 5-HT inhibited the response to 63.6% of the response in control Ringer's solution. 5-HT was then washed out of the bath, and baseline responses were recorded in Mg2+-free Ringer's solution. In this higher Pr condition, applying 300 nm 5-HT inhibited synaptic transmission to a similar extent (59.2% of the response in Mg2+-free Ringer's solution). The cumulative results of four synapses demonstrate that there is no significant difference between the effect of 300 nm 5-HT in control (61.6 ± 16%) and Mg2+-free Ringer's solution (54.4 ± 14%; p > 0.05; n = 4). Thus, lowering Pr does not alter the efficacy of 5-HT.
Discussion
We demonstrate that 5-HT-mediated inhibition shows an increase in potency in low-affinity antagonists to the postsynaptic glutamate receptors. This is consistent with a reduction in the peak concentration of glutamate in the synaptic cleft. It is a possibility that this reduction in peak synaptic cleft glutamate concentration could be attributable to a decrease in simultaneous release events. However, lowering Pr did not alter the cleft glutamate concentration, ruling out inhibition of either multivesicular release or spillover as a mechanism for lowering the cleft glutamate concentration. Together, these results reveal that activation of a presynaptic 5-HT GPCR modulates the peak concentration of glutamate in the synaptic cleft independently of Pr.
Studies of FM dye destaining and capacitance transients at CNS nerve terminals demonstrate that a population of synaptic vesicles remain structurally intact after fusion with the plasma membrane (Klyachko and Jackson, 2002; Aravanis et al., 2003; Gandhi and Stevens, 2003). During this reversible form of vesicle fusion, widely referred to as kiss-and-run, neurotransmitter release is thought to occur through a transient fusion pore (Chandler and Heuser, 1980; Lindau and Alvarez de Toledo, 2003). Modeling studies of the fusion pore size and conductance (Klyachko and Jackson, 2002; Gandhi and Stevens, 2003; Richards et al., 2005) imply kiss-and-run vesicle fusion may restrict neurotransmitter release and lead to a reduced cleft concentration of neurotransmitter (Choi et al., 2000, 2003; Renger et al., 2001; Zakharenko et al., 2002), whereas other studies have disputed this conclusion (Stevens and Williams, 2000; Becherer et al., 2001; Sudhof, 2004). Supporting the theory that the structure of a fusion pore restricts neurotransmitter release, mutation of soluble N-ethylmaleimide-sensitive factor attachment protein receptor (SNARE) protein residues thought to line the fusion pore was found to alter neurotransmitter flux from large dense core vesicles (Han et al., 2004). However, determining the impact of a transient fusion pore on synaptic neurotransmitter release requires direct evidence demonstrating that when FM dye release from synaptic vesicles is prevented by transient fusion (kiss-and-run), neurotransmitter release from individual vesicles is also reduced (Sullivan, 2006).
At the lamprey giant synapse, activation of a presynaptic 5-HT GPCR blocks FM1-43 destaining from vesicles that fuse with the plasma membrane (Photowala et al., 2006) and inhibits synaptic transmission via a Gβγ interaction with proteins that mediate vesicle fusion (SNAP-25, syntaxin, and the SNARE complex) (Blackmer et al., 2001, 2005; Gerachshenko et al., 2005). We now show that activation of the same presynaptic GPCR lowers the synaptic cleft glutamate concentration independently of Pr. Based on these results, the most parsimonious conclusion is that a Gβγ interaction with the SNARE complex (Zamponi et al., 1997; Blackmer et al., 2001, 2005; Chen et al., 2005; Gerachshenko et al., 2005) promotes transient fusion (kiss-and-run) and reduces the peak synaptic cleft glutamate concentration by restricting either the size or open time of the fusion pore (Fig. 9E). That a Gβγ interaction with the SNARE complex promotes transient kiss-and-run fusion may appear to be at odds with studies in which loss-of-function synaptotagmin mutants exhibit slower rates of endocytosis (Nicholson-Tomishima and Ryan, 2004). However, it is extremely difficult to compare the impacts of removing synaptotagmin from the synapse to a direct effect on the Gβγ interaction with the SNARE complex.
Alternatively, it is possible that presynaptic Gβγ reduces the synaptic cleft glutamate concentration by lowering the amount of glutamate in synaptic vesicles before fusion. Indeed, quantitative immunogold electron microscopy of glutamatergic Schaffer collateral and parallel fiber terminals reveals that some synaptic vesicles labeled for VGLUT1 or VGLUT2 also contain Gβ-subunits 1–4 (Pahner et al., 2003). Furthermore, the G-protein activator GMppNp inhibits glutamate uptake into mouse and rat brain vesicular preparations (Pahner et al., 2003). In addition to changing the concentration of neurotransmitter, it also appears possible to alter the volume of the vesicle and therefore alter the total amount of neurotransmitter within the vesicle (Colliver et al., 2000; Pothos, 2002; Gong et al., 2003). However, this mechanism appears very unlikely at the lamprey giant synapse because the inhibitory effect of 5-HT is entirely blocked by cleavage of the C-terminal region of the SNARE complex constituent SNAP-25 (Gerachshenko et al., 2005). Thus, the molecular target of Gβγ- and 5-HT-mediated inhibition is consistent with an alteration in vesicle fusion and not filling. Similarly, supporting vesicular fusion apparatus as a target is our recent finding that 5-HT entirely prevents FM1-43 destaining even when vesicles can be demonstrated to fuse with the presynaptic membrane (Photowala et al., 2006).
Another possibility is that activation of G-proteins may promote selective fusion of either smaller vesicles or vesicles with lower glutamate concentrations. However, vesicles with variations in neurotransmitter content appear to have the same probability of fusing (Van der Kloot et al., 2000). In addition, electron microscopy of the lamprey reticulospinal synapse indicates synaptic vesicles are uniform in size (Gustafsson et al., 2002). Perhaps the most compelling evidence against such a mechanism is that there appears to be no correlation between the amplitude and the decay rate of the EPSC (Fig. 6C). Finally, this mechanism could not explain a failure to destain FM1-43 from fusing vesicles seen in 5-HT (Photowala et al., 2006).
We have demonstrated in a previous study (Blackmer et al., 2001; Takahashi et al., 2001) that 5-HT does not alter the amplitude of spontaneous EPSCs recorded from lamprey spinal neurons and had only a very small effect on their frequency. Our present results are entirely consistent with this finding when we consider the mechanism by which 5-HT and Gβγ inhibit transmitter release. Gβγ acts by interfering with Ca2+-dependent synaptotagmin binding to the SNARE complex (Jarvis et al., 2000; Blackmer et al., 2001, 2005; Gerachshenko et al., 2005). Mutation of synaptotagmin inhibits evoked release but not spontaneous release (Geppert et al., 1994), and thus we do not expect an effect of 5-HT on the amplitude of spontaneous events.
Our results provide the first experimental evidence that a GPCR-mediated shift in the mode of vesicle fusion regulates synaptic strength through an alteration in the peak synaptic cleft glutamate concentration and the first direct evidence that kiss-and-run fusion can modify neurotransmitter release. Analysis of the kinetics of NMDA and AMPA receptors suggests fast glutamate flux will activate NMDA and AMPA receptors concurrently, whereas slower rates of glutamate flux are more likely to activate NMDA receptors relative to AMPA receptors (Renger et al., 2001; Popescu et al., 2004). Thus, altering the peak concentration and/or time course of glutamate in the synaptic cleft may allow for differential inhibition or activation of AMPA versus NMDA receptors. Indeed, an increase in synaptic cleft glutamate concentration after induction of long-term potentiation has been proposed to explain the emergence of AMPA synaptic currents at silent synapses in the hippocampus (Choi et al., 2000, 2003; Renger et al., 2001; Krupa and Liu, 2004). Our results demonstrate distinct thresholds for activation of NMDA and AMPA receptors at the lamprey reticulospinal synapse. Furthermore, our findings show that colocalized NMDA and AMPA receptors are differentially inhibited by the same dose of 5-HT. We conclude that presynaptic modulation of synaptic cleft glutamate transients can selectively control activation of NMDA versus AMPA receptor currents present at the same synapse. The differential effect of 5-HT on NMDA and AMPA receptor currents supports our hypothesis of a change in the synaptic cleft glutamate concentration, because a change in Pr would be expected to have an equivalent effect on both glutamate receptor subtypes. Interestingly, both NMDA and AMPA receptor-mediated synaptic currents persist at saturating doses of 5-HT, consistent with our model that 5-HT reduces, but does not eliminate, glutamate release from fusing vesicles.
Within the lamprey spinal cord, activation of presynaptic 5-HT GPCRs alters the output pattern of the neural circuitry that coordinates locomotion (Schwartz et al., 2005). Both experimental and computer modeling studies demonstrate that the affect of 5-HT on the output of this locomotor circuitry is mimicked by decreasing AMPA relative to NMDA receptor currents in spinal neurons (Brodin et al., 1985; Hellgren et al., 1992). Thus, the unique characteristics of this novel form of synaptic inhibition, specifically the differential inhibition of AMPA relative to NMDA receptors, may explain a mechanism in which 5-HT decreases the synaptic cleft glutamate concentration and alters the pattern of locomotor neuronal activity.
Summary
These results and previous work (Blackmer et al., 2005; Gerachshenko et al., 2005; Photowala et al., 2006) reveal a novel mechanism of GPCR-mediated synaptic plasticity. For the first time, a molecular pathway has been identified that targets the formed SNARE complex and modulates the peak concentration of glutamate in the synaptic cleft independently of Pr. Moreover, the differential inhibition of NMDA receptors relative to AMPA receptors by alteration of synaptic cleft glutamate transients demonstrates the potential for profound implications in postsynaptic signaling.
Footnotes
This work was supported by grants from the National Institute of Mental Health and the National Institute of Neurological Disorders and Stroke to S.A. We thank Roy Smetana and Adam Bleckert for critical reading of this manuscript and invaluable discussions.
References
- Aravanis AM, Pyle JL, Harata NC, Tsien RW. Imaging single synaptic vesicles undergoing repeated fusion events: kissing, running, and kissing again. Neuropharmacology. 2003;45:797–813. doi: 10.1016/s0028-3908(03)00310-1. [DOI] [PubMed] [Google Scholar]
- Asztely F, Erdemli G, Kullmann DM. Extrasynaptic glutamate spillover in the hippocampus: dependence on temperature and the role of active glutamate uptake. Neuron. 1997;18:281–293. doi: 10.1016/s0896-6273(00)80268-8. [DOI] [PubMed] [Google Scholar]
- Becherer U, Guatimosim C, Betz W. Effects of staurosporine on exocytosis and endocytosis at frog motor nerve terminals. J Neurosci. 2001;21:782–787. doi: 10.1523/JNEUROSCI.21-03-00782.2001. [DOI] [PMC free article] [PubMed] [Google Scholar]
- Blackmer T, Larsen EC, Takahashi M, Martin TF, Alford S, Hamm HE. G protein βγ subunit-mediated presynaptic inhibition: regulation of exocytotic fusion downstream of Ca2+ entry. Science. 2001;292:293–297. doi: 10.1126/science.1058803. [DOI] [PubMed] [Google Scholar]
- Blackmer T, Larsen EC, Bartleson C, Kowalchyk JA, Yoon EJ, Preininger AM, Alford S, Hamm HE, Martin TF. G protein betagamma directly regulates SNARE protein fusion machinery for secretory granule exocytosis. Nat Neurosci. 2005;8:421–425. doi: 10.1038/nn1423. [DOI] [PubMed] [Google Scholar]
- Brodin L, Grillner S, Rovainen CM. N-Methyl-D-aspartate (NMDA), kainate and quisqualate receptors and the generation of fictive locomotion in the lamprey spinal cord. Brain Res. 1985;325:302–306. doi: 10.1016/0006-8993(85)90328-2. [DOI] [PubMed] [Google Scholar]
- Buchanan JT, Grillner S. 5-Hydroxytryptamine depresses reticulospinal excitatory postsynaptic potentials in motoneurons of the lamprey. Neurosci Lett. 1991;122:71–74. doi: 10.1016/0304-3940(91)90196-z. [DOI] [PubMed] [Google Scholar]
- Buchanan JT, Brodin L, Dale N, Grillner S. Reticulospinal neurones activate excitatory amino acid receptors. Brain Res. 1987;408:321–325. doi: 10.1016/0006-8993(87)90397-0. [DOI] [PubMed] [Google Scholar]
- Chandler DE, Heuser JE. Arrest of membrane fusion events in mast cells by quick-freezing. J Cell Biol. 1980;86:666–674. doi: 10.1083/jcb.86.2.666. [DOI] [PMC free article] [PubMed] [Google Scholar]
- Chen XK, Wang LC, Zhou Y, Cai Q, Prakriya M, Duan KL, Sheng ZH, Lingle C, Zhou Z. Activation of GPCRs modulates quantal size in chromaffin cells through G(betagamma) and PKC. Nat Neurosci. 2005;8:1160–1168. doi: 10.1038/nn1529. [DOI] [PubMed] [Google Scholar]
- Choi S, Klingauf J, Tsien RW. Postfusional regulation of cleft glutamate concentration during LTP at “silent synapses.”. Nat Neurosci. 2000;3:330–336. doi: 10.1038/73895. [DOI] [PubMed] [Google Scholar]
- Choi S, Klingauf J, Tsien RW. Fusion pore modulation as a presynaptic mechanism contributing to expression of long-term potentiation. Philos Trans R Soc Lond B Biol Sci. 2003;358:695–705. doi: 10.1098/rstb.2002.1249. [DOI] [PMC free article] [PubMed] [Google Scholar]
- Clements JD, Lester RA, Tong G, Jahr CE, Westbrook GL. The time course of glutamate in the synaptic cleft. Science. 1992;258:1498–1501. doi: 10.1126/science.1359647. [DOI] [PubMed] [Google Scholar]
- Cochilla AJ, Alford S. Glutamate receptor-mediated synaptic excitation in axons of the lamprey. J Physiol (Lond) 1997;499:443–457. doi: 10.1113/jphysiol.1997.sp021940. [DOI] [PMC free article] [PubMed] [Google Scholar]
- Cochilla AJ, Alford S. Metabotropic glutamate receptor-mediated control of neurotransmitter release. Neuron. 1998;20:1007–1016. doi: 10.1016/s0896-6273(00)80481-x. [DOI] [PubMed] [Google Scholar]
- Colliver TL, Pyott SJ, Achalabun M, Ewing AG. VMAT-mediated changes in quantal size and vesicular volume. J Neurosci. 2000;20:5276–5282. doi: 10.1523/JNEUROSCI.20-14-05276.2000. [DOI] [PMC free article] [PubMed] [Google Scholar]
- Diamond JS, Jahr CE. Transporters buffer synaptically released glutamate on a submillisecond time scale. J Neurosci. 1997;17:4672–4687. doi: 10.1523/JNEUROSCI.17-12-04672.1997. [DOI] [PMC free article] [PubMed] [Google Scholar]
- Dobrunz LE, Stevens CF. Heterogeneity of release probability, facilitation, and depletion at central synapses. Neuron. 1997;18:995–1008. doi: 10.1016/s0896-6273(00)80338-4. [DOI] [PubMed] [Google Scholar]
- Gandhi SP, Stevens CF. Three modes of synaptic vesicular recycling revealed by single-vesicle imaging. Nature. 2003;423:607–613. doi: 10.1038/nature01677. [DOI] [PubMed] [Google Scholar]
- Geppert M, Goda Y, Hammer RE, Li C, Rosahl TW, Stevens CF, Sudhof TC. Synaptotagmin I: a major Ca2+ sensor for transmitter release at a central synapse. Cell. 1994;79:717–727. doi: 10.1016/0092-8674(94)90556-8. [DOI] [PubMed] [Google Scholar]
- Gerachshenko T, Blackmer T, Yoon EJ, Bartleson C, Hamm HE, Alford S. Gbetagamma acts at the C terminus of SNAP-25 to mediate presynaptic inhibition. Nat Neurosci. 2005;8:597–605. doi: 10.1038/nn1439. [DOI] [PubMed] [Google Scholar]
- Gong LW, Hafez I, Alvarez de Toledo G, Lindau M. Secretory vesicles membrane area is regulated in tandem with quantal size in chromaffin cells. J Neurosci. 2003;23:7917–7921. doi: 10.1523/JNEUROSCI.23-21-07917.2003. [DOI] [PMC free article] [PubMed] [Google Scholar]
- Gustafsson JS, Birinyi A, Crum J, Ellisman M, Brodin L, Shupliakov O. Ultrastructural organization of lamprey reticulospinal synapses in three dimensions. J Comp Neurol. 2002;450:167–182. doi: 10.1002/cne.10310. [DOI] [PubMed] [Google Scholar]
- Han X, Wang CT, Bai J, Chapman ER, Jackson MB. Transmembrane segments of syntaxin line the fusion pore of Ca2+-triggered exocytosis. Science. 2004;304:289–292. doi: 10.1126/science.1095801. [DOI] [PubMed] [Google Scholar]
- Harata NC, Choi S, Pyle JL, Aravanis AM, Tsien RW. Frequency-dependent kinetics and prevalence of kiss-and-run and reuse at hippocampal synapses studied with novel quenching methods. Neuron. 2006;49:243–256. doi: 10.1016/j.neuron.2005.12.018. [DOI] [PubMed] [Google Scholar]
- Hays WL. Ed, 4. New York: Holt, Rinehart, and Winston; 1988. Statistics. [Google Scholar]
- Hellgren J, Grillner S, Lansner A. Computer simulation of the segmental neural network generating locomotion in lamprey by using populations of network interneurons. Biol Cybern. 1992;68:1–13. doi: 10.1007/BF00203132. [DOI] [PubMed] [Google Scholar]
- Hessler NA, Shirke AM, Malinow R. The probability of transmitter release at a mammalian central synapse. Nature. 1993;366:569–572. doi: 10.1038/366569a0. [DOI] [PubMed] [Google Scholar]
- Jarvis SE, Magga JM, Beedle AM, Braun JE, Zamponi GW. G protein modulation of N-type calcium channels is facilitated by physical interactions between syntaxin 1A and Gbetagamma. J Biol Chem. 2000;275:6388–6394. doi: 10.1074/jbc.275.9.6388. [DOI] [PubMed] [Google Scholar]
- Kay AR, Alfonso A, Alford S, Cline HT, Holgado AM, Sakmann B, Snitsarev VA, Stricker TP, Takahashi M, Wu LG. Imaging synaptic activity in intact brain and slices with FM1-43 in C. elegans, lamprey, and rat. Neuron. 1999;24:809–817. doi: 10.1016/s0896-6273(00)81029-6. [DOI] [PubMed] [Google Scholar]
- Klyachko VA, Jackson MB. Capacitance steps and fusion pores of small and large-dense-core vesicles in nerve terminals. Nature. 2002;418:89–92. doi: 10.1038/nature00852. [DOI] [PubMed] [Google Scholar]
- Krupa B, Liu G. Does the fusion pore contribute to synaptic plasticity? Trends Neurosci. 2004;27:62–66. doi: 10.1016/j.tins.2003.11.006. [DOI] [PubMed] [Google Scholar]
- Lindau M, Alvarez de Toledo G. The fusion pore. Biochim Biophys Acta. 2003;1641:167–173. doi: 10.1016/s0167-4889(03)00085-5. [DOI] [PubMed] [Google Scholar]
- Lozovaya NA, Kopanitsa MV, Boychuk YA, Krishtal OA. Enhancement of glutamate release uncovers spillover-mediated transmission by N-methyl-D-aspartate receptors in the rat hippocampus. Neuroscience. 1999;91:1321–1330. doi: 10.1016/s0306-4522(98)00638-1. [DOI] [PubMed] [Google Scholar]
- Mainen ZF, Malinow R, Svoboda K. Synaptic calcium transients in single spines indicate that NMDA receptors are not saturated. Nature. 1999;399:151–155. doi: 10.1038/20187. [DOI] [PubMed] [Google Scholar]
- Nicholson-Tomishima K, Ryan TA. Kinetic efficiency of endocytosis at mammalian CNS synapses requires synaptotagmin 1. Proc Natl Acad Sci USA. 2004;101:16401–16402. doi: 10.1073/pnas.0406968101. [DOI] [PMC free article] [PubMed] [Google Scholar]
- Pahner I, Holtje M, Winter S, Takamori S, Bellocchio EE, Spicher K, Laake P, Nurnberg B, Ottersen OP, Ahnert-Hilger G. Functional G-protein heterotrimers are associated with vesicles of putative glutamatergic terminals: implications for regulation of transmitter uptake. Mol Cell Neurosci. 2003;23:398–413. doi: 10.1016/s1044-7431(03)00059-9. [DOI] [PubMed] [Google Scholar]
- Patneau DK, Mayer ML. Structure-activity relationships for amino acid transmitter candidates acting at N-methyl-d-aspartate and quisqualate receptors. J Neurosci. 1990;10:2385–2399. doi: 10.1523/JNEUROSCI.10-07-02385.1990. [DOI] [PMC free article] [PubMed] [Google Scholar]
- Photowala H, Freed R, Alford S. Location and function of vesicle clusters, active zones and Ca2+ channels in the lamprey presynaptic terminal. J Physiol (Lond) 2005;569:119–135. doi: 10.1113/jphysiol.2005.091314. [DOI] [PMC free article] [PubMed] [Google Scholar]
- Photowala H, Blackmer T, Schwartz E, Hamm HE, Alford S. G protein beta{gamma}-subunits activated by serotonin mediate presynaptic inhibition by regulating vesicle fusion properties. Proc Natl Acad Sci USA. 2006;103:4281–4286. doi: 10.1073/pnas.0600509103. [DOI] [PMC free article] [PubMed] [Google Scholar]
- Popescu G, Robert A, Howe JR, Auerbach A. Reaction mechanism determines NMDA receptor response to repetitive stimulation. Nature. 2004;430:790–793. doi: 10.1038/nature02775. [DOI] [PubMed] [Google Scholar]
- Pothos EN. Regulation of dopamine quantal size in midbrain and hippocampal neurons. Behav Brain Res. 2002;130:203–207. doi: 10.1016/s0166-4328(01)00419-3. [DOI] [PubMed] [Google Scholar]
- Renger JJ, Egles C, Liu G. A developmental switch in neurotransmitter flux enhances synaptic efficacy by affecting AMPA receptor activation. Neuron. 2001;29:469–484. doi: 10.1016/s0896-6273(01)00219-7. [DOI] [PubMed] [Google Scholar]
- Richards DA, Bai J, Chapman ER. Two modes of exocytosis at hippocampal synapses revealed by rate of FM1-43 efflux from individual vesicles. J Cell Biol. 2005;168:929–939. doi: 10.1083/jcb.200407148. [DOI] [PMC free article] [PubMed] [Google Scholar]
- Schwartz EJ, Gerachshenko T, Alford S. 5-HT prolongs ventral root bursting via presynaptic inhibition of synaptic activity during fictive locomotion in lamprey. J Neurophysiol. 2005;93:980–988. doi: 10.1152/jn.00669.2004. [DOI] [PubMed] [Google Scholar]
- Shupliakov O, Bloom O, Gustafsson JS, Kjaerulff O, Low P, Tomilin N, Pieribone VA, Greengard P, Brodin L. Impaired recycling of synaptic vesicles after acute perturbation of the presynaptic actin cytoskeleton. Proc Natl Acad Sci USA. 2002;99:14476–14481. doi: 10.1073/pnas.212381799. [DOI] [PMC free article] [PubMed] [Google Scholar]
- Stevens CF, Williams JH. “Kiss and run” exocytosis at hippocampal synapses. Proc Natl Acad Sci USA. 2000;97:12828–12833. doi: 10.1073/pnas.230438697. [DOI] [PMC free article] [PubMed] [Google Scholar]
- Sudhof TC. The synaptic vesicle cycle. Annu Rev Neurosci. 2004;27:509–547. doi: 10.1146/annurev.neuro.26.041002.131412. [DOI] [PubMed] [Google Scholar]
- Sullivan JM. Synaptic vesicles caught kissing again. Neuron. 2006;49:167–168. doi: 10.1016/j.neuron.2006.01.003. [DOI] [PubMed] [Google Scholar]
- Takahashi M, Freed R, Blackmer T, Alford S. Calcium influx-independent depression of transmitter release by 5-HT at lamprey spinal cord synapses. J Physiol (Lond) 2001;532:323–336. doi: 10.1111/j.1469-7793.2001.0323f.x. [DOI] [PMC free article] [PubMed] [Google Scholar]
- Tong G, Jahr CE. Multivesicular release from excitatory synapses of cultured hippocampal neurons. Neuron. 1994;12:51–59. doi: 10.1016/0896-6273(94)90151-1. [DOI] [PubMed] [Google Scholar]
- Van der Kloot W, Colasante C, Cameron R, Molgo J. Recycling and refilling of transmitter quanta at the frog neuromuscular junction. J Physiol (Lond) 2000;523:247–258. doi: 10.1111/j.1469-7793.2000.00247.x. [DOI] [PMC free article] [PubMed] [Google Scholar]
- Zakharenko SS, Zablow L, Siegelbaum SA. Altered presynaptic vesicle release and cycling during mGluR-dependent LTD. Neuron. 2002;35:1099–1110. doi: 10.1016/s0896-6273(02)00898-x. [DOI] [PubMed] [Google Scholar]
- Zamponi GW, Bourinet E, Nelson D, Nargeot J, Snutch TP. Crosstalk between G proteins and protein kinase C mediated by the calcium channel alpha1 subunit. Nature. 1997;385:442–446. doi: 10.1038/385442a0. [DOI] [PubMed] [Google Scholar]