

Abstract
Cortical computations are an emergent property of neural dynamics. To understand how neural dynamics emerges within local cortical networks, we characterized the development and underlying mechanisms of spontaneous dynamics in cortical organotypic slices. We observed not only a quantitative increase in the levels of spontaneous dynamics, but a qualitative transition from brief bursts of activity to well defined Up states during the first 4 weeks in vitro. Analysis of cellular and synaptic properties indicates that these changes are driven by increasing excitatory drive accompanied by changes in the balance of excitation and inhibition. Examination of the structure of spontaneous dynamics revealed no evidence of precisely repeating patterns. Slices exposed to chronic patterned stimulation exhibited decreased levels of spontaneous activity, suggesting homeostatic control of the levels of network activity. Together, these results suggest that Up states reflect a fundamental mode of network dynamics that emerges through the orchestrated regulation of multiple cellular and synaptic properties in parallel.
Keywords: Up states, cortex, learning and memory, network dynamics, plasticity, spontaneous activity
Introduction
Cortical computations rely not on isolated activity within single cells, but on complex spatial-temporal patterns of activity within cortical networks (that is, on neural dynamics) (Gawne et al., 1996; Ringach et al., 1997; Wessberg et al., 2000; Vogels et al., 2005). Although significant advances have been made regarding cellular and synaptic function, it remains unclear how millions of synapses from the thousands of recurrently connected neurons within a local cortical network are regulated in parallel in a manner that prevents runaway excitation yet allows for controlled propagation of activity.
Recent studies of spontaneous dynamics have provided some insights into the mechanisms of activity propagation in cortical networks (Sanchez-Vives and McCormick, 2000; Cossart et al., 2003; Petersen et al., 2003; Shu et al., 2003a; Massimini et al., 2004; Volgushev et al., 2006). Spontaneous activity and prolonged network activity known as Up states have been observed in vivo under anesthesia (Metherate and Ashe, 1993; Steriade et al., 1993; Cowan and Wilson, 1994; Kerr et al., 2005; Haider et al., 2006; Mokeichev et al., 2007), during sleep (Timofeev et al., 2001), and during quiet wakefulness (Petersen et al., 2003; Luczak et al., 2007), as well as in acute (Shu et al., 2003b; Kerr et al., 2005) and organotypic slices (Plenz and Kitai, 1998; Echevarria and Albus, 2000; Kerr and Plenz, 2004). Recurrent activity between excitatory neurons accompanied by a concurrent increase in inhibition contributes to the prolonged depolarization observed during Up states (Sanchez-Vives and McCormick, 2000; Bazhenov et al., 2002; Compte et al., 2003; McCormick et al., 2003; Shu et al., 2003a; Haider et al., 2006). However, although they are dependent on positive feedback within a recurrent network, Up states are highly distinct from the uncontrolled, run-away excitation associated with epileptic or disinhibited circuits (Connors, 1984; Prince and Tseng, 1993; Steriade and Amzica, 1999; Timofeev et al., 2004). Indeed, the presence of Up states in vivo and in vitro indicates that mechanisms are in place to actively maintain these states.
To bridge the gap between our understanding of isolated cellular and synaptic properties and emergent network properties, we have analyzed the development, plasticity, and potential mechanisms of spontaneous activity in cortical networks in vitro. We show a gradual developmental transition from brief bouts of spontaneous activity to network-wide Up states. Characterization of a number of cellular and synaptic properties indicates that the developmental increase in spontaneous activity is associated with increases in synaptic excitation and inhibition but not with increased intrinsic excitability. Furthermore, we demonstrate that external stimulation of organotypic slices in vitro reduces the levels of spontaneous activity throughout the network, thus supporting the notion of an actively maintained trade-off between internally and externally generated activity. We speculate that the developmental emergence of spontaneous activity is necessary to engage activity-dependent forms of plasticity that in turn enable networks to achieve states that support neural dynamics yet keep runway excitation in check.
Materials and Methods
Organotypic slice preparation.
Organotypic slices were prepared using the interface method (Stoppini et al., 1991; Buonomano, 2003). Sprague Dawley rats (7 d of age) were anesthetized with isoflurane and decapitated. The brain was removed and placed in chilled cutting media. Coronal slices (400 μm thickness) containing primary somatosensory cortex were cut using a vibratome and placed on Millipore (Billerica, MA) filters (MillicellCM) with 1 ml of culture media. Culture media was changed 1 and 24 h after cutting and every 2–3 d thereafter. Cutting media consisted of Eagle's minimum essential medium (EMEM; catalog number 15-010; MediaTech, Herndon, VA) plus 3 mm MgCl2, 10 mm glucose, 25 mm HEPES, and 10 mm Tris base. Culture media consisted of EMEM plus 4 mm glutamine, 0.6 mm CaCl2, 1.85 mm MgSO4, 30 mm glucose, 30 mm HEPES, 0.5 mm ascorbic acid, 20% horse serum, 10 U/L penicillin, and 10 μg/L streptomycin. Slices were incubated in 5% CO2 at 35°C for 4–30 d.
Electrophysiology.
Recordings were made from regular-spiking, supragranular pyramidal neurons (Dong and Buonomano, 2005) located <500 μm from the external surface of the cortex using infrared-differential interference contrast visualization. Dual recordings were performed for the experiments demonstrated in Figure 2A. Experiments were performed in artificial CSF (ACSF) composed of (in mm) 125 NaCl, 2.5 KCl, 2 MgSO4, 26.2 NaHCO3, 1 NaH2PO4, 25 glucose, and 2.5 CaCl2. There are some differences in the ionic composition of the standard culture media and standard ACSF: for example, the former contains 5.1 mm KCl and 2.6 mm MgSO4 (Stoppini et al., 1991). Thus, we performed some experiments, including those in Figure 8, in a “culture media-ACSF” (CM-ACSF), developed to match the ionic concentrations of the culture media. CM-ACSF was composed of (in mm) 125 NaCl, 5.1 KCl, 2.6 MgSO4, 26.1 NaHCO3, 1 NaH2PO4, 25 glucose, and 2.6 CaCl2.
Figure 2.

Increased frequency and duration of Up states. A, Simultaneous recordings from two neurons located 1.9 mm apart demonstrate that the observed Up states are a network-wide phenomenon and that Up state onset is highly synchronized throughout the network. Mean onset difference for 12 pairs of neurons separated by 1.7–2.9 mm is 19.7 ms (range, 9.2–30.7 ms). B, Up state frequency significantly increases during the first 4 weeks in vitro (ANOVA, F(3,64) = 15.54; p < 0.0001). C, The duration of individual Up states also significantly increases during this time period (ANOVA, F(3,64) = 16.30; p = 0.0001). Numbers of neurons and slices are the same as in Figure 1.
Figure 8.

Plasticity of spontaneous activity. Slices were stimulated for 2–4 d at 1–2 Hz via chronically implanted electrodes and compared with sister control slices. A, The stimulation protocol generally evoked strong subthreshold PSPs but not network activity. The response to the stimulation was similar in both stimulated slices (example on left) and unstimulated control slices (example on right). B, Less spontaneous activity is observed in slices given chronic stimulation (left) than in sister control slices (right). For the example shown, 20 sweeps of 20 s were recorded, although for easier visualization only 10 sweeps are shown. C, Stimulated slices show a significant decrease in both the frequency (Freq) of spontaneous events and event area (Area), demonstrating plasticity of spontaneous activity [t = 17.01, p < 0.001 for frequency; t = 5.83, p < 0.05 for area; stimulated, n = 21 (9); control, n = 20 (9)].
The internal solution for whole-cell recordings contained (in mm) 100 K-gluconate, 20 KCl, 4 ATP-Mg, 10 phospho-creatine, 0.03 GTP-Na, and 10 HEPES and was adjusted to pH 7.3 and 300 mOsm. In recordings used to examine the synaptic conductances, the internal solution contained (in mm) 115 K-gluconate, 5 KCl, 4 ATP-Mg, 10 phospho-creatine, 0.03 GTP-Na, 10 HEPES, and 4 QX-314 to block voltage-gated sodium channel-dependent action potentials. For the experiment shown in Figure 5C, 10 μm 6-cyano-7-nitroquinoxaline-2,3-dione (CNQX) and 50 μm 2-amino-5-phosphonovaleric acid (APV) were added to the ACSF. Recordings were sampled at 10 kHz, digitized using a CED micro1401 board (Cambridge Electronic Design, Cambridge, UK), and saved for off-line analysis. All analyses were performed using custom-written software in Matlab (MathWorks, Natick, MA).
Figure 5.

Balance of excitation and inhibition changes with development. A, Synaptic currents recorded in response to extracellular stimulation at four holding potentials: −90, −60, −30, and 0 mV. B, Instantaneous I–V plots were obtained for each millisecond of the response, the slope of which is equal to the synaptic conductance. C, The conductance was separated into excitatory (black trace) and inhibitory (gray trace) components (see Materials and Methods). Application of 10 μm CNQX and 50 μm APV resulted in a large decrease in the calculated excitatory component and a partial decrease in the inhibitory component (attributable to a decrease in feedforward excitation onto inhibitory neurons; the recorded neuron was in close proximity to the stimulating electrode to recruit monosynaptic inhibition). D, The excitatory/inhibitory conductance ratio (gE/gI) was calculated from neurons at 1–3 weeks in vitro and was found to decrease with development [ANOVA, F(2,31) = 7.16; p < 0.005; week 1, n = 13 (4); week 2, n = 9 (4); week 3, n = 10 (4)]. E, For both excitatory and inhibitory conductances, the time to reach peak decreased with development (ANOVA, F(2,31) = 6.61, p < 0.005 for excitatory conductance in black; F(2,31) = 30.72, p < 0.0001 for inhibitory conductance in gray). By the third week in vitro, the conductances peak simultaneously.
Stimulating electrodes.
Bipolar stimulating electrodes were placed in the upper cortical layers and single 100 μs pulses of various intensities (30–140 μA) were applied every 20 s to elicit synaptic responses. To examine the input/output (I/O) function, the stimulation intensity was varied from one that elicited the smallest observable response to one that elicited a maximum initial slope (defined as the first EPSP beginning within 20 ms after the stimulation pulse). In experiments examining synaptic conductances, an intensity that evoked a maximum initial response slope (as observed in current-clamp mode) was used. For chronic stimulation and longitudinal experiments, bipolar platinum-iridium microelectrodes (25 μm in diameter) were placed in the upper cortical layers between the slice and the Millipore filter on the day of slicing. The microelectrodes were attached to leads consisting of copper wires that were connected to the stimulus isolator for chronic stimulation. These implanted electrodes remained in place throughout the culture period.
Quantification of spontaneous activity.
For each neuron, a minimum of 5 min of spontaneous activity was recorded. Spontaneous events were defined as those in which membrane potential crossed a set threshold. We used a threshold of 5 mV above resting potential for the analyses presented here. There was no qualitative change in the data when using different thresholds, but a 5 mV threshold allowed us to focus primarily on network activity (the firing of multiple presynaptic neurons), as opposed to miniature EPSPs (mEPSPs) or unitary EPSPs; paired recordings in acute and organotypic slices generally reveal maximum unitary synaptic strength to be <2.5 mV (Markram et al., 1997; Debanne et al., 1998). Event area was defined as the average area (in mV · s) of the recorded trace above threshold during a sweep of 30 s as calculated from 10 sweeps, and event time was the percentage of recording time spent above threshold. An Up state was defined as an event that remained above threshold for no less than 500 ms. During a network activation such as an Up state, the membrane potential would often make multiple brief passes above and below this threshold before returning to resting potential. For this reason, a minimum interevent interval of 100 ms was used as a criterion in defining separate events. ANOVA was used to determine significance of developmental changes in spontaneous activity measures. The amount of spontaneous activity observed in cultures of the same age displays significant variation. We attribute this variability to two sources: (1) variability across individual animals/preparations as has been noted previously (Echevarria and Albus, 2000; Wagenaar et al., 2005); and (2) variability in the chemical composition of different batches of horse serum used to make the media. For these reasons, each analysis used the same group of animals across ages and a consistent batch of horse serum in the media to reduce variability.
I/O function.
For analysis of the input/output function, measurements were made from cells located an average of ∼750 μm from the stimulating electrode to not recruit direct monosynaptic inhibition. The stimulation intensity (six to eight intensities per neuron) was plotted against the slope of the initial response. These points were fit with a sigmoid function (Marder and Buonomano, 2003), and the asymptote was used as a measure of maximum synaptic strength. Plots with incomplete datasets or that were not well fit with the sigmoid function were not included in the analysis. ANOVA was used to determine significance of the developmental change in the asymptote. To assess the correlation of synaptic strength and level of spontaneous activity, for each neuron regardless of age, the asymptote of the I/O was plotted against the mean duration of spontaneous events, which were observed as bouts of polysynaptic activity or Up states. Statistical significance was ascertained by linear regression of all points. In longitudinal experiments, the I/O analysis was performed as described above, but after the first recording, the slice was returned to the incubator for 5–7 d, after which the I/O analysis was performed a second time. In one case, the slice was returned to the incubator a second time, and the I/O analysis was performed a third time. Two to three neurons were recorded during each session, and the average asymptote was plotted versus days in vitro (DIV). Significance was determined by a paired t test.
Conductance measurements.
To examine synaptic conductances, the intracellular solution included 4 mm QX-314 to block action potential generation, and the K-gluconate and KCl were adjusted as described above to set the chloride reversal potential at −84 mV. Recordings were performed in voltage-clamp mode, and the response to stimulation that generated a maximum initial response slope (as observed in current-clamp mode) was recorded at holding potentials of −90, −60, −30, and 0 mV. Instantaneous current–voltage (I–V) plots were created for each millisecond time point in the response using the holding potential and the synaptic current (Isyn) as calculated from the total recorded current according to Isyn(t) = [(Rin + Rs)/Rin]ΔI(t), where Rin is the input resistance, Rs is the series resistance, and ΔI(t) is the difference between the total recorded current at time t and the baseline current (Wehr and Zador, 2003). The slope of the I–V relationship is the synaptic conductance (gsyn). gsyn was decomposed into the excitatory (gE) and inhibitory (gI) components by assuming gsyn = gE + gI and Esyn = [gE × EE + gI × EI]/(gE + gI), where Esyn, EE, and EI are the synaptic, excitatory, and inhibitory reversal potentials, respectively. EE of 0 mV and EI of −84 mV were used based on the ionic composition of ACSF and the intracellular solution. Esyn was determined from the intercept of the I–V plot. The above system of equations results in gI = [gsyn(EE − Esyn)]/(EE − EI) and gE = gsyn − gI. Note that these calculations were performed for each time point of the response. To verify the validity of this method, in three experiments conductances were calculated before and after the block of excitatory currents using 10 μm CNQX/50 μm APV (see Fig. 5C, Results). For these experiments, we recorded from neurons located in close proximity to the stimulating electrode to observe monosynaptic inhibitory currents (because CNQX and APV also block feedforward excitation onto inhibitory neurons). Significance of developmental changes in gE/gI ratios and conductance peak times was determined by ANOVA.
Structure of spontaneous activity.
Because younger slices show little or no spontaneous activity, and because there is some variability in the number of spontaneous events in each neuron, this analysis was performed in a subset of 12 neurons for which at least 12 events were recorded. All spontaneous events were extracted into individual 3 s segments starting at the time of first threshold crossing. The segments were aligned according to the time of the threshold crossing (aligning according to the peak of the cross-correlation did not alter the results). Correlation coefficients were calculated including a 20 ms window before onset and 20 ms after offset (as defined by the final reverse threshold crossing within the 3 s segment). Note that because segments have differing offsets, the correlations were calculated using the offset time for the longest event of each pair. Segments of fixed duration were not used because of the bias this produces toward high correlations for short bouts of activity. Only segments with at least 500 ms of activity within the 3 s segments were used. Results were not qualitatively different when only Up state events (i.e., events with at least 500 ms of continuous activation) were used. By calculating the correlation coefficient between all segments from within each cell (see Fig. 7, “Within Cell” group), a correlation matrix was constructed and used to calculate the mean correlation. For visualization purposes, the correlation matrix was used to create a “similarity matrix” by clustering events according to the euclidean distances between the correlation coefficients (clustering was performed in Matlab using PDIST, LINKAGE, and CLUSTER functions) (see Fig. 6A, left). For the statistical analyses of the correlation coefficients, the z-transform was used (Zar, 1984). A “match index” was calculated as the proportion of possible matches with a correlation coefficient >0.5.
Figure 7.
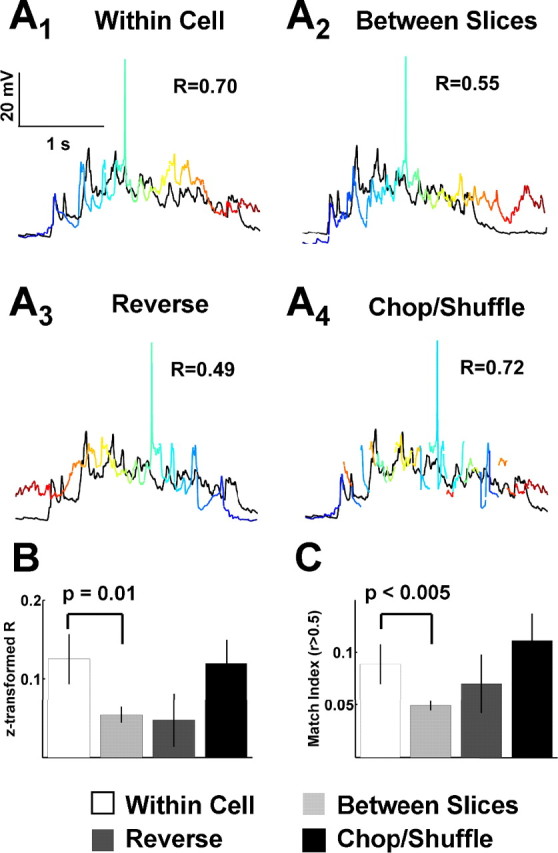
Similarity of spontaneous event patterns within neurons results from global structure, not precise temporal patterns. Spontaneous event structure was assessed by comparing spontaneous events to all other events within the same cell (within cell), to other events in different cells from different slices (between slices), to events from the same cell that were reversed in order (reverse), and to events from the same cell that were chopped and shuffled (chop/shuffle). A1, Within cell. Here, the black event trace is compared with another event trace from the same cell in which the color transitions in time from blue to red. A2, Between slices. The black trace is the same as in A1, but the colored trace is from another cell. A3, Reverse. These are the same traces as in A1, but the colored trace is reversed in time: the color now changes from red to blue instead of blue to red as in A1. A4, Chop/shuffle. Here, the colored trace was chopped into 100 ms segments and shuffled in order while leaving the initial and final segments in place to preserved the global event shape. Again, the color indicates the timing of the original event as shown in A1 as a progression from blue to red. B, For the conditions described above, the mean z-transformed correlation coefficient (see Materials and Methods) was calculated for all cells and then averaged for each condition. The within cell mean correlation coefficient is significantly higher than that of the between slice case (t = 2.61; p = 0.01); however, neither the reverse nor the chop/shuffle controls are significantly different from the within case. C, Here, the same between, reverse, and chop/shuffle controls are compared with the within cell case, but the measure is the percentage of matches per cell with a correlation coefficient >0.5, referred to as the match index. Again, the within cell case is significantly higher than the between slice case (t = 3.0; p < 0.005), but not significantly different from the reverse or chop/shuffle controls. B, C, n = 12 cells and slices.
Figure 6.
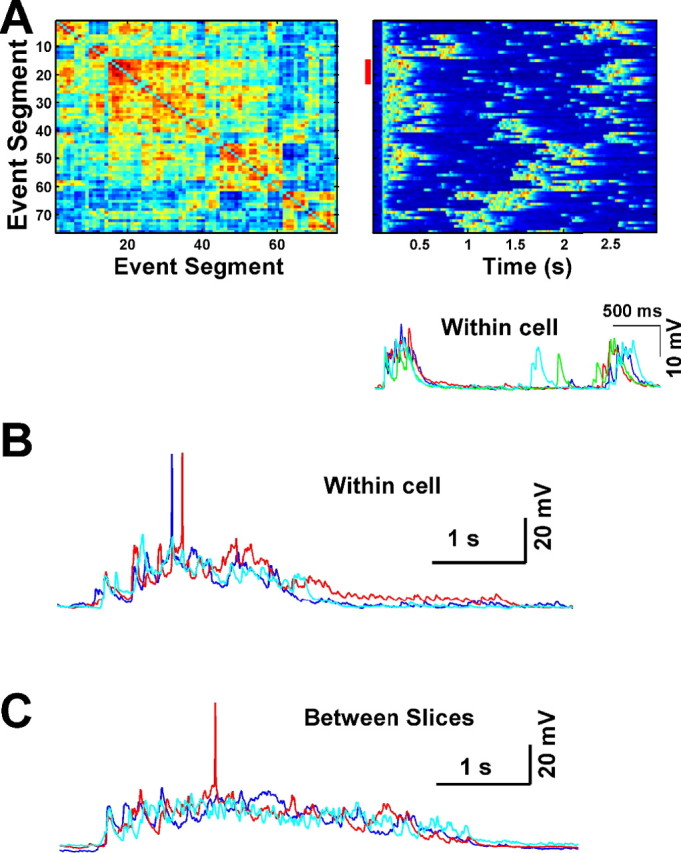
Comparing spontaneous event structure. A, A clustered correlation matrix is created for each neuron by comparing each spontaneous event segment with every other spontaneous event segment and sorting according to similarity. Left, A sorted correlation matrix of 76 spontaneous event segments in which correlation is depicted in color (blue indicates low correlation, red is high correlation, and values range from −0.60 to 0.84). Groups of similar events are observed as blocks of red. Right, The event traces, sorted according to similarity. Note that the order is the same as the y-axis in the left panel. Changes in membrane potential are depicted in color (range from −80 mV in blue to −50 mV in red). Bottom, An example of a group of highly correlated events (r >0.5), which are indicated in the right panel by a red line near the y-axis. For this group, correlation arises not only from the similar pattern of the spontaneous PSPs, but also from the similar intervals between two PSPs. B, An example of similar Up states observed from a single neuron. C, Similarity is also observed within Up states from different slices. Here, each trace is an event segment from one of three different neurons, each from a different slice.
A number of different controls were used to estimate the expected correlation and match indices in the absence of repeating patterns. Specifically, these same measures were quantified by comparing spontaneous event segments between cells (from different slices, because cells in the same network might be expected to demonstrate similar structure) or event segments from the same cell while one segment was either reversed in time or “chopped and shuffled” (“between slice,” “reverse,” and “chop/shuffle” groups, respectively) (see Fig. 7A for examples). In the latter analysis, the segments were chopped into subsegments of 100 ms (sizes from 50 to 200 ms were also examined, without any qualitative change in the results). These segments were then randomly shuffled to build a new trace, which was compared with each of the original segment traces. The first and last subsegments of the trace were not altered, because much of the correlation comes from the common onset time of the aligned EPSPs. Thus, removing the onset segments would decrease the correlations that are produced by the alignments, as opposed to the actual structure of the spontaneous patterns. Significance between groups was determined using t tests.
Chronic stimulation.
Slices >2 weeks of age (range, 14–32 DIV; mean, 20) were used in these experiments to provide sufficient baseline activity to detect differences between control and chronically stimulated slices. To control for variability, we used pairs of “sister” slices that were prepared from the same animal, used the same culture media, were of the same age at recording time, and were both implanted with chronic stimulating electrodes. One slice of the pair received chronic stimulation, whereas the other control slice was treated in the same manner except for the stimulation. Implanted electrodes were used to administer single, biphasic 100 μs pulses (80–150 μA) at 1–2 Hz for 2–4 d while the slices were in the incubator. High stimulation intensities were used for the chronic stimulation with the intent of evoking strong local responses; at intermediate intensities, it is common to observe network activity that is diminished with higher stimulation intensity, presumably because of recruitment of large amounts of inhibition. Spontaneous activity recording was performed as described above in CM-ACSF. Event frequency and event area were calculated as described above, and significance was determined using t tests. The distance from the recorded neuron to the stimulating electrodes was estimated using the x–y coordinates of the micromanipulator (model MP-285; Sutter Instrument, Novato, CA).
Results
Developmental changes in spontaneous activity
To characterize the development of spontaneous dynamics in cortical networks, we performed whole-cell recordings from pyramidal cells of cortical organotypic slices cultured for 4–30 d. Changes in the postsynaptic potential (PSP) profile during a bout of spontaneous activity reflect the spatial-temporal firing pattern of a subset of neurons in the network. Thus, quantification of the levels of postsynaptic activity or its structure provides a measure of network dynamics (Buonomano, 2003; MacLean et al., 2005).
To quantify the degree of spontaneous network activity, we measured mean event frequency, time, and area (see Materials and Methods). Spontaneous event onset was defined by deflections in membrane potential that crossed a threshold set at 5 mV above rest, resulting primarily in the inclusion of correlated events produced by multiple presynaptic neurons firing in concert (see Materials and Methods) (Slutsky et al., 2004). There was a significant increase in the frequency of events with development until the third week in vitro (Fig. 1B) [ANOVA, F(3,64) = 6.96; p < 0.001; week 1, n = 16 (6); week 2, n = 26 (11); week 3, n = 11 (5); week 4, n = 12 (4), where n represents the number of neurons, and the number in parentheses represents the number of slices]. Mean event time (Fig. 1C) and mean event area (Fig. 1D) (a function of both event time and amplitude defined as the area above threshold during a 30 s sweep averaged over 10 sweeps) both significantly increased during the first 4 weeks in vitro (ANOVA, F(3,64) = 4.07, p < 0.05, and F(3,64) = 8.22, p < 0.0001, respectively). Visual inspection and autocorrelation of recordings revealed no periodicity to the spontaneous activity.
Figure 1.

Spontaneous activity increases with development culminating in the generation of Up states. A, Spontaneous activity was recorded in cortical organotypic slices during the first through fourth weeks in vitro. The bottom of each panel (A1–A4) depicts 10 30 s sweeps from a cell at the indicated age. Voltage is represented in color (see color bar in A1; color range is −70 mV in blue to −40 mV in red). The trace in the top of each panel corresponds to the first sweep and is shown for comparison. A developmental change is observed in the quantity and mode of spontaneous events. During the first week in vitro, few spontaneous correlated events are observed. In the second week in vitro, PSPs and, in some cells, a few short duration Up states are observed. By the third and fourth weeks, slices exhibit longer-duration PSPs and Up states, which sometimes occur with spontaneous spiking. B, C, With development, there is a significant increase in spontaneous event frequency (B) (ANOVA, F(3,64) = 6.96; p < 0.001) and event time (C), which is the percentage of time spent above threshold (ANOVA, F(3,63) = 4.07; p < 0.05). D, Event area, a combined measure of event time and amplitude (reported as area during a 30 s sweep calculated from an average of 10 sweeps), also significantly increases with time in culture (ANOVA, F(3,64) = 8.22; p < 0.0001). E, Example of the bimodal voltage distribution of a neuron displaying Up states. The histogram represents the time spent at each observed membrane potential (in 0.5 mV by 1 ms bins) for a sample neuron recorded at 27 DIV. Because of the small percentage of time spent in Up states, the second peak tends to be much smaller than the peak at resting potential. To visualize the second peak on the same scale, we used segments of 10 s, which began at spontaneous event onset. B–D, 4–7 DIV, n = 16 (6); 8–14 DIV, n = 26 (11); 15–21 DIV, n = 11 (5); >21 DIV, n = 12 (4); for all figures, n represents the number of neurons, and the number in parentheses represents the number of slices.
Although the above measures demonstrate an increase in spontaneous network activity with in vitro development, they do not capture the qualitative changes in the structure or mode of spontaneous dynamics. The modes of spontaneous activity can be loosely placed in three groups: (1) isolated, correlated events presumed to be produced by the synchronous firing of a few presynaptic neurons; (2) polysynaptic events, defined by a burst of activity that generated clear multipeaked PSPs that lasted a few hundred milliseconds (Fig. 1A2); and (3) Up states defined by a depolarizing “step” and a bimodal membrane potential distribution (Fig. 1A3,A4,E) (Wilson and Kawaguchi, 1996). We observed a progressive transition, from mostly single correlated events occurring during the first week in vitro to polysynaptic activity and a few shorter-duration Up states developing in the second week to the presence of longer-duration Up states in the third and fourth weeks. Figure 1E illustrates of the occurrence of Up states within a neuron (at 27 d in vitro), as shown by the voltage distribution with one peak near resting potential and a second peak 10–15 mV depolarized from rest.
Our initial aim was to characterize a developmental increase in the amount of total spontaneous activity; however, one of the most striking and robust observations was the emergence of Up states. Before further characterizing the emergence of Up states, we wanted to verify that the prolonged depolarizations that we observed indeed reflected a network-wide transition into a depolarized “on” state. Toward this goal, we performed paired intracellular recordings from neurons located 1.7–2.9 mm apart (average, 2.2 mm) (Fig. 2A). In 12 pairs of neurons (mean DIV, 15; range, 10–31), whenever an Up state, defined as a prolonged depolarization above threshold lasting at least 500 ms, was observed in one neuron, it was always simultaneously present in the second neuron. Interestingly, Up state onsets were highly synchronized, with an average onset difference of 19.7 ms (range, 9.2–30.7 ms). Figure 2A demonstrates this onset synchrony in simultaneous recordings of two neurons located 1.9 mm apart. In additional analysis of the recordings from Figure 1, we found that Up states were never observed during the first week in vitro, and the percentage of cells/slices exhibiting Up states increased from 38/50% during the second week in vitro to 82/100% during the third and 83/100% during the fourth week. Also, Up state frequency (Fig. 2B) [ANOVA, F(3,64) = 15.54; p < 0.0001; week 1, n = 16 (6); week 2, n = 26 (11); week 3, n = 11 (5); week 4, n = 12 (4)] and the mean duration of individual Up states (Fig. 2C) (ANOVA, F(3,64) = 16.30; p < 0.0001) significantly increased during this time period. Up state occurrence was variable both within a cell and across experiments. Indeed, Up states were not observed in all neurons from the older age groups.
In the above experiments, slices were incubated in culture media, and the electrophysiological recordings took place in standard ACSF. The compositions of these solutions differ in relation to both K+ and Mg2+ concentrations (see Materials and Methods). To ensure that the developmental results were not influenced by the transition between solutions, similar experiments were also performed in CM-ACSF (see Materials and Methods). As shown in supplemental Figure 1 (available at www.jneurosci.org as supplemental material), there was not a qualitative difference in the developmental increase in spontaneous activity. Together, these results establish that there is a developmental increase in spontaneous activity; however, this change does not reflect a simple quantitative increase in activity. Rather, there is a qualitative transition in the mode of spontaneous dynamics.
Developmental decrease in intrinsic excitability
The increase in levels of spontaneous activity and the emergence of Up states indicate the presence of ongoing forms of cellular and synaptic plasticity that are independent of external inputs. We next examined the development of a number of potential cellular and synaptic properties that could underlie the changes in spontaneous activity.
Intrinsic excitability has previously been shown to undergo homeostatic plasticity in response to pharmacological manipulations of network activity (Desai et al., 1999; Aptowicz et al., 2004; Karmarkar and Buonomano, 2006), and plasticity of intrinsic excitability is proposed to play a role in governing levels of spontaneous activity (Turrigiano and Nelson, 2004; Zheng et al., 2006). We investigated the possibility that increases in intrinsic excitability contribute to the developmental increase in spontaneous activity. The number of action potentials evoked from a 250 ms current step was recorded for current intensities of 0.05, 0.1, 0.2, and 0.3 nA (Fig. 3A) and compared across developmental stages. Excitability was found to undergo a significant decrease with age until reaching a plateau at the third week in vitro (Fig. 3B) [two-way ANOVA, F(6,170) = 21.36; p < 0.001; week 1, n = 9 (5); week 2, n = 24 (12); week 3, n = 10 (5); week 4, n = 10 (4)]. Additionally, there was a significant decrease in input resistance (Fig. 3C) (ANOVA, F(3,59) = 4.48; p < 0.01), and resting membrane potential became more hyperpolarized (Fig. 3D) [ANOVA, F(3,59) = 3.48; p < 0.05; week 1, n = 14 (6); week 2, n = 23 (10); week 3, n = 11 (5); week 4, n = 12 (4) for both input resistance and resting membrane potential measurements]. Alone, these changes would predict a decrease in network activity. Thus, developmental changes in intrinsic excitability are not responsible for the observed increases in spontaneous dynamics.
Figure 3.

Developmental changes in intrinsic properties. A, To measure intrinsic excitability and input resistance, 250 ms current steps of −0.1, 0.05, 0.1, 0.2, and 0.3 nA were injected intracellularly, and the number of action potentials evoked or the change in membrane potential (in response to the −0.1 nA current step) was recorded. B, Intrinsic excitability decreases with development, as evidenced by a significant decrease in the number of action potentials elicited in older slices [2-way ANOVA, F(6,170) = 21.357; p < 0.001; week 1, n = 7 (5); week 2, n = 21 (12); week 3, n = 10 (5); week 4, n = 10 (4)]. For visualization, the week 4 plot was shifted downward 5%. C, Input resistance significantly decreases with development (ANOVA, F(3,59) = 4.48; p < 0.01). D, Resting membrane potential becomes more hyperpolarized with development (ANOVA, F(3,59) = 3.48; p < 0.05). For input resistance and resting membrane potential, week 1, n = 14 (6); week 2, n = 23 (10); week 3, n = 11 (5); week 4, n = 12 (4).
Increase in spontaneous activity correlates with increases in synaptic efficacy
Up states rely on recurrent activity (Sanchez-Vives and McCormick, 2000) and thus require a minimal level of excitatory drive to be capable of maintaining a depolarized state. Therefore, we examined changes in the evoked excitatory drive as a function of development. To characterize the effective excitatory drive, input–output curves were derived using evoked stimulation (Fig. 4A). The slope of the initial response was plotted against the stimulation intensity and fit with a sigmoid (Fig. 4B). The asymptote of the fit provided a measure of the maximum excitatory drive. Recordings from slices at 4–30 DIV showed that asymptote values increased with age (Fig. 4C) [ANOVA, F(3,47) = 4.71; p < 0.01; week 1, n = 14 (5); week 2, n = 20 (10); week 3, n = 10 (5); week 4, n = 5 (2)]. This finding was further confirmed by taking advantage of the ability to perform multiple recording sessions in the same slices (recording from different neurons). In these longitudinal experiments, a second recording session was performed 5–7 d after the first (Fig. 4E), and for one slice, a third recording session was performed 7 d after the second. Because the stimulating electrodes were chronically implanted (see below and Materials and Methods), input–output curves are derived from the same stimulation site, albeit from different postsynaptic neurons. Plotting the mean asymptote (from two to three neurons) against the age for each successive recording session revealed a significant increase in mean asymptotes at the later recording sessions [paired t test, t = 4.58; p = 0.01; n = 25 (4)], establishing that within a slice, the same excitatory pathway undergoes potentiation over the course of a few days. Additionally, plotting average event duration against asymptotes (for cells from all age groups in the I/O experiments above) revealed a significant correlation (Fig. 4D) [r = 0.30; p < 0.05; n = 49 (22)]. Although our results cannot establish causality, they are consistent with the notion that increases in synaptic strength contribute to the development of spontaneous activity and Up states.
Figure 4.

Developmental increase in excitatory drive. A, Input–output functions were created using extracellular electrodes to stimulate with six increasing current intensities at the time indicated by the arrow. B, The slope of the initial response was plotted versus stimulation intensity, and the points were fit with a sigmoid. The asymptote was used as a measure of maximal excitatory synaptic drive. C, Input–output functions recorded from neurons at 1–4 weeks in vitro show a significant increase in asymptotes with development (ANOVA, F(3,47) = 4.71; p < 0.01), indicating that excitatory synaptic drive increases with age. Week 1, n = 14 (5); week 2, n = 20 (20); week 3, n = 10 (5); week 4, n = 5 (2). D, Mean spontaneous event duration (Ave Duration) was significantly correlated to the asymptote (Asym) when plotted for all neurons [r = 0.3013; p < 0.05; n = 49 (22)]. E, Excitatory synaptic drive was found to increase when multiple recording sessions were performed in the same slices (different neurons) at two or three time points differing by 5–7 d. Each session included recording from two to three neurons. The mean asymptote at each time point for a given slice is plotted versus DIV. For all slices (each slice represented as a different line), asymptotes significantly increased with development [t test, t = 4.58; p = 0.01; n = 25 (4)].
Changes in the balance of excitation and inhibition
It is likely that the presence of Up states requires a balanced tuning of both excitation and inhibition: excitation being required for maintaining ongoing activity in positive feedback mode and inhibition being necessary to keep excitation in check (Fellous and Sejnowski, 2003). Consistent with this hypothesis, experimental results have established that Up states are associated with increases in both excitatory and inhibitory currents (Shu et al., 2003a; Haider et al., 2006). Thus, the developmental emergence of Up states may require parallel changes in inhibition to counterbalance the observed increase in excitation described above. To address this issue, we estimated the relative strength of evoked excitation and inhibition using previously described methods based on voltage-clamp recordings and a mathematical decomposition of the underlying conductances (Shu et al., 2003a; Wehr and Zador, 2003; Wilent and Contreras, 2005). This method makes a number of simplifying assumptions, including that there are only two significant synaptic currents (mediated by AMPA and GABAA receptors). However, because the NMDA and GABAB receptors are associated with slower changes in conductance, this method provides a reliable measure of the early excitatory/inhibitory balance, which is the component we focused on. We recorded synaptic currents from cells voltage clamped at four different holding potentials [−90, −60, −30, and 0 mV; week 1, n = 13 (4); week 2, n = 9 (4); week 3, n = 10 (4)] (Fig. 5A). The synaptic currents were then used to generate I–V plots for each time point of the response (Fig. 5B), the slope of which is the synaptic conductance. Using the calculated values for the excitatory and inhibitory reversal potentials, the synaptic conductance was separated into the excitatory and inhibitory components (Fig. 5C) (see Materials and Methods). To verify the accuracy of this method, the excitatory and inhibitory conductances were calculated before and after the application of 10 μm CNQX and 50 μm APV (Fig. 5C). As expected, there was a dramatic decrease in the ratio of the peak excitatory to inhibitory conductance. The excitatory component was nearly, although not completely, eliminated, which may be caused by small discrepancies between the estimated and true excitatory reversal potential, because the remaining component was sensitive to small changes in this value (see Materials and Methods). In contrast to the excitatory response, a robust inhibitory conductance was still observed in the presence of CNQX/APV. Because the observed inhibitory conductance (Fig. 5C, left) is a combination of both direct electrical activation of inhibitory neurons and feedforward excitation onto inhibitory neurons, the small decrease observed in inhibition in the presence of CNQX/APV (Fig. 5C, right) is expected as a result of diminished excitation.
The ratio of peak excitatory to inhibitory conductances (gE/gI ratio) was calculated for neurons recorded from different age groups. The gE/gI ratio was found to decrease with age, demonstrating a relative increase in inhibition in relation to excitation (Fig. 5D) [ANOVA, F(2,31) = 7.16; p < 0.005; week 1, n = 13 (4); week 2, n = 9 (4); week 3, n = 10 (4)]. Additionally, there was a significant decrease in the time to peak of both the excitatory and inhibitory conductances from the first week to the third week, at which point the peaks occurred nearly simultaneously (Fig. 5E) (ANOVA, F(2,31) = 6.61, p < 0.005 and F(2,31) = 30.72, p < 0.0001, respectively). Thus, the developmental increase in excitation shown above is in parallel with a concomitant increase in inhibition that may be necessary to prevent runaway excitation.
Structure of spontaneous dynamics
A critical issue to both the mechanisms and function of the spontaneous dynamics is whether there is structure in the patterns of activity. The patterns could reflect either entirely random activity, at one extreme, or, at the other extreme, precisely repeating patterns. In the first case, a random and changing subset of neurons could reach threshold and trigger the flow of activity within the network, each time producing an essentially novel spatial-temporal pattern of activity. However, there could be preferred repeating patterns, initiated by a similar subset of neurons that in turn repeatedly trigger similar neural trajectories. Indeed, recent studies have suggested that not only do repeating patterns occur, but patterns lasting hundreds of milliseconds exhibit millisecond precision (Ikegaya et al., 2004).
To determine whether the spontaneous patterns of activity that we observed were random or exhibited structure, we calculated the correlation between all segments of spontaneous activity within each neuron (see Materials and Methods). Correlation matrices were then clustered to permit visualization of the similarity between spontaneous events (Fig. 6A). The majority of the spontaneous events were highly variable, as reflected by the low mean correlation coefficient [r = 0.12 ± 0.03; n = 12 (12)]. However, there were clear cases in which the overall pattern and duration of the events appeared to repeat (Fig. 6A, bottom). To quantify this effect, a match index was calculated based on the proportion of segment pairs with a correlation >0.5. Both this measure and the mean correlation coefficients were then compared with three control groups as demonstrated in Figure 7A. First, the same measures were calculated for neuron pairs across different slices (between slices). Second, the measures were calculated between pairs of segments within a single cell, but one segment was reversed in time (reverse). Third, we performed the correlations between segments that were chopped and shuffled (chop/shuffle; see Materials and Methods). Both the reverse and the chopped and shuffled controls maintain the statistical properties of the event segments but alter the relative temporal structure. The difference between these two controls is that, because of the asymmetric nature of PSPs (fast rise, slow decay), the reversed condition could bias toward concluding that patterns are present. Both the mean correlations (Fig. 7B) and the match index (Fig. 7C) revealed correlations in the patterns recorded within cells significantly higher than those between slices (t = 2.61, p = 0.01 and t = 3.00, p < 0.005, respectively). In contrast, neither the mean correlations nor the match index were significantly different from the reversed or the chopped and shuffled controls. Together, these data suggest that although there is some structure to the patterns, it is primarily present in the statistical properties of the activity, such as the average amplitude of events or the proportion of time spent in a depolarized state. The absence of any significant effect of reversing or chopping and shuffling the segments indicates a lack of precise temporal structure and therefore of precisely repeating spatial-temporal patterns of activity.
Plasticity of spontaneous activity
A proposed function of spontaneous activity is to allow neurons to achieve target levels of activity in the face of changes in the external input or pharmacological state. Consistent with this hypothesis, studies have shown spontaneous activity rates to be modifiable in response to chronic application of pharmacological agents (Ramakers et al., 1990; Turrigiano et al., 1998) or sensory deprivation (Maffei et al., 2004). However, it has not yet been established whether spontaneous activity can be regulated in vitro by altering levels of external activity presented in a physiological manner. To test this prediction, we used a preparation in which cortical organotypic slices were “implanted” with platinum-iridium microwires for chronic local stimulation while the slices were in the incubator (see Materials and Methods). Baseline firing rates both in vivo and in vitro are often reported to be in the range of 1–10 Hz (Rutherford et al., 1997; Kilgard and Merzenich, 2002; Celikel et al., 2004). Thus, slices were stimulated for 2–4 d at 1–2 Hz at stimulation intensities that elicited large but generally subthreshold PSPs (Fig. 8A). After 2–4 d of stimulation, spontaneous levels of activity were compared between stimulated slices and sister control slices, which were prepared from the same animal and also were implanted with stimulating electrodes (Fig. 8B). These recordings were performed in ACSF that had a similar ionic concentration to the culture media (CM-ACSF; see Materials and Methods). Both the frequency of spontaneous events and the mean event area were significantly decreased in stimulated slices compared with controls (Fig. 8C) [p < 0.001 and p < 0.05, respectively; stimulated n = 21 (9), control n = 20 (9); mean DIV, 20; range, 14–32]. Interestingly, although chronic stimulation was local, the resulting changes in spontaneous network activity appeared to be network-wide and independent of the distance of the neurons from the stimulating electrodes. At the distances examined (up to 2 mm), there was no correlation between spontaneous activity and distance from the stimulating electrodes. Together, these results indicate that the increase in spontaneous activity with age is not the result of a hard-wired developmental program and that spontaneous activity is plastic in that it can be downregulated by providing externally generated input to isolated cortical networks.
Discussion
Development and mechanisms underlying spontaneous activity in vitro
We have observed a developmental increase in spontaneous activity as a function of age in vitro. This increase was comprised of a gradual and qualitative transition from sparse and brief bouts of activity to long-lasting Up states. Our results are consistent with the notion that the emergence of Up states entails synaptic and cellular changes that occur over many days to achieve an appropriate balance of excitation and inhibition. This gradual process may allow networks to achieve dynamical states that rely on positive feedback yet avoid runaway excitation.
The developmental increase in spontaneous dynamics is consistent with previous studies that have observed increased activity using multiunit extracellular recordings (Echevarria and Albus, 2000; Uesaka et al., 2005; van Pelt et al., 2005). However, the potential mechanisms underlying these changes had not been previously addressed. Indeed, the mechanisms underlying spontaneous activity itself are largely unknown. Spontaneous activity is generally defined as that not directly attributable to an external event (McCormick, 1999). In vivo, putative spontaneous activity in one area could be evoked by tonic activity in other cortical or subcortical structures. However, in vitro preparations are devoid of any external input, and thus spontaneous activity must be driven from within the network. Two types of events have been hypothesized to trigger spontaneous activity: the summation of mEPSPs and a subset of intrinsically active neurons. mEPSPs are both small and random but through summation can lead to postsynaptic firing (Timofeev et al., 2000; Sharma and Vijayaraghavan, 2003; Zucker, 2003). Additionally, a subpopulation of intrinsically active neurons could be responsible for initiating bouts of spontaneous activity (Connors et al., 1982; Nunez et al., 1993; Bazhenov et al., 2002). When enough intrinsically active cells fire simultaneously, action potentials would be generated in postsynaptic cells, and Up states could be triggered throughout the network. Indeed, experimental and theoretical studies have shown that blocking or weakening excitatory conductances abolishes Up state generation (Sanchez-Vives and McCormick, 2000; Compte et al., 2003; Cossart et al., 2003).
Consistent with the need for strong excitatory connections for the generation of spontaneous activity, we observed an increase in excitatory drive with development (Fig. 4C). Furthermore, across slices of all ages, there was a significant correlation between excitatory drive and the duration of spontaneous events (Fig. 4D). Although not specifically addressed in this study, the increase in excitation is mostly likely produced by a number of different mechanisms acting in parallel. Indeed, increases in excitatory synaptic strength, spine density, and dendritic and axonal branching have all been reported in organotypic slices as a function of age (Caeser et al., 1989; Annis et al., 1993; Yamada et al., 2000; De Simoni et al., 2003; Uesaka et al., 2005). All or a subset of these mechanisms could underlie the increase in evoked activity reported here.
A second potential mechanism that could underlie a general increase in network activity is an increase in intrinsic excitability. Specifically, the intrinsic membrane properties could underlie the emergence of neural dynamics (Durstewitz, 2003; Zheng et al., 2006). However, a clear decrease in membrane excitability was observed during the developmental window that spontaneous dynamics increased (Fig. 3B), indicating that changes in intrinsic excitability do not directly contribute to the developmental increase in spontaneous activity. Although this study primarily measured regular-spiking pyramidal neurons in the supragranular layers, limited recordings in deep layers did not appear qualitatively different; however, we cannot eliminate the possibility of differential developmental effects across layers and cell types, such as an increase in the excitability of intrinsically bursting neurons in layer V, an area thought to be involved in initiating Up states (Silva et al., 1991; Sanchez-Vives and McCormick, 2000).
We believe that the development of spontaneous activity in organotypic slices reflects both a natural developmental progression and the relatively slow engagement of homeostatic processes. Indeed, Shu et al. (2003a) report that acute slices from ferrets younger than 2 months do not display recurrent, periodic network activity. Developmental data from acute slices indicates progressive increases in excitation and inhibition (Kriegstein et al., 1987; Luhmann and Prince, 1991; Burgard and Hablitz, 1993), supporting the notion of a developmental progression in cellular and synaptic properties leading to the emergence of stable network-wide neural dynamics. Additionally, both evoked and spontaneous activity increase over the course of weeks after cortical deafferentation (Buonomano and Merzenich, 1998), indicating that in addition to developmental changes, homeostatic mechanisms are also in place to enable cortical networks to attain appropriate network dynamics.
Structure of spontaneous patterns
Spontaneous patterns of activity could be random in nature or reflect repeating spatial-temporal structure. The presence or absence of structure speaks to both the underlying mechanisms and the function of spontaneous dynamics. The patterns observed in the current study were highly variable, as evidenced by a mean correlation coefficient between event segments of 0.12 (Fig. 7B), and the mean correlation coefficients or match indices were not sensitive to whether traces were reversed or chopped and shuffled. However, they were not entirely random, because the correlation coefficients between patterns within a cell were significantly higher than those across slices.
One recent study that has examined the issue of repeating structure concluded that specific spatial temporal patterns of activity repeat with a precision of a few milliseconds over the course of hundreds of milliseconds (Ikegaya et al., 2004) and suggested that these patterns would be generated through synfire chains (Abeles, 1991). However, other studies reported highly variable activity patterns inconsistent with the notion of synfire chains (Kerr et al., 2005; Mokeichev et al., 2007). Our results do not support the presence of repeating spatial-temporal patterns of activity that exhibit millisecond precision. Indeed, the lack of millisecond precision is consistent with most electrophysiological studies in vivo (Gawne et al., 1996; Shadlen and Newsome, 1998; Luczak et al., 2007) and in vitro (Buonomano, 2003). Specifically, it is widely observed that the jitter of a response across trials is proportional to the latency. For example, in vitro, the coefficient of variation of the latency in response to a stimulus is generally >10% of the latency (Buonomano, 2003). Similarly, computational models of activity propagation within recurrent networks also exhibit a decrease in temporal precision as a function of time (Buonomano, 2005). Additionally, there is no reflection of temporal precision hypothesized by synfire chain models at the behavioral level (Gibbon et al., 1997; Mauk and Buonomano, 2004). Together, these studies indicate that cortical networks are not capable of generating responses with precision of a few milliseconds over time scales of hundreds of milliseconds.
Plasticity of spontaneous dynamics
The increase in spontaneous activity with age in vitro could reflect a hard-wired developmental program or a modifiable response to the absence of external input. As mentioned above, plasticity in the levels of spontaneous activity in response to global pharmacological manipulations has been established (Ramakers et al., 1990; Rutherford et al., 1997; Turrigiano et al., 1998). However, it was not known whether levels of spontaneous activity are sensitive to manipulations that would mimic the synaptically driven activity observed in vivo. We examined this issue by using a technique in which organotypic slices are implanted with chronic electrodes, thereby allowing stimulation to occur while the slices are in the incubator. We stimulated slices at rates of 1–2 Hz for 2–4 d to provide levels of input that approximate the baseline levels of activity observed in previous studies (Rutherford et al., 1997; Kilgard and Merzenich, 2002; Celikel et al., 2004). Comparison of the levels of spontaneous activity in stimulated and sister control slices revealed a decrease in spontaneous levels of activity in the stimulated slices (Fig. 8C).
The mechanisms underlying this plasticity remain to be determined; however, one possibility is the engagement of homeostatic plasticity via Ca2+ signaling. During the 2–4 d of chronic stimulation, the number of synaptic events is increased, which would lead to increased Ca2+ influx. Ca2+ entry produced by subthreshold synaptic events can engage homeostatic mechanisms (Liu et al., 1998; Sutton et al., 2006) and could contribute to the decrease in spontaneous dynamics observed here. It is also possible that other forms of plasticity such as long-term depression could contribute to the observed changes in network activity.
The decrease in spontaneous activity in response to external stimulation supports the notion that one function of spontaneous dynamics is homeostatic: to allow networks to adjust levels of activity in response to changes in external input. Specific levels of activity, whether triggered primarily by external and/or internal events, may be required to tune cellular and synaptic properties, thereby allowing networks to achieve functional states that support neural dynamics.
Together, our results suggest that a number of cellular and synaptic changes are contributing to the developmental increase in spontaneous activity and the emergence of Up states, specifically enhanced excitatory drive and increased inhibition and decreased intrinsic excitability. These forms of plasticity exhibit a push–pull relationship: whereas increases in excitatory drive alone would be expected to increase network activity, both the increase in inhibition and decrease in intrinsic excitability would in isolation decrease network activity. We hypothesize that these gradual and orchestrated changes in multiple and opposing loci are necessary to allow the emergence of dynamical states that rely on positive feedback within recurrent networks yet prevent epileptic-like activity.
Footnotes
This work was supported by the National Institutes of Health (MH60163) and the National Science Foundation (0543651). We thank Tiago Carvalho for technical assistance and reading previous versions of this manuscript and Tom O'Dell for discussions and helpful advice.
References
- Abeles M. Cambridge, UK: Cambridge UP; 1991. Corticonics. [Google Scholar]
- Annis CM, Robertson RT, O'Dowd DK. Aspects of early postnatal development of cortical neurons that proceed independently of normally present extrinsic influences. J Neurobiol. 1993;24:1460–1480. doi: 10.1002/neu.480241103. [DOI] [PubMed] [Google Scholar]
- Aptowicz CO, Kunkler PE, Kraig RP. Homeostatic plasticity in hippocampal slice cultures involves changes in voltage-gated Na+ channel expression. Brain Res. 2004;998:155–163. doi: 10.1016/j.brainres.2003.11.035. [DOI] [PMC free article] [PubMed] [Google Scholar]
- Bazhenov M, Timofeev I, Steriade M, Sejnowski TJ. Model of thalamocortical slow-wave sleep oscillations and transitions to activated states. J Neurosci. 2002;22:8691–8704. doi: 10.1523/JNEUROSCI.22-19-08691.2002. [DOI] [PMC free article] [PubMed] [Google Scholar]
- Buonomano DV. Timing of neural responses in cortical organotypic slices. Proc Natl Acad Sci USA. 2003;100:4897–4902. doi: 10.1073/pnas.0736909100. [DOI] [PMC free article] [PubMed] [Google Scholar]
- Buonomano DV. A learning rule for the emergence of stable dynamics and timing in recurrent networks. J Neurophysiol. 2005;94:2275–2283. doi: 10.1152/jn.01250.2004. [DOI] [PubMed] [Google Scholar]
- Buonomano DV, Merzenich MM. Cortical plasticity: from synapses to maps. Annu Rev Neurosci. 1998;21:149–186. doi: 10.1146/annurev.neuro.21.1.149. [DOI] [PubMed] [Google Scholar]
- Burgard EC, Hablitz JJ. Developmental changes in NMDA and non-NMDA receptor-mediated synaptic potentials in rat neocortex. J Neurophysiol. 1993;69:230–240. doi: 10.1152/jn.1993.69.1.230. [DOI] [PubMed] [Google Scholar]
- Caeser M, Bonhoeffer T, Bolz J. Cellular organization and development of slice cultures from rat visual cortex. Exp Brain Res. 1989;77:234–244. doi: 10.1007/BF00274981. [DOI] [PubMed] [Google Scholar]
- Celikel T, Szostak VA, Feldman DE. Modulation of spike timing by sensory deprivation during induction of cortical map plasticity. Nat Neurosci. 2004;7:534–541. doi: 10.1038/nn1222. [DOI] [PMC free article] [PubMed] [Google Scholar]
- Compte A, Sanchez-Vives MV, McCormick DA, Wang XJ. Cellular and network mechanisms of slow oscillatory activity (<1 Hz) and wave propagations in a cortical network model. J Neurophysiol. 2003;89:2707–2725. doi: 10.1152/jn.00845.2002. [DOI] [PubMed] [Google Scholar]
- Connors BW. Initiation of synchronized neuronal bursting in neocortex. Nature. 1984;310:685–687. doi: 10.1038/310685a0. [DOI] [PubMed] [Google Scholar]
- Connors BW, Gutnick MJ, Prince DA. Electrophysiological properties of neocortical neurons in vitro. J Neurophysiol. 1982;48:1302–1320. doi: 10.1152/jn.1982.48.6.1302. [DOI] [PubMed] [Google Scholar]
- Cossart R, Aronov D, Yuste R. Attractor dynamics of network UP states in the neocortex. Nature. 2003;423:283–288. doi: 10.1038/nature01614. [DOI] [PubMed] [Google Scholar]
- Cowan RL, Wilson CJ. Spontaneous firing patterns and axonal projections of single corticostriatal neurons in the rat medial agranular cortex. J Neurophysiol. 1994;71:17–32. doi: 10.1152/jn.1994.71.1.17. [DOI] [PubMed] [Google Scholar]
- Debanne D, Gahwiler BH, Thompson SM. Long-term synaptic plasticity between pairs of individual CA3 pyramidal cells in rat hippocampal slice cultures. J Physiol (Lond) 1998;507:237–247. doi: 10.1111/j.1469-7793.1998.237bu.x. [DOI] [PMC free article] [PubMed] [Google Scholar]
- Desai NS, Rutherford LC, Turrigiano GG. Plasticity in the intrinsic excitability of cortical pyramidal neurons. Nat Neurosci. 1999;2:515–520. doi: 10.1038/9165. [DOI] [PubMed] [Google Scholar]
- De Simoni A, Griesinger CB, Edwards FA. Development of rat CA1 neurones in acute versus organotypic slices: role of experience in synaptic morphology and activity. J Physiol (Lond) 2003;550:135–147. doi: 10.1113/jphysiol.2003.039099. [DOI] [PMC free article] [PubMed] [Google Scholar]
- Dong HW, Buonomano DV. A technique for repeated recordings in cortical organotypic slices. J Neurosci Methods. 2005;146:69–75. doi: 10.1016/j.jneumeth.2005.01.017. [DOI] [PubMed] [Google Scholar]
- Durstewitz D. Self-organizing neural integrator predicts interval times through climbing activity. J Neurosci. 2003;23:5342–5353. doi: 10.1523/JNEUROSCI.23-12-05342.2003. [DOI] [PMC free article] [PubMed] [Google Scholar]
- Echevarria D, Albus K. Activity-dependent development of spontaneous bioelectric activity in organotypic cultures of rat occipital cortex. Brain Res Dev Brain Res. 2000;123:151–164. doi: 10.1016/s0165-3806(00)00089-4. [DOI] [PubMed] [Google Scholar]
- Fellous JM, Sejnowski TJ. Regulation of persistent activity by background inhibition in an in vitro model of a cortical microcircuit. Cereb Cortex. 2003;13:1232–1241. doi: 10.1093/cercor/bhg098. [DOI] [PMC free article] [PubMed] [Google Scholar]
- Gawne TJ, Kjaer TW, Richmond BJ. Latency: another potential code for feature binding in striate cortex. J Neurophysiol. 1996;76:1356–1360. doi: 10.1152/jn.1996.76.2.1356. [DOI] [PubMed] [Google Scholar]
- Gibbon J, Malapani C, Dale CL, Gallistel C. Toward a neurobiology of temporal cognition: advances and challenges. Curr Opin Neurobiol. 1997;7:170–184. doi: 10.1016/s0959-4388(97)80005-0. [DOI] [PubMed] [Google Scholar]
- Haider B, Duque A, Hasenstaub AR, McCormick DA. Neocortical network activity in vivo is generated through a dynamic balance of excitation and inhibition. J Neurosci. 2006;26:4535–4545. doi: 10.1523/JNEUROSCI.5297-05.2006. [DOI] [PMC free article] [PubMed] [Google Scholar]
- Ikegaya Y, Aaron G, Cossart R, Aronov D, Lampl I, Ferster D, Yuste R. Synfire chains and cortical songs: temporal modules of cortical activity. Science. 2004;304:559–564. doi: 10.1126/science.1093173. [DOI] [PubMed] [Google Scholar]
- Karmarkar UR, Buonomano DV. Different forms of homeostatic plasticity are engaged with distinct temporal profiles. Eur J Neurosci. 2006;23:1575–1584. doi: 10.1111/j.1460-9568.2006.04692.x. [DOI] [PubMed] [Google Scholar]
- Kerr JN, Plenz D. Action potential timing determines dendritic calcium during striatal up-states. J Neurosci. 2004;24:877–885. doi: 10.1523/JNEUROSCI.4475-03.2004. [DOI] [PMC free article] [PubMed] [Google Scholar]
- Kerr JN, Greenberg D, Helmchen F. Imaging input and output of neocortical networks in vivo. Proc Natl Acad Sci USA. 2005;102:14063–14068. doi: 10.1073/pnas.0506029102. [DOI] [PMC free article] [PubMed] [Google Scholar]
- Kilgard MP, Merzenich MM. Order-sensitive plasticity in adult primary auditory cortex. Proc Natl Acad Sci USA. 2002;99:3205–3209. doi: 10.1073/pnas.261705198. [DOI] [PMC free article] [PubMed] [Google Scholar]
- Kriegstein AR, Suppes T, Prince DA. Cellular and synaptic physiology and epileptogenesis of developing rat neocortical neurons in vitro. Brain Res. 1987;431:161–171. doi: 10.1016/0165-3806(87)90206-9. [DOI] [PubMed] [Google Scholar]
- Liu Z, Golowasch J, Marder E, Abbott LF. A model neuron with activity-dependent conductances regulated by multiple calcium sensors. J Neurosci. 1998;18:2309–2320. doi: 10.1523/JNEUROSCI.18-07-02309.1998. [DOI] [PMC free article] [PubMed] [Google Scholar]
- Luczak A, Bartho P, Marguet SL, Buzsaki G, Harris KD. Sequential structure of neocortical spontaneous activity in vivo. Proc Natl Acad Sci USA. 2007;104:347–352. doi: 10.1073/pnas.0605643104. [DOI] [PMC free article] [PubMed] [Google Scholar]
- Luhmann HJ, Prince DA. Postnatal maturation of the GABAergic system in rat neocortex. J Neurophysiol. 1991;65:247–263. doi: 10.1152/jn.1991.65.2.247. [DOI] [PubMed] [Google Scholar]
- MacLean JN, Watson BO, Aaron GB, Yuste R. Internal dynamics determine the cortical response to thalamic stimulation. Neuron. 2005;48:811–823. doi: 10.1016/j.neuron.2005.09.035. [DOI] [PubMed] [Google Scholar]
- Maffei A, Nelson SB, Turrigiano GG. Selective reconfiguration of layer 4 visual cortical circuitry by visual deprivation. Nat Neurosci. 2004;7:1353–1359. doi: 10.1038/nn1351. [DOI] [PubMed] [Google Scholar]
- Marder CP, Buonomano DV. Differential effects of short- and long-term potentiation on cell firing in the CA1 region of the hippocampus. J Neurosci. 2003;23:112–121. doi: 10.1523/JNEUROSCI.23-01-00112.2003. [DOI] [PMC free article] [PubMed] [Google Scholar]
- Markram H, Lubke J, Frotscher M, Roth A, Sakmann B. Physiology and anatomy of synaptic connections between thick tufted pyramidal neurones in the developing rat neocortex. J Physiol (Lond) 1997;500:409–440. doi: 10.1113/jphysiol.1997.sp022031. [DOI] [PMC free article] [PubMed] [Google Scholar]
- Massimini M, Huber R, Ferrarelli F, Hill S, Tononi G. The sleep slow oscillation as a traveling wave. J Neurosci. 2004;24:6862–6870. doi: 10.1523/JNEUROSCI.1318-04.2004. [DOI] [PMC free article] [PubMed] [Google Scholar]
- Mauk MD, Buonomano DV. The neural basis of temporal processing. Annu Rev Neurosci. 2004;27:307–340. doi: 10.1146/annurev.neuro.27.070203.144247. [DOI] [PubMed] [Google Scholar]
- McCormick DA. Spontaneous activity: signal or noise? Science. 1999;285:541–543. doi: 10.1126/science.285.5427.541. [DOI] [PubMed] [Google Scholar]
- McCormick DA, Shu Y, Hasenstaub A, Sanchez-Vives M, Badoual M, Bal T. Persistent cortical activity: mechanisms of generation and effects on neuronal excitability. Cereb Cortex. 2003;13:1219–1231. doi: 10.1093/cercor/bhg104. [DOI] [PubMed] [Google Scholar]
- Metherate R, Ashe JH. Ionic flux contributions to neocortical slow waves and nucleus basalis-mediated activation: whole-cell recordings in vivo. J Neurosci. 1993;13:5312–5323. doi: 10.1523/JNEUROSCI.13-12-05312.1993. [DOI] [PMC free article] [PubMed] [Google Scholar]
- Mokeichev A, Okun M, Barak O, Katz Y, Ben-Shahar O, Lampl I. Stochastic emergence of repeating cortical motifs in spontaneous membrane potential fluctuations in vivo. Neuron. 2007;53:413–425. doi: 10.1016/j.neuron.2007.01.017. [DOI] [PubMed] [Google Scholar]
- Nunez A, Amzica F, Steriade M. Electrophysiology of cat association cortical cells in vivo: intrinsic properties and synaptic responses. J Neurophysiol. 1993;70:418–430. doi: 10.1152/jn.1993.70.1.418. [DOI] [PubMed] [Google Scholar]
- Petersen CC, Hahn TT, Mehta M, Grinvald A, Sakmann B. Interaction of sensory responses with spontaneous depolarization in layer 2/3 barrel cortex. Proc Natl Acad Sci USA. 2003;100:13638–13643. doi: 10.1073/pnas.2235811100. [DOI] [PMC free article] [PubMed] [Google Scholar]
- Plenz D, Kitai ST. Up and down states in striatal medium spiny neurons simultaneously recorded with spontaneous activity in fast-spiking interneurons studied in cortex-striatum-substantia nigra organotypic cultures. J Neurosci. 1998;18:266–283. doi: 10.1523/JNEUROSCI.18-01-00266.1998. [DOI] [PMC free article] [PubMed] [Google Scholar]
- Prince DA, Tseng GF. Epileptogenesis in chronically injured cortex: in vitro studies. J Neurophysiol. 1993;69:1276–1291. doi: 10.1152/jn.1993.69.4.1276. [DOI] [PubMed] [Google Scholar]
- Ramakers GJ, Corner MA, Habets AM. Development in the absence of spontaneous bioelectric activity results in increased stereotyped burst firing in cultures of dissociated cerebral cortex. Exp Brain Res. 1990;79:157–166. doi: 10.1007/BF00228885. [DOI] [PubMed] [Google Scholar]
- Ringach DL, Hawken MJ, Shapley R. Dynamics of orientation tuning in macaque primary visual cortex. Nature. 1997;387:281–284. doi: 10.1038/387281a0. [DOI] [PubMed] [Google Scholar]
- Rutherford LC, DeWan A, Lauer HM, Turrigiano GG. Brain-derived neurotrophic factor mediates the activity-dependent regulation of inhibition in neocortical cultures. J Neurosci. 1997;17:4527–4535. doi: 10.1523/JNEUROSCI.17-12-04527.1997. [DOI] [PMC free article] [PubMed] [Google Scholar]
- Sanchez-Vives MV, McCormick DA. Cellular and network mechanisms of rhythmic recurrent activity in neocortex. Nat Neurosci. 2000;3:1027–1034. doi: 10.1038/79848. [DOI] [PubMed] [Google Scholar]
- Shadlen MN, Newsome WT. The variable discharge of cortical neurons: implications for connectivity, computation, and information coding. J Neurosci. 1998;18:3870–3896. doi: 10.1523/JNEUROSCI.18-10-03870.1998. [DOI] [PMC free article] [PubMed] [Google Scholar]
- Sharma G, Vijayaraghavan S. Modulation of presynaptic store calcium induces release of glutamate and postsynaptic firing. Neuron. 2003;38:929–939. doi: 10.1016/s0896-6273(03)00322-2. [DOI] [PubMed] [Google Scholar]
- Shu Y, Hasenstaub A, McCormick DA. Turning on and off recurrent balanced cortical activity. Nature. 2003a;423:288–293. doi: 10.1038/nature01616. [DOI] [PubMed] [Google Scholar]
- Shu Y, Hasenstaub A, Badoual M, Bal T, McCormick DA. Barrages of synaptic activity control the gain and sensitivity of cortical neurons. J Neurosci. 2003b;23:10388–10401. doi: 10.1523/JNEUROSCI.23-32-10388.2003. [DOI] [PMC free article] [PubMed] [Google Scholar]
- Silva LR, Amitai Y, Connors BW. Intrinsic oscillations of neocortex generated by layer 5 pyramidal neurons. Science. 1991;251:432–435. doi: 10.1126/science.1824881. [DOI] [PubMed] [Google Scholar]
- Slutsky I, Sadeghpour S, Li B, Liu G. Enhancement of synaptic plasticity through chronically reduced Ca2+ flux during uncorrelated activity. Neuron. 2004;44:835–849. doi: 10.1016/j.neuron.2004.11.013. [DOI] [PubMed] [Google Scholar]
- Steriade M, Amzica F. Intracellular study of excitability in the seizure-prone neocortex in vivo. J Neurophysiol. 1999;82:3108–3122. doi: 10.1152/jn.1999.82.6.3108. [DOI] [PubMed] [Google Scholar]
- Steriade M, Nunez A, Amzica F. A novel slow (<1 Hz) oscillation of neocortical neurons in vivo: depolarizing and hyperpolarizing components. J Neurosci. 1993;13:3252–3265. doi: 10.1523/JNEUROSCI.13-08-03252.1993. [DOI] [PMC free article] [PubMed] [Google Scholar]
- Stoppini L, Buchs PA, Muller D. A simple method for organotypic cultures of nervous tissue. J Neurosci Methods. 1991;37:173–182. doi: 10.1016/0165-0270(91)90128-m. [DOI] [PubMed] [Google Scholar]
- Sutton MA, Ito HT, Cressy P, Kempf C, Woo JC, Schuman EM. Miniature neurotransmission stabilizes synaptic function via tonic suppression of local dendritic protein synthesis. Cell. 2006;125:785–799. doi: 10.1016/j.cell.2006.03.040. [DOI] [PubMed] [Google Scholar]
- Timofeev I, Grenier F, Bazhenov M, Sejnowski TJ, Steriade M. Origin of slow cortical oscillations in deafferented cortical slabs. Cereb Cortex. 2000;10:1185–1199. doi: 10.1093/cercor/10.12.1185. [DOI] [PubMed] [Google Scholar]
- Timofeev I, Grenier F, Steriade M. Disfacilitation and active inhibition in the neocortex during the natural sleep-wake cycle: an intracellular study. Proc Natl Acad Sci USA. 2001;98:1924–1929. doi: 10.1073/pnas.041430398. [DOI] [PMC free article] [PubMed] [Google Scholar]
- Timofeev I, Grenier F, Steriade M. Contribution of intrinsic neuronal factors in the generation of cortically driven electrographic seizures. J Neurophysiol. 2004;92:1133–1143. doi: 10.1152/jn.00523.2003. [DOI] [PubMed] [Google Scholar]
- Turrigiano GG, Nelson SB. Homeostatic plasticity in the developing nervous system. Nat Neurosci Rev. 2004;5:97–107. doi: 10.1038/nrn1327. [DOI] [PubMed] [Google Scholar]
- Turrigiano GG, Leslie KR, Desai NS, Rutherford LC, Nelson SB. Activity-dependent scaling of quantal amplitude in neocortical neurons. Nature. 1998;391:892–896. doi: 10.1038/36103. [DOI] [PubMed] [Google Scholar]
- Uesaka N, Hirai S, Maruyama T, Ruthazer ES, Yamamoto N. Activity dependence of cortical axon branch formation: a morphological and electrophysiological study using organotypic slice cultures. J Neurosci. 2005;25:1–9. doi: 10.1523/JNEUROSCI.3855-04.2005. [DOI] [PMC free article] [PubMed] [Google Scholar]
- van Pelt J, Vajda I, Wolters PS, Corner MA, Ramakers GJ. Dynamics and plasticity in developing neuronal networks in vitro. Prog Brain Res. 2005;147:173–188. doi: 10.1016/S0079-6123(04)47013-7. [DOI] [PubMed] [Google Scholar]
- Vogels TP, Rajan K, Abbott LF. Neural network dynamics. Annu Rev Neurosci. 2005;28:357–376. doi: 10.1146/annurev.neuro.28.061604.135637. [DOI] [PubMed] [Google Scholar]
- Volgushev M, Chauvette S, Mukovski M, Timofeev I. Precise long-range synchronization of activity and silence in neocortical neurons during slow-wave oscillations [corrected] J Neurosci. 2006;26:5665–5672. doi: 10.1523/JNEUROSCI.0279-06.2006. [DOI] [PMC free article] [PubMed] [Google Scholar]
- Wagenaar DA, Madhavan R, Pine J, Potter SM. Controlling bursting in cortical cultures with closed-loop multi-electrode stimulation. J Neurosci. 2005;25:680–688. doi: 10.1523/JNEUROSCI.4209-04.2005. [DOI] [PMC free article] [PubMed] [Google Scholar]
- Wehr M, Zador AM. Balanced inhibition underlies tuning and sharpens spike timing in auditory cortex. Nature. 2003;426:442–446. doi: 10.1038/nature02116. [DOI] [PubMed] [Google Scholar]
- Wessberg J, Stambaugh CR, Kralik JD, Beck PD, Laubach M, Chapin JK, Kim J, Biggs SJ, Srinivasan MA, Nicolelis MA. Real-time prediction of hand trajectory by ensembles of cortical neurons in primates. Nature. 2000;408:361–365. doi: 10.1038/35042582. [DOI] [PubMed] [Google Scholar]
- Wilent WB, Contreras D. Dynamics of excitation and inhibition underlying stimulus selectivity in rat somatosensory cortex. Nat Neurosci. 2005;8:1364–1370. doi: 10.1038/nn1545. [DOI] [PubMed] [Google Scholar]
- Wilson CJ, Kawaguchi Y. The origins of two-state spontaneous membrane potential fluctuations of neostriatal spiny neurons. J Neurosci. 1996;16:2397–2410. doi: 10.1523/JNEUROSCI.16-07-02397.1996. [DOI] [PMC free article] [PubMed] [Google Scholar]
- Yamada K, Yamamoto N, Toyama K. Development of NMDA and non-NMDA receptor-mediated excitatory synaptic transmission in geniculocortical and corticocortical connections in organotypic coculture preparations. Eur J Neurosci. 2000;12:3854–3862. doi: 10.1046/j.1460-9568.2000.00268.x. [DOI] [PubMed] [Google Scholar]
- Zar J. Englewood Cliffs, NJ: Prentice Hall; 1984. Biostatistical analysis. [Google Scholar]
- Zheng J, Lee S, Zhou ZJ. A transient network of intrinsically bursting starburst cells underlies the generation of retinal waves. Nat Neurosci. 2006;9:363–371. doi: 10.1038/nn1644. [DOI] [PubMed] [Google Scholar]
- Zucker RS. Can a synaptic signal arise from noise? Neuron. 2003;38:845–846. doi: 10.1016/s0896-6273(03)00363-5. [DOI] [PubMed] [Google Scholar]