

Abstract
Individual superior colliculus (SC) neurons integrate information from multiple sensory sources to enhance their physiological response. The response of an SC neuron to a cross-modal stimulus combination can not only exceed the best component unisensory response but can also exceed their arithmetic sum (i.e., superadditivity). The present experiments were designed to investigate the temporal profile of multisensory integration in this model system. We found that cross-modal stimuli frequently shortened physiological response latencies (mean shift, 6.2 ms) and that response enhancement was greatest in the initial phase of the response (the phenomenon of initial response enhancement). The vast majority of the responses studied evidenced superadditive computations, most often at the beginning of the multisensory response.
Keywords: multisensory, cross-modal, superior colliculus, vision, audition, latency
Introduction
The inherent benefits of the ability of the brain to integrate information from different senses [i.e., “multisensory integration” (Stein and Meredith, 1993)] are apparent as more robust neural responses and faster and more accurate behavioral responses (Gielen et al., 1983; Meredith and Stein, 1983; Perrott et al., 1990; Hughes et al., 1994; Frens et al., 1995; Goldring et al., 1996; Wilkinson et al., 1996; Jiang et al., 2002). One well explored example of this phenomenon is found in the multisensory neurons of the cat superior colliculus (SC), a midbrain structure involved in controlling orientation responses to external events. The response of an SC neuron to a cross-modal stimulus combination can not only exceed the best component unisensory response but can often exceed their arithmetic sum (Stein and Meredith, 1993; Stanford et al., 2005). These amplified physiological responses are reflected at the behavioral level in better orientation performance (Wilkinson et al., 1996; Jiang et al., 2002).
The physiological products of multisensory integration noted above are consistent with models of statistically optimal integration, in that the response enhancement of SC neurons is proportional to the information gained by integrating their cross-modal inputs (Anastasio et al., 2000; Anastasio and Patton, 2004). Specifically, response enhancement is inversely proportional to the information communicated by (i.e., the effectiveness of) the individual component stimuli, a phenomenon known as “inverse effectiveness” (Stein and Meredith, 1993; Stanford et al., 2005).
Although it is known that multisensory integration takes place within a time-restricted window (Meredith et al., 1987), it is not yet known how amplified physiological responses evolve over time in any given multisensory SC neuron and/or across the population of such neurons. Therefore, the present experiments were designed to investigate the “temporal profile” of multisensory integration in this model system. Because, as noted above, response enhancement is inversely proportional to the information present in the individual unisensory channels, and the amount of information acquired by a neuron should increase gradually over time, we hypothesize that response enhancement is maximal in the initial phase of the response, when the information received from the unisensory input channels of the neuron is minimal. A corollary of this hypothesis is that cross-modal stimuli should evoke earlier responses than their modality-specific component stimuli.
Materials and Methods
Surgical preparation
Two adult cats were implanted with stainless-steel recording chambers (McHaffie and Stein, 1983). Aseptic surgical techniques were used in accordance with the Guide for the Care and Use of Laboratory Animals (National Institutes of Health publication 86-23) and an approved Institutional Animal Care and Use Committee protocol. Each animal was rendered tractable with ketamine hydrochloride (20 mg/kg, i.m.) and acepromazine maleate (0.4 mg/kg, i.m.). Surgical anesthesia was maintained with halothane (1.5–4%). The recording chamber was attached to the skull over a craniotomy, giving access to the SC via the overlying cortex. Postsurgical analgesics (butorphanol tartrate; 0.1–0.4 mg/kg for 6 h) were administered as needed, and antibiotics (cephazolin sodium; 25 mg/kg) were administered twice daily for 7 d.
Weekly recording sessions began ≥7 d after surgery. The animal was anesthetized with ketamine hydrochloride (20 mg/kg, i.m.) and acepromazine maleate (0.4 mg/kg, i.m.), intubated, and then paralyzed with pancuronium bromide (0.3 mg/kg). Anesthesia, paralysis, and hydration were maintained by infusion of ketamine (10–15 mg · kg−1· h−1, i.v.), pancuronium (0.1–0.2 mg · kg−1· h−1, i.v.), and 5% dextrose Ringer's solution (1 mg · kg−1· h−1, i.v.). Respiratory rate and volume were controlled so that end-tidal CO2 was ∼4.0%. At the end of each experiment, anesthetics and paralytics were terminated, and the animal was returned to its home cage after it recovered normal respiration and ambulation.
Stimulus generation and stimulus conditions
The goal here was to study the responses to a broad range of stimulus combinations. SC neurons responsive to both visual and auditory stimuli were studied. Visual stimuli were bright red or white light-emitting diodes (LEDs) and auditory stimuli were bursts of bandpass-filtered noise presented in close proximity to each LED. Stimuli were controlled using a Spike II (Cambridge Electronics Design, Cambridge, UK) analog-to-digital converter connected to a personal computer. Each neuron was tested with modality-specific (visual, auditory) and cross-modal (visual–auditory) stimuli at three levels of stimulus efficacy and a single duration. This was determined empirically for each modality-specific stimulus component of each neuron on-line by approximating its threshold intensity and then seeking stimuli to span its dynamic range. Visual stimuli ranged from 0.65 to 13.0 cd/m2 and auditory stimuli from 58.4 to 96.8 dB sound pressure level (A-weighted). Stimulus duration was made to be as brief as possible while still producing a clear response when presented at relatively high intensity (50–100 ms).
Cross-modal stimuli consisted of all nine possible intensity combinations (3 × 3) and, for each cross-modal pairing, the relative timing of the modality-specific component stimuli was also varied. These stimulus onset asynchronies (SOAs; typically four) were chosen to cover the range producing maximal temporal coincidence in the responses based on online estimates of the visual and auditory response latencies. Generally, the smallest and largest SOAs differed by 100 ms (in increments of 25 ms), so that most neurons (35 of 41) were tested with ≥36 (3 × 3 × 4) cross-modal (i.e., multisensory) stimulus combinations. During testing, modality-specific and cross-modal stimulus configurations were presented randomly. Neurons were tested with an average of 20 trials per stimulus configuration, with most neurons (38 of 41) having a minimum of 10 trials per stimulus combination. The acquired dataset was used previously in a different analysis (Stanford et al., 2005).
Data analysis
General overview.
The present experiments are directed toward examining the temporal profile of multisensory enhancement and, especially, the possibility of speeded multisensory responses. Although the results are conceptually simple, the methods leading to the conclusions regarding the latency shift require a detailed description of how latency was determined and how the latencies were compared across stimulus conditions. To determine response latencies, we adopted a method well suited to the analysis of data when firing rates and signal/noise ratios are low. In brief, the temporal profile of the response to any stimulus was quantified as the integral of the stimulus-driven firing rate (see below). This metric was computed as the average number of stimulus-driven impulses accumulated on or before each moment in time and is referred to as the qsum. The qsum value at time t is written qsum(t). Changes in the underlying firing rate were identified by changes in the slope of the qsum function. This involved the first four steps described below. Steps 5–8 describe how the multisensory responses were compared with the unisensory responses.
Step 1: computing qsum(t).
The qsum at time t was equal to the difference between the number of impulses generated on or before t (averaged across trials) and the expected number of impulses if the stimulus were absent. This latter quantity was predicted from the firing rate estimated in the window of time 0–500 ms before the stimulus onset (by multiplying this rate by time). The qsum varied randomly around zero if the stimulus did not elicit a response because the firing rate did not change from prestimulus levels.
Step 2: determining the window containing the response onset.
The accuracy of the response onset calculation was facilitated by directing the search to the window of time most likely to contain it. The ending time (E) of this window was the time that maximized the ratio qsum(t)/t (with t = 500 ms at stimulus onset). Thus, E corresponded approximately to the end of the stimulus-driven response, when the slope of the qsum decreased toward zero. The beginning time (B) of the window was then set so that the window symmetrically bracketed the stimulus onset.
Step 3: determining the response onset.
When the firing rate changed, the slope of the qsum changed (i.e., there was a deflection forming an angle). A geometric method found the most likely location of this angle within the window (B, E) described above. Specifically, a straight line segment was drawn between the qsum at the beginning [qsum(B)] and end [qsum(E)] of the window. This line segment and the qsum formed acute angles where they intersected at B and E. These two angles plus the angle at the response onset time (R) formed a triangle. The R was determined by finding the most likely location (i.e., the time) of the third angle by finding the time that maximized the distance between the actual qsum and the line drawn between qsum(B) and qsum(E).
Step 4: verifying the response onset.
A significant change in the firing rate at the R (i.e., the transition from spontaneous to driven activity) was verified by comparing across trials using a paired t test, the firing rate (number of impulses per time) estimated in the window (R, E) with the spontaneous firing rate, calculated in the window 0–500 ms before the stimulus onset. A 95% confidence level was required for a response to be categorized as present and step 5 to be engaged. If this level was not achieved, the stimulus was considered ineffective (no response was obtained). The critical p value producing the 95% confidence level varied according to the spontaneous firing rate of the neuron, and was determined through a bootstrapping procedure using a Poisson model of neural activity. This consisted of 150,000 simulated trials per tested spontaneous rate observed within the present population of SC neurons (i.e., 0–10 Hz) (Stanford et al., 2005). The procedure consisted of 5000 simulations per tested rate, with 30 trials per simulation with a 1 s duration per trial. From these simulations, we determined the p value produced by the algorithm described above (steps 1–4) that resulted in a 5% probability of a false positive for each tested rate (i.e., the 95% confidence level). To permit interpolation, the results were fit with the following piecewise continuous exponential log function: value(rate) = exp(X · log(rate) + Y), where X and Y are scalars. When spontaneous rates were <1 Hz, X = −0.828 and Y = −10.2. When spontaneous rates were >1 Hz, X = −0.508 and Y = −7.98. Figure 1C plots the results and regression fit, along with an illustration of the anticipated false alarm rate if the critical p value is not adjusted.
Figure 1.

Summary of data analysis methods and a sample neuron showing the complex nature of multisensory enhancement: multisensory stimuli shorten response latencies and enhance response magnitude. A, Illustration of how the impulse raster is converted into the qsum, the bounding window (B, E) identified, and the response onset (R) determined. B, Comparison of the performance of the algorithm against common algorithms based on spike density functions (SDF) and instantaneous firing rate (IFR) when the spontaneous rate is 5 Hz. Plotted is the median error (actual first impulse time minus algorithm decision) of >500 simulations of 30 trials in which a 100 ms response (stimulus-driven rate on x-axis) with a 100 ms response onset delay was embedded in a 1 s trial. See text for more details. C, The statistical criterion for detecting significant responses (critical p value) is adjusted to ensure a 95% confidence level. Different spontaneous rates require different critical p values (circles, read off of the log-scaled left axis), a relationship described by a piecewise continuous exponential-log function (solid line). If the critical p value is not corrected from 0.05, the percentage of false positives can be <5 or >5%, depending on the spontaneous rate (x's, read off of the linearly scaled right axis). D, Top, Impulse rasters (dots) from a sample neuron. Bottom, The window of interest (50–150 ms) is expanded (black dots, multisensory impulses; gray dots, auditory; visual impulses are not visible in this window). Shown are the response onsets (vertical lines) and multisensory and unisensory qsums (solid lines, use right axis). Note that the onset of the multisensory response began 19 ms before the onset of the earliest unisensory (i.e., auditory) response. Also, note that at the time of the very first auditory response, the multisensory response is already enhanced. V, Visual; A, auditory; VA, multisensory.
Step 5: determining multisensory latency shifts.
To determine whether cross-modal stimuli induced changes in the response latency, we compared (across all examined stimulus combinations) the distribution of multisensory response latencies with the distribution of the earliest unisensory response latency, using a Kolmogorov–Smirnov test (p < 0.05).
Step 6: determining the magnitude and timing of multisensory enhancement.
This was accomplished by computing the difference between the multisensory and largest unisensory qsums (Δqsum) at each moment in time after aligning their stimulus onsets (for nonzero SOAs). Before the onset of the earliest unisensory response (i.e., when the unisensory qsums deviated randomly from zero), the multisensory qsum was compared with the mean unisensory qsum to avoid artificially inflating the unisensory response estimate. Divergences of the multisensory qsum from the best unisensory qsum appeared as angles in the Δqsum. These divergences were detected using steps 1–3 above, except R corresponds to the time of the divergence. Statistical verification was conducted by comparing (unpaired t test; p < 0.05) the multisensory firing rates with the firing rates generated by the best unisensory response in the window (R, E).
Step 7: computing the multisensory index.
A continuous-time measure of the multisensory index [MSI(t)] was used to determine the proportionate enhancement of the multisensory response over the best unisensory response [(multisensory qsum − largest unisensory qsum)/largest unisensory qsum]. If a multisensory response began before the first unisensory response, the largest unisensory qsum at that time would be zero (although it could vary from zero randomly), and thus the MSI(t) is impossible to define as a ratio. So, we set MSI(t) to a very high but physiologically observable value of 1000% in these cases. This also allows the average MSI(t) in circumstances in which there is a speeded response to be directly interpreted as 10 times the percentage of stimulus combinations that produce a speeded response.
Step 8: computing the computational mode used during multisensory enhancement.
This is accomplished via steps 2–6, wherein the comparison (Δqsum) involves the multisensory and summed unisensory qsums. A computational mode of superadditivity is indicated when these two qsums are significantly different in the range (R, E) (unpaired t test between the multisensory rates and summed unisensory rates; p < 0.05).
To ensure confidence in the accuracy of the algorithm, its performance was compared against two common approaches: a method based on spike-density functions (SDF) and a method based on instantaneous firing rate (IFR). In the SDF algorithm, the impulse raster is convolved with a fixed-width square wave function (multiple widths were tested, the optimal selected), the result collapsed across trials, and an empirical bootstrapping technique is used to generate a distribution of expected values from the time window before the stimulus onset. Response onsets are identified as the first significant (p < 0.05) statistical deviation of the collapsed spike density function from this population on two successive time bins (1 ms in width). The IFR algorithm uses the same bootstrapping technique and statistical criterion, but transforms the impulse raster using the reciprocal of the interspike interval. Algorithms were compared on a set of realistic simulations of SC neuronal responses (5 Hz spontaneous rate; 10–50 Hz stimulus-driven rate; 500 ms spontaneous activity preceding response; 100 ms response duration; 400 ms spontaneous activity after response; 30 simulations/set), and the error of each algorithm was calculated as the difference between the actual response onset and that reported by the algorithm. Median error for each algorithm is presented in Figure 1B. The algorithm used here performs better than the others throughout the tested range: the SDF and IFR algorithms reach their optimal performance only as the stimulus-driven firing rate increases. For a more detailed comparison of similar algorithms, see Friedman and Priebe (1998).
Criteria for analysis.
To test the hypothesis that cross-modal stimuli evoke earlier responses, it was necessary to exclude from analysis stimulus combinations in which latency shifts would be impossible given the minimal conduction times from the eye and ear. Therefore, we analyzed only those stimulus combinations in which both cross-modal stimuli were presented ≥8 ms before the earliest unisensory response would be expected (obtained from unisensory trials), so that a window of ≥3 ms would be available for a latency shift to take place (assuming natural stimuli to have tectopetal latencies of no <5 ms). There were 477 stimulus combinations from 31 neurons that met this criterion.
Visual and auditory components were each individually effective in eliciting responses for 348 cross-modal stimulus combinations in 28 neurons. These stimulus combinations were the principal focus of the analysis because the two unisensory responses were clearly identifiable, which is necessary to ascertain that a latency shift has occurred (for criticism, see Whitchurch and Takahashi, 2006). However, to determine the generality of the phenomenon, we also analyzed a second set of 129 stimulus combinations from 13 neurons in which the auditory stimulus produced a response, but the visual stimulus was ineffective. Auditory latencies were almost always shorter than visual latencies and were thus presumably the least likely to be shifted. This second set of stimulus combinations addressed cases in which the visual stimulus could potentially shift the auditory response in time. Results are pooled across neurons in each of these groups unless otherwise stated.
Results
Multisensory integration had two principal effects: it significantly shortened response latencies and enhanced the sensory response. The response enhancement was most dramatic (i.e., superadditive) in an early time-restricted window. We refer to this phenomenon as the initial response enhancement (IRE). This complex result is illustrated in an example neuron in Figure 1D, and its components are discussed thereafter at the level of the population.
Multisensory integration shortened response latencies
In the studied sample, the onset of the multisensory response was consistently earlier than that of the earliest unisensory response (Kolmogorov–Smirnov test; p < 0.05). In the example in Figure 1, the multisensory response was initiated at 80 ms, which was 19 ms before the earliest unisensory response (i.e., the multisensory response was 74% earlier than expected). Figure 2A shows the distribution of multisensory latency shifts in the studied population calculated by subtracting the earliest unisensory response latency from the multisensory response latency (negative values indicate faster multisensory responses). This was done for stimulus combinations in which both visual and auditory stimuli were individually effective at eliciting responses (top) and stimulus combinations in which only the auditory stimulus was effective (middle). The probability distributions of latency shifts are negatively skewed, with mean shifts of −6.2 ms (−37% mean proportional shift) when both stimuli are individually effective, and −4.2 ms (−23% mean proportional shift) when only the auditory stimulus is effective. The cumulative distributions (plotted below the probability distributions) show that a majority of the cross-modal stimulus combinations produce speeded responses (69% when both stimuli are effective, 74% when only the auditory stimulus is effective). Large latency shifts were most likely when stimuli elicited weak responses with long latencies. Of the studied neurons, 100% speeded their response to at least one cross-modal stimulus combination. However, of the 28 studied neurons responding to both stimuli, there was between a 17 and 100% chance (mean 69%) that a randomly selected cross-modal stimulus combination elicited a speeded response (Fig. 2B).
Figure 2.
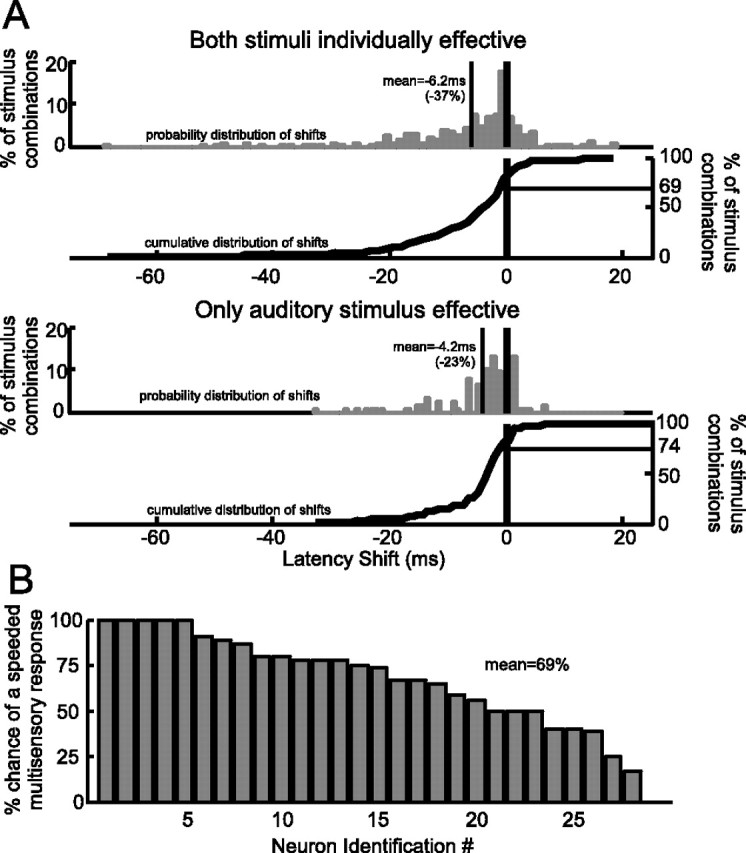
Multisensory stimuli evoke speeded responses. A, The probability distributions (gray bars, left axis) and cumulative distribution functions (solid curves plotted below, right axis) for response latency shifts produced by multisensory integration (multisensory latency, shortest unisensory latency). Cross-modal stimulus conditions are divided into two categories: those in which both modality-specific stimulus components produce responses individually (i.e., when alone), and those in which only the auditory stimulus is effective. B, The percentage of stimulus conditions that produced speeded responses in each of the bimodal neurons studied.
Multisensory integration produced an enhanced response
When the cross-modal stimulus shortened the response latency, proportionate enhancement was greatest before the onset of the earliest unisensory response because the multisensory response was compared with a referent of zero (e.g., between 80 and 98 ms in Fig. 1C). As noted above, this occurred in 69% of cross-modal stimulus combinations in which both modality-specific stimuli were effective, and 74% of combinations in which only the auditory stimulus was effective. Because the MSI was capped at a maximum of 1000% (see Materials and Methods), the mean MSI values immediately before the onset of the referent unisensory response were 690 and 740% (Fig. 3). Even when the cross-modal stimulus did not shift the response latency, it produced enhanced responses in an additional 24% of the stimulus combinations in which both modality-specific stimuli were individually effective and an additional 22% of stimulus combinations in which only the auditory stimulus was effective. Enhancement, when produced, always began within 40 ms of the earliest unisensory referent response. MSI decreased rapidly after the onset of the referent response, stabilizing at a value of 120% (both stimuli individually effective) or 35% (only the auditory stimulus effective) within 40 ms.
Figure 3.

The temporal profile of multisensory enhancement. Shown are the mean differences between the multisensory and best unisensory qsums (Î ı qsum, refer to the left axis) and the mean proportionate enhancement (MSI, refer to the right axis) at each moment in time. All data are time-shifted so that the earliest unisensory response began at 0 ms for the two categories described in the text. MSI was greatest before the onset of the referent unisensory response, because the unisensory referent was zero. MSI decreased within 40 ms to approximately stable values of 120% (top) and 35% (bottom). Inserts show the distributions (across conditions) of Î ı qsums at selected moments in time (50 and 1 ms before the earliest unisensory response).
Multisensory integration was generally superadditive during the IRE
To examine the computational mode of integration at different time points in the response, the summed unisensory qsums were subtracted from the multisensory qsum for stimulus combinations in which both modality-specific stimuli were effective. Multisensory responses that began before the earliest unisensory response necessarily represented a superadditive computation (because both unisensory referents were zero). As noted above, this occurred in response to 69% of the cross-modal stimulus combinations. In addition, 19% of the cross-modal stimulus combinations did not produce earlier multisensory responses but did exhibit a superadditive multisensory computation, almost always initiated (98% of the time) within 40 ms of the earliest unisensory response. Thus, in all, there were superadditive computations evident in the responses to 88% of the cross-modal stimulus combinations. Forty milliseconds after the unisensory response onset, the multisensory computation shifted to no more than additive in response to 65% of stimulus combinations. Thus, a window preceding the earliest unisensory response and terminating within 40 ms circumscribes the phase of IRE (Fig. 4).
Figure 4.

Computational impact of latency shifts. A, The mean difference between the multisensory and summed unisensory responses for conditions in which both modality-specific stimuli occur before any response (0 = earliest response onset). The multisensory computation was initially superadditive (box, vertical arrow), then transitioned to additive within 40 ms. Inserts show the distributions (across conditions) of Î ı qsums at selected moments in time (50 and 1 ms before the earliest unisensory response). B, The percentage of conditions producing superadditive computations at or before each moment in time (0 = earliest unisensory response). Eighty-eight percent of conditions producing enhancement contained a superadditive computation 69% of the time before the earliest unisensory response.
Discussion
Our finding that multisensory integration produces a shortening of the latency between the stimulus and response of an SC neuron has implications for understanding both the neural mechanisms underlying multisensory response enhancement and the influence of SC multisensory integration on the expression of orienting behavior. With regard to behavior, there is evidence from single-unit recording (Dorris et al., 1997; Bell et al., 2005), microstimulation (Stanford et al., 1996), and pharmacological inactivation (Lee et al., 1997) studies to suggest that the level of activity among SC output neurons influences reaction time for orienting to sensory goals. Accordingly, it has long been assumed that there is a causal relationship between increases in SC activity (both for individual neurons and in the recruitment of otherwise silent neurons) that are consequent to multisensory integration and observed enhancements in orientation behaviors (Stein et al., 1988). In cats, cross-modal stimuli are associated with dramatically improved performance on overt orientation tasks (Stein et al., 1988, 1989; Wilkinson et al., 1996; Jiang et al., 2002), and in primates, cross-modal stimuli are often associated with significant decreases in reaction time for sensory-guided gaze shifts (Bernstein et al., 1969; Gielen et al., 1983; Perrott et al., 1990; Hughes et al., 1994; Frens et al., 1995; Goldring et al., 1996; Harrington and Peck, 1998; Diederich and Colonius, 2004; Van Opstal and Munoz, 2004).
Although the presumed relationship between the magnitude of sensory-contingent SC activity and reaction time seems intuitive, it is not a direct one. Although it is the sensory stimulus that evokes the initial response among SC neurons, it is a later motor-related discharge that triggers the movement to acquire the stimulus (Stein et al., 1976; Mays and Sparks, 1980). Thus, one must assume that the sensory-evoked response sets in motion a cascade of events that results in the issuing of a motor command and that the time necessary to achieve this end depends on the magnitude of the initial event. This scenario seems plausible; however, our findings demonstrating the IRE suggest that cross-modal stimuli can also reduce SC response latencies at an even earlier processing stage, specifically, as early as the initial component of the sensory response. Thus, in addition to promoting a decrease in the interval between sensory- and motor-related activation in the SC (Bell et al., 2005, 2006), multisensory enhancement could speed behavioral responses by reducing latency of the entire sensorimotor interval. The magnitudes of the proportional shifts we observe at the neural level are approximately the same as those seen at the behavioral level (Frens et al., 1995; Goldring et al., 1996).
Mechanistically, the IRE is straightforward and likely to arise from temporal summation of subthreshold excitatory postsynaptic potentials arising on modality-specific channels. Presumably, action potentials evoked by modality-specific stimuli themselves are the culmination of temporal summation of the subthreshold events that is necessary to reach threshold. Clearly, a cross-modal stimulus that simultaneously activates independent input channels provides the opportunity for reaching threshold sooner than if either modality-specific channel is activated alone. The potential magnitude of such a latency shift would therefore only be constrained by the length of the modality-specific temporal summation intervals. Thus, the seemingly counterintuitive finding that multisensory impulse activity can actually begin before either of the unisensory component responses is wholly consistent with concepts of how nonpropagated electrical events precede and initiate neural impulses.
In a previous report (Stanford et al., 2005), we demonstrated that the response to a cross-modal stimulus in these same neurons can exceed the sum of the responses to the modality-specific component stimuli. Such superadditivity was only likely if the modality-specific stimulus components themselves were minimally effective and suggested that this apparently supralinear form of integration reflects the temporal coincidence of subthreshold modality-specific inputs. In contrast, combinations of more effective stimuli generally produced additivity or subadditivity and, accordingly, the proportionate multisensory enhancement declined as an inverse function of stimulus efficacy consistent with the principle of inverse effectiveness (Stein and Meredith, 1993). The current analysis considers multisensory integration on a much finer time scale. Unlike previous studies, in which analyses were based on the entire duration of the sensory-evoked response (Stanford et al., 2005), here, integration is considered on a moment-by-moment basis. We find that many of the same principles apply when considering the temporal evolution of a multisensory response. For example, consistent with its interpretation as an early interaction of subthreshold events, the IRE represents a transient superadditive phase that is relatively common but one that gives way to additivity or subadditivity as the interaction proceeds in time. Thus, although it may be useful to classify an interaction for a given stimulus condition as singularly superadditive, additive, or subadditive (Stanford et al., 2005), the present findings emphasize that multiple integrative modes are expressed during the evolution of any given multisensory response. Considered from this perspective, superadditivity is far more common than previously noted and not restricted to the case of uncommonly weak or ambiguous stimuli. Indeed, superadditivity was evident in the responses to 88% of the stimulus combinations studied in this dataset, usually during the earliest phase of enhancement. Thus, if one considers multisensory response latency in addition to response magnitude, superadditive interactions may play a far more prominent role in producing behavioral outcomes than previously appreciated.
Footnotes
This work was supported by National Institutes of Health Grants NS36916 and NS22543.
References
- Anastasio TJ, Patton PE. Analysis and modeling of multisensory enhancement in the deep superior colliculus. In: Calvert GA, Spence C, Stein BE, editors. The handbook of multisensory processes. Cambridge, MA: Bradford Books/MIT; 2004. pp. 265–284. [Google Scholar]
- Anastasio TJ, Patton PE, Belkacem-Boussaid K. Using Bayes' rule to model multisensory enhancement in the superior colliculus. Neural Comput. 2000;12:1165–1187. doi: 10.1162/089976600300015547. [DOI] [PubMed] [Google Scholar]
- Bell AH, Meredith MA, Van Opstal AJ, Munoz DP. Crossmodal integration in the primate superior colliculus underlying the preparation and initiation of saccadic eye movements. J Neurophysiol. 2005;93:3659–3673. doi: 10.1152/jn.01214.2004. [DOI] [PubMed] [Google Scholar]
- Bell AH, Meredith MA, Van Opstal AJ, Munoz DP. Stimulus intensity modifies saccadic reaction time and visual response latency in the superior colliculus. Exp Brain Res. 2006;174:53–59. doi: 10.1007/s00221-006-0420-z. [DOI] [PubMed] [Google Scholar]
- Bernstein IH, Clark MH, Edelstein BA. Effects of an auditory signal on visual reaction time. J Exp Psychol. 1969;80:567–569. doi: 10.1037/h0027444. [DOI] [PubMed] [Google Scholar]
- Diederich A, Colonius H. Bimodal and trimodal multisensory enhancement: effects of stimulus onset and intensity on reaction time. Percept Psychophys. 2004;66:1388–1404. doi: 10.3758/bf03195006. [DOI] [PubMed] [Google Scholar]
- Dorris MC, Pare M, Munoz DP. Neuronal activity in monkey superior colliculus related to the initiation of saccadic eye movements. J Neurosci. 1997;17:8566–8579. doi: 10.1523/JNEUROSCI.17-21-08566.1997. [DOI] [PMC free article] [PubMed] [Google Scholar]
- Frens MA, Van Opstal AJ, Van der Willigen RF. Spatial and temporal factors determine auditory-visual interactions in human saccadic eye movements. Percept Psychophys. 1995;57:802–816. doi: 10.3758/bf03206796. [DOI] [PubMed] [Google Scholar]
- Friedman HS, Priebe CE. Estimating stimulus response latency. J Neurosci Methods. 1998;83:185–194. doi: 10.1016/s0165-0270(98)00075-2. [DOI] [PubMed] [Google Scholar]
- Gielen SC, Schmidt RA, van den Heuvel PJ. On the nature of intersensory facilitation of reaction time. Percept Psychophys. 1983;34:161–168. doi: 10.3758/bf03211343. [DOI] [PubMed] [Google Scholar]
- Goldring JE, Dorris MC, Corneil BD, Ballantyne PA, Munoz DP. Combined eye-head gaze shifts to visual and auditory targets in humans. Exp Brain Res. 1996;111:68–78. doi: 10.1007/BF00229557. [DOI] [PubMed] [Google Scholar]
- Harrington LK, Peck CK. Spatial disparity affects visual-auditory interactions in human sensorimotor processing. Exp Brain Res. 1998;122:247–252. doi: 10.1007/s002210050512. [DOI] [PubMed] [Google Scholar]
- Hughes HC, Reuter-Lorenz PA, Nozawa G, Fendrich R. Visual-auditory interactions in sensorimotor processing: saccades versus manual responses. J Exp Psychol Hum Percept Perform. 1994;20:131–153. doi: 10.1037//0096-1523.20.1.131. [DOI] [PubMed] [Google Scholar]
- Jiang W, Jiang H, Stein BE. Two corticotectal areas facilitate multisensory orientation behavior. J Cogn Neurosci. 2002;14:1240–1255. doi: 10.1162/089892902760807230. [DOI] [PubMed] [Google Scholar]
- Lee PH, Helms MC, Augustine GJ, Hall WC. Role of intrinsic synaptic circuitry in collicular sensorimotor integration. Proc Natl Acad Sci USA. 1997;94:13299–13304. doi: 10.1073/pnas.94.24.13299. [DOI] [PMC free article] [PubMed] [Google Scholar]
- Mays LE, Sparks DL. Dissociation of visual and saccade-related responses in superior colliculus neurons. J Neurophysiol. 1980;43:207–232. doi: 10.1152/jn.1980.43.1.207. [DOI] [PubMed] [Google Scholar]
- McHaffie JG, Stein BE. A chronic headholder minimizing facial obstructions. Brain Res Bull. 1983;10:859–860. doi: 10.1016/0361-9230(83)90220-4. [DOI] [PubMed] [Google Scholar]
- Meredith MA, Stein BE. Interactions among converging sensory inputs in the superior colliculus. Science. 1983;221:389–391. doi: 10.1126/science.6867718. [DOI] [PubMed] [Google Scholar]
- Meredith MA, Nemitz JW, Stein BE. Determinants of multisensory integration in superior colliculus neurons. I. Temporal factors. J Neurosci. 1987;7:3215–3229. doi: 10.1523/JNEUROSCI.07-10-03215.1987. [DOI] [PMC free article] [PubMed] [Google Scholar]
- Perrott DR, Saberi K, Brown K, Strybel TZ. Auditory psychomotor coordination and visual search performance. Percept Psychophys. 1990;48:214–226. doi: 10.3758/bf03211521. [DOI] [PubMed] [Google Scholar]
- Stanford TR, Freedman EG, Sparks DL. Site parameters of microstimulation: evidence for independent effects on the properties of saccades evoked from the primate superior colliculus. J Neurophysiol. 1996;76:3360–3381. doi: 10.1152/jn.1996.76.5.3360. [DOI] [PubMed] [Google Scholar]
- Stanford TR, Quessy S, Stein BE. Evaluating the operations underlying multisensory integration in the cat superior colliculus. J Neurosci. 2005;25:6499–6508. doi: 10.1523/JNEUROSCI.5095-04.2005. [DOI] [PMC free article] [PubMed] [Google Scholar]
- Stein BE, Meredith MA. Cambridge, MA: MIT; 1993. The merging of the senses. [Google Scholar]
- Stein BE, Goldberg SJ, Clamann HP. The control of eye movements by the superior colliculus in the alert cat. Brain Res. 1976;118:469–474. doi: 10.1016/0006-8993(76)90314-0. [DOI] [PubMed] [Google Scholar]
- Stein BE, Huneycutt WS, Meredith MA. Neurons and behavior: the same rules of multisensory integration apply. Brain Res. 1988;448:355–358. doi: 10.1016/0006-8993(88)91276-0. [DOI] [PubMed] [Google Scholar]
- Stein BE, Meredith MA, Huneycutt WS, McDade L. Behavioral indices of multisensory integration: orientation to visual cues is affected by auditory stimuli. J Cogn Neurosci. 1989;1:12–24. doi: 10.1162/jocn.1989.1.1.12. [DOI] [PubMed] [Google Scholar]
- Van Opstal AJ, Munoz DP. Auditory-visual interactions subserving primate gaze orienting. In: Calvert GA, Spence C, Stein BE, editors. Handbook of multisensory processes. Cambridge, MA: MIT; 2004. pp. 373–394. [Google Scholar]
- Whitchurch EA, Takahashi TT. Combined auditory and visual stimuli facilitate head saccades in the barn owl (Tyto alba) J Neurophysiol. 2006;96:730–745. doi: 10.1152/jn.00072.2006. [DOI] [PubMed] [Google Scholar]
- Wilkinson LK, Meredith MA, Stein BE. The role of anterior ectosylvian cortex in cross-modality orientation and approach behavior. Exp Brain Res. 1996;112:1–10. doi: 10.1007/BF00227172. [DOI] [PubMed] [Google Scholar]