

Abstract
The massive feedback projections from cortex to the thalamus modulate sensory information transmission in many ways. We investigated the role of corticothalamic feedback projections on the directional selectivity (angular tuning) of neurons in the rat ventral posterior medial (VPM) nucleus to stimulation of their principal whisker. The angular tuning properties of single VPM neurons were compared before and after epochs of electrical stimulation of layer VI feedback neurons in the ipsilateral cortex under urethane anesthesia. Microstimulation of layer VI in “matched” (homologous) barrel columns sharpens the angular tuning curves of single VPM neurons that are tuned to the same direction as the stimulation site in the cortex. Further, microstimulation rotates the angular preference of VPM neurons initially tuned to a different direction toward the direction that cortical neurons prefer. Stimulation in “mismatched” (nonhomologous) barrel columns suppresses responses without consistent effects on angular tuning. We conclude that the primary sensory cortex exerts a significant influence on both spatial and angular tuning maps in the relay nuclei that project to it. The results suggest that the tuning properties of VPM cells in the behaving animal are continually modified to optimize perception of the most salient incoming messages.
Keywords: barrel cortex, corticofugal projections, angular tuning, VPM, rat, whiskers, attention
Introduction
A fundamental question in neuroscience is how the brain acquires, processes, stores, and retrieves information to adapt to changing conditions. Sensory information is transmitted from periphery to cortex through topographically organized neural structures in a feedforward manner (Rumelhart and McClelland, 1986). These structures are often called “computational maps” (Knudsen et al., 1987), which are thought to underlie higher order processes leading to perception and cognition (Knudsen et al., 1987; Kaas, 1991; Buonomano and Merzenich, 1998; Calford, 2002). However, information flow in sensory systems is bidirectional. The cortex projects extensively back to the thalamus, and corticothalamic (CT) projections are 3- to 10-fold greater in number compared with the ascending projections from the brainstem (Guillery, 1969; Liu et al. 1995). CT projections are highly reciprocal (Deschenes et al., 1998), such that the top-down processes may interfere with sensory information processing (Hillenbrand and van Hemmen, 2002; Alitto and Usrey, 2003). Studies in auditory, somatosensory, and visual systems in bats, cats, rats, and monkeys have demonstrated that corticofugal projections are responsible for altering the transmission mode and the receptive field (RF) properties of thalamic relay neurons as well as the firing synchrony during the animal's sleep/wake cycle (Sherman and Guillery, 1996, 2002; Guillery and Sherman, 2002; Sillito and Jones, 2002; Worgotter et al., 2002; Steriade and Timofeev, 2003; Suga et al., 2003). Although the massive feedback pathway is an indispensable component of the processing loop for sensory information (Kleinfeld et al., 1999; Nicolelis and Fanselow, 2002a,b; Ahissar and Kleinfeld, 2003), little is known about how CT feedback biases cortical and thalamic computational maps.
In rats' vibrissa (whisker) system, whisker representation areas contain functional “whisker maps,” which correlate well with the anatomical “barrelettes” in the brainstem (Ma, 1991), “barreloids” in thalamus (Van der Loos, 1976), and “barrels” in layer IV of the primary somatosensory cortex (SI) (Woolsey and Van der Loos, 1970) (Fig. 1). Recent evidence shows that the thalamic whisker map is not independent of cortical feedback (Temereanca and Simons, 2004). However, neurons within the whisker position map also show direction selectivity (also known as angular tuning) to whisker deflections (Simons and Carvell, 1989; Lichtenstein et al., 1990; Bruno et al., 2003; Minnery and Simons, 2003; Minnery et al., 2003; Timofeeva et al., 2003; Lee and Simons, 2004), and angular tuning maps have been reported in both thalamus and cortex (Timofeeva et al., 2003; Andermann and Moore, 2006). However, cortical influences on direction selectivity of thalamic neurons have not been demonstrated.
Figure 1.
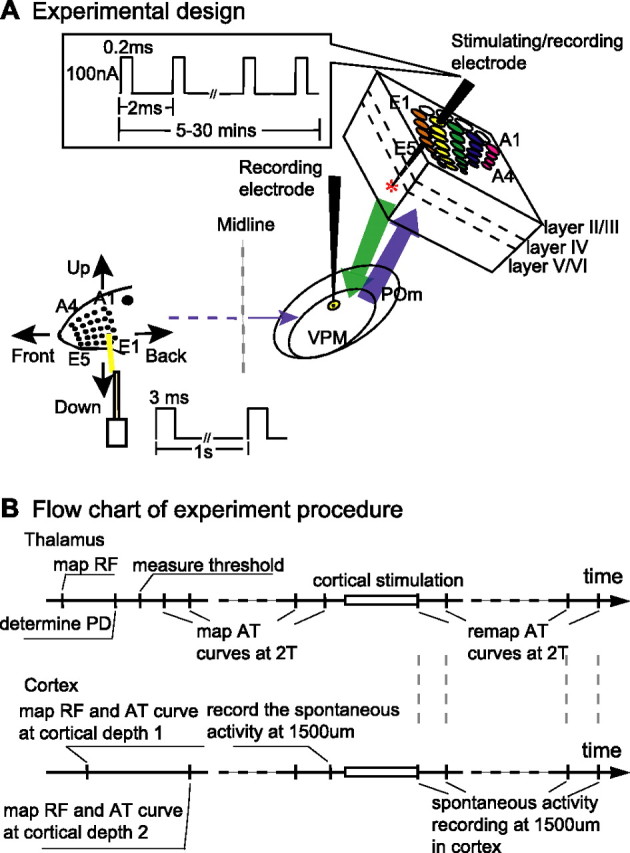
Experiment design. A, Schematic diagram showing how directional preference [angular tuning (AT)] of single VPM thalamic neurons was recorded in response to principal whisker (yellow line on head drawing) stimulation in thalamus before (control) and after cortical stimulation (experimental) from the corresponding (homologous) or adjacent (nonhomologous) barrel columns in the upper part of layer VI (layer VIa) in urethane-anesthetized rats. Each VPM neuron is sampled by the thalamic recording electrode to determine the RF, angular tuning features, and response threshold to the preferred direction. The RF and angular tuning properties of single cortical neurons in layer IV-VI in BFC are measured with the stimulating/recording electrode. Layer VIa neurons at 1500 μm were activated by a train of electrical pulses (100 nA, 0.2 ms unipolar pulses, 2 ms interpulse interval; inset) delivered through the stimulating/recording electrode for 5–30 min. After cortical stimulation, the directional preference of the same VPM neuron was remapped at 2T stimulus intensity and compared with the prestimulation data. B, A flow chart illustrating the time course of the experiments starting with the animal anesthetized and the electrodes poised to record. The RF in the thalamus was identified first and then compared with the characteristics of the cortical site. The cortical stimulation procedure is the same event on both flow charts (rectangle). After stimulation, the remapping of the angular tuning (AT) curves in thalamus was interspersed with the recording of spontaneous activity levels in cortex.
To address this question, we compared directional preference of single ventral posterior medial (VPM) neurons before and after focally and reversibly increasing CT feedback by electrical stimulation of cortical neurons in urethane-anesthetized rats. We found that stimulating the cortex significantly altered both the spatial (whisker) and angular tuning (directional selectivity) maps of neurons in rat VPM nucleus to principal whisker deflections. We conclude that CT projections have precise control over the firing properties of thalamic relay neurons and that they execute a dominant influence on angular tuning maps in the thalamus.
Materials and Methods
Animal preparation.
Experiments were performed on 57 adult male Long–Evans rats (250∼350 g) in compliance with federal and Vanderbilt University Institutional Animal Care and Use Committee (IACUC) guidelines for animal use. All experimental protocols were approved by the Vanderbilt University IACUC. Rats were anesthetized with urethane (1.5 g/kg, 30% aqueous solution, i.p.). The head was mounted in a stereotaxic apparatus (Narishige, Tokyo, Japan), and body temperature was maintained at 37 ± 2°C with a heating pad, feedback-controlled by a rectal thermometer (Harvard Labs). A rectangular craniotomy was made in the skull to expose the brain area 2–4 mm posterior and 2–4 mm lateral to bregma to provide vertical access to the thalamus. Another circular opening was made over the ipsilateral primary SI, which was centered at 2 mm posterior and 6 mm lateral to bregma with a diameter of ∼4 mm. Short slits were made in the dura with a 30 gauge syringe needle to facilitate electrode entry into the brain. The bone debris was carefully removed with saline during drilling. Warm saline was repeatedly applied to the brain surface to prevent drying of the cortex.
Electrophysiology.
Extracellular single-unit recording was conducted in both the thalamus and cortex with carbon-fiber microelectrodes (Armstrong-James and Millar, 1979; Armstrong-James et al., 1980). One carbon-fiber microelectrode (the recording electrode) was advanced vertically into the thalamus through the posterior opening by a mechanical stepping motor microdrive (Kopf Instruments, Tujunga, CA) with an accuracy of ∼1 μm per step. Orientation of the thalamic recording electrode was calibrated as vertical using a plumb line before the initial penetration. A second carbon-fiber microelectrode was advanced into the ipsilateral barrel field cortex (BFC) by a separate mechanical stepping motor drive (Kopf Instruments) for stimulating and recording in the cortex. For cortical recording, the electrode holder and the microdrive were carefully orientated before each cortical penetration. The electrode was usually tilted 40∼45° degree lateral to the sagittal plane and deviated 10∼12° posteriorly from the coronal plane, depending on the barrel column being studied) to ensure the electrode entered orthogonal to the brain surface. Contact of the electrode tip with the pial surface was visualized with an operation microscope and could be heard on the audiomonitor when the electrode made contact with the brain surface. Single units were isolated on-line by waveform shape with a time-amplitude window discriminator (Bak Instruments, Germantown, MD). For each unit isolated, spikes were recorded with a CED 1401 Plus processor (Cambridge Electronic Design, Cambridge, UK) controlled by a PC (Dell, Round Rock, TX). Peristimulus time histograms (PSTHs) were generated online with bin width of 1 ms by in-house spike 2 scripts (Cambridge Electronic Design) to visualize the response properties. At the same time, all analog waveforms from the thalamus and cortex were digitized at 20 kHz and stored on a PC (Dell). Offline sorting methods were later used to confirm the quality of single unit isolation in thalamus and cortex. The depth of anesthesia was monitored by various signs (burst firing in thalamus/cortex, respiration/heart rate, voluntary whisker/body movements, and corneal/hindlimb withdrawal reflex) and supplements of anesthetic (10% of initial dose) were given as needed to maintain the anesthesia level at stage III-3 (Friedberg et al., 1999). To ensure the reliability of data recorded, all experiments were terminated within 14 h after initial induction of anesthesia.
Whisker stimulation.
Individual whiskers on the contralateral side of the snout were stimulated by a customized piezoelectric bimorph ceramic wafer mounted concentrically on a rotatable shaft, which enabled us to readily deflect each whisker from its neutral position in any single direction. The position of the stimulator was readjusted after each direction change to be in contact with, but not deflecting the whisker. The piezoelectric device was driven by brief (3 ms duration) square-wave pulses delivered from a computer-controlled digital stimulator (DS8000; World Precision Instruments, Sarasota, FL). We calibrated our piezoelectric stimulator by constructing the empirical function between the voltage applied to the piezoelectric stimulator and the actual amount of movement it produced measured by a high-speed digital video analysis (Redlake). These calibrations showed that the piezo element moved the whisker in only one direction and returned to its neutral position before the whisker returned to its neutral position. One block of trials consisted of 50 whisker stimulations delivered ∼10 mm away from the base of the whisker at 1 stimulus per second with the amplitude specified by the experiment protocol. Whisker stimuli used for recording in the thalamus and cortex were generally similar, but significant distinctions also existed. In the following text, detailed experimental procedures are described for recording both in the thalamus and cortex.
Recording in thalamus.
As the recording electrode was advanced into the dorsal thalamus, whiskers were stimulated by a hand-held probe. When robust firing was evoked, all whiskers on the right side of the face were trimmed to 10 mm. Electrode penetrations were first estimated by the x–y coordinates and the depth read-out of the microdrive from the cortical surface (Sugitani et al., 1990; Land et al., 1995; Haidarliu and Ahissar, 2001), then refined by response characteristics to piezoelectric whisker deflections. At urethane anesthesia stage III-3, most VPM neurons exhibit small receptive field size (1–2 whiskers) (Waite, 1973; Rhoades et al., 1987; Diamond et al., 1992a; Timofeeva et al., 2003), a tonic response mode to 1 s whisker stimulation (Sherman and Guillery, 1996), high firing probability, short modal latency, and low spontaneous firing (Li and Ebner, 2006). If any given single unit didn't generate a robust response with a modal response latency of ∼6 ms to the test stimuli, the unit was bypassed and the electrode was moved to a new place until another unit was identified and tested. The unit candidate was required to be clearly distinguishable by its waveform from other units detected, and usually the neuron with the highest waveform amplitude was selected at each penetration depth. Neuronal activity of both evoked response and spontaneous activity (SA) was recorded for >1 h to ensure satisfactory stability of every unit before proceeding.
Receptive field mapping.
The RF of VPM neurons was first mapped manually with a hand-held probe to determine the principal whisker (PW) then quantified by fifty deflections (300 μm forward movements) to the PW and the immediately adjacent whiskers. The PW always evoked many more spikes with the shortest modal latency than any other whisker. After the preferred direction (PD) was established, and the response threshold in the PD was determined for the unit (see the following text), the RF was then remapped at 2 times threshold (2T) stimulus intensity level in the PD.
Threshold assessment and angular tuning curve mapping.
The angular tuning curves of VPM neurons were mapped by deflecting the PW in forward (caudal to rostral), upward (ventral to dorsal), backward (rostral to caudal), and downward (dorsal to ventral) cardinal directions pseudorandomly at the amplitude specified by the protocol. Previous studies of angular tuning in the rat's vibrissa system most commonly mapped the angular tuning curves in 45° increments (eight directions), but our data suggested that mapping the angular tuning curves with four directions sufficiently summarized the angular tuning characteristics of VPM neurons with satisfactory resolution, at the same time improving efficiency. In one round of mapping, 50 stimuli were applied to the PW in each of four directions pseudorandomly. The first round of mapping was done with 300 μm deflections to determine the PD, which is the direction that VPM neurons responded with the highest magnitude and shortest latency. Accordingly, the other three directions were called nonpreferred directions. Repeated rounds were performed occasionally when it was thought necessary to check consistency. As reported in previous studies (Simons and Carvell, 1989; Bruno et al., 2003; Minnery et al., 2003; Timofeeva et al., 2003), VPM neurons clearly display directional selectivity, even under urethane anesthesia, indicating a differential sensitivity to whisker movements in different directions. When the response magnitude (number of spikes in the first 100 ms poststimulus) was plotted against the amplitude of whisker stimulation, angularly well tuned VPM neurons showed a different response threshold to each direction and the threshold to stimuli in the PD was almost always the lowest. Then, the response threshold of VPM cells for PW stimulation was determined in the PD. In the current study, the response threshold was defined as the lowest amplitude of PW deflection in the PD (i.e., lowest voltage applied to the piezoelectric stimulator) that statistically produced a response significantly different from the background (operationally, at least three spikes in one of the poststimulus bins in the PSTH) (Armstrong-James and Fox, 1987). In the current study, the threshold was determined by varying the voltage applied to the piezo stimulator in a linear-interpolation sequence (Li and Ebner, 2006). For example, if one VPM neuron responded to 200 μm deflections robustly, it would be tested by 100 μm deflections next; if the 100 μm whisker movements failed to fire the neuron, 150 μm would be tested, otherwise 50 μm would be used, and so on. When two successive amplitudes were close (<50 μm), voltage would be increased volt by volt to get an accuracy of ± 10 μm. Once the threshold to PD was determined, the angular tuning curve would be mapped again at a 2T intensity level over a period of time (>1 h). Data acquired were checked for consistency and used as the baseline. SA was recorded for 50 s when the stimulator was positioned near the whisker, but not activated.
Recording in cortex.
One major aim of the current study was to examine how precisely the BFC can modulate the angular tuning properties of thalamic relay neurons. It has been shown previously that the relationship between thalamic neuron tuning curves and multiunit cortical neuron activation plays a crucial role in interpreting the function of cortical feedback (Suga and Ma, 2003; Temereanca and Simons, 2004). Thus, it is necessary to map the angular tuning properties of layer VI neurons that are to be stimulated. After the properties of a single VPM unit were thoroughly documented, the cortical stimulating/recording electrode was positioned in the corresponding barrel column (the barrel column homologous to the isolated VPM neuron), or in one of the immediately adjacent barrel columns. As the cortical electrode was advanced toward upper layer VI (i.e., toward 1500 μm underneath the cortical surface) (Temereanca and Simons, 2004), single cortical units were isolated along the penetration at ∼100 μm intervals, which was calculated by the subpial depth read out of the microdrive. Multiunit activity was also digitized at 20 kHz and stored on a hard disk for off-line cell sorting and analysis. RFs of layer IV barrel cells were mapped to identify the barrel column and the PD of the penetration. Angular tuning curves of cortical units along the penetration were mapped with the same piezoelectric stimulator in a manner similar to that for VPM units. Fifty 300 μm deflections were presented at 1/s to the PW of the cortical unit in the four cardinal directions pseudorandomly before measuring the response threshold. Spontaneous discharge and spike duration of each cortical unit also was documented. The angular tuning curve of layer VI neurons was mapped when they were responsive to whisker stimulation.
Electrical microstimulation of layer VI “feedback” neurons.
CT projections from the upper sublayer of layer VI terminate exclusively within the corresponding barreloid whereas the projections from lower sublayer of layer VI tend to extend their collaterals to cover a larger area in VPM and may even extend into the medial division of the posterior group (POm) (Deschenes et al., 1998). The higher precision of upper layer VI projections was a factor in selecting it for investigating the cortical feedback on the angular tuning of thalamic relay neurons. The cortical stimulation paradigm was modified from previous studies in the bat auditory system (Yan and Suga, 1998; Zhang and Suga, 2000) where layer VI neurons were activated around the tip of the stimulating electrode. Trains of small currents (100 nA for 0.2 ms at 500 stimuli/s) were injected through the stimulating electrode (tip positive) at a depth of 1500 μm for 5, 10, 15, 20, 25, or 30 min, depending on the experimental protocol. Multiple units around the tip of the stimulating electrode were recorded after stimulation and compared with that before stimulation. The angular tuning curve of the same VPM unit was remapped at 2T after cortical stimulation to see whether any changes/recovery would take place over time after the stimulation procedure.
Data analysis.
PSTHs (bin size, 1 ms) were generated from neural activity occurring from 3 to 100 ms poststimulus for 50 stimuli in each recording block after correction for spontaneous discharge (Li and Ebner, 2006). Spikes before 3 ms poststimulus were rejected as being too early to be evoked responses. Angular tuning curves of thalamic and cortical units were built for each mapping epoch by plotting the spike counts against the corresponding direction in a polar map. For each VPM unit, angular tuning curves mapped at 2T during baseline recording were averaged at each sampling time to check the temporal consistency of angular preference. Units without continued fidelity in angular tuning were excluded from additional analysis. The average response magnitude to the PD was plotted against the stimulus intensity to construct a response curve. Latency histograms (LHs) were constructed from the first spike in each trial to assess the onset and LH modal response latency. Data from the same VPM unit sampled after cortical stimulation was processed in the same manner. The shape of angular tuning curves, response magnitude, and latency were compared before and after cortical stimulation.
Determination of angular tuning preferences of unresponsive layer VI neurons.
Angular tuning curves of cortical neurons (mostly in layers II/III, IV, and V) in the same penetration were also plotted in a similar manner. Cortical neurons were classified into fast spiking units (<750 μs spike duration) (FSUs) and regular spiking units (RSUs) (>750 μs spike duration). Angular tuning curves were plotted mainly for RSUs because RSUs show relatively better tuning than FSUs (Lee and Simons, 2004), but data from FSUs were also saved. Under anesthesia, rat layer VI neurons are mostly unresponsive to whisker stimulation (Armstrong-James and Fox, 1987). However, the present study requires the identification of the angular preference of the layer VI neurons that we stimulated, because the exact cortical influences on thalamic relay neurons depend heavily on the correspondence of tuning properties between thalamic neurons recorded and cortical neurons manipulated (Suga and Ma, 2003; Temereanca and Simons, 2004). To address this problem, the following criteria were set up to indirectly determine the angular preference of layer VI neurons.
First, we attempted to map the angular tuning curves of layer VI neurons near the tip of the stimulating electrode directly by searching for responsive units. In 30% of the cases (eight animals), we managed to build the angular tuning curves of layer VI neurons at 1500 μm. If the angular tuning curves could not be determined for layer VI cells, the angular tuning properties of cortical neurons above layer VI along the penetration were examined. Once cortical neurons sampled at the last three (or more) successive depths showed similar angular preference (i.e., tuned to the same direction), the penetration was categorized as within one of the barrel orientation subdivisions (Andermann and Moore, 2006), or angular “minicolumns” (Bruno et al., 2003; Mountcastle, 2003). In this manner the angular preference of those unresponsive layer VI neurons to be stimulated could be determined indirectly by the preferred directions of the cortical neurons in the same electrode penetration. Fifty percent of our final population (12 animals) was determined in this way. In the remaining cases (20%; four animals) where the two methods above both failed, the PD of layer VI neurons was estimated by the angular preference of neurons sampled immediately above layer VI (usually at 1200 μm).
Quantitative analysis of the angular tuning features.
Most VPM neurons in the “core region” of the barreloids (also known as VPMdm) are directionally tuned under urethane anesthesia (Timofeeva et al., 2003). To quantitatively characterize the angular preference of VPM neurons, a tuning ratio (Tr) was calculated. Here, the tuning ratio is defined as Tr = response of one VPM neuron to PD/average response to all four directions tested. By definition, Tr has a value range from 1 (“poorly tuned”) to 4 (“highly tuned”). Hence, Tr acts as an index of the directional selectivity of VPM neurons, which enables direct comparison of the angular tuning properties within and between VPM neurons before and after cortical stimulation. It should be noted that the form of Tr calculated here is very similar, to what has been used in previous publications (Minnery and Simons, 2003; Minnery et al., 2003). For every VPM neuron, Tr was computed for each mapping session to capture the temporal stability or instability of the angular specificity of every VPM neuron.
To further quantify the influence of cortical stimulation on angular tuning of VPM neurons, we introduced the tuning ratio prime (Tr′) calculation. Tr′ is defined as Tr′ = response of one VPM neuron to the preferred direction of cortical neurons stimulated/average response of the same VPM neuron to all four directions tested.
For example, suppose VPM unit A responds best to direction a whereas the cortical layer VI neurons to be stimulated preferred direction b (a and b can be the same or different), then Tr = A's response to a/average of A's response to all four directions; Tr′ = A's response to b/average of A's response to all four directions. By definition, Tr′ has a value range from 0 to 4. For each VPM neuron, Tr and Tr′ usually have different values (because VPM neurons and cortical neurons were tested in the same four directions, there is a 25% chance that VPM and cortical neurons were tuned to the same direction, in which case Tr and Tr′ have the same value). Tr′ is actually an indicator of the selectivity of cortical influence on the angular preference of thalamic relay neurons. The direction of the change of Tr′ reflects whether the shifts of angular tuning curves of VPM neurons after cortical stimulation correlates with the angular preference of layer VI neurons stimulated or not. Tr′ was also compared before and after cortical stimulation. A t test was performed to detect the significance.
Normalizing and aligning tuning curves of different VPM units.
Angular tuning curves were normalized for each VPM neuron by taking the average response magnitude to the PD in the baseline recording period as 100. Thus, for every unit, the normalized tuning curve was compared for similarity or difference between prestimulation and poststimulation phases. Tuning curves from various units were further aligned to their PDs in a clockwise display. For example, suppose VPM unit A was tuned to upward movement and VPM unit B was tuned to forward movement, and their values were normalized. To carry out the alignment, the angular curve of each unit before cortical stimulation was rotated in a clockwise direction so that their preferred directions coincided. Hence, an upward direction in the tuning curve of unit A was overlapped with the forward preference of unit B, the backward direction of unit A was then overlapped with the upward direction of unit B, and so on. Then data at each “direction” point were averaged to generate a new tuning curve. Poststimulation data were processed in the same way. To visualize the “redirecting” effect of cortex on VPM neurons, the tuning curve of each unit was aligned to the direction cortex preferred and compared before and after cortical stimulation.
Histology.
On completion of recording, the thalamic recording site was marked by passing DC current through the electrode (2 μA for 10 s, electrode tip positive). The location of layer VI stimulation was also marked by a lesion at 1500 μm, and in some cases, the cortical stimulating electrode was retracted back to 600 μm, where a second lesion was made to mark the electrode position in layer IV. The current produced a roughly spherical lesion, ∼50 μm in diameter, that was clearly visible as shown in the figures in cytochrome oxidase (CO)-stained sections. At the end of recording, the rat was overdosed with urethane and perfused transcardially with PBS followed by 4% paraformaldehyde in buffer. The brains were postfixed overnight and saturated in 10%, and then 20 and 30% sucrose. The brain was blocked coronally, sectioned at 50 μm thickness, and stained for CO activity (Wong-Riley and Welt, 1980) to localize barrels and microlesion sites. The cortical penetration was considered to be within the same barrel column if both lesions were localized within or below the boundaries of one barrel as defined by the appropriate patch of high CO activity in layer IV.
Results
Activation of layer VI neurons by electrical stimulation
Recording of neural activity in units around the tip of the electrode in layer VI immediately after the cortical stimulation procedure showed that electrical stimulation effectively elevated the background activity of layer VI neurons, but didn't produce any sign of injury discharge. Figure 2 shows the results of cortical recording in the locations where cortex was stimulated. Spontaneous discharge (Fig. 2E) in layer VI of animal 12 before cortical stimulation (green trace) was increased immediately after stimulation (black trace). It is clear that layer VI neurons before cortical stimulation were spontaneously active, however, immediately after stimulating cortex for 15 min (Fig. 2E, black trace), the spontaneous discharge of layer VI neurons around the tip of the stimulating electrode increased considerably, with much more spontaneous “bursting” activity. These findings were consistent among cases. We didn't retest the layer VI neurons in this animal after cortical stimulation to see whether they changed their response to D5 (principal) whisker stimulation, but data from experiments in other animals where the cortical and thalamic activity was recorded indicated that layer VI neurons that originally responded to principal whisker stimulation increased their evoked response magnitude after cortical stimulation (data not shown). We conclude that our electrical stimulation paradigm effectively enhanced cortical activity, and through this the levels of CT feedback.
Figure 2.
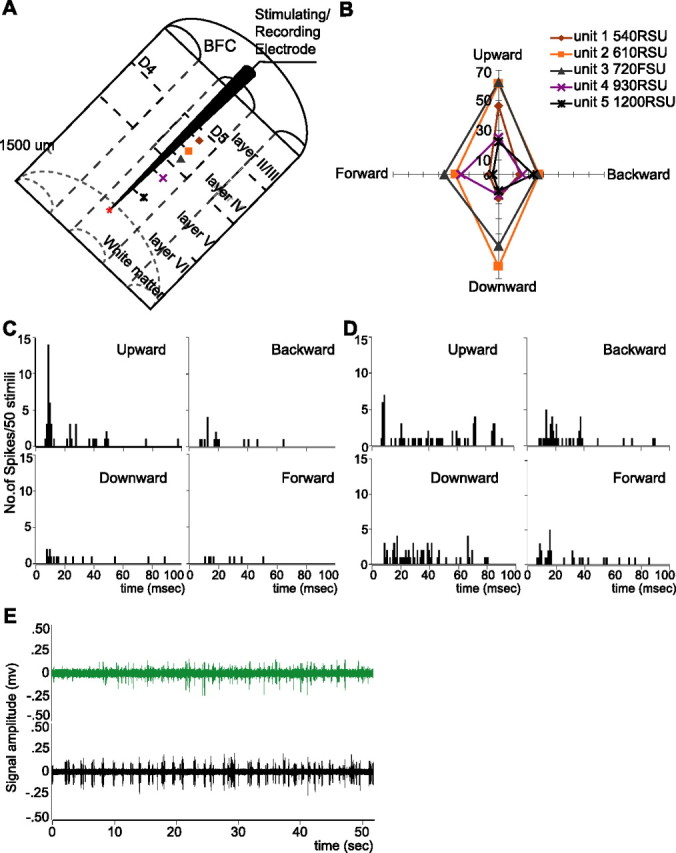
Characterization of cortical neurons in a representative case (animal 12). A, Schematic drawing showing the cortical recording location in animal 12. The stimulating electrode was placed in the D5 barrel column, and five single neurons were recorded from upper layer IV (540 μm) to deep layer V (1200 μm). The symbols are identified by neuron number, depth, and angular tuning in Figure 3B. B, Polar plots of angular tuning curves of five neurons sampled as the electrode approached layer VI in the D5 barrel column. Numbers along the vertical axis indicating the response magnitude (spike counts/50 stimuli) to the whisker stimuli (300 μm, 3 ms stimuli delivered 10 mm from the face at the rate of 1 stimulus per second) applied to the D5 principal whisker in each direction. Units are color-coded. The type of each unit (RSU vs FSU) and their subpial depth are indicated in the top right. Note that the symbols in the inset correspond with those in Figure 3A. Five cortical neurons show certain similarities in angular tuning, and they all prefer whisker movement in an upward direction. C, PSTHs of cortical unit 1 (sampled at 540 μm, RSU) to test stimuli in four directions (bin size, 1 ms; 50 trials in each direction). The same parameters were used previously unless specified. Cortical unit 1 is well tuned to up direction of D5 whisker movement. Note that unit 1 responded to test stimuli in an upward direction with the highest magnitude and shortest modal response latency (top left). D, PSTHs of cortical unit 2 to test stimuli in four directions. Cortical unit 2 is not as well tuned as cortical unit 1, but its preferred direction could be determined by examining the latency in each direction. Note that the short latency component is only dominant in response to test stimuli in an upward direction (top left); hence, cortical unit 2 is also tuned to upward movement of D5 whisker. With similar analysis, all five cortical neurons are tuned to the upward direction. From this we conclude that the stimulating electrode was in one minicolumn tuned to the upward direction of whisker movement. E, Fifty second epochs of spontaneous activity of layer VI neurons at 1500 μm depth before (green trace) and after (black trace) 15 min of stimulation. It is quite evident that cortical stimulation converted layer VI neurons from low spontaneous firing into spontaneously “bursty” activity.
Determination of angular preferences of unresponsive layer VI neurons
A prerequisite for this study was to specify the angular tuning properties of the VPM unit recorded and the layer VIa units near the site stimulated to investigate the cortical influence on directional preference of thalamic neurons. However, we confirmed the observation of Armstrong-James and Fox (1987) and others that most layer VI neurons are unresponsive to whisker stimulation under urethane anesthesia. Therefore, special approaches were adopted to determine the angular tuning features of those “unresponsive” layer VI units (see Materials and Methods). Figure 2 shows one example of how the angular tuning preference of unresponsive layer VI units was determined.
We sampled five cortical units in layer IV and V as the stimulating/recording electrode was advanced orthogonal to the cortical surface toward layer VI. In this case the electrode was in the D5 barrel column (Fig. 2A) because every unit showed a robust short latency response to D5 whisker deflections (Fig. 2B–D). Layer VI units in the D5 barrel column at 1500 μm had low spontaneous discharge (Fig. 2E, green trace) and failed to show a prominent response to manual stimulation of the D5 whisker. However, by measuring the angular tuning properties of cortical units above layer VI along the same penetration, we could indirectly estimate the directional preference of the “silent” layer VI units at 1500 μm.
Figure 2 shows plots of the angular tuning curves of all five cortical units sampled in animal 12. These five cortical units were in layer IV and V and most were RSUs. They were sampled at a depth of 540, 610, 720, 930, and 1200 μm in the D5 barrel column, as determined by microdrive readings (Fig. 2A,B). Casual observation of the responses shows little apparent common preferred direction among these five cortical units. However, careful examination of the response magnitude and modal response latency to each direction revealed that all five units were tuned to the up direction of D5 whisker deflections. Figure 2, C and D, demonstrates how the preferred direction was determined by checking the response magnitude with the modal response latency to each direction. Cortical unit 1 (Fig. 2C) is clearly a well tuned layer IV RSU to upward movement of the D5 whisker. When the response magnitude to several directions is close, the response latency is used to facilitate identifying the directional preference, as shown in Figure 2D. Cortical unit 2 (Fig. 2D) is also a layer IV RSU but not well tuned. When mapped for angular tuning features, it responded to upward and downward movements of the D5 whisker with similar spike count (Fig. 2B, orange line). A close examination of the PSTHs to different directions shows that upward movement is the preferred direction in cortical unit 2 because “up” produced a response at the shortest modal latency that dominated the response (Fig. 2D). Similar analysis was performed in all five cortical units above layer VI and they were found to respond predominantly to the upward movement of the D5 whisker with the highest magnitude and at the same time the shortest modal response latency. Thus, we conclude that in this penetration the stimulating electrode was within one sub-barrel domain, or a directional minicolumn (Bruno et al., 2003; Mountcastle, 2003; Andermann and Moore, 2006) in the D5 barrel column, which was tuned to upward whisker deflections, because these cortical units satisfied our criteria that three or more cortical units sampled at successive depths showed similar angular preference (in this case, to upward whisker deflections).
Cortical stimulation profoundly alters angular tuning properties of VPM neurons
Complete response profiles were recorded from 41 of 57 pairs of VPM layer VI units that responded robustly to whisker deflections, where one pair of VPM layer VI units were collected in each animal. Response properties of these VPM units, such as the RF size, response magnitude and latency, response threshold, and angular tuning features, were characterized by repeated recording for >1 h before cortical stimulation to ensure the response stability of each unit. The response characteristics of VPM units during baseline recording were consistent with those reported previously under urethane anesthesia (Waite, 1973; Armstrong-James and Callahan, 1991; Diamond et al., 1992a; Li and Ebner, 2006). The recording sites were confirmed by histological reconstruction. Cortical stimulation didn't significantly alter the spontaneous firing of VPM neurons (data not shown). However, evoked responses of VPM neurons were significantly affected after layer VI stimulation, and the effect was reversible. The altered evoked responses varied as a function of the period of cortical microstimulation and poststimulation decay, as illustrated by data from the VPM unit in animal 12 (Fig. 3). In the baseline recording, unit VPM12 responded robustly to stimulation of its principal whisker D5 with a short modal response latency (8 ms). Unit VPM12 had a one-whisker RF (only D5), and was sharply tuned to upward movements of the principal whisker (Fig. 3A, left, blue line) at a low response threshold (80 μm deflection). After mapping the angular tuning curve of VPM12 at 2T (160 μm whisker deflection), the stimulating electrode was advanced into layer VI of the ipsilateral D5 barrel column (Fig. 3A, right). The angular tuning curve of unit VPM12 was remapped at 2T after layer VI stimulation of the ipsilateral D5 barrel column for 5, 10, or 15 min, each followed by a 30 min recovery time. The data show that stimulating cortex for 5 min slightly increased the response of VPM12 to its preferred direction by 17% (Fig. 3A, left, pink line). Ten minutes of stimulation elevated the response of this neuron robustly by 61% (Fig. 3A, left, red line). A 50% response increase was also observed after 15 min stimulation (Fig. 3A, left, green line). Hence, at the single unit level, cortical feedback has a facilitatory influence on VPM neurons, which is consistent with results from multiunit recording (Temereanca and Simons, 2004). However, to our surprise, individual cells showed response enhancement only to the preferred direction. Responses to all other directions increased only slightly, but not significantly. Thus, cortical activity selectively enhanced the responsiveness of this VPM neuron to its preferred direction. The facilitation by cortex was reversible because the response magnitude returned to the prestimulation level after a 30 min recovery period (Fig. 3A, left, black line).
Figure 3.

Cortical stimulation effects on two VPM neurons. A, Left, Normalized angular tuning curves of unit VPM12 before and after layer VI stimulation and subsequent recovery. Numbers in the vertical axis indicate the relative response level (for details, see Materials and Methods). Angular tuning curves are plotted before cortical stimulation (blue line) and after stimulating cortex for 5 min (pink line), 10 min (red line), and 15 min (green line). The black line shows recovery values. Cortical stimulation greatly enhances the response magnitude (by 50% after 15 min stimulation), but the enhancement is selective to the preferred direction, which results in a sharpening effect on the tuning curve. The facilitatory effects of cortical stimulation are completely reversible. Right, Diagram showing the relative location of the recording electrode in thalamus and stimulating electrode in cortex in animal 12. The thalamic recording electrode sampled a D5 barreloid cell, and the cortical stimulating electrode was advanced into the ipsilateral homologous (D5) barrel column. B, Left, Polar plot of the normalized angular tuning curves of unit VPM23 before (black line) and after (red line) layer VI stimulation. Angular tuning curves are plotted before cortical stimulation and after stimulating cortex for 30 min. Cortical stimulation had a broadening effect on the tuning curve of this unit. Right, Diagram showing the relative location of the recording electrode in thalamus and stimulating electrode in cortex in animal 23. The thalamic recording electrode sampled a C2 barreloidal cell and the cortical stimulating electrode was advanced into the ipsilateral homologous (C2) barrel column.
The effect of the cortical stimulation, however, was completely different in another unit, VPM23. Before stimulating the cortex, the principal whisker of unit VPM23 was the C2 whisker and the angular tuning curve of unit VPM23 was mapped at 2T (Fig. 3B, left, black line). In this animal, the cortical stimulating electrode was advanced into layer VI of the ipsilateral homologous barrel column (C2) (Fig. 3B, right). Thirty minutes of cortical stimulation greatly altered the shape of the angular tuning curve of unit VPM23, as shown in Figure 3B (red line). However, cortical stimulation broadened the angular tuning curve of unit VPM23, which was quite different from the effect in unit VPM12.
Grouping VPM neurons by their spatial and angular tuning relationships with cortex
Previous studies in visual and auditory as well as somatosensory systems have demonstrated that the cortical modulation of thalamic response relies heavily on the tuning properties of the thalamic neurons recorded and cortical neurons manipulated (Tsumoto et al., 1978; Yan and Suga, 1996, 1998; Zhang et al., 1997; Temereanca and Simons, 2004; for review, see Suga and Ma, 2003), so it is necessary to categorize VPM units by their spatial and angular tuning features and match them with the interacting cortical units to study the subtlety of cortical stimulation effects on the directional selectivity of thalamic relay cells. The four relationships between spatially and angularly matched properties are shown diagrammatically in Figure 4. In the present study, 24 pairs of VPM layer VI units finally passed our rigorous criteria for response stability and directional preference, and they constitute the data for this report. For each pair of VPM layer VI units, the receptive fields and angular tuning properties were carefully mapped. From the location of the recording sites in VPM and the stimulating sites in cortex, 18 VPM units were classified as “spatially matched” with cortex, meaning that the stimulating electrode was in the matched (homologous) barrel column. Six units were “spatially mismatched” with cortex, which means that the stimulating electrode was in one of the adjacent barrel columns (nonhomologous, or mismatched columns). By comparing the angular preferences of VPM units and the stimulated layer VI loci, three VPM units were found to be both “spatially and angularly matched” with cortex, meaning that the barreloid corresponded with the barrel and was tuned to the same direction as the layer VI units. Fifteen VPM units were “spatially matched but angularly mismatched,” that is, they were in the corresponding barreloids but tuned to a different direction from cortex. All six spatially mismatched VPM units turned out to be angularly mismatched with cortex (Table 1). Initially, data from different groups were analyzed separately, then integrated among groups, as described in the following text.
Figure 4.
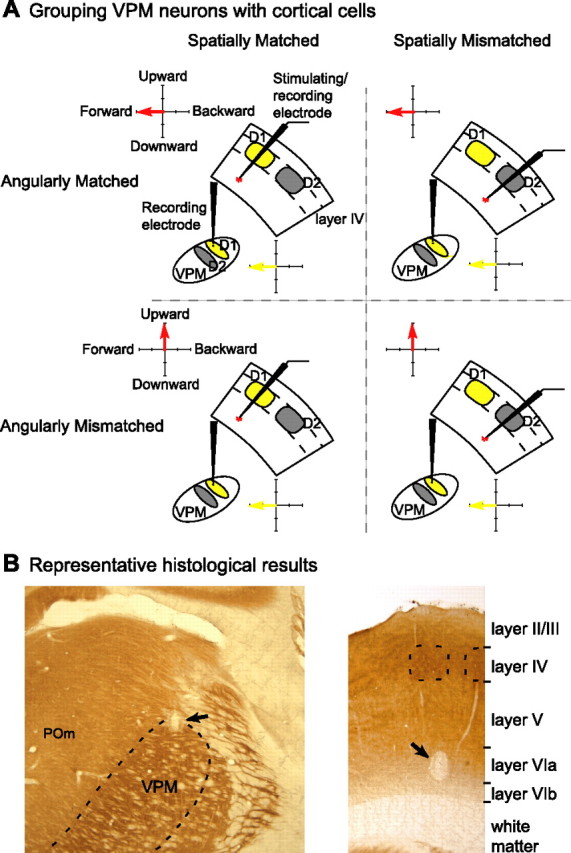
Grouping of VPM neurons by their tuning relationships with the cortex. A, The location of the thalamic and cortical electrodes was determined by the RFs of neurons sampled. By correlating the thalamic recording locus with the layer VI cortical stimulation site in each animal, VPM neurons can be classified as spatially matched (i.e., the electrodes were in barreloid/barrel loci with the same principal whisker, represented here by the same yellow color in VPM and cortex) or spatially mismatched (e.g., the gray barrel column correlated with cells in the yellow barreloid) with cortical neurons. At the same time, the directional preference of each VPM layer VI neuron pair could be determined by whisker stimulation direction. Thus, by comparing the angular tuning properties between VPM neurons and the corresponding cortical neurons, VPM neurons also could be classified as angularly matched and angularly mismatched with cortex. These pairing conditions categorize four groups of VPM neurons: spatially and angularly matched with cortex (top left; n = 3) (Table 1); spatially matched but angularly mismatched with cortex (bottom left; n = 15); neither spatially nor angularly matched with the cortex (bottom right; n = 6); or spatially mismatched but angularly matched with the cortex (top right; n = 0) (for the rationale, see Results). B, Representative histological results from animal 02. Left, Coronal section showing the location of the electrolytic lesion in VPM after CO staining. The VPM border is indicated by the dashed lines. Electrophysiological data indicate the electrode was in C1 barreloid and the lesion (black arrow) was located in the dorsal part of VPM. Right, Coronal section from the same animal visualizing the location of electrolytic lesion in the barrel field cortex after CO staining. Dashed lines indicate barrels. In the experiment, the stimulating electrode was placed in ipsilateral C1 barrel column. The location of the electrolytic lesion in cortex (black arrow) confirms that the stimulating site was in layer VIa of the C1 barrel column. [Contrast was adjusted in Adobe (San Jose, CA) Photoshop 7.0.]
Table 1.
Summary of grouping 24 VPM units by the relationship of their spatial and angular tuning properties with the cortex
| Spatially matched | Spatially mismatched | Total | |
|---|---|---|---|
| Angularly matched | 3 | 0 | 3 |
| Angularly mismatched | 15 | 6 | 21 |
| Total | 18 | 6 | 24 |
Cortical stimulation sharpens angular tuning curves of VPM neurons in a homologous barreloid when tuned to the same preferred direction
The first group analyzed was both spatially and angularly matched with cortex. Analysis of the angular tuning properties of cortical neurons in animal 12 revealed that unit VPM12 was both spatially and angularly matched with the cortical site. As shown in Figure 3, all five cortical neurons in layer VI and V of the D5 barrel column sampled in animal VPM12 preferred upward movements of the D5 whisker, leading to the conclusion that the stimulating electrode was within one sub-barrel domain, or a directional minicolumn (Bruno et al., 2003; Mountcastle, 2003; Andermann and Moore, 2006), that is tuned to upward whisker deflections. Therefore, in this case, the layer VI neurons in the D5 barrel column that we stimulated were tuned to the same direction as unit VPM12 we recorded in barreloid D5. After layer VI was stimulated, unit VPM12 greatly increased its response magnitude to test stimuli applied in an upward direction. Hence, for this VPM neuron that was both spatially and angularly matched with cortex, cortical stimulation elevated the response magnitude to its own preferred direction. The influence of cortical stimulation on VPM units was highly consistent in three VPM units that were recorded in three separate sessions in three different animals classified as spatially and angularly matched with the layer VI units stimulated, and the results were summarized in Figure 5. On average, cortical stimulation increased the response magnitude (un-normalized) of these VPM units to the preferred directions by 30%, from 30 spikes/50 stimuli to 39 spikes/50 stimuli (p < 0.01), but the average responses to three “nonpreferred” directions remained unchanged (p < 0.29) (Fig. 5A). When normalized data were compared, cortical stimulation increased responses of three VPM units to the preferred directions by 22% (100 vs 122; p < 0.0006), but left the responses to all other three nonpreferred directions unchanged (p < 0.21) (Fig. 5B). Thus, VPM units became more tuned to their preferred direction (which was also the direction cortex preferred) after cortical stimulation, which was confirmed by the significant increase in the value of the Tr from 2.07 to 2.75 (p < 0.03) (Fig. 5C). The sharpening effect was clear when the normalized tuning curves from three units were aligned by their preferred directions (Fig. 5D). Thus, stimulating layer VI in the homologous barrel column sharpens the angular tuning curves of VPM units that are angularly matched with cortex. These data indicate that the BFC is capable of modulating the angular tuning preference, and at the same time increase the response magnitude of the same VPM unit selectively for the preferred direction.
Figure 5.

Cortical feedback sharpens the angular tuning curves of VPM neurons that are both spatially and angularly matched with the cortex. A, Comparison of the average response magnitude (un-normalized) of three VPM neurons that are spatially and angularly matched with cortex before and after cortical stimulation. Cortical feedback significantly increases the response magnitude toward the direction that VPM neurons originally prefer (30 vs 39 spikes/50 stimuli; p < 0.01, one-tail t test). However, the average response magnitude (un-normalized) to the three nonpreferred directions remains statistically unchanged (11 vs 8 spikes/50 stimuli; p < 0.29, two-tail t test). B, Comparison of the normalized response magnitude of three VPM neurons that are spatially and angularly matched with cortex before and after cortical stimulation. The data are highly consistent with Figure 5A. Stimulating cortex significantly increases the response magnitude to the direction that VPM neurons originally prefer (100 vs 122; p < 0.0006, one-tail t test). At the same time, the average response magnitude to three nonpreferred directions remains unchanged (38 vs 26; p < 0.21, two-tail t test). C, Tr value of three VPM units that are spatially and angularly matched with cortex increases significantly (from 2.07 to 2.75; p < 0.03, one-tail t test) after cortical stimulation. Thus, the angular tuning specificity of VPM neurons was significantly enhanced by stimulating the layer VI neurons tuned to the same direction. D, Summary plot, showing that cortical feedback sharpens the angular tuning of VPM neurons that are both spatially and angularly matched with cortex. Normalized angular tuning curves of these three VPM neurons are averaged after aligning to the preferred direction and then compared before and after cortical stimulation. Numbers in the vertical axis indicate the relative response level (for details, see Materials and Methods). Note that cortical stimulation enhanced the response to the preferred direction, resulting in a sharpening effect in the tuning curve. *p < 0.05; **p < 0.01. Error bars indicate SEM.
Cortical stimulation broadens angular tuning curves of VPM neurons in homologous barreloids tuned to different directions
In contrast, 15 thalamic neurons that were spatially matched but angularly mismatched with cortex, responded to stimulation of cortical feedback by broadened tuning curves. In these VPM units, responses to their original preferred direction were not affected: response magnitude to the PD decreased from 36 spikes/50 stimuli to 31 spikes/50 stimuli after cortical stimulation. The decrease was not statistically significant (p < 0.06), indicating that these VPM units didn't lose their original directional preference after cortical feedback, but responses to other directions were enhanced. Interestingly, the average response to the other three nonpreferred directions was increased significantly from 21 spikes/50 stimuli to 25 spikes/50 stimuli (p < 0.03) (Fig. 6A). These changes were further confirmed by analysis of normalized data. After data normalization, stimulating layer VI neurons in the homologous barrel column had no significant effect on the responses of VPM units to their original preferred directions (100 vs 96; p < 0.6), which is consistent with the results of un-normalized data. But the average response magnitude to three nonpreferred directions were increased significantly from 59 to 75 (p < 0.001) (Fig. 6B). This increase, as discussed later, was caused in large part by the augmentation of the responses to the direction in which the stimulated layer VI neurons were tuned. These changes together resulted in a significant reduction of the Tr value from 1.62 to 1.23 (p < 0.002) after stimulating the cortex (Fig. 6C), which implies that the tuning specificity was weakened in the VPM neurons after cortical stimulation. These results were confirmed by the broadening effect on the tuning curves of the VPM units after the tuning curves were aligned by their preferred direction. In general, stimulating cortex weakened the tuning specificity of VPM units that were spatially matched but angularly mismatched with cortex (Fig. 6D).
Figure 6.
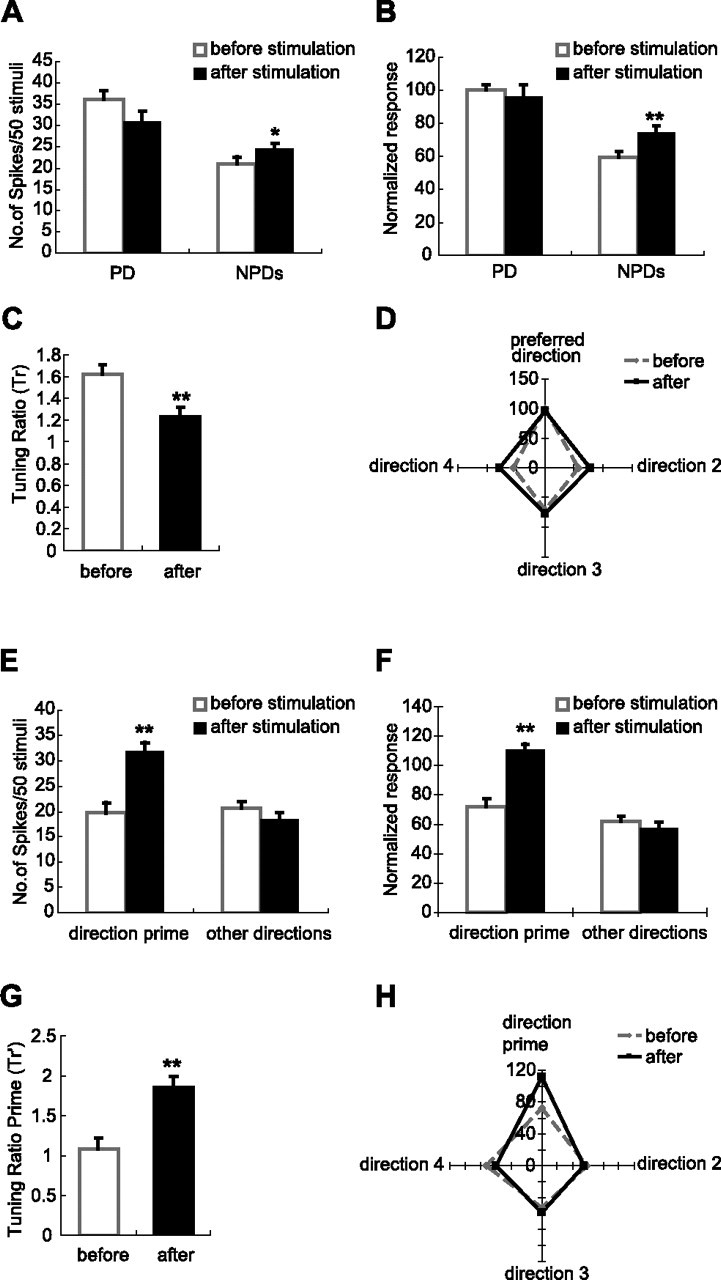
Cortical feedback shifts the tuning preference of VPM neurons toward the direction cortex prefers. A–D, Stimulation of layer VI broadens the angular tuning curves of 15 VPM neurons in homologous barreloids when the thalamic neurons are tuned to different directions from cortex. A, Comparison of the un-normalized responses of 15 VPM neurons that are spatially matched but angularly mismatched with cortex before and after cortical stimulation. Stimulating layer VI of the homologous barrel column decreases the response magnitude slightly but not significantly for the direction that VPM neurons originally prefer, (36 vs 31 spikes/50 stimuli; p < 0.06, one-tail t test). However, the average response to the three nonpreferred directions is significantly increased (21 vs 25 spikes/50 stimuli; p < 0.03, one-tail t test). B, Comparison of normalized response of the same 15 VPM neurons before and after cortical stimulation. The response magnitude toward the direction that VPM neurons originally preferred remains unchanged after cortical stimulation (100 vs 96; p < 0.60, two-tail t test), However, cortical stimulation significantly increases the average response level to the three nonpreferred directions (59 vs 75; p < 0.001, one-tail t test). C, Activation of layer VI feedback neurons in the homologous barrel columns but tuned to different directions significantly decreases the value of Tr in the 15 VPM units (from 1.62 to 1.23; p < 0.002, one-tail t test). Thus, stimulation of the homologous layer VI neurons tuned to different directions significantly weakens the angular specificity of VPM neurons. D, Consistent with results in A–C, aligning normalized tuning curves of 15 spatially but not angularly matched with cortex VPM neurons by the direction that these VPM neurons were originally tuned reveals a broadening effect of cortical stimulation on the angular tuning features of VPM neurons. Numbers along the vertical axis indicate the relative response level. E–H, Consistency of enhancing feedback activity of homologous layer VI neurons is captured by the analysis of Tr′ for all 18 homologous VPM neurons: the consistent role of cortex is to shift the tuning preference of homologous VPM neurons toward the direction cortex prefers. E, Comparison of the un-normalized responses of 18 VPM neurons that are spatially matched with cortex to the direction prime and the three “other” directions before and after cortical stimulation. Here, the direction prime is not the original PD of each VPM neuron, but the direction preferred by the layer VI neurons stimulated. The response to the direction prime is increased significantly (20 vs 32 spikes/50 stimuli; p < 2.3 × 10⁻⁶, one-tail t test), but the influence on the response magnitude to three other directions is not significant (21 vs 19 spikes/50 stimuli; p < 0.21, two-tail t test). F, Comparison of the normalized response of 18 VPM neurons that are spatially matched with cortex to the direction prime and three other directions before and after cortical stimulation. The response to the direction prime is increased significantly (72 vs 111; p < 7.2 × 10⁻⁵, one-tail t test) in 18 homologous VPM neurons, but the influence on the response magnitude to three other directions is insignificant (61 vs 58; p < 0.21, two-tail t test). G, When the data are viewed from the perspective of the preferred angle of cortex, enhancing layer VI feedback in the homologous barrel columns significantly elevates the value of Tr′ in 18 homologous VPM units from 1.09 to 1.85 (p < 0.0001, one-tail t test). Hence, stimulating layer VI neurons would selectively enhance the response of neurons in the homologous barreloid to the preferred direction of the cortex. H, Demonstration of the “redirecting” effect by cortical stimulation in 18 spatially matched VPM neurons after aligning the normalized tuning curves of 18 VPM neurons by the direction prime. Numbers along the ordinate indicate the relative response level. Note the newly developed preferred direction, which is the direction to which the cortical neurons were tuned after cortical stimulation. *p < 0.05; **p < 0.01. Error bars indicate SEM.
Cortical influence on the angular tuning preferences of neurons in homologous barreloids is consistent
The analysis of the tuning ratio demonstrated that the effect of cortical feedback on the angular tuning features of VPM neurons were completely different in angularly matched or mismatched homologous VPM neurons. However, further examination of the data revealed that the role of the cortex actually remained very consistent. That is, cortical activity always enhanced the responses to the direction that the cortex preferred, no matter which direction the VPM neuron originally preferred. The consistency of cortical influence on directional preference of homologous VPM neurons was captured by analysis of the Tr′ (the tuning ratio calculated from the direction which cortex preferred) (for details, see Materials and Methods). The average value of Tr′ was 1.09 for 18 VPM units before stimulating the cortex (Fig. 6G), which means that VPM units didn't show any preference toward the direction to which cortical neurons were tuned (Fig. 6H, black curve). The lack of correspondence also suggests that the pairing of VPM and layer VI neurons was randomly performed within each case and, further, that internal bias was not a big factor in our data pool. We compared the response magnitude (un-normalized) of all 18 spatially matched VPM units to the direction that cortex preferred before and after cortical stimulation. Cortical stimulation significantly increased the response magnitude from 20 spikes/50 stimuli to 32 spikes/50 stimuli (p < 2.3 × 10⁻⁶) to the direction that the cortex preferred (Fig. 6E), but the average response magnitude to the three other directions remained unchanged (21 vs 19 spikes/50 stimuli; p < 0.21). Response augmentation to the direction that the cortex preferred was also found in normalized data (72 vs 111; p < 7.2 × 10⁻⁵) (Fig. 6F). Accordingly, the value of Tr′ almost doubled from 1.09–1.85 (p < 0.0001) after cortical stimulation (Fig. 6G). This point is important because it has been reported that the value of the tuning ratio in normal VPM neurons is ∼2; thus, the increase of Tr′ from 1.09–1.85 indicates that after enhancing cortical feedback, VPM neurons developed a new preferred direction, which is the preferred direction of cortical neurons that were stimulated. The appearance of a new preferred direction is very clear when the normalized tuning curves to the “direction prime” were aligned, which is the direction the cortical neurons preferred. Comparison of tuning curves before and after cortical stimulation is plotted in Figure 6H. These changes further suggest that if the direction preference of VPM neurons was represented with a vector, cortical stimulation would actually redirect the angular preference of VPM neurons toward the direction to which cortical neurons are tuned, no matter which direction the VPM neurons originally preferred. Thus, cortex could actively shift the angular tuning preference of the thalamic relay neurons toward the direction preferred by the cortex.
Stimulation of nonhomologous layer VI suppresses the response of VPM neurons
Evidence is emerging that each barrel column in BFC may have a full set of angular tuning domains (Bruno et al., 2003; Andermann and Moore, 2006), raising the question of how two sub-barrel structures, which are tuned to the same direction of whisker movement but located in different barrel columns, are functionally integrated with each other. We investigated this issue by comparing the angular tuning preference of VPM neurons before and after stimulating layer VI of an immediately adjacent barrel column. Stimulating layer VI in an immediately adjacent barrel column confirmed that the responses of VPM units to deflections of their principal whisker were clearly suppressed. After applying the stimulation procedure, nonhomologous VPM units decreased their responses to the preferred direction significantly from 38 spikes/50 stimuli to 21 spikes/50 stimuli (p < 0.004). The responses to three nonpreferred directions were slightly reduced from 15 spikes/50 stimuli to 12 spikes/50 stimuli, but not significantly (p < 0.19) (Fig. 7B). Thus, stimulating layer VI of a nonhomologous barrel column produced a purely suppressive effect on VPM units, with a significant decrease of the average response to the four directions tested (22 spikes/50 stimuli vs 14 spikes/50 stimuli; p < 0.03) (data not shown). The tuning specificity of VPM units appeared less influenced by nonhomologous compared with homologous cortical inputs. The value of Tr showed some decrease from 1.96–1.62 after stimulation, but didn't reach significance (p < 0.24) (Fig. 7A). The suppressive effect of stimulating the nonhomologous barrel column on VPM units was clear after the tuning curves of six VPM units were aligned by their own preferred directions (Fig. 7C). Although all six units were angularly mismatched with cortex, cortical stimulation didn't shift the angular tuning curves of nonhomologous VPM units. We also calculated the Tr′ for these neurons, Tr′ did increase from 0.83–1.64 after stimulation, but the increase is not significant (p < 0.09) (Fig. 7D). After cortical stimulation, the response of VPM units to the direction that the cortex preferred was influenced only slightly (21 vs 19 spikes/50 stimuli; p < 0.41), whereas the responses to the other three directions were reduced significantly (26 vs 14 spikes/50 stimuli; p < 0.01) (Fig. 7E). However, the cortex appeared unable to redirect the tuning curves of nonhomologous VPM units (Fig. 7F). In general, enhancing feedback from the immediately adjacent barrel columns only produced a pure suppression on VPM neuronal response. No consistent, significant differences could be identified in the response changes of these six nonhomologous cortex/VPM unit pairs.
Figure 7.

Cortical stimulation reduces the responses of spatially mismatched VPM neurons but has no apparent influence on angular tuning. A, Comparison of Tr value of six VPM neurons that are spatially and angularly mismatched with cortex before and after cortical stimulation. Cortical stimulation slightly decreases the Tr value from 1.96 to 1.62, but not significantly (p < 0.12). B, Comparison of the response magnitude of six VPM neurons that are spatially mismatched with cortex before and after cortical stimulation. Stimulating cortex significantly decreases the response magnitude to the direction that VPM neurons originally prefer (38 vs 19 spikes/50 stimuli; p < 0.004). However, average response magnitude to the nonpreferred directions fails to show a significant change (19 vs 14 spikes/50 stimuli; p < 0.12). C, Normalized tuning curves of six spatially mismatched VPM neurons aligned by their preferred directions. Note the suppressing effect on response magnitude. Numbers along the ordinate represent the relative response level. D, Comparison of Tr′ value of six spatially mismatched VPM neurons before and after cortical stimulation. Cortical stimulation increases Tr′ value from 0.83 to 1.63, but not significantly (p < 0.09). E, Comparison of the response magnitude of six VPM neurons before and after cortical stimulation. Stimulating cortex decreases the response magnitude to the direction that cortex prefers slightly (21 vs 19 spikes/50 stimuli; p < 0.41). However, the average response magnitude to the other three directions decreases significantly (26 vs 14 spikes/50 stimuli; p < 0.01). F, Normalized tuning curves of six VPM neurons aligned by the direction prime (the direction cortex preferred). No redirecting effect by cortical stimulation could be detected. *p < 0.05; **p < 0.01. Error bars indicate SEM.
Discussion
The present study describes a novel finding that the cortex may exert a precise and dynamic control over the neural computation of a specific parameter of stimulus features at a single unit level. Focal enhancement of cortical feedback activity in the homologous barrel column significantly and reversibly alters the directional preference of VPM neurons to principal whisker stimulation, whereas similar stimulation of adjacent barrel columns only has inconsistent and insignificant influence on angular tuning. Thus, cortex is capable of coordinating the spatial whisker map and the angular tuning map in the thalamus simultaneously.
Methodological concerns about the cortical stimulation procedure
The electrical stimulus parameters are derived from previous studies (Yan and Suga, 1998; Zhang and Suga, 2000) and modified by our preliminary data: 5 min of stimulation barely altered the responses of the VPM neuron, indicating that a rather prolonged influence is required under anesthesia (Fig. 4B). It is necessary to point out the fact that stimulation excites layer VI neurons doesn't imply that the layer VI neurons around the tip of the stimulating electrode will discharge at the stimulus rate. Our data show that electrical stimulation effectively activates layer VI neurons, but doesn't destroy them (Fig. 3E), hence the stimulation duration is in the proper range. Trains of electrical stimuli in the cortex activate a population of neurons within a certain radius around the tip of the stimulating electrode. Our preliminary data showed that the horizontal spread of activation in layer VIa by electrical stimulation is dependent on the distance from the electrode tip. Under our conditions, many feedback neurons with different angular tuning preferences could be coactivated. The number of angularly tuned neurons activated in layer VI is hard to determine because the actual size and arrangement of these sub-barrel domains, or minicolumns, is still controversial (Bruno et al., 2003; Andermann and Moore, 2006). We speculate that feedback neurons within more than one angular tuning sub-barrel domain were activated, suggesting that effects on VPM neurons could be a mixture of effects from several nearby sub-barrel domains (Fig. 4). However, neurons close to the electrode tip would be expected to be most affected and we interpret proximity of neurons to the electrode as the major variable causing the shifts in the angular tuning curves of VPM neurons. Cortical neurons along the vertical axis (i.e., deeper layer V neurons above and layer VIb neurons below the stimulating site) could also have been activated, but we consider that layer V activation could only be very limited for the following reasons: first, layer V neurons do not project directly to VPM (Deschenes et al., 1998); second, lesioning corticobulbar projections didn't appear to alter the cortical modulation of receptive field properties of VPM neurons, although a relatively larger activating zone occurs after releasing bicuculline at 1500 μm (Temereanca and Simons, 2004). It is also possible that VPM neurons could have been antidromically activated by the electrical stimulation in the cortex, especially when the stimulating electrode was in the homologous barrel columns, although no changes in spontaneous discharge were detected in VPM neurons immediately after the stimulating procedure. In any case, the antidromic activation could not explain the obvious difference in results between spatially and angularly matched group and spatially matched but angularly mismatched group, where VPM neurons would have been equally activated antidromically. Other studies have shown that thalamic neurons are influenced by higher order cortical areas as well as the primary sensory cortex. Unfortunately, the interactions between BFC and other cortical areas, such as SII and MI, still remains to be clarified in regard to their effect on VPM and POm nuclei.
Activation of cortical feedback simultaneously modulates both the spatial and angular tuning maps in thalamus
Data in the present study demonstrate that CT feedback is able to sharpen, broaden, or redirect the angular tuning curves of homologous VPM cells selectively and reversibly, in addition to altering the center/surround contrast of RFs of VPM relay neurons. The results indicate that the cortex modulates both the whisker map and angular tuning map in thalamus simultaneously and coordinates both maps harmoniously. In the cortex/VPM neuron pairs that were both spatially and angularly matched with cortex, the increase of Tr is not strong (p < 0.03) (Fig. 5C). However, the significant changes in response magnitude (Fig. 5A,B) show that focal increases in cortical feedback elevate the response magnitude of homologous VPM neurons that are angularly matched with cortex. Thus, cortical feedback regulates the information transfer of whisker stimuli in the direction which cortex prefers. As we stated previously, the effect we observed is likely a mixed effect; hence, the best way to unveil the role of cortex is to combine the effect in the spatially and angularly matched group with other groups. Indeed, great consistency was found across the 18 spatially matched VPM neurons, as Suga et al. found in the bat's auditory system (for review, see Suga and Ma, 2003; Suga et al., 2003). These results further indicate that the modulation of angular tuning by cortical feedback is actually a “redirecting” effect on the existing directional preference of VPM neurons, which selectively enhances the response magnitude of VPM cells to the preferred direction of cortical neurons. The redirection by the cortex is linked to the period of stimulation, suggesting that in normal behavioral function, the cortex is capable of increasing the number of thalamic relay neurons that respond to specific incoming information. The salience could result in an increase of the processing power for a given feature of whisker engagement. Interestingly, this “reallocation” of directional preference appears to be restricted to homologous VPM neurons, because focally increasing cortical feedback to the adjacent nonhomologous barrel columns has a clearly different (suppressive) influence, and fails to show consistent redirecting of VPM tuning: the corticothalamic correspondence (Tr') increased after the stimulation procedure, but not significantly. We conclude that under urethane anesthesia, angular tuning minicolumns are not closely linked between barrel columns, meaning that the computation of angular whisker movement information may be restricted to the homologous barreloid–barrel circuit. The weak cross talk between angular tuning sub-barrel structures in different barrel columns could be attributable to the limited sample size. However, unlike the highly consistent data from the three both spatially and angularly matched VPM units, examining six spatially and angularly nonmatched units didn't show an interunit consistency. The reason that each barrel column stays whisker-specific to sensory transmission is presently unknown.
Functional role of corticothalamic feedback in information processing in the thalamo-corticothalamic loop
Previous studies reported that topical inactivation of SI altered the response of ipsilateral ventrobasal neurons in anesthetized (Yuan et al., 1985; Diamond et al., 1992b; Krupa et al., 1999) as well as awake preparations (Yuan et al., 1986). The effects can be nonlinear (Ghazanfar et al., 2001) and take multiple forms (Diamond et al., 1992b; Krupa et al., 1999). In lightly sedated animals, CT feedback enhances the spatial tuning of neurons in the homologous barreloid (Temereanca and Simons, 2004). Similar findings, called the “egocentric” effect, have also been reported in the auditory system in awake bats (Yan and Suga, 1996, 1998; Zhang et al., 1997; for review, see Suga and Ma, 2003; Suga et al., 2003). The current study provides new insights by showing that the cortical feedback is accurate enough to adjust the response of single VPM neurons in one specific parameter of sensory coding (direction sensitivity in this case) in a very selective manner, even when many of the processes related to the active information processing are mostly deactivated under anesthesia. The accuracy of CT function as revealed in the anesthetized preparation illustrates a dominant role of the cortex in thalamic information processing. Because the pathways that remain responsive under anesthesia could be part of the main frame mechanisms of neural computation in the fully awake brain, our data suggest that the corticothalamic feedback system may play a more active and important role in the information processing in behaving animals. Together, the available evidence demonstrates that layer VI feedback constitutes an important component in the rat's sensory-motor system, and activation of layer VI feedback under anesthesia causes profound and reversible effects on thalamic relay. These effects are precise under well controlled conditions.
A model for the selective modulation of tuning maps in thalamus by cortex
We propose our model to explain the twofold influence of the cortex on the whisker map and the angular tuning map in the rat's VPM, which emphasizes that the exact influence of BFC on VPM neurons depend mostly on whether the VPM neurons share the same response properties (Fig. 8). The mechanisms for cortical modulation may be different for the whisker map and the angular tuning map. The cortex may achieve a sharpening effect on the RF by enhancing the responses of neurons in the homologous barreloid (Temereanca and Simons, 2004) and suppressing the responses of neurons in adjacent barreloids through enhancing the inhibition of thalamic reticular nuclei (TRNs) (Lee et al., 1994; Desilets-Roy et al., 2002; Varga et al., 2002; Lavallee and Deschenes, 2004). Within the homologous barrel-barreloid, the CT feedback is likely to be orderly, as reported in the visual system (Murphy et al., 1999). Hence, the facilitation from the cortex interacts with the inhibition from TRNs to temporally modify the directional preference of VPM cells. The dual requirement is meant to explain why there is no consistent effect on angular tuning in nonhomologous VPM neurons. Opposite to what we reported previously (Li and Ebner, 2006), here we demonstrated that selectively enhancing cortical feedback could lower the response threshold of VPM neurons. Thus, we speculate that in both cases the cortex regulates the responsiveness of thalamic relay neurons by selectively modulating their firing threshold for specific inputs. In a macro scale, these changes may result in a magnification of the representation area of the direction in the angular tuning map in the thalamus. As shown in Figure 9A, two general channels may exist in the corticothalamic feedback system, and these two channels work seamlessly together in the active brain, which continually reallocates neural resources to the most behaviorally important stimulus features. As the tuning maps in the thalamus are changed by experience, these changes may well be passively reflected, or actively magnified even more in the cortex (Fig. 9B). In our data, the thalamic changes are temporary, but it would be interesting to know whether the cortically induced changes in the thalamus can be consolidated under certain circumstances.
Figure 8.
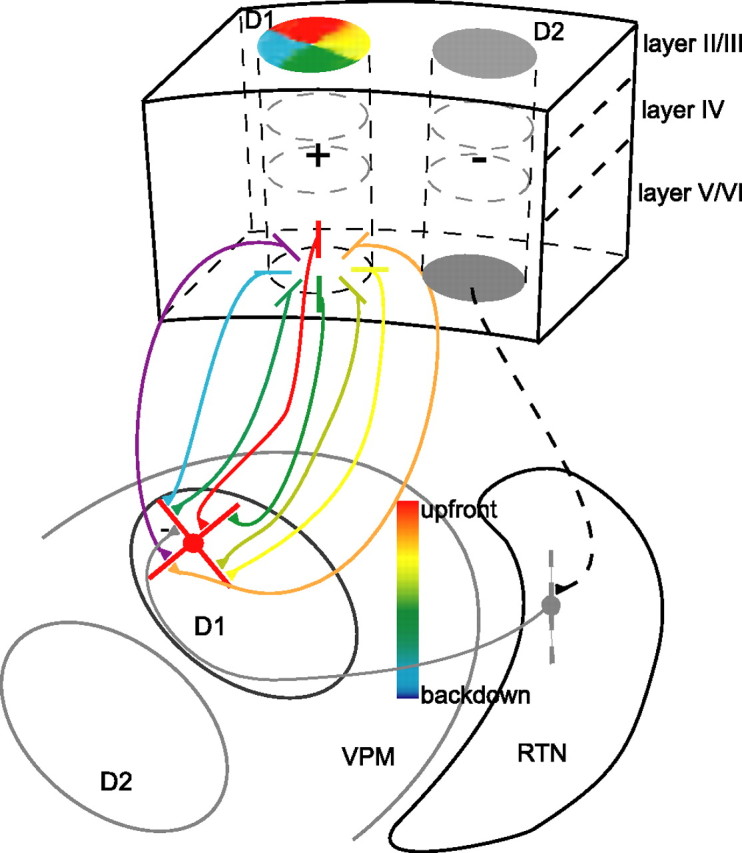
Model of cortical modulation of VPM neuron tuning properties. A model that is consistent with the data on the influence of cortical feedback on the whisker map and angular tuning map in the rat's VPM is shown. The pinwheel-like structure represents the angular minicolumns in BFC (Andermann and Moore, 2006) that converge on neurons in the VPM barreloids. The active minicolumns become the dominant influences on the VPM neuron. The color-gradient bar in VPM shows the axis of the angular tuning map in barreloids (Timofeeva et al., 2003). CT projections that terminate in barreloids also terminate in the TRN. Thus, when cortical feedback from a homologous barrel column (i.e., D1) is enhanced, responses of neurons in D1 barreloid to D1 whisker stimulation are facilitated. At the same time, TRN neurons are activated and responses of D1 barreloid neurons to the D2 whisker (the surround whisker) are suppressed, resulting in a sharpening effect on the RF. CT projections from each minicolumn in D1 barrel column may have a fine grained topography in D1 barreloid. Hence, the facilitation from CT feedback would interact with the inhibition from TRNs in a systematic manner so that the directional preference of D1 barreloid cells would be modulated depending on the whiskers stimulated. Details of the modulation (see text) would depend on the correspondence of the angular tuning properties between D1 barreloid neurons and the total feedback from layer VI cells in the D1 barrel column.
Figure 9.

Illustration of the functional implications of cortical modulation of VPM neurons. A, The BFC projects extensively back to VPM in the normal adult rat brain. Yet for neurons in one barreloid, for example the D2 barreloid, feedback from the homologous barrel column (D2) is functionally distinct from that of the nonhomologous adjacent barrel columns (C2/D3/E2/D1). Feedback from the adjacent barrel columns produces a predominantly suppressive influence (gray barrel columns and arrow), whereas the D2 barrel column generally facilitates the response of D2 barreloid cells to D2 whisker stimulations (multicolored arrow). The data demonstrate that even the feedback from the homologous barrel columns is not functionally homogeneous. Hence, two general channels appear to exist in the corticothalamic feedback system. One channel, the specific channel, arises from the homologous barrel column and is able to facilitate the response to the D2 whisker and regulate the direction preference of D2 barreloid cells. The other channel, the nonspecific channel, consists of the feedback outside the homologous barrel column, probably mainly from the immediately adjacent barrel columns. The nonspecific channel doesn't have a consistent influence on angular tuning, only a suppressive effect. The two channels work seamlessly together in the active brain, which constantly reallocates neural resources to the most behaviorally repetitious stimulus features. B, When the cortical feedback for a certain stimulus is augmented, for example, when the feedback to whisker movements in upward direction is increased (expanded red sector in the D2 barrel), the angular tuning map in the corresponding (D2) barreloid is shifted by the specific channel in a way that expands the area representing the upward stimulus (expanded red zone in the D2 barreloid). In this way, more neural resources would be allocated to processing information about upward whisker movement. At the same time, feedback from the D2 barrel would also cause a suppressive effect on the surround barreloids through the nonspecific channel so the response contrast would be increased in the D2 channel to D2 whisker movements. This mechanism could optimize the detection of novel stimulus features.
Footnotes
This work was supported by National Institutes of Health Grant NS25907. We are grateful to Prof. Michael Armstrong-James and Prof. Anna Roe for their comments on a previous version of this manuscript. We also thank Mark Maguire for histological and general assistance and help with these studies.
References
- Ahissar E, Kleinfeld D. Closed-loop neuronal computations: focus on vibrissa somatosensation in rat. Cereb Cortex. 2003;13:53–62. doi: 10.1093/cercor/13.1.53. [DOI] [PubMed] [Google Scholar]
- Alitto HJ, Usrey WM. Corticothalamic feedback and sensory processing. Curr Opin Neurobiol. 2003;13:440–445. doi: 10.1016/s0959-4388(03)00096-5. [DOI] [PubMed] [Google Scholar]
- Andermann ML, Moore CI. A somatotopic map of vibrissa motion direction within a barrel column. Nat Neurosci. 2006;9:543–551. doi: 10.1038/nn1671. [DOI] [PubMed] [Google Scholar]
- Armstrong-James M, Callahan CA. Thalamo-cortical processing of vibrissal information in the rat. II. Spatiotemporal convergence in the thalamic ventroposterior medial nucleus (VPm) and its relevance to generation of receptive fields of S1 cortical “barrel” neurones. J Comp Neurol. 1991;303:211–224. doi: 10.1002/cne.903030204. [DOI] [PubMed] [Google Scholar]
- Armstrong-James M, Fox K. Spatiotemporal convergence and divergence in the rat S1 “barrel” cortex. J Comp Neurol. 1987;263:265–281. doi: 10.1002/cne.902630209. [DOI] [PubMed] [Google Scholar]
- Armstrong-James M, Millar J. Carbon fibre microelectrodes. J Neurosci Methods. 1979;1:279–287. doi: 10.1016/0165-0270(79)90039-6. [DOI] [PubMed] [Google Scholar]
- Armstrong-James M, Fox K, Millar J. A method for etching the tips of carbon fibre microelectrodes. J Neurosci Methods. 1980;2:431–432. doi: 10.1016/0165-0270(80)90009-6. [DOI] [PubMed] [Google Scholar]
- Bruno RM, Khatri V, Land PW, Simons DJ. Thalamocortical angular tuning domains within individual barrels of rat somatosensory cortex. J Neurosci. 2003;23:9565–9574. doi: 10.1523/JNEUROSCI.23-29-09565.2003. [DOI] [PMC free article] [PubMed] [Google Scholar]
- Buonomano DV, Merzenich MM. Cortical plasticity: from synapses to maps. Annu Rev Neurosci. 1998;21:149–186. doi: 10.1146/annurev.neuro.21.1.149. [DOI] [PubMed] [Google Scholar]
- Calford MB. Dynamic representational plasticity in sensory cortex. Neuroscience. 2002;111:709–738. doi: 10.1016/s0306-4522(02)00022-2. [DOI] [PubMed] [Google Scholar]
- Deschenes M, Veinante P, Zhang ZW. The organization of corticothalamic projections: reciprocity versus parity. Brain Res Rev. 1998;28:286–308. doi: 10.1016/s0165-0173(98)00017-4. [DOI] [PubMed] [Google Scholar]
- Desilets-Roy B, Varga C, Lavallee P, Deschenes M. Substrate for cross-talk inhibition between thalamic barreloids. J Neurosci. 2002;22:218RC. doi: 10.1523/JNEUROSCI.22-09-j0002.2002. [DOI] [PMC free article] [PubMed] [Google Scholar]
- Diamond ME, Armstrong-James M, Ebner FF. Somatic sensory responses in the rostral sector of the posterior group (POm) and in the ventral posterior medial nucleus (VPM) of the rat thalamus. J Comp Neurol. 1992a;318:462–476. doi: 10.1002/cne.903180410. [DOI] [PubMed] [Google Scholar]
- Diamond ME, Armstrong-James M, Budway MJ, Ebner FF. Somatic sensory responses in the rostral sector of the posterior group (POm) and in the ventral posterior medial nucleus (VPM) of the rat thalamus: dependence on the barrel field cortex. J Comp Neurol. 1992b;319:66–84. doi: 10.1002/cne.903190108. [DOI] [PubMed] [Google Scholar]
- Friedberg MH, Lee SM, Ebner FF. Modulation of receptive field properties of thalamic somatosensory neurons by the depth of anesthesia. J Neurophysiol. 1999;81:2243–2252. doi: 10.1152/jn.1999.81.5.2243. [DOI] [PubMed] [Google Scholar]
- Ghazanfar AA, Krupa DJ, Nicolelis MAL. Role of cortical feedback in the receptive field structure and nonlinear response properties of somatosensory thalamic neurons. Exp Brain Res. 2001;141:88–100. doi: 10.1007/s002210100849. [DOI] [PubMed] [Google Scholar]
- Guillery RW. A quantitative study of synaptic interconnections in the dorsal lateral geniculate nucleus of the cat. Z Zellforsh Mikrosk Anat. 1969;96:39–48. doi: 10.1007/BF00321474. [DOI] [PubMed] [Google Scholar]
- Guillery RW, Sherman SM. Thalamic relay functions and their role in corticocortical communication: generalizations from the visual system. Neuron. 2002;33:163–175. doi: 10.1016/s0896-6273(01)00582-7. [DOI] [PubMed] [Google Scholar]
- Haidarliu S, Ahissar E. Size gradients of barreloids in the rat thalamus. J Comp Neurol. 2001;429:372–387. doi: 10.1002/1096-9861(20010115)429:3<372::aid-cne2>3.0.co;2-3. [DOI] [PubMed] [Google Scholar]
- Hillenbrand U, van Hemmen JL. Adaptation in the corticothalamic loop: computational prospects of tuning the senses. Philos Trans R Soc Lond B Biol Sci. 2002;357:1859–1867. doi: 10.1098/rstb.2002.1174. [DOI] [PMC free article] [PubMed] [Google Scholar]
- Kaas JH. Plasticity of sensory and motor maps in adult mammals. Annu Rev Neurosci. 1991;14:137–167. doi: 10.1146/annurev.ne.14.030191.001033. [DOI] [PubMed] [Google Scholar]
- Kleinfeld D, Berg RW, O'Connor SM. Anatomical loops and their electrical dynamics in relation to whisking by rat. Somatosens Mot Res. 1999;16:69–88. doi: 10.1080/08990229970528. [DOI] [PubMed] [Google Scholar]
- Knudsen EI, Lac S, Esterly SD. Computational maps in the brain. Annu Rev Neurosci. 1987;10:41–65. doi: 10.1146/annurev.ne.10.030187.000353. [DOI] [PubMed] [Google Scholar]
- Krupa DJ, Ghazanfar AA, Nicolelis MA. Immediate thalamic sensory plasticity depends on corticothalamic feedback. Proc Natl Acad Sci USA. 1999;96:8200–8205. doi: 10.1073/pnas.96.14.8200. [DOI] [PMC free article] [PubMed] [Google Scholar]
- Land PW, Buffer SA, Jr, Yaskosky JD. Barreloids in adult rat thalamus: three-dimensional architecture and relationship to somatosensory cortical barrels. J Comp Neurol. 1995;355:573–588. doi: 10.1002/cne.903550407. [DOI] [PubMed] [Google Scholar]
- Lavallee P, Deschenes M. Dendroarchitecture and lateral inhibition in thalamic barreloids. J Neurosci. 2004;24:6098–6105. doi: 10.1523/JNEUROSCI.0973-04.2004. [DOI] [PMC free article] [PubMed] [Google Scholar]
- Lee SH, Simons DJ. Angular tuning and velocity sensitivity in different neuron classes within layer 4 of rat barrel cortex. J Neurophysiol. 2004;91:223–229. doi: 10.1152/jn.00541.2003. [DOI] [PubMed] [Google Scholar]
- Lee SM, Friedberg MH, Ebner FF. The role of GABA-mediated inhibition in the rat ventral posterior medial thalamus. I. Assessment of receptive field changes following thalamic reticular nucleus lesions. J Neurophysiol. 1994;71:1702–1715. doi: 10.1152/jn.1994.71.5.1702. [DOI] [PubMed] [Google Scholar]
- Li L, Ebner FF. Balancing bilateral sensory activity: callosal processing modulates sensory transmission through the contralateral thalamus by altering the response threshold. Exp Brain Res. 2006:1–19. doi: 10.1007/s00221-005-0337-y. [DOI] [PubMed] [Google Scholar]
- Lichtenstein SH, Carvell GE, Simons DJ. Responses of rat trigeminal ganglion neurons to movements of vibrissae in different directions. Somatosens Mot Res. 1990;7:47–65. doi: 10.3109/08990229009144697. [DOI] [PubMed] [Google Scholar]
- Liu X, Honda C, Jones E. Distribution of four types of synapse on physiologically identified relay neurons in the ventral posterior thalamic nucleus of the cat. J Comp Neurol. 1995;352:69–91. doi: 10.1002/cne.903520106. [DOI] [PubMed] [Google Scholar]
- Ma PM. The barrelettes-architectonic vibrissal representations in the brainstem trigeminal complex of the mouse. I. Normal structural organization. J Comp Neurol. 1991;309:161–199. doi: 10.1002/cne.903090202. [DOI] [PubMed] [Google Scholar]
- Minnery BS, Simons DJ. Response properties of whisker-associated trigeminothalamic neurons in rat nucleus principalis. J Neurophysiol. 2003;89:40–56. doi: 10.1152/jn.00272.2002. [DOI] [PubMed] [Google Scholar]
- Minnery BS, Bruno RM, Simons DJ. Response transformation and receptive-field synthesis in the lemniscal trigeminothalamic circuit. J Neurophysiol. 2003;90:1556–1570. doi: 10.1152/jn.00111.2003. [DOI] [PubMed] [Google Scholar]
- Mountcastle VB. Introduction. Computation in cortical columns. Cereb Cortex. 2003;13:2–4. doi: 10.1093/cercor/13.1.2. [DOI] [PubMed] [Google Scholar]
- Murphy PC, Duckett SG, Sillito AM. Feedback connections to the lateral geniculate nucleus and cortical response properties. Science. 1999;286:1552–1554. doi: 10.1126/science.286.5444.1552. [DOI] [PubMed] [Google Scholar]
- Nicolelis MA, Fanselow EE. Thalamocortical optimization of tactile processing according to behavioral state. Nat Neurosci. 2002a;5:517–523. doi: 10.1038/nn0602-517. [DOI] [PubMed] [Google Scholar]
- Nicolelis MA, Fanselow EE. Dynamic shifting in thalamocortical processing during different behavioural states. Philos Trans R Soc Lond B Biol Sci. 2002b;357:1753–1758. doi: 10.1098/rstb.2002.1175. [DOI] [PMC free article] [PubMed] [Google Scholar]
- Rhoades RW, Belford GR, Killackey HP. Receptive-field properties of rat ventral posterior medial neurons before and after selective kainic acid lesions of the trigeminal brain stem complex. J Neurophysiol. 1987;57:1577–1600. doi: 10.1152/jn.1987.57.5.1577. [DOI] [PubMed] [Google Scholar]
- Rumelhart D, McClelland JL. Parallel distributed processing. Cambridge, MA: MIT; 1986. [Google Scholar]
- Sherman SM, Guillery RW. Functional organization of thalamocortical relays. J Neurophysiol. 1996;76:1367–1395. doi: 10.1152/jn.1996.76.3.1367. [DOI] [PubMed] [Google Scholar]
- Sherman SM, Guillery RW. The role of the thalamus in the flow of information to the cortex. Philos Trans R Soc Lond B Biol Sci. 2002;357:1695–1708. doi: 10.1098/rstb.2002.1161. [DOI] [PMC free article] [PubMed] [Google Scholar]
- Sillito AM, Jones HE. Corticothalamic interactions in the transfer of visual information. Philos Trans R Soc Lond B Biol Sci. 2002;357:1739–1752. doi: 10.1098/rstb.2002.1170. [DOI] [PMC free article] [PubMed] [Google Scholar]
- Simons DJ, Carvell GE. Thalamocortical response transformation in the rat vibrissa/barrel system. J Neurophysiol. 1989;61:311–330. doi: 10.1152/jn.1989.61.2.311. [DOI] [PubMed] [Google Scholar]
- Steriade M, Timofeev I. Neuronal plasticity in thalamocortical networks during sleep and waking oscillations. Neuron. 2003;37:563–576. doi: 10.1016/s0896-6273(03)00065-5. [DOI] [PubMed] [Google Scholar]
- Suga N, Ma X. Multiparametric corticofugal modulation and plasticity in the auditory system. Nat Rev Neurosci. 2003;4:783–794. doi: 10.1038/nrn1222. [DOI] [PubMed] [Google Scholar]
- Suga N, Xiao Z, Ma X, Ji W. Plasticity and corticofugal modulation for hearing in adult animals. Neuron. 2003;36:9–18. doi: 10.1016/s0896-6273(02)00933-9. [DOI] [PubMed] [Google Scholar]
- Sugitani M, Yano J, Sugai T, Ooyama H. Somatotopic organization and columnar structure of vibrissae representation in the rat ventrobasal complex. Exp Brain Res. 1990;81:346–352. doi: 10.1007/BF00228125. [DOI] [PubMed] [Google Scholar]
- Temereanca S, Simons DJ. Functional topography of corticothalamic feedback enhances thalamic spatial response tuning in the somatosensory whisker/barrel system. Neuron. 2004;41:639–651. doi: 10.1016/s0896-6273(04)00046-7. [DOI] [PubMed] [Google Scholar]
- Timofeeva E, Merette C, Emond C, Lavallee P, Deschenes M. A map of angular tuning preference in thalamic barreloids. J Neurosci. 2003;23:10717–10723. doi: 10.1523/JNEUROSCI.23-33-10717.2003. [DOI] [PMC free article] [PubMed] [Google Scholar]
- Tsumoto T, Creutzfeldt OD, Legendy CR. Functional organization of the corticofugal system from visual cortex to lateral geniculate nucleus in the cat (with an appendix on geniculo-cortical mono-synaptic connections) Exp Brain Res. 1978;32:345–364. doi: 10.1007/BF00238707. [DOI] [PubMed] [Google Scholar]
- Van der Loos H. Barreloids in the mouse somatosensory thalamus. Neurosci Lett. 1976;7:23–30. doi: 10.1016/0304-3940(76)90036-7. [DOI] [PubMed] [Google Scholar]
- Varga C, Sik A, Lavallee P, Deschenes M. Dendroarchitecture of relay cells in thalamic barreloids: a substrate for cross-whisker modulation. J Neurosci. 2002;22:6186–6194. doi: 10.1523/JNEUROSCI.22-14-06186.2002. [DOI] [PMC free article] [PubMed] [Google Scholar]
- Waite PM. The responses of cells in the rat thalamus to mechanical movements of the whiskers. J Physiol (Lond) 1973;228:541–561. doi: 10.1113/jphysiol.1973.sp010099. [DOI] [PMC free article] [PubMed] [Google Scholar]
- Wong-Riley MT, Welt C. Histochemical changes in cytochrome oxidase of cortical barrels after vibrissal removal in neonatal and adult mice. Proc Natl Acad Sci USA. 1980;77:2333–2337. doi: 10.1073/pnas.77.4.2333. [DOI] [PMC free article] [PubMed] [Google Scholar]
- Woolsey TA, Van der Loos H. The structural organization of layer IV in the somatosensory region (SI) of mouse cerebral cortex: the description of a cortical field composed of discrete cytoarchitectonic units. Brain Res. 1970;17:205–242. doi: 10.1016/0006-8993(70)90079-x. [DOI] [PubMed] [Google Scholar]
- Worgotter F, Eyding D, Macklis JD, Funke K. The influence of the corticothalamic projection on responses in thalamus and cortex. Philos Trans R Soc Lond B Biol Sci. 2002;357:1823–1834. doi: 10.1098/rstb.2002.1159. [DOI] [PMC free article] [PubMed] [Google Scholar]
- Yan J, Suga N. Corticofugal modulation of time-domain processing of biosonar information in bats. Science. 1996;273:1100–1103. doi: 10.1126/science.273.5278.1100. [DOI] [PubMed] [Google Scholar]
- Yan W, Suga N. Corticofugal modulation of the midbrain frequency map in the bat auditory system. Nat Neruosci. 1998;1:54–58. doi: 10.1038/255. [DOI] [PubMed] [Google Scholar]
- Yuan B, Morrow TJ, Casey KL. Responsiveness of ventrobasal thalamic neurons after suppression of S1 cortex in the anesthetized rat. J Neurosci. 1985;5:2971–2978. doi: 10.1523/JNEUROSCI.05-11-02971.1985. [DOI] [PMC free article] [PubMed] [Google Scholar]
- Yuan B, Morrow TJ, Casey KL. Corticofugal influences of S1 cortex on ventrobasal thalamic neurons in the awake rat. J Neurosci. 1986;6:3611–3617. doi: 10.1523/JNEUROSCI.06-12-03611.1986. [DOI] [PMC free article] [PubMed] [Google Scholar]
- Zhang Y, Suga N. Modulation of responses and frequency tuning of thalamic and collicular neurons by cortical activation in mustached bats. J Neurophysiol. 2000;84:325–333. doi: 10.1152/jn.2000.84.1.325. [DOI] [PubMed] [Google Scholar]
- Zhang Y, Suga N, Yan J. Corticofugal modulation of frequency processing in bat auditory system. Nature. 1997;387:900–903. doi: 10.1038/43180. [DOI] [PubMed] [Google Scholar]