

Abstract
Neurons of the intralaminar thalamus, including central lateral (CL) and parafascicular (Pf) nuclei, innervate the cortex and striatum and are important for cognitive, sensory, and motor processes. We tested the hypothesis that CL and Pf neurons provide functionally distinct inputs to the striatum. We performed recordings of single CL and Pf neurons in anesthetized rats and, after juxtacellularly labeling the neurons, their somatodendritic features and synaptic connections were characterized.
All CL neurons (n = 31) discharged classic low-threshold Ca2+ spike bursts during cortical slow-wave activity in vivo. In contrast, Pf neurons (n = 52) rarely fired such bursts, but instead discharged groups of spikes at relatively low frequencies. The activity of CL and Pf neurons was often temporally coupled to cortical slow oscillations. Identified CL neurons possessed archetypal “bushy” dendrites and preferentially established synapses with dendritic spines (91% of synapses) of striatal projection neurons. Pf neurons possessed “reticular-like” dendrites, and, on average, preferentially established synapses with dendritic shafts (63%) in striatum, although connectivity was markedly heterogeneous across neurons. Two of the six Pf neurons studied exclusively targeted dendritic shafts, whereas another neuron almost exclusively (97%) targeted spines. The remaining three neurons preferentially targeted dendritic shafts (53–70%).
Thus, the fundamental properties of CL and Pf neurons differ (the latter do not express the typical operational principles of thalamic relay neurons), and they provide different temporally patterned inputs to distinct striatal targets. This mechanistic diversity likely underpins the transmission of specific and discrete information from intralaminar thalamic nuclei to striatal and cortical targets.
Keywords: basal ganglia, intralaminar thalamus, striatum, thalamostriatal, parafascicular, central lateral
Introduction
The central lateral (CL) and parafascicular (Pf) nuclei are major components of the rostral and caudal intralaminar thalamic nuclei (ITN), respectively, and their glutamatergic neurons exert influences on widespread cortical and subcortical targets. Although historically viewed as part of a “nonspecific” thalamocortical system and thus, a critical component of the ascending reticular activating system that underlies arousal and sensory awareness (Jones, 1985, 2003), the ITN are now known to be involved in separate and specific brain functions, including cognitive, sensory, and motor processes (Van der Werf et al., 2002). The functions of neurons in the ITN and other thalamic relay nuclei are assumed to be mediated by two distinct activity modes, “tonic” or “bursting,” according to the requirements of ongoing information processing (Sherman, 2001; Llinás and Steriade, 2006).
As well as providing widespread inputs to the cortex, CL and Pf neurons send projections to the basal ganglia (BG), most notably the striatum (Groenewegen and Berendse, 1994; Smith et al., 2004). Striatal targets of thalamic afferents include spiny projection neurons and aspiny interneurons. Thus, not only are ITN neurons key mediators of ascending subcortical influences on the BG, they are also ideally placed to directly update the striatum on information exchanged between the thalamus and cortex. Thalamostriatal inputs provide information on sensory events of behavioral significance and are likely to be important for arousal, attention, orienting, and action selection (Kimura et al., 2004; McHaffie et al., 2005). The rostral and caudal ITN are often grouped together in schemes of the functional organization of (thalamo)cortical and BG circuits (Llinás et al., 1998; Smith et al., 1998). Several lines of evidence suggest, however, that CL and Pf neurons have dissimilar intrinsic properties and/or synaptic connections, raising the possibility that these nuclei might play distinct roles in modulating striatal and cortical activity. First, the dendritic architectures of CL and Pf neurons differ, implying divergent integrative properties (Deschênes et al., 1996a,b). Second, tract-tracing studies have shown that, in striatum, axons emanating from in and around CL preferentially synapse with dendritic spines, whereas axons from Pf neurons tend to synapse with dendritic shafts (Smith et al., 2004).
A wealth of data supports the idea that the thalamostriatal system is important for behavior, yet it is difficult to reconcile with current models of BG function (DeLong, 1990; Smith et al., 1998). To define the roles played by CL and Pf neurons, it is critical to understand their physiological modes of operation in vivo, with due consideration of intrinsic physiological and morphological properties, as well as the synaptic connections they establish in striatum. We tested the hypothesis that CL and Pf neurons provide functionally distinct inputs to the striatum. We performed recordings of single CL and Pf neurons in anesthetized rats and, after physiological characterization, we juxtacellularly labeled the neurons. The somatodendritic features and synaptic connections of the identified neurons were then characterized.
Materials and Methods
Experimental procedures were performed on adult male Sprague Dawley rats (Charles River, Margate, UK) and were conducted in accordance with the Animals (Scientific Procedures) Act of 1986 (United Kingdom) and with Society for Neuroscience policies on the Use of Animals in Neuroscience Research.
Electrophysiological recordings.
Recordings were made from 26 rats (250–390 g). Anesthesia was induced with 4% v/v isoflurane (Isoflo; Schering-Plough, Welwyn Garden City, UK) in O2 and maintained with urethane (1.3 gkg−1, i.p.; ethyl carbamate; Sigma, Poole, UK), and supplemental doses of ketamine (30 mgkg−1, i.p.; Ketaset; Willows Francis, Crawley, UK) and xylazine (3 mgkg−1, i.p.; Rompun; Bayer, Leverkusen, Germany), as described previously (Magill et al., 2000). All wound margins were infiltrated with the local anesthetic, bupivacaine (0.5% w/v; Astra, Kings Langley, UK), and corneal dehydration was prevented with application of Hypromellose eye drops (Norton Pharmaceuticals, Harlow, UK). Animals were then placed in a stereotaxic frame (Kopf, Tujunga, CA). The body temperature was maintained at 37 ± 0.5°C with the use of a homeothermic heating device (Harvard Apparatus, Edenbridge, UK). Anesthesia levels were assessed by examination of the electrocorticogram (ECoG; see below) and by testing reflexes to a cutaneous pinch or gentle corneal stimulation. Supplemental doses of the ketamine/xylazine mixture were given when necessary (typically every 60–90 min). An electrocardiogram (ECG) and respiration rate were also monitored constantly to ensure the animals' well being.
The ECoG was recorded via a 1-mm-diameter steel screw juxtaposed to the dura mater above the frontal (somatosensory motor) cortex ipsilateral to thalamic recording sites (2.7 mm anterior and 2.0 mm lateral to bregma) (Paxinos and Watson, 1986) and was referenced against an electrode placed subcutaneously in the neck. Raw ECoG was bandpass filtered (0.1–100 Hz; −3 dB limits) and amplified (2000×; NL104 preamplifier; Digitimer, Welwyn Garden City, UK) before acquisition. The ECG was differentially recorded via two silver wires inserted subcutaneously in the ipsilateral forelimb and hindlimb. The raw ECG was bandpass filtered (5–500 Hz) and amplified (5000×; NL104 preamplifier; Digitimer) before acquisition.
A discrete craniotomy (3–4 mm2) was performed above the right and/or left thalamus, and the dura mater removed for insertion of recording electrodes. Mineral oil and saline solution (0.9% w/v NaCl) were applied to all areas of exposed cortex to prevent dehydration. Extracellular recordings of action potentials of thalamic neurons were made using 15–25 MΩ glass electrodes (tip diameter, ∼1.5 μm), which contained saline solution (0.5 m NaCl) and Neurobiotin (1.5% w/v; Vector Laboratories, Peterborough, UK). Electrode signals were amplified (10×) through the active bridge circuitry of an Axoprobe-1A amplifier (Molecular Devices, Sunnyvale, CA), AC-coupled and amplified a further 100× (NL-106 AC-DC Amp; Digitimer), before being filtered between 0.3 and 5 kHz (NL125; Digitimer). Spikes were often several millivolts in amplitude and always exhibited an initial positive deflection.
Neuronal activity was recorded during slow-wave activity (SWA), which accompanies deep anesthesia and is similar to activity observed during natural sleep (for review, see Steriade, 2000, 2006).
Electrophysiological data analysis.
All biopotentials were digitized on-line using a Power1401 Analog-Digital converter (Cambridge Electronic Design, Cambridge, UK) and a PC running Spike2 acquisition and analysis software (version 4; Cambridge Electronic Design). Unit activity and the ECoG were sampled at 12 and 5 kHz, respectively. Data from the recording session were inspected visually and epochs of robust cortical SWA were identified (Magill et al., 2000). A portion of the coincident spike train composed of 150 spikes was then isolated and used for statistical analyses. A modified version of the oscillation and burst detection algorithm of Kaneoke and Vitek (1996) was used to objectively and quantitatively determine the potential periodicity and firing pattern in these spike trains. The Lomb algorithm was used to determine the statistical significance and frequency of any periodic discharge features (within the 0.5–50 Hz range) present in the spike train (Kaneoke and Vitek, 1996). Frequency spectra of spiking are displayed as “Lomb periodograms.” The relative power of a peak in the periodogram is indicated by the clearance of the peak from a significance level of p = 0.05 (represented by dashed lines in Fig. 1A,C). We used the burst detection method of Kaneoke and Vitek (1996) as a useful first indicator of firing pattern, and more specifically, to address directly the issue of whether CL and Pf neurons fired bursts of spikes. This burst detection method does not require an absolute threshold interspike interval (ISI) to define either the beginning or end of a burst, and thus, is not biased toward bursts of a certain frequency. A burst is simply defined as an epoch of firing in which there are a significantly higher number of spikes compared with other intervals in the spike train. The discharge density histogram of the spike train was statistically compared (by χ2 test) to a Poisson distribution (i.e., a random or irregular distribution). When the discharge density histogram of the neuron was significantly positively skewed and different from the Poisson distribution, the spike train was assumed to contain bursts. Significance levels for the skewness and χ2 test were set at 0.05. The sensitivity of this burst detection method is a function of the mean of the Poisson distribution. In short, increasing the Poisson mean increases the likelihood of detecting significant bursts. The burst index (BI) is the reciprocal of the Poisson mean at which bursts are detected. Because a low Poisson mean makes it more difficult to detect bursts in a spike train, it follows that higher BIs are reserved for neurons that are particularly “bursty” (Kaneoke and Vitek, 1996). By increasing the BI in steps, a straightforward appreciation for exactly how bursty each neuron is can be gained. A neuron was defined as significantly bursting when one or more bursts were detected in the spike train after setting the Poisson mean at 2.0 (BI was thus ≥0.5), with a burst defined as a period that contained three or more spikes. We varied the BI from 0.5 to 1.0 and then to 2.0 for each neuron, and the highest applicable BI from this range was assigned to each neuron. The coefficient of variation of the ISIs, a value used widely as an indicator of regularity in point processes (Johnson, 1996), was also calculated. Mean firing frequency was calculated from the reciprocal of the mean ISI.
Figure 1.
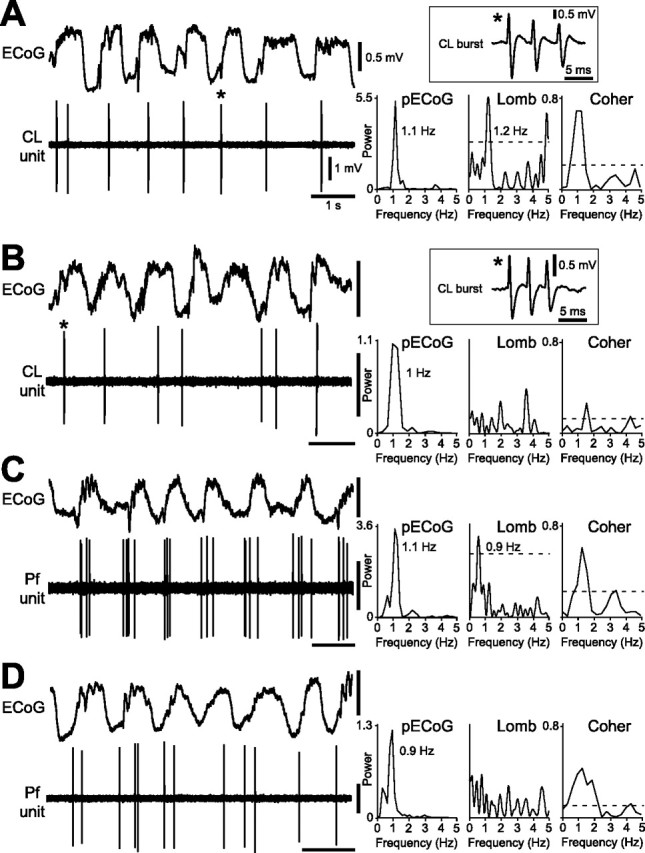
Spike-firing patterns of identified CL and Pf thalamic neurons during cortical SWA. A, Most CL neurons fired bursts of spikes in time with the cortical slow oscillation (∼1 Hz), as shown in the ECoG. Bursts were fired on most oscillatory cycles and were characterized by two to five spikes fired in rapid succession, with progressive attenuation of spike amplitude (a typical burst is denoted by an asterisk and shown in the boxed inset). Comparison of the power spectrum of the ECoG (pECoG) with the Lomb periodogram (Lomb) shows a similar frequency of rhythmic activity in the cortex and the CL neuron spike train. Units of ECoG power are mV2 × 10−2 in all spectra. The dashed line in this and subsequent Lomb periodograms denotes a significance level of p = 0.05. A plot of the coherence between the ECoG and the CL neuron spike train (Coher) showed that these two signals were significantly coherent at ∼1 Hz. The dashed line in the coherence spectrum denotes a significance level of p = 0.05. B, The burst firing of a minority of CL neurons was not rhythmic (peaks in Lomb periodogram did not reach significance level). C, D, Spike-firing patterns of Pf neurons were also heterogeneous during the cortical slow oscillation, with neurons exhibiting either a significant oscillation in firing in time with cortical activity (C) or a nonoscillatory, irregular firing pattern (D). Note that Pf neurons did not usually exhibit the burst firing typical of CL neurons. Calibration in A also applies to B–D.
To quantify the temporal coupling between cortical activity (ECoGs) and thalamic activity (spike trains) during SWA, we performed an analysis of coherence between the two signals. Coherence is a measure of the linear association (correlation) between two signals across frequencies (Halliday et al., 1995). It is a bounded measure taking values from zero to one, where zero indicates that there is no linear association (i.e., that one process is of no use in linearly predicting another process), and one indicates a perfect linear association. The ECoGs were assumed to be realizations of stationary, zero-mean time series. Spike trains were assumed to be realizations of stationary, stochastic point processes. The sampling rates of spike trains and ECoGs were matched for coherence analysis by down-sampling spike trains to 5 kHz using Spike2 analysis software. The principal statistical tool used for coherence analyses was the discrete Fourier transform and parameters derived from it, all of which were estimated by dividing the data records into a number of disjointed sections of equal duration (3.3 s). Frequency resolution was 0.3 Hz. Data were windowed with a Hanning filter to control “spectral leakage.” The coherence |Rab(λ)|2 was calculated according to standard methods (Halliday et al., 1995) by using the following formula: |Rab(λ)|2 = |fab(λ)|2 /faa(λ) fbb(λ). In this equation, f characterizes the spectral estimate of two signals, a and b, for a given frequency (λ). The numerator includes the cross-spectrum for a and b (fab), whereas the denominator includes the autospectra for a (faa) and b (fbb). Coherence analyses were implemented with custom-written scripts for use with Spike2 (scripts kindly provided by Prof. Peter Brown, Institute of Neurology, London, UK). Significance levels were estimated for coherence spectra according to standard methods, as described in detail previously (Halliday et al., 1995). The coherence was determined across a frequency range of 0.3–2.1 Hz to encompass the rhythmic activities that are dominant during SWA (Magill et al., 2000). Significant coherence was defined as such when coherence in at least two consecutive frequency bins (within the range 0.3–2.1 Hz) exceeded the significance level of p = 0.05. The “dominant frequency” of each pairing was derived from the frequency bin (within 0.3–2.1 Hz) that contained the highest coherence. The “peak coherence” was defined as the coherence value within that dominant frequency bin. The total coherence within all frequency bins between 0.3 and 2.1 Hz was also calculated for each pairing.
Statistical comparisons of unpaired data sets were conducted using the Mann–Whitney U test. The Wilcoxon signed rank test was used to compare paired data. The significance level for all tests was taken to be p < 0.05. Data are expressed as mean and SD unless stated otherwise.
Juxtacellular labeling of single neurons.
To identify the location and morphological properties of recorded units, neurons were then labeled with Neurobiotin by the juxtacellular method (Pinault, 1996; Magill et al., 2000). Briefly, the electrode was advanced slowly toward the neuron while a microiontophoretic current was applied (1–10 nA positive current; 200 ms duration; 50% duty cycle). The optimal position of the electrode was identified when the firing pattern of the neuron was robustly modulated by the current injection. Neuronal firing was modulated by the microiontophoretic current for 2–30 min to obtain reliable labeling. The Neurobiotin was then left to transport along neuronal processes for up to 12 h. After the recording and labeling sessions, the animals were given a lethal dose of ketamine (150 mgkg−1) and perfused via the ascending aorta with 100 ml of 0.01 m PBS at pH 7.4, followed by 300 ml of 0.1% w/v glutaraldehyde and 4% w/v paraformaldehyde in 0.1 m phosphate buffer (PB), pH 7.4, and then by 100 ml of PBS. Brains were then left in PBS or fixative solution at 4°C until sectioning 24–72 h later.
Histochemistry.
The fixed brains were sectioned at 60 μm in the parasagittal plane on a vibrating blade Microtome (VT1000S; Leica Microsystems, Milton Keynes, UK). Standard techniques were used to visualize the Neurobiotin-filled neurons (Magill et al., 2000). Histochemical incubations were performed at room temperature. Sections were washed in PBS and incubated overnight in avidin–biotin–peroxidase complex (ABC Elite; 1:100; Vector Laboratories) in PBS containing 0.2% v/v Triton X-100 and 1% w/v bovine serum albumin (Sigma). Triton X-100 was omitted for sections prepared for electron microscopy (see below). After washing, the sections were incubated in hydrogen peroxide (0.002% w/v; Sigma) and diaminobenzidine tetrahydrochloride (0.025% w/v; Sigma) in the presence of nickel ammonium sulfate (0.5% w/v; Sigma) dissolved in Tris buffer (0.05 m), pH 8.0, for 5–30 min. Neurobiotin-filled neurons were labeled intensely with an insoluble, black/blue precipitate.
Processing for electron microscopy.
Electron microscopy was only performed if just one neuron was juxtacellularly labeled in the brain. To enhance the tissue penetration of the reagents while maintaining subcellular structure, the sections were equilibrated in a cryoprotectant solution (0.05 m PB, pH 7.4, containing 25% sucrose and 10% glycerol) for ≥3 h. The sections were then freeze-thawed by freezing in isopentane cooled in liquid nitrogen, followed by liquid nitrogen, and thawing in PBS. The sections were then washed several times in PBS before revealing the Neurobiotin as above (but without Triton X-100).
All sections were washed several times in PB and postfixed with 1% w/v osmium tetroxide (in PB; Oxkem, Oxford, UK) for 25 min. After several washes in PB, the sections were dehydrated through a graded series of ethanol solutions, with 1% w/v uranyl acetate (TAAB Laboratories, Berkshire, UK) added to the 70% ethanol solution. After complete dehydration in absolute ethanol, the sections were treated with propylene oxide (Sigma) and placed in resin overnight (Durcupan ACM; Fluka, Dorset, UK). The sections were then mounted on glass slides, a coverslip was applied, and the slides were placed in an oven at 60°C to cure for 48 h. After examination and reconstruction of neural structures under a light microscope, selected regions of striatum were dissected from the section and glued onto cylindrical resin blocks. Serial ultrathin sections (∼70 nm) were cut on a Riechert-Jung Ultracut E Ultramicrotome (Leica, Nussloch, Germany) and collected on single-slot copper grids coated with pioloform (Agar Scientific, Essex, UK). Ultrathin sections were sometimes contrasted with lead citrate for 3–4 min. Sections were examined in a Philips CM 10 or CM 100 electron microscope.
Image capture and manipulation.
To create light micrograph montages with enhanced depth of field, several micrographs were taken at sequential focal depths and then processed using Helicon Focus software (Helicon, Kharkov, Ukraine) or with layering techniques in Photoshop software (Adobe Systems, San Jose, CA). Images from the electron microscope were recorded digitally using a multiscan CCD digital camera (Gatan, Oxford, UK). For most boutons forming synapses, serial sections (up to 14) were recorded. Images were viewed and manipulated (contrast, brightness, and application of lettering, arrows, etc.) using Adobe Photoshop software.
Three-dimensional reconstruction of labeled neurons.
The somatodendritic trees of labeled CL and Pf neurons, whose synaptic connections were further analyzed in the electron microsope, were reconstructed from successive serial sections (60 μm) using a 63× objective and were digitized using Neurolucida software (version 5; MicroBrightField, Williston, VT). Three-dimensional reconstructions of the neurons were visualized using the accompanying software package, Neuroexplorer (MicroBrightField).
Analysis of electron micrographs.
The structures postsynaptic to the labeled boutons (i.e., dendritic shaft or spine) were characterized. Spines were identified on the basis of their emergence from a dendrite, their relatively small size, the absence of mitochondria, and/or the presence of spine apparatus. The cross-sectional areas of the boutons and the length of the synaptic specialization were measured at their maximum extent using the public domain image-processing program ImageJ. Data are represented as mean and SD. Statistical comparisons were made using the Mann–Whitney U test, Wilcoxon signed rank test, or ANOVA, with p < 0.05 considered significant.
Results
Cortical activity
Prevailing cortical activity was assessed from ECoG recordings. As described previously (Steriade et al., 1993a; Magill et al., 2000), deep urethane anesthesia was accompanied by a slow-wave oscillation of large amplitude (>400 μV) and low frequency (∼1 Hz) in the frontal ECoG (Fig. 1). Higher-frequency activity of smaller amplitude (<200 μV), including spindle activity, was often superimposed on specific portions of the slow oscillation, both of which are hallmarks of SWA (Magill et al., 2000; Steriade, 2000, 2006). These portions of the slow oscillation are associated with synchronous spike discharges in cortical projection neurons and will be referred to as the “active component” (Magill et al., 2000).
Physiological properties of CL and Pf neurons
During periods of robust SWA in the ipsilateral cortex, extracellular unit recordings revealed that CL neurons (n = 31) tended to fire bursts of spikes in time with the active component of the cortical slow oscillation (Fig. 1A). The spike trains of most CL neurons (58%) contained a significant oscillation at <2 Hz (as revealed by Lomb analysis) (Fig. 1A) that was similar, on average, to the frequency of the prevailing cortical slow oscillation [mean frequency for CL neurons and ECoG were 0.92 (SD = 0.29) and 0.86 Hz (SD = 0.21), respectively]. The spike trains of other CL neurons (42%) were not rhythmic (Fig. 1B). The dominant frequency and peak power of cortical oscillations recorded simultaneously with these distinct unit activities were similar [mean ECoG frequency during recordings of oscillatory and nonoscillatory neurons was 0.86 (SD = 0.21) and 0.92 Hz (SD = 0.13), respectively; mean ECoG power for oscillatory and nonoscillatory neurons was 0.014 (SD = 0.009) and 0.011 mV2 (SD = 0.007), respectively]. The burst discharges of oscillatory and nonoscillatory CL neurons were characterized by 2–5 spikes fired in rapid succession (intraburst frequencies of >150 Hz), with a progressive attenuation of spike amplitude during the burst (Fig. 1A,B, insets). We performed coherence analyses to quantify the linear relationship (temporal coupling) between ECoGs and unit activity during SWA. The discharges of most oscillatory CL neurons (15 of 18 neurons; 83%) were significantly coherent with ECoGs at 0.3–2.1 Hz, the range of frequencies that were most prevalent throughout SWA (Fig. 1A). The mean dominant frequency and peak coherence were 0.93 Hz (SD = 0.19) and 0.49 (SD = 0.19), respectively, with a mean total coherence over the 0.3–2.1 Hz band of 1.46 (SD = 0.64). A smaller proportion of nonoscillatory CL neurons (8 of 13; 61%) fired in a coherent manner with cortical activity [dominant frequency, peak coherence, and total coherence over 0.3–2.1 Hz of 0.97 Hz (SD = 0.16), 0.48 (SD = 0.15), and 1.60 (SD = 0.59), respectively; not significantly different to oscillatory CL neurons].
Pf neurons (n = 52) exhibited either oscillatory (<2 Hz; 45% of neurons) (Fig. 1C) or nonoscillatory, irregular (55%) (Fig. 1D) spontaneous firing patterns. Oscillatory Pf neurons fired spikes in time with the active component of the cortical slow oscillation (Fig. 1C). The mean frequency of spike train oscillations was similar to that of the prevailing cortical oscillations [0.89 (SD = 0.22) and 0.87 Hz (SD = 0.11), respectively]. The dominant frequency and peak power of cortical oscillations recorded simultaneously with these distinct unit activities were similar [mean ECoG frequency for oscillatory and nonoscillatory neurons of 0.87 (SD = 0.11) and 0.85 Hz (SD = 0.14), respectively; mean ECoG power for oscillatory and nonoscillatory neurons of 0.014 (SD = 0.010) and 0.013 mV2 (SD = 0.010), respectively]. The discharges of most oscillatory Pf neurons (20 of 23 neurons; 87%) were significantly coherent with ECoGs at 0.3–2.1 Hz (Fig. 1C). The mean dominant frequency and peak coherence were 0.92 Hz (SD = 0.19) and 0.61 (SD = 0.15), respectively, with a mean total coherence over the 0.3–2.1 Hz band of 1.86 (SD = 0.58), which were similar to values obtained for both oscillatory and nonoscillatory CL neurons. A smaller proportion of nonoscillatory Pf neurons (18 of 29; 62%) fired in a coherent manner with cortical activity [dominant frequency and peak coherence were 0.87 Hz (SD = 0.22) and 0.44 (SD = 0.19), respectively]. The mean total coherence over 0.3–2.1 Hz was 1.29 (SD = 0.59), which was significantly lower than the total coherence for oscillating Pf neurons but not for either oscillatory or nonoscillatory CL neurons.
The mean firing rates of CL and Pf neurons were similar during SWA [2.9 (SD = 1.2) and 3.1 Hz (SD = 1.6), respectively]. However, their coefficients of variation of firing revealed a significant difference in firing pattern [mean coefficients for CL and Pf neurons of 1.47 (SD = 0.19) and 0.95 (SD = 0.22), respectively]. The possibility that systematic differences in brain state, as indicated by the ECoG, led to the distinct firing patterns of CL and Pf neurons is unlikely because the dominant frequency and peak power of ECoG activity were similar during recordings of both types of neuron [mean ECoG frequency and power of 0.89 Hz (SD = 0.18) and 0.013 mV2 (SD = 0.008) during recordings in CL vs 0.87 Hz (SD = 0.13) and 0.014 mV2 (SD = 0.010) during recordings in Pf]. The difference in firing pattern could also be because of the fact that CL neurons were more likely to oscillate in time with cortical SWA compared with Pf neurons (58 vs 45% of neurons, respectively). However, Pf neurons rarely exhibited the intense burst firing that was typical of CL neurons. Most of the ISIs in the spike trains of the CL neurons, but not Pf neurons, were ≤6 ms (Fig. 2A), which reflected the propensity of CL neurons to fire bursts of spikes with high intraburst frequencies. Moreover, CL neurons were more likely than Pf neurons to discharge significant bursts (Fig. 2B), particularly at burst indices indicative of robust bursting (BI ≥1) (Kaneoke and Vitek, 1996). Whereas all CL neurons were significantly bursting, the majority of Pf neurons were classified as nonbursting by the same analysis (Fig. 2B). Of the Pf neurons that were significantly bursting (11 of 52; 21%), six neurons were also significantly oscillating. Thus, oscillations per se may not predispose Pf neurons to bursting. Although Pf neurons were less likely to burst in a statistically significant manner (Kaneoke and Vitek, 1996), they often fired groups of several spikes at relatively low frequencies (approximating a burst-like behavior), commonly in time with the ongoing cortical SWA (Fig. 1C,D).
Figure 2.
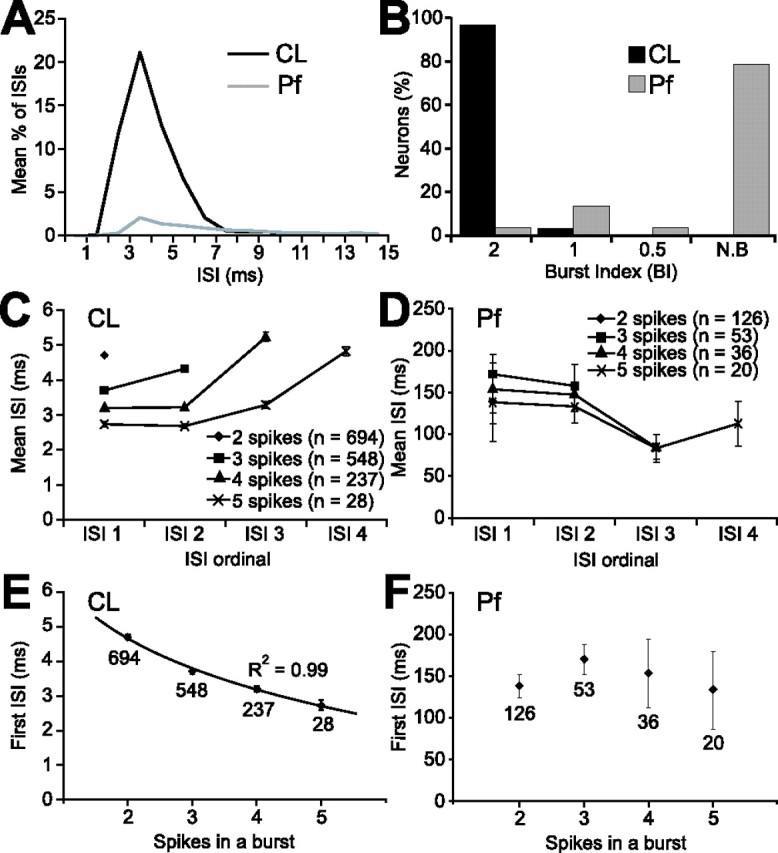
Prevalence and type of bursts fired by CL neurons and Pf neurons are different. A, Plot showing percentages of ISIs that were ≤15 ms for all CL and Pf neurons (n = 31 and 52, respectively). B, Proportions of bursting and nonbursting (N.B) neurons. Bursting neurons were defined as such when the BI was ≥0.5, with larger BIs indicating more robust bursting. C, D, Plots of ISIs as a function of the number of spikes in a burst for all bursting CL neurons (C) and Pf neurons (D). n, Number of bursts analyzed. Note the different y-axes of these plots. E, F, Plots of first ISI in a burst as a function of the number of spikes in a burst. Parameters for CL neurons (E) but not Pf neurons (F) showed an inverse relationship that was best characterized by a logarithmic function. Data points in C–F represent means ±2 SEM. Numbers under data points in E and F are the numbers of bursts analyzed.
The qualitative characteristics of the bursts fired by CL neurons are reminiscent of the low-threshold Ca2+ spike (LTS) bursts that are often discharged by thalamic relay neurons during anesthesia and natural sleep (Llinás and Steriade, 2006). Previous quantitative analyses have shown that LTS bursts are preceded by a silent period (50–100 ms) (Lu et al., 1992). Furthermore, LTS bursts are associated with a progressive increase in ISIs, and the duration of the first ISI in a given burst is predictive of the total number of spikes to be subsequently fired (Domich et al., 1986; Jeanmonod et al., 1996). All CL neurons fired bursts that satisfied strict criteria for identifying LTS bursts in extracellular unit recordings, that is, at least two spikes with an ISI of ≤5 ms but with a preceding silent period of >100 ms (Lu et al., 1992). Using a maximum ISI of 10 ms to define the end of a burst (Fanselow et al., 2001), on average, 75% of all spikes fired by CL neurons were contained within such bursts. Further analysis of the bursts fired by CL neurons showed that the ISIs did indeed lengthen during the bursts (Fig. 2C). Moreover, the first ISI in a burst was predictive of the total number of spikes within a burst (Fig. 2C); these two parameters demonstrated an inverse relationship that was well characterized by a logarithmic function (Fig. 2E). In contrast, the bursting or grouped firing exhibited by most Pf neurons did not satisfy the extracellular criteria of LTS bursts. Most of the ISIs in the spike trains of Pf neurons were >15 ms (Fig. 2A), and the ISIs of the minority of Pf neurons (n = 11; 21%) that were defined as significantly bursting (Fig. 2B) did not predictably lengthen during the bursts (Fig. 2D). Furthermore, there was no relationship between the duration of the first ISI within a burst to the number of spikes in a burst (Fig. 2F). Some of the bursting Pf neurons (8 of 11) occasionally fired spikes with ISIs ≤5 ms (Fig. 2A), but in only five of these neurons did spike discharges satisfy the LTS burst criterion of a preceding silent period of >100 ms (a mean of 28% of spikes were contained within such bursts).
Together, these data show that the physiological properties of CL and Pf neurons in vivo are distinct. Although the spike discharges of both types of thalamic neuron were often related to ongoing cortical SWA, and despite the fact that they were indistinguishable in terms of firing rate, there were clear differences in the prevalence and type of burst firing that was exhibited; most of the bursts fired by all CL neurons, but not Pf neurons, fulfilled the criteria for bursts mediated by LTSs.
Morphological characteristics of single CL and Pf neurons
After physiological characterization of single CL and Pf units, most neurons were then juxtacellularly labeled with Neurobiotin; robust modulation of unit activity during microiontophoresis always led to a single neuron being well labeled (Fig. 3). Identified CL neurons (n = 15) were located in the caudal two-thirds of the CL nucleus, whereas Pf neurons (n = 35) were situated throughout the nucleus (Fig. 3B). The somatodendritic morphological characteristics of CL and Pf neurons were distinct (Fig. 3A). The dendrites of CL neurons were studded with short spine-like protrusions (Fig. 3C), whereas the dendrites of Pf neurons exhibited more conspicuous filamentous spines and appendages (Fig. 3D). The dendrites of all CL neurons, regardless of subtle differences in oscillatory properties (see above), exhibited profuse branching and radiated outwards in two or three planes, thus conforming to the compact “bushy” or “tufted” appearance that is classically attributed to thalamic relay neurons (Jones, 1985) (Fig. 3A,E,G). In contrast, the dendrites of Pf neurons were longer and branched less frequently, particularly in the proximal regions, and adhered to a “reticular-like” organization, in that they resembled those of neurons of the brainstem reticular formation (Scheibel and Scheibel, 1967) (Fig. 3A,F,G). These features were shared by all Pf neurons regardless of oscillatory and bursting properties. Reconstructions of the somata and dendritic trees of CL and Pf neurons clearly demonstrated the differences in the size of arborizations and the degree of branching (Fig. 3E–G). Quantitative analyses of the dendrites of two representative CL neurons and five Pf neurons, the axonal projections of which to the striatum were also characterized (see below), supported these observations (Table 1). The dendritic branch points and dendritic ends of the CL neurons were approximately twice as numerous as those of the Pf neurons (Table 1). Although the total dendritic lengths of CL neurons were greater than those of Pf neurons, the dendritic segments of CL neurons were generally shorter than those of Pf neurons (segment range and mean for CL neurons, 1.8–222 and 79 μm, respectively; range and mean for Pf neurons, 2.8–647 and 138 μm, respectively). A Sholl analysis of dendritic branching (as a function of radial distance from the parent soma) also demonstrated that the dendrites of CL neurons exhibited prolific branching, particularly within 200 μm of the somata (Fig. 3H). In contrast, the dendrites of Pf neurons branched less frequently, but with a more even spatial distribution, up to 600 μm from the somata (Fig. 3H). Although Pf neurons extended their dendrites over a much larger volume of the parent nucleus compared with CL neurons, the dendrites only rarely extended further than the boundaries of the Pf nucleus itself. The axons of CL and Pf neurons did not emit local collaterals within their parent nuclei (data not shown). These data thus complement and extend our in vivo physiological data, and demonstrate that the distinct physiological properties of CL and Pf neurons are mirrored by differences in somatodendritic characteristics.
Figure 3.

Somatodendritic morphological characteristics of CL and Pf neurons are distinct. A, Montage of light micrographs of a CL neuron and a Pf neuron that were juxtacellularly labeled with Neurobiotin during different electrode penetrations in the same animal. fr, Fascicularis retroflexus. Montage created by merging micrographs from two adjacent sections. B, Locations of all labeled CL and Pf neurons plotted in the sagittal plane. CM, Central medial thalamic nucleus; LP, lateral posterior; MD, mediodorsal; PC, paracentral. C, D, Light micrographs of single dendrites of the neurons shown in A. Filamentous spines (white arrows) are present on the dendrite of the Pf neuron in D but not the CL neuron in C. Scale bar in D also applies to C. E, Digital reconstruction of the entire somatodendritic tree of another labeled CL neuron in the sagittal plane (left) and coronal plane (right). The CL neuron shown is the same as in Figure 1B. F, Digital reconstruction of the entire somatodendritic tree of another Pf neuron in the sagittal plane (left) and coronal plane (right). Note that neurons in E and F are shown at the same scale. G, Dendrograms of a representative CL neuron (top) and a Pf neuron (bottom; same neuron as in F). Note the differences in the number and length of dendritic segments for each neuron type. H, Sholl analysis of dendritic branching as a function of radial distance from soma for two representative CL neurons and five Pf neurons (also see Table 1). Data are means + SEMs for each neuron type. C, Caudal; D, dorsal; R, rostral; V, ventral; M, medial; L, lateral.
Table 1.
Quantitative analysis of dendrites of identified CL and Pf neurons
| Neurona | Number of primary dendrites | Number of branch points | Number of ends | Total dendritic length (μm) | Mean dendritic length (μm) | Mean dendritic segment length (μm) |
|---|---|---|---|---|---|---|
| CL 2 | 8 | 63 | 79 | 11247 | 1406 | 83 |
| CL 4 | 6 | 45 | 57 | 7628 | 1271 | 75 |
| Pf 1 | 5 | 15 | 22 | 6528 | 1306 | 176 |
| Pf 2 | 6 | 21 | 29 | 6246 | 1041 | 125 |
| Pf 3 | 5 | 18 | 23 | 5837 | 1167 | 142 |
| Pf 5 | 5 | 22 | 28 | 6698 | 1340 | 134 |
| Pf 6 | 5 | 25 | 30 | 6178 | 1236 | 112 |
Synaptic connections within striatum of identified CL and Pf neurons
The axons of CL neurons that were intensely labeled were traced to the thalamic reticular nucleus (TRN) and striatum where they emitted collaterals that possessed boutons. In the striatum, axon collaterals were generally long and smooth, with boutons “en passant,” although boutons “terminaux” were also observed (Fig. 4A,B). Qualitative observations suggested that the axons of CL neurons did not extensively innervate the striatum, and that dense axonal plexuses were rare. Axonal boutons in the striatum originating from four CL neurons were examined in the electron microscope. All identified synapses (n = 85) were of the asymmetric type (Gray's type I) with prominent postsynaptic densities (Fig. 4C). The mean cross-sectional area of the boutons was 0.16 μm2 (SD = 0.06) and the mean length of the postsynaptic densities was 0.29 μm (SD = 0.04). The majority of synapses derived from the four CL neurons (mean, 91%) were established with the heads of dendritic spines of presumed medium-size spiny projection neurons (MSNs) (Fig. 4C, Table 2). This sample of CL neurons was homogeneous in terms of both electrophysiological properties (see above) and synaptic connectivity within the striatum (Table 2). A minority of boutons (14%) formed multiple synapses with more than one dendritic spine and, in three cases, with a dendritic spine and shaft (data not shown).
Figure 4.
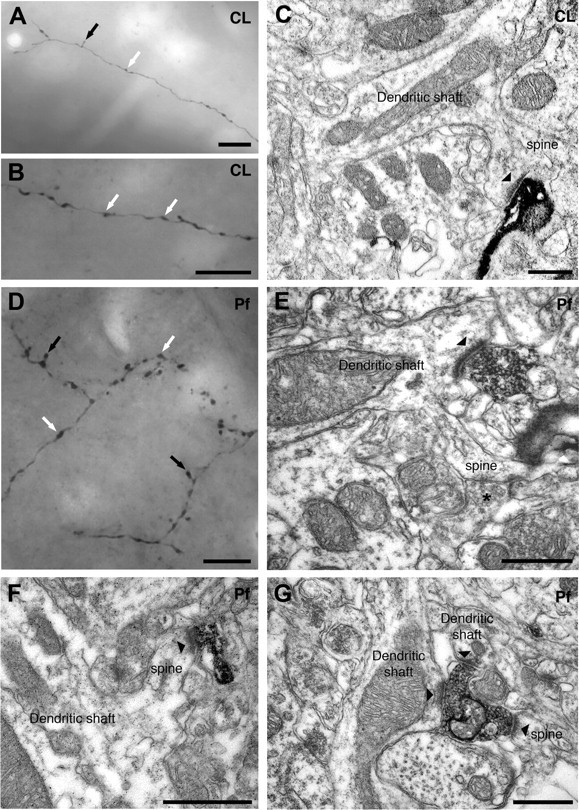
Synaptic connections within striatum of single, identified CL and Pf neurons. A, B, Montages of light micrographs of parts of a CL neuron axon, with boutons en passant (white arrows) and terminaux (black arrow) in the striatum. In each case, montages were made of serial micrographs captured at different focal depths from a single section. C, Electron micrograph of an axonal terminal (identified by the dark, amorphous peroxidase reaction product) in the striatum that arose from a single identified CL neuron. The terminal forms an asymmetric synapse (arrowhead) with the head of a dendritic spine emerging from a dendritic shaft of a presumed spiny projection neuron. D, Montage of light micrographs of parts of a Pf neuron axon, with boutons en passant (white arrows) and terminaux (black arrows), in the striatum. The montage was made of serial micrographs captured at different focal depths from the same section. E, Electron micrograph of an axonal terminal in the striatum that arose from a labeled Pf neuron. The terminal forms an asymmetric synapse (arrowhead) with a dendritic shaft of a presumed spiny projection neuron. Note the emerging dendritic spine that receives additional synaptic input from an unlabeled terminal (asterisk). F, Electron micrograph of an axonal terminal in the striatum that arose from another labeled Pf neuron. The terminal forms an asymmetric synapse (arrowhead) with the head of a dendritic spine emerging from a dendritic shaft of a presumed spiny projection neuron. G, Electron micrograph showing an axonal terminal in the striatum that arose from a labeled Pf neuron (same neuron as in E). The terminal forms asymmetric synapses (arrowheads) with two dendritic shafts and a dendritic spine. Scale bars: A, B, D, 10 μm; C, E–G, 0.5 μm.
Table 2.
Synaptic connections within striatum of identified CL neurons
| CL neuron | Number of synapses | Postsynaptic targets [number of synapses (% total)] |
||
|---|---|---|---|---|
| Dendritic spines | Dendritic shafts | Unclassified structurea | ||
| 1 | 19 | 18 (95) | 1 (5) | 0 |
| 2 | 18 | 16 (89) | 1 (5.5) | 1 (5.5) |
| 3 | 24 | 22 (92) | 2 (8) | 0 |
| 4 | 24 | 21 (88) | 1 (4) | 2 (8) |
In common with CL neurons, the axons of Pf neurons also gave off collaterals in the TRN. However, in contrast to CL neurons, the axons of Pf neurons branched much more profusely in the striatum, forming several dense plexuses (Fig. 4D) and intensely innervated many striatal areas. Qualitative observations suggested that the axons of Pf neurons had many boutons terminaux that protruded from the main axon branch (Fig. 4D). Axonal boutons in the striatum from six Pf neurons were examined in the electron microscope. All identified synapses (n = 169) were of the asymmetric type (Fig. 4E–G). The mean cross-sectional area of the boutons was 0.17 μm2 (SD = 0.03) and the mean length of the postsynaptic densities was 0.30 μm (SD = 0.03), which were similar to values obtained for the synaptic boutons of CL neurons. However, in contrast to CL neurons, the majority of synapses derived from the six Pf neurons (mean, 63%) were established with the dendritic shafts of presumed spiny projection neurons (Fig. 4E) and, possibly, aspiny interneurons (Fig. 4G; Table 3). The axons of Pf neurons also formed synaptic connections with the dendritic spines of presumed spiny projection neurons (Fig. 4F,G), albeit much less frequently than CL neurons. Whereas the pooled data suggest that, on average, Pf neurons predominantly target dendritic shafts, a comparison of the synaptic connections of individual neurons revealed a marked heterogeneity (Table 3). Two of the six Pf neurons examined (neurons 2 and 4) exclusively targeted dendritic shafts, whereas the axon of a third (neuron 3; same as that shown in Fig. 1C) almost exclusively formed synapses with dendritic spines (97% of synapses). The remaining three neurons preferentially targeted dendritic shafts but with variable proportions of synapses formed with shafts and spines. This heterogeneity in synaptic connectivity did not correlate with the locations of neurons within the Pf, firing properties, or dendritic architecture (Fig. 5, Table 4). Some single boutons (12%) of Pf axons formed more than one synapse with different classes of postsynaptic structure (e.g., the same bouton could form synapses with both dendritic spines and dendritic shafts) (Fig. 4G).
Table 3.
Synaptic connections within striatum of identified Pf neurons
| Pf neuron | Number of synapses | Postsynaptic targets [number of synapses (% total)] |
||
|---|---|---|---|---|
| Dendritic spines | Dendritic shafts | Unclassified structurea | ||
| 1 | 30 | 10 (33) | 18 (60) | 2 (7) |
| 2 | 31 | 0 | 29 (94) | 2 (6) |
| 3 | 29 | 28 (97) | 1 (3) | 0 |
| 4 | 19 | 0 | 17 (90) | 2 (10) |
| 5 | 22 | 1 (5) | 17 (77) | 4 (18) |
| 6 | 38 | 18 (47) | 20 (53) | 0 |
aUnclassified structure is one that could not be defined as a dendritic spine or a dendritic shaft. Note, however, that synapses were not established with cell bodies.
Figure 5.

Locations of all CL neurons and Pf neurons used for electron microscopic analysis of synaptic connections. Locations are plotted in the sagittal plane (L, distance lateral of midline). Neurons are numbered as in Tables 2 and 3. CM, Central medial thalamic nucleus; LP, lateral posterior thalamic nucleus; MD, mediodorsal thalamic nucleus; PC, paracentral thalamic nucleus. Dashed lines indicate the boundaries of the fascicularis retroflexus (fr) within the Pf.
Table 4.
Firing properties of Pf neurons with verified striatal synaptic connections
| Pf neuron | Oscillationa | Burstingb | Synapses with dendritic shafts (%) |
|---|---|---|---|
| 1 | Yes | Yes (with LTS) | 60 |
| 2 | No | No | 94 |
| 3 | Yes | No | 3 |
| 4 | Yes | No | 90 |
| 5 | No | No | 77 |
| 6 | Yes | Yes | 53 |
Some bursts fired by Pf neuron 1 met criteria for LTS bursts. Pf neurons 3 and 5 are also shown in Figures 1C and 3G, respectively.
aSignificant oscillation at <2 Hz.
bSignificantly bursting according to Kaneoke and Vitek (1996).
These data directly demonstrate that CL and Pf neurons differ markedly in their synaptic connectivity within striatum, as well as their physiological properties and somatodendritic morphological characteristics. Moreover, populations of Pf neurons, but not CL neurons, exhibit a clear heterogeneity with respect to their postsynaptic targets in the striatum.
Discussion
Although thalamostriatal systems are commonly considered as functionally homogeneous, our analyses demonstrate that projections from CL and Pf neurons are functionally distinct and are thus likely to have profoundly different influences on striatal (and possibly cortical) information processing.
Identified CL and Pf neurons have different firing properties in vivo
As in sleeping or anesthetized rats, cats, and humans (Steriade, 2000, 2006), cortical activity in our preparation was dominated by a slow oscillation (∼1 Hz) that is generated through synchronous membrane potential transitions of principal neurons (Steriade et al., 1993a; Contreras and Steriade, 1995). The resultant synchronous discharges in corticofugal pathways may in turn entrain the thalamus (Steriade et al., 1993b; Contreras and Steriade, 1995) and, indeed, the activity of most CL and Pf neurons was correlated with the coincident slow oscillation. However, the pattern and incidence of burst firing was markedly different for CL and Pf neurons.
Thalamic relay neurons respond to excitatory inputs in a bursting or tonic mode, depending on a voltage- (and time-) dependent inward Ca2+ current, IT, that is mediated by T-type Ca2+ channels on the soma and dendrites (Huguenard, 1996; Destexhe et al., 1998; Williams and Stuart, 2000). In burst mode, activation of IT leads to a depolarizing envelope, the LTS, which often triggers a high-frequency burst of Na+/K+ action potentials. The kinetic properties of IT dictate that the LTS is only produced after transient (∼100 ms) membrane hyperpolarization. During the slow oscillation in vivo, rhythmic GABAergic inputs from the TRN and disfacilitation of cortical inputs induce membrane hyperpolarizations in relay neurons sufficient to deinactivate IT and promote rhythmic LTS bursting (Steriade et al., 1993b; Contreras and Steriade, 1995). All CL neurons we recorded fired spike bursts that satisfied strict criteria for identifying LTS bursts extracellularly (Domich et al., 1986; Lu et al., 1992; Llinás and Steriade, 2006). In contrast, 90% of Pf neurons did not fire LTS bursts but instead displayed single-spike (tonic) activity that was often grouped into burst-like discharges. These disparate firing properties were not attributable to differences in ongoing cortical activity. Thus, CL and Pf neurons may have distinct intrinsic membrane properties.
Recordings in vivo and in vitro consistently show that CL neurons express prominent IT and are able to generate LTS bursts (Domich et al., 1986; Steriade et al., 1993b; Govindaiah and Cox, 2006). The existence of LTS bursting in identified Pf neurons has not been systematically tested in vivo, although most show a reduction or complete absence of IT and LTS bursting in vitro (Phelan et al., 2005; Smith et al., 2006) (but see Govindaiah and Cox, 2006), in accordance with our findings. Thus, CL neurons behave in a manner that is typical of thalamic relay neurons but Pf neurons do not, which challenges the common view that all relay cells have equivalent fundamental properties (Llinás and Steriade, 2006).
Dendritic architectures of CL and Pf neurons are distinct
The dendrites of CL neurons adhered to the bushy architecture typical of thalamic relay neurons, whereas the dendrites of Pf neurons were reticular-like, in agreement with previous studies (Scheibel and Scheibel, 1967; Jones, 1985; Sugiyama et al., 1992; Deschênes et al., 1996a,b; Parent and Parent, 2005). The distinct firing properties of CL and Pf neurons in vivo might reflect these conspicuously different dendritic arbors. Indeed, varied dendritic geometry could alone result in substantial differences in responses to (similar) synaptic inputs (Mainen and Sejnowski, 1996). However, different distributions of voltage-gated ion channels, particularly those underlying or gating IT, along the dendrites of CL and Pf neurons could also profoundly influence their intrinsic abilities to produce LTS bursts (Destexhe et al., 1998). Moreover, IT plays key roles in the amplification of subthreshold inputs to thalamic neurons (Williams and Stuart, 2000). Because CL neurons might express more IT than Pf neurons, greater boosting of inhibitory and/or excitatory inputs in CL neurons offers another mechanism by which similar afferent activity could drive LTS bursting in CL but not Pf neurons.
The distinct firing of CL and Pf neurons could be partly because of differences in afferent connectivity. The quantitative features of afferent innervation, such as density, placement, and total number of synapses, are unknown. At the level of whole nuclei, CL and Pf receive similar inputs. These include prominent GABAergic inputs from zona incerta, the BG output nuclei and ipsilateral TRN (Kolmac and Mitrofanis, 1997; Barthó et al., 2002; Van der Werf et al., 2002), and excitatory inputs from the cortex, superior colliculus, and midbrain/brainstem reticular formation (Jones, 1985; Van der Werf et al., 2002; McHaffie et al., 2005). However, CL but not Pf neurons receive a small input from contralateral TRN (Hazrati et al., 1995); this additional hyperpolarizing input might be a discriminating factor underlying LTS bursting in CL.
CL and Pf neurons establish different synaptic connections in the striatum
Both CL and Pf neurons project in a topographic manner to the striatum and/or cortex (Groenewegen and Berendse, 1994; Van der Werf et al., 2002; Smith et al., 2004). In rats, almost all CL and Pf neurons innervate both the striatum and cortex (Deschênes et al., 1996a,b), although this may not apply to all species (Parent and Parent, 2005). Our data demonstrate that differences between identified CL and Pf neurons extend to the structures they target in the striatum. The axons of the four CL neurons we studied in the electron microscope formed asymmetric synapses almost exclusively with the dendritic spines of MSNs. When considered as a single group, the six Pf neurons we studied preferentially targeted dendritic shafts of MSNs and interneurons. This direct evidence agrees with estimates of connectivity in previous tract-tracing studies (Dubé et al., 1988; Xu et al., 1991; Lapper and Bolam, 1992; Sadikot et al., 1992; Ichinohe et al., 2001). Moreover, the study of single neurons allowed us to determine connectivity variations within a population.
The connectivity of single CL neurons was homogeneous. However, Pf neurons have a hitherto unappreciated degree of heterogeneity in their connectivity. Single Pf neurons can innervate both spines and shafts, exclusively innervate shafts, or selectively innervate spines. The functional consequences of such heterogeneity are unclear, but it argues against the common assumption that Pf neurons are an unlikely source of synapses on spines.
Our findings together imply that the integration of CL and Pf inputs by MSNs is distinct. The differences between CL and Pf neurons, and the heterogeneity in connectivity (and physiology) of Pf neurons, call for reinterpretation of the functions commonly ascribed to all of the ITN (Llinás et al., 1998) or Pf neuron population as a whole (Kimura et al., 2004; McHaffie et al., 2005).
Additional functional considerations
Membrane potentials of principal neurons in the striatum and cortex fluctuate between hyperpolarized “down states” and depolarized “up states”; the latter must be reached before firing occurs (Steriade et al., 1993a; Stern et al., 1997). Our data suggest that the roles played by CL and Pf neurons in driving activity in both the striatum and cortex are fundamentally distinct. A temporal summation of postsynaptic potentials is more likely to occur after LTS bursting of CL neurons than after (grouped) single-spike firing of Pf neurons. High-frequency trains of inputs from CL neurons are thus more likely to drive transitions to the up state (MacLean et al., 2005) or, if the target neuron is already in the up state, evoke firing. Moreover, LTS bursting is more reliable than tonic firing for transmitting signals from the thalamus to the cortex (Swadlow and Gusev, 2001). Tonically firing Pf neurons may have a more subtle effect on target neurons and would support more linear input–output relationships (Sherman, 2001). Notably, LTS bursts are also well suited for inducing plasticity at thalamostriatal and thalamocortical synapses (Lisman, 1997). Selective targeting of dendritic spines, which are ideally suited for the localized regulation of synaptic efficacy (Nimchinsky et al., 2002), by CL neurons that fire LTS bursts is an efficacious mechanism for inducing plasticity in striatal targets; this mechanism would be unavailable to most Pf neurons.
Our findings have further implications for the neural representations of awake behavior. Although the incidence of LTS bursting in the thalamus is certainly highest during anesthesia and slow-wave sleep (Llinás and Steriade, 2006), it is not limited to these brain states. Data from awake animals suggest that LTS bursting might be critically important for information processing during wakefulness (Fanselow et al., 2001; Sherman, 2001; Swadlow and Gusev, 2001). This notion might also be important for pathological conditions; recordings from putative CL and Pf neurons in awake parkinsonian patients show that, in line with our data, CL neurons typically engage in LTS bursting whereas most Pf neurons do not (Magnin et al., 2000).
In conclusion, thalamostriatal inputs provide information on sensory events of behavioral significance and are likely to be important for arousal, attention, orienting, and action selection (Van der Werf et al., 2002; Jones, 2003; Kimura et al., 2004; McHaffie et al., 2005). Our results demonstrate, however, that CL and Pf neurons influence the striatum through fundamentally distinct mechanisms, and they provide different temporally patterned inputs to distinct striatal targets.
Footnotes
This work was supported by the UK Medical Research Council. We thank E. Norman, C. Francis, and B. Micklem ARPS for expert technical assistance. We are grateful to Drs. D. W. Cope, N. Mallet and P. Fuentealba for their insightful comments on this manuscript and to Prof. P. Brown for advice on analysis.
References
- Barthó P, Freund TF, Acsády L. Selective GABAergic innervation of thalamic nuclei from zona incerta. Eur J Neurosci. 2002;16:999–1014. doi: 10.1046/j.1460-9568.2002.02157.x. [DOI] [PubMed] [Google Scholar]
- Contreras D, Steriade M. Cellular basis of EEG slow rhythms: a study of dynamic corticothalamic relationships. J Neurosci. 1995;15:604–622. doi: 10.1523/JNEUROSCI.15-01-00604.1995. [DOI] [PMC free article] [PubMed] [Google Scholar]
- DeLong MR. Primate models of movement disorders of basal ganglia origin. Trends Neurosci. 1990;13:281–285. doi: 10.1016/0166-2236(90)90110-v. [DOI] [PubMed] [Google Scholar]
- Deschênes M, Bourassa J, Parent A. Striatal and cortical projections of single neurons from the central lateral thalamic nucleus in the rat. Neuroscience. 1996a;72:679–687. doi: 10.1016/0306-4522(96)00001-2. [DOI] [PubMed] [Google Scholar]
- Deschênes M, Bourassa J, Doan VD, Parent A. A single-cell study of the axonal projections arising from the posterior intralaminar thalamic nuclei in the rat. Eur J Neurosci. 1996b;8:329–343. doi: 10.1111/j.1460-9568.1996.tb01217.x. [DOI] [PubMed] [Google Scholar]
- Destexhe A, Neubig M, Ulrich D, Huguenard J. Dendritic low-threshold calcium currents in thalamic relay cells. J Neurosci. 1998;18:3574–3588. doi: 10.1523/JNEUROSCI.18-10-03574.1998. [DOI] [PMC free article] [PubMed] [Google Scholar]
- Domich L, Oakson G, Steriade M. Thalamic burst patterns in the naturally sleeping cat: a comparison between cortically projecting and reticularis neurones. J Physiol (Lond) 1986;379:429–449. doi: 10.1113/jphysiol.1986.sp016262. [DOI] [PMC free article] [PubMed] [Google Scholar]
- Dubé L, Smith AD, Bolam JP. Identification of synaptic terminals of thalamic or cortical origin in contact with distinct medium-size spiny neurons in the rat neostriatum. J Comp Neurol. 1988;267:455–471. doi: 10.1002/cne.902670402. [DOI] [PubMed] [Google Scholar]
- Fanselow EE, Sameshima K, Baccala LA, Nicolelis MA. Thalamic bursting in rats during different awake behavioral states. Proc Natl Acad Sci USA. 2001;98:15330–15335. doi: 10.1073/pnas.261273898. [DOI] [PMC free article] [PubMed] [Google Scholar]
- Govindaiah G, Cox CL. Modulation of thalamic neuron excitability by orexins. Neuropharmacology. 2006;51:414–425. doi: 10.1016/j.neuropharm.2006.03.030. [DOI] [PubMed] [Google Scholar]
- Groenewegen HJ, Berendse HW. The specificity of the “nonspecific” midline and intralaminar thalamic nuclei. Trends Neurosci. 1994;17:52–57. doi: 10.1016/0166-2236(94)90074-4. [DOI] [PubMed] [Google Scholar]
- Halliday DM, Rosenberg JR, Amjad AM, Breeze P, Conway BA, Farmer SF. A framework for the analysis of mixed time series/point process data–theory and application to the study of physiological tremor, single motor unit discharges and electromyograms. Prog Biophys Mol Biol. 1995;64:237–278. doi: 10.1016/s0079-6107(96)00009-0. [DOI] [PubMed] [Google Scholar]
- Hazrati LN, Pinault D, Parent A. The thalamic reticular nucleus does not send commissural projection to the contralateral parafascicular nucleus in the rat. Brain Res. 1995;679:123–134. doi: 10.1016/0006-8993(95)00223-d. [DOI] [PubMed] [Google Scholar]
- Huguenard JR. Low-threshold calcium currents in central nervous system neurons. Annu Rev Physiol. 1996;58:329–348. doi: 10.1146/annurev.ph.58.030196.001553. [DOI] [PubMed] [Google Scholar]
- Ichinohe N, Iwatsuki H, Shoumura K. Intrastriatal targets of projection fibers from the central lateral nucleus of the rat thalamus. Neurosci Lett. 2001;302:105–108. doi: 10.1016/s0304-3940(01)01666-4. [DOI] [PubMed] [Google Scholar]
- Jeanmonod D, Magnin M, Morel A. Low-threshold calcium spike bursts in the human thalamus. Common physiopathology for sensory, motor and limbic positive symptoms. Brain. 1996;119:363–375. doi: 10.1093/brain/119.2.363. [DOI] [PubMed] [Google Scholar]
- Johnson DH. Point process models of single-neuron discharges. J Comp Neurosci. 1996;3:275–299. doi: 10.1007/BF00161089. [DOI] [PubMed] [Google Scholar]
- Jones BE. Arousal systems. Front Biosci. 2003;8:s438–451. doi: 10.2741/1074. [DOI] [PubMed] [Google Scholar]
- Jones EG. New York: Plenum; 1985. The thalamus. [Google Scholar]
- Kaneoke Y, Vitek JL. Burst and oscillation as disparate neuronal properties. J Neurosci Methods. 1996;68:211–223. doi: 10.1016/0165-0270(96)00081-7. [DOI] [PubMed] [Google Scholar]
- Kimura M, Minamimoto T, Matsumoto N, Hori Y. Monitoring and switching of cortico-basal ganglia loop functions by the thalamo-striatal system. Neurosci Res. 2004;48:355–360. doi: 10.1016/j.neures.2003.12.002. [DOI] [PubMed] [Google Scholar]
- Kolmac CI, Mitrofanis J. Organisation of the reticular thalamic projection to the intralaminar and midline nuclei in rats. J Comp Neurol. 1997;377:165–178. doi: 10.1002/(sici)1096-9861(19970113)377:2<165::aid-cne2>3.0.co;2-1. [DOI] [PubMed] [Google Scholar]
- Lapper SR, Bolam JP. Input from the frontal cortex and the parafascicular nucleus to cholinergic interneurones in the dorsal striatum of the rat. Neuroscience. 1992;51:533–545. doi: 10.1016/0306-4522(92)90293-b. [DOI] [PubMed] [Google Scholar]
- Lisman JE. Bursts as a unit of neural information: making unreliable synapses reliable. Trends Neurosci. 1997;20:38–43. doi: 10.1016/S0166-2236(96)10070-9. [DOI] [PubMed] [Google Scholar]
- Llinás R, Ribary U, Contreras D, Pedroarena C. The neuronal basis for consciousness. Philos Trans R Soc Lond B Biol Sci. 1998;353:1841–1849. doi: 10.1098/rstb.1998.0336. [DOI] [PMC free article] [PubMed] [Google Scholar]
- Llinás RR, Steriade M. Bursting of thalamic neurons and states of vigilance. J Neurophysiol. 2006;95:3297–3308. doi: 10.1152/jn.00166.2006. [DOI] [PubMed] [Google Scholar]
- Lu SM, Guido W, Sherman SM. Effects of membrane voltage on receptive field properties of lateral geniculate neurons in the cat: contributions of the low-threshold Ca2+ conductance. J Neurophysiol. 1992;68:2185–2198. doi: 10.1152/jn.1992.68.6.2185. [DOI] [PubMed] [Google Scholar]
- MacLean JN, Watson BO, Aaron GB, Yuste R. Internal dynamics determine the cortical response to thalamic stimulation. Neuron. 2005;48:811–823. doi: 10.1016/j.neuron.2005.09.035. [DOI] [PubMed] [Google Scholar]
- Magill PJ, Bolam JP, Bevan MD. Relationship of activity in the subthalamic nucleus-globus pallidus network to cortical electroencephalogram. J Neurosci. 2000;20:820–833. doi: 10.1523/JNEUROSCI.20-02-00820.2000. [DOI] [PMC free article] [PubMed] [Google Scholar]
- Magnin M, Morel A, Jeanmonod D. Single-unit analysis of the pallidum, thalamus and subthalamic nucleus in parkinsonian patients. Neuroscience. 2000;96:549–564. doi: 10.1016/s0306-4522(99)00583-7. [DOI] [PubMed] [Google Scholar]
- Mainen ZF, Sejnowski TJ. Influence of dendritic structure on firing pattern in model neocortical neurons. Nature. 1996;382:363–366. doi: 10.1038/382363a0. [DOI] [PubMed] [Google Scholar]
- McHaffie JG, Stanford TR, Stein BE, Coizet V, Redgrave P. Subcortical loops through the basal ganglia. Trends Neurosci. 2005;28:401–407. doi: 10.1016/j.tins.2005.06.006. [DOI] [PubMed] [Google Scholar]
- Nimchinsky EA, Sabatini BL, Svoboda K. Structure and function of dendritic spines. Annu Rev Physiol. 2002;64:313–353. doi: 10.1146/annurev.physiol.64.081501.160008. [DOI] [PubMed] [Google Scholar]
- Parent M, Parent A. Single-axon tracing and three-dimensional reconstruction of centre median-parafascicular thalamic neurons in primates. J Comp Neurol. 2005;481:127–144. doi: 10.1002/cne.20348. [DOI] [PubMed] [Google Scholar]
- Paxinos G, Watson C. Sydney: Academic; 1986. The rat brain in stereotaxic coordinates. [DOI] [PubMed] [Google Scholar]
- Phelan KD, Mahler HR, Deere T, Cross CB, Good C, Garcia-Rill E. Postnatal maturational properties of rat parafascicular thalamic neurons recorded in vitro. Thalamus Relat Syst. 2005;3:89–113. doi: 10.1017/S1472928805000105. [DOI] [PMC free article] [PubMed] [Google Scholar]
- Pinault D. A novel single-cell staining procedure performed in vivo under electrophysiological control: morpho-functional features of juxtacellularly labeled thalamic cells and other central neurons with biocytin or Neurobiotin. J Neurosci Methods. 1996;65:113–136. doi: 10.1016/0165-0270(95)00144-1. [DOI] [PubMed] [Google Scholar]
- Sadikot AF, Parent A, Smith Y, Bolam JP. Efferent connections of the centromedian and parafascicular thalamic nuclei in the squirrel monkey: a light and electron microscopic study of the thalamostriatal projection in relation to striatal heterogeneity. J Comp Neurol. 1992;320:228–242. doi: 10.1002/cne.903200207. [DOI] [PubMed] [Google Scholar]
- Scheibel ME, Scheibel AB. Structural organization of nonspecific thalamic nuclei and their projection toward cortex. Brain Res. 1967;6:60–94. doi: 10.1016/0006-8993(67)90183-7. [DOI] [PubMed] [Google Scholar]
- Sherman SM. Tonic and burst firing: dual modes of thalamocortical relay. Trends Neurosci. 2001;24:122–126. doi: 10.1016/s0166-2236(00)01714-8. [DOI] [PubMed] [Google Scholar]
- Smith PH, Bartlett EL, Kowalkowski A. Unique combination of anatomy and physiology in cells of the rat paralaminar thalamic nuclei adjacent to the medial geniculate body. J Comp Neurol. 2006;496:314–334. doi: 10.1002/cne.20913. [DOI] [PMC free article] [PubMed] [Google Scholar]
- Smith Y, Bevan MD, Shink E, Bolam JP. Microcircuitry of the direct and indirect pathways of the basal ganglia. Neuroscience. 1998;86:353–387. doi: 10.1016/s0306-4522(98)00004-9. [DOI] [PubMed] [Google Scholar]
- Smith Y, Raju DV, Pare JF, Sidibe M. The thalamostriatal system: a highly specific network of the basal ganglia circuitry. Trends Neurosci. 2004;27:520–527. doi: 10.1016/j.tins.2004.07.004. [DOI] [PubMed] [Google Scholar]
- Steriade M. Corticothalamic resonance, states of vigilance and mentation. Neuroscience. 2000;101:243–276. doi: 10.1016/s0306-4522(00)00353-5. [DOI] [PubMed] [Google Scholar]
- Steriade M. Grouping of brain rhythms in corticothalamic systems. Neuroscience. 2006;137:1087–1106. doi: 10.1016/j.neuroscience.2005.10.029. [DOI] [PubMed] [Google Scholar]
- Steriade M, Nuñez A, Amzica F. A novel slow (<1 Hz) oscillation of neocortical neurons in vivo: depolarizing and hyperpolarizing components. J Neurosci. 1993a;13:3252–3265. doi: 10.1523/JNEUROSCI.13-08-03252.1993. [DOI] [PMC free article] [PubMed] [Google Scholar]
- Steriade M, Contreras D, Curró Dossi R, Nuñez A. The slow (<1 Hz) oscillation in reticular thalamic and thalamocortical neurons: scenario of sleep rhythm generation in interacting thalamic and neocortical networks. J Neurosci. 1993b;13:3284–3299. doi: 10.1523/JNEUROSCI.13-08-03284.1993. [DOI] [PMC free article] [PubMed] [Google Scholar]
- Stern EA, Kincaid AE, Wilson CJ. Spontaneous subthreshold membrane potential fluctuations and action potential variability of rat corticostriatal and striatal neurons in vivo. J Neurophysiol. 1997;77:1697–1715. doi: 10.1152/jn.1997.77.4.1697. [DOI] [PubMed] [Google Scholar]
- Sugiyama K, Ryu H, Uemura K. Identification of nociceptive neurons in the medial thalamus: morphological studies of nociceptive neurons with intracellular injection of horseradish peroxidase. Brain Res. 1992;586:36–43. doi: 10.1016/0006-8993(92)91368-o. [DOI] [PubMed] [Google Scholar]
- Swadlow HA, Gusev AG. The impact of ‘bursting' thalamic impulses at a neocortical synapse. Nat Neurosci. 2001;4:402–408. doi: 10.1038/86054. [DOI] [PubMed] [Google Scholar]
- Van der Werf YD, Witter MP, Groenewegen HJ. The intralaminar and midline nuclei of the thalamus. Anatomical and functional evidence for participation in processes of arousal and awareness. Brain Res Brain Res Rev. 2002;39:107–140. doi: 10.1016/s0165-0173(02)00181-9. [DOI] [PubMed] [Google Scholar]
- Williams SR, Stuart GJ. Action potential backpropagation and somatodendritic distdribution of ion channels in thalamocortical neurons. J Neurosci. 2000;20:1307–1317. doi: 10.1523/JNEUROSCI.20-04-01307.2000. [DOI] [PMC free article] [PubMed] [Google Scholar]
- Xu ZC, Wilson CJ, Emson PC. Restoration of thalamostriatal projections in rat neostriatal grafts: an electron microscopic analysis. J Comp Neurol. 1991;303:22–34. doi: 10.1002/cne.903030104. [DOI] [PubMed] [Google Scholar]