

Abstract
Central vestibular neurons process head movement-related sensory signals over a wide dynamic range. In the isolated frog whole brain, second-order vestibular neurons were identified by monosynaptic responses after electrical stimulation of individual semicircular canal nerve branches. Neurons were classified as tonic or phasic vestibular neurons based on their different discharge patterns in response to positive current steps. With increasing frequency of sinusoidally modulated current injections, up to 100 Hz, there was a concomitant decrease in the impedance of tonic vestibular neurons. Subthreshold responses as well as spike discharge showed classical low-pass filter-like characteristics with corner frequencies ranging from 5 to 20 Hz. In contrast, the impedance of phasic vestibular neurons was relatively constant over a wider range of frequencies or showed a resonance at ∼40 Hz. Above spike threshold, single spikes of phasic neurons were synchronized with the sinusoidal stimulation between ∼20 and 50 Hz, thus showing characteristic bandpass filter-like properties. Both the subthreshold resonance and bandpass filter-like discharge pattern depend on the activation of an ID potassium conductance. External current or synaptic stimulation that produced impedance increases (i.e., depolarization in tonic or hyperpolarization in phasic neurons) had opposite and complementary effects on the responses of the two types of neurons. Thus, membrane depolarization by current steps or repetitive synaptic excitation amplified synaptic inputs in tonic vestibular neurons and reduced them in phasic neurons. These differential, opposite membrane response properties render the two neuronal types particularly suitable for either integration (tonic neurons) or signal detection (phasic neurons), respectively, and dampens variations of the resting membrane potential in the latter.
Keywords: semicircular canal, resonance, potassium, low-pass filter, bandpass filter, frequency-tuned channels
Introduction
Parallel channels that mediate sensory signals with different dynamics from the periphery through hierarchical levels of central nervous nuclei seem to be a common feature of sensory pathways as shown by the organization of the visual (Shapley, 1990; Merigan and Maunsell, 1993), auditory (Cant and Benson, 2003), or somatosensory (Johnson and Hsiao, 1992) systems. In the vestibular system, head movement-related signals cover a wide dynamic spectrum that ranges from static head deviation to extremely high acceleration profiles during fast locomotion. As in other sensory systems, signals are likely mediated by multiple frequency-tuned channels (Goldberg, 2000; Straka and Dieringer, 2004). This organization is mirrored by separate pathways for motor commands from second-order vestibular neurons (2°VNs) to extraocular and spinal motor nuclei to meet the different dynamic ranges of individual motoneuronal pools (Büttner-Ennever, 2005; Straka et al., 2005).
The presence of multiple subtypes of vertebrate 2°VNs that differ in intrinsic membrane properties is compatible with parallel vestibulo-motor signal pathways (Straka et al., 2005). In frog, 2°VNs form two distinct, non-overlapping populations of tonic and phasic neurons (Straka et al., 2004). In response to positive current steps, tonic 2°VNs fire continuously, whereas phasic 2°VNs are characterized by rapid spike discharge adaptation and a pronounced rectification. The presence of highly phasic neurons in frog vestibular pathways (Precht et al., 1971; Straka et al., 2005), in contrast to other vertebrates, might be a specific adaptation to its locomotor style. Prey capture in frogs consists of long periods of immobility with static head deviations at the lower end of the dynamic range and brief, rapid head/body movements that can reach up to 1000°/s (Roche King and Comer, 1996). For such a locomotor pattern, a self-motion detection system with particularly phasic neurons as event detectors and tonic neurons that allow stabilization of gaze and posture in the absence of body motion appears most suitable. Accordingly, frog tonic and phasic 2°VNs might function as distinct filter sets, appropriate for coding and transmission of low- and high-dynamic signal components.
Neuronal filter characteristics are primarily determined by intrinsic membrane properties. The ability of a neuron to preferentially respond in a particular frequency range is usually tested by injection of dynamic current waveforms and is expressed by the presence of a response resonance at a non-zero frequency (Moore and Buchanan, 1993; Hutcheon and Yarom, 2000; Izhikevich, 2001). Such a resonance occurs in mammalian 2°VNs and suggests that central vestibular neurons selectively respond to preferred frequencies (du Lac and Lisberger, 1995; Av-Ron and Vidal, 1999; Ris et al., 2001; Beraneck et al., 2003). Because filter properties are the result of specifically adjusted membrane conductances, the integration of synaptic events depend on particular signal features (amplitude/time course) as well as on the interaction with postsynaptic somatic/dendritic voltage-gated channels (Hausser et al., 2000). The present study uses the isolated brain of adult frogs to study the differential dynamics of the intrinsic membrane properties of phasic and tonic 2°VNs and their respective role for the signal processing of monosynaptic labyrinthine inputs.
Materials and Methods
Electrophysiology and pharmacology.
In vitro experiments were performed on the isolated brains of 42 grass frogs (Rana temporaria) and complied with Principles of Animal Care (publication 86-23, revised 1985 by the National Institute of Health). The government of Oberbayern (211-2531-31/95) granted permission for these experiments. As described previously (Straka and Dieringer, 1993), animals were deeply anesthetized with 0.1% 3-aminobenzoic acid ethyl ester (MS-222) and perfused transcardially with iced Ringer's solution (in mm: 75 NaCl, 25 NaHCO3, 2 CaCl2, 2 KCl, 0.5 MgCl2, and 11 glucose, pH 7.4). Thereafter, the skull and the bony labyrinth were opened by a ventral approach. After dissecting the three semicircular canals on each side, the brain was removed with all labyrinthine end organs attached to the VIIIth nerve. Subsequently, the brain was submerged in iced Ringer's solution, and the dura, labyrinthine end organs, and choroid plexus covering the IVth ventricle were removed. In all experiments, the cerebellum remained attached to the brainstem, whereas the forebrain was removed. Brains were used up to 4 d after their isolation and were stored overnight at 6°C in continuously oxygenated Ringer's solution (carbogen, 95% O2/5% CO2) with a pH of 7.5 ± 0.1. For the experiments, the brainstem was glued with cyano acrylate to a plastic mesh that was fixed with insect pins to the sylgard floor of a chamber (2.4 ml volume) and continuously perfused with oxygenated Ringer's solution at a rate of 1.3–2.1 ml/min. The temperature of the Ringer's solution in the chamber was electronically controlled and maintained at 14 ± 0.1°C. In some of the experiments, responses of neurons were recorded both at 14°C and after increasing the temperature within 10–15 min to 16–17°C.
The recorded neurons were identified as second-order vestibular neurons by their monosynaptic responses to electrical stimulation of vestibular nerve afferent fibers. For this purpose, all three semicircular canal nerves were stimulated separately with single constant-current pulses (0.2 ms; 1–15 μA) applied across suction electrodes (120–150 μm diameter). Pulses were produced by a stimulus isolation unit (A 360; World Precision Instruments, Sarasota, FL) at a rate of 0.5 Hz. Glass microelectrodes for extracellular and intracellular recordings were made with a horizontal puller (P-87 Brown/Flaming). Electrodes for extracellular field potential recordings were beveled (30°, 20 μm tip diameter) and filled with 2 m sodium chloride (∼1 MΩ). Electrodes for intracellular recordings were filled with 3 m potassium chloride, which gave a final resistance of ∼70–90 MΩ. Neuronal recordings were made in bridge or in discontinuous current-clamp mode (SEC-05L; NPI Electronic, Tamm, Germany).
At the beginning of each experiment, presynaptic (N0) and postsynaptic (N1) field potentials evoked by separate stimulation of the three semicircular canal nerve branches were recorded at a reference recording site in the vestibular nuclei (Straka et al., 1997). The amplitude of the N1 component served to optimize the positions of the stimulus electrodes and to determine the stimulus threshold for each stimulus site. Vestibular neurons were recorded in all vestibular subnuclei, except the most medial parts of the medial vestibular nucleus. As reported in previous studies, most of the vestibular neurons recorded in the isolated frog brain had no spontaneous discharge at their resting membrane potential, which was usually more than −58 mV (Straka et al., 2004).
The identified 2°VNs were classified as either phasic or tonic neurons based on their responses to the injection of long, positive current steps (Straka et al., 2004). The response properties in the frequency domain and the discharge dynamics of both types of 2°VNs were determined using two protocols of sinusoidally modulated current injections. The first stimulus profile consisted of a 30 or 44 s (ttotal) sinusoidally modulated current with a frequency that logarithmically increased from 0 to 100 Hz [“ZAP function”: I(t) = A sin (ω × tb), with frequency F = ω/2π and b = 3 (Hutcheon et al., 1994)]. Dynamic membrane properties were determined from averaged responses of two to four single sweeps with a peak-to-peak amplitude of 5–25 mV. With larger injected currents, action potentials were triggered on the depolarizing half cycle, and the frequency range of the discharge was determined. For both phasic and tonic 2°VNs, the firing bandwidth was defined as the minimum (Fmin) and maximum (Fmax) frequency in which spikes were triggered at a particular current intensity. In addition, the maximal frequency at which neurons still discharged more than one spike per cycle, i.e., the modulation peak frequency (Fmod) was determined for tonic 2°VNs. For phasic 2°VNs, the peak frequency was calculated as Fpeak = 100 × (((tFmin + tFmax)/2)/ttotal)2. ZAP stimuli were supplemented in some neurons by a second protocol that consisted of 5-s-long sinusoidally modulated current injections at 19 discrete frequencies between 0.4 and 100 Hz (du Lac and Lisberger, 1995; Ris et al., 2001). The current amplitude was adjusted at 0.4 Hz such that the peak-to-peak response amplitude was ∼15 mV. For the analysis of the data, the term impedance was defined as the ratio of the fast Fourier transforms of the voltage and current values. Because the evoked responses were in part nonlinear, the measured first-order ratio may not be identical to a linear impedance. Nevertheless, this is an effective way to distinguish neuronal types.
Because the responses at low frequencies gave somewhat variable results, the impedance function was not used below 1 Hz for ZAP stimuli and 0.4 Hz for single sinusoidal stimulations frequencies. The resonant behavior of the impedance was quantified and expressed as the ratio (Q) between the maximal impedance and the impedance at the lowest frequency.
Bath application of the potassium channel blocker 4-aminopyridine (4-AP) (5 μm to 1 mm) was used to investigate the putative contribution of voltage-dependent potassium conductances to the nonlinear response properties of phasic 2°VNs. Single sweeps of current stimuli and voltage responses were digitized at 4.1 kHz (CED 1401; Cambridge Electronic Design, Cambridge, UK) and analyzed off-line (SIGNAL; Cambridge Electronic Design). Synaptic potentials were digitized at 20 kHz and analyzed from averages of 20–30 single sweeps after electronic subtraction of the extracellular field potential recorded in the vicinity.
Statistical differences in parameters were estimated using the Mann–Whitney U test (unpaired parameters) and the Wilcoxon's signed rank nonparametric test (paired parameters) (Prism; GraphPad Software, San Diego, CA). All averaged results were expressed as means ± SEM unless stated otherwise. Graphical presentations were made with the aid of commercially available computer software [Origin (Microcal Software, Northampton, MA) or Corel Draw (Corel, Ottawa, Ontario, Canada)].
Immunocytochemistry.
Immunohistochemical detection of the Kv1.1 potassium channel protein was performed on frog whole brains subsequent to the recording of vestibular neurons for 4 d (n = 4) or on brains obtained from frogs freshly perfused with fixative (n = 3). In the latter case, frogs were anesthetized with MS-222 and transcardially perfused with 30 ml of an ice-cold 0.9% NaCl solution, followed by 100 ml of 4% paraformaldehyde in 0.1 m phosphate buffer. Brains from freshly perfused frogs and those from in vitro experiments were kept overnight in the fixative. After cryoprotection in 15 and 30% sucrose, coronal sections were cut at 30 μm on a cryostat and kept in 0.01 m PBS, pH 7.4. Immunohistochemical detection of Kv1.1 was performed as described by Popratiloff et al. (2003). Briefly, after rinse in 0.1% Triton in 0.01 m PBS (PBS-T), free-floating sections were treated with 50% alcohol and preincubated in 10% normal goat serum in PBS-T for 30 min. After incubation overnight at room temperature in a 1:500 dilution of the primary rabbit anti-Kv1.1 polyclonal antibody (Alomone Labs via Euromedex, Strasbourg, France) in PBS-T, antibody binding was detected with a cyanine 3-conjugated goat anti-rabbit antibody (Jackson ImmunoResearch via Interchim, Montluçon, France). Subsequently, sections were washed, air dried, and coverslipped with Vectashield (Vector Laboratories via Biovalley, Conches, France). Sections were analyzed by laser scanning confocal microscopy (LSM 510; Zeiss, Oberkochen, Germany) at a wavelength of 543 nm. Stacks of 10–20 confocal images were generated with a 20×/0.5 objective and a plan Apochromat 40×/1.3 oil immersion objective. Images for the figures were produced by horizontal projection of the entire stack. The diameters of the Kv1.1 immunopositive neurons in the dorsal hindbrain between the cerebellum and the obex were determined using Metaview software (Roper Scientific, Paris, France).
Results
Classification of second-order vestibular neurons
Intracellular recordings were obtained from a total of 220 neurons in the vestibular nuclei of the isolated frog whole brain. Based on the differences of their responses to long positive current steps with amplitudes that depolarized neurons above spike threshold, all VNs were characterized as either phasic or tonic (Straka et al., 2004). The response of the larger population of neurons (n = 167; 76%) consisted of a high-frequency burst of one to three spikes within the first 100 ms and the absence of a subsequent continuous discharge (Fig. 1A; C, black bar). In contrast, the smaller population of neurons (n = 53; 24%) fired continuously throughout the positive current step (Fig. 1B; C, gray bar). In the latter, the discharge frequency increased with the amplitude of the current step until the firing rate saturated at ∼70–80 spikes/s. The presence of, as opposed to the lack of, a persistent discharge during positive current steps unequivocally separated tonic from phasic neurons (Fig. 1C, gray and black bars) and suggests that the two distinct populations of neurons differ considerably in their intrinsic membrane properties. The ∼4:1 ratio of phasic to tonic neurons agrees with the previously reported predominance of phasic VNs in frog (Straka et al., 2004).
Figure 1.
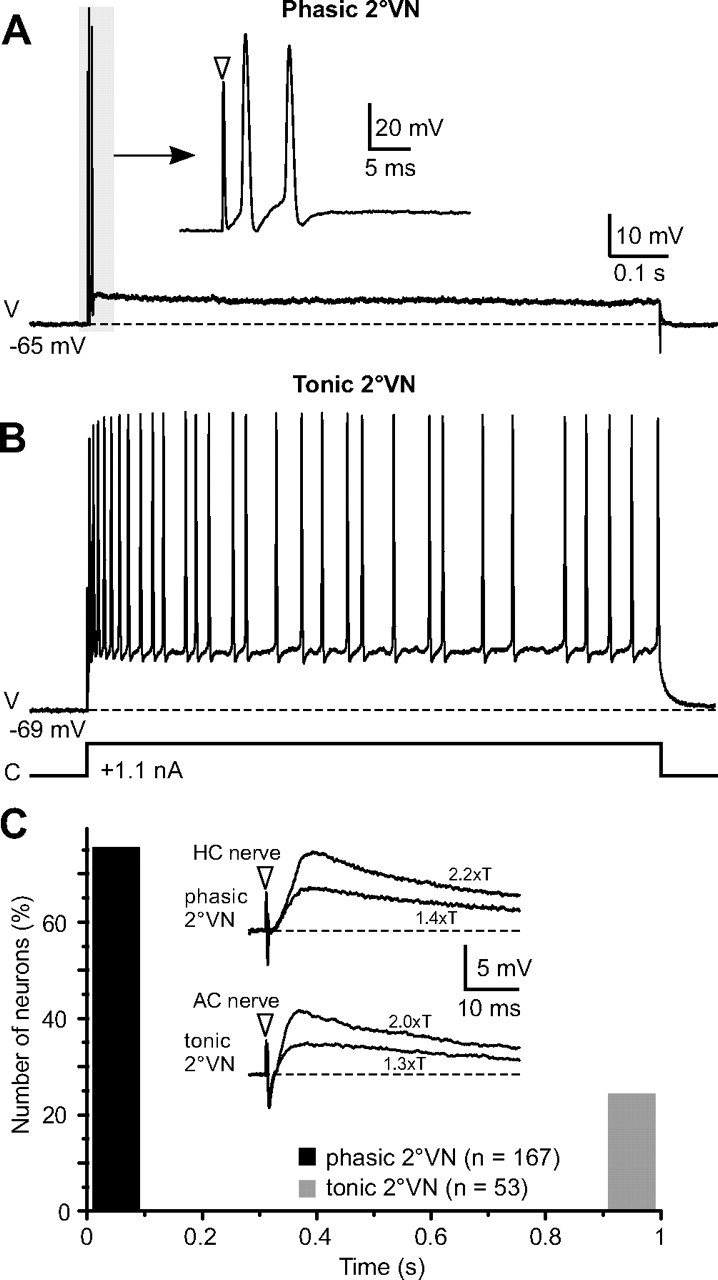
Discharge pattern of phasic and tonic 2°VNs. A, B, A short burst of two spikes (A) and a continuous discharge (B) evoked by injection of positive current steps of 1.1 nA (trace below tonic cell) differentiate between phasic and tonic 2°VNs; the inset in A shows the short initial burst (gray area) of the phasic 2°VNs at an extended timescale. C, The evoked burst discharge in all phasic 2°VNs (76%) was confined to the first 100 ms (black bar); the continuous discharge of all tonic 2°VNs (24%) began immediately after stimulus onset and lasted throughout the entire length of current step (gray bar). Insets in C show monosynaptic EPSPs evoked by stimulation of the horizontal (HC) and the anterior (AC) vertical canal nerve at two stimulus intensities, given as multiples of the N1 field potential component (xT) in the phasic and tonic 2°VNs illustrated in A and B. Horizontal dashed lines in A and B and insets in C indicate resting membrane potentials at −65 and −69 mV, respectively. Arrowheads in the insets in A and C indicate stimulus onset. Records in A and B are single sweeps and in C averages of 24 responses. The calibration in A applies also to B. V, Voltage; C, current.
All phasic and tonic VNs were identified as second-order (2°) neurons by the activation of a monosynaptic EPSP after separate electrical stimulation of the three ipsilateral semicircular canal nerves (Fig. 1C, insets). The majority of phasic and tonic 2°VNs (∼85%) received their monosynaptic afferent input from only one of the three semicircular canals. This input originated in approximately equal proportions from the horizontal, the anterior vertical, and the posterior vertical canal. In the remaining neurons (∼15%), a monosynaptic response was evoked by stimulation of two or all three ipsilateral canal nerves. No differences were encountered between phasic and tonic 2°VNs concerning the origin or amount of convergence of the inputs from a particular semicircular canal. This suggests that the two subtypes are not exclusive parts of distinct vestibular pathways that would differ in their spatial selectivity for different angular head acceleration signals. In fact, as shown previously, both types contribute to vestibulo-ocular and vestibulo-spinal reflexes and mediate semicircular canal and macular organ signals (Straka et al., 2004).
Subthreshold response dynamics of tonic and phasic second-order vestibular neurons
Tonic second-order vestibular neurons
Injection into tonic 2°VNs (n = 12) of sinusoidally modulated currents of relatively small amplitude (±0.1–0.3 nA) with a frequency that increased logarithmically up to 100 Hz (ZAP stimuli) resulted in a maximal peak-to-peak voltage modulation of ∼13 mV (Fig. 2A). Because of the rather negative resting membrane potential of these neurons (mean, −71.6 ± 3.2 mV), the small voltage modulation did not trigger a spike discharge.
Figure 2.
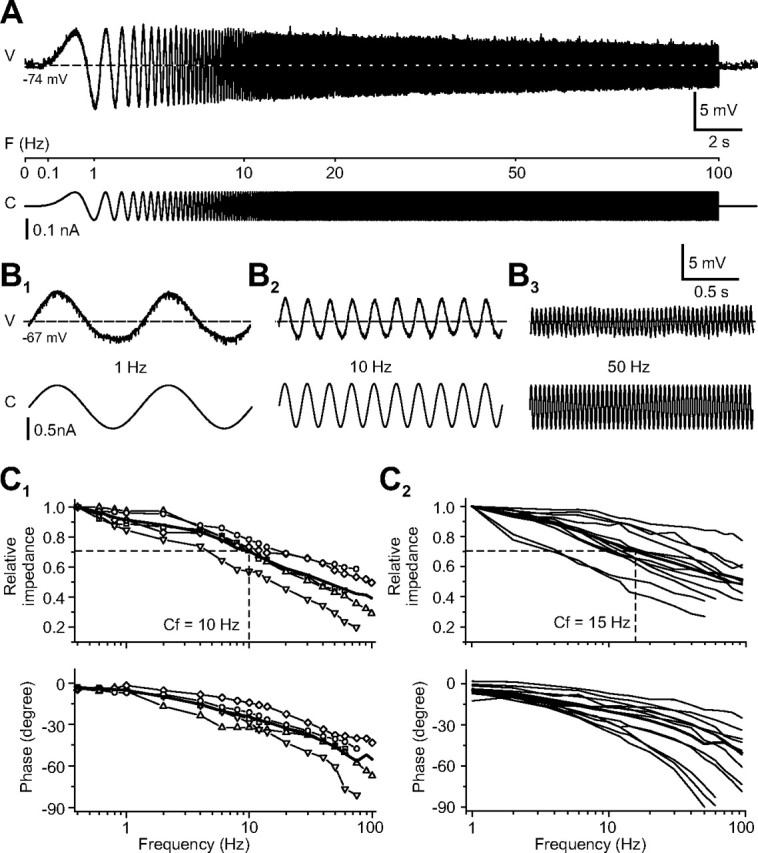
Response dynamics of tonic 2°VNs. A, Response evoked by injection of a small-amplitude, sinusoidally modulated current that increased logarithmically in frequency up to 100 Hz (ZAP). B, Responses of a tonic 2°VN to injection of multiple cycles of sinusoidally modulated currents at discrete frequencies of 1 Hz (B1), 10 Hz (B2), and 50 Hz (B3). Horizontal dashed lines indicate the resting membrane potential at −74 mV (A) and −67 mV (B1–B3). Calibration in B3 applies to B1 and B2. C, Bode plots of impedance and phase of the responses of tonic 2°VNs tested with discrete frequencies (n = 5; C1) and Bode plots obtained from tonic 2°VNs tested with ZAP stimuli (n = 12; C2). The impedance of each neuron was normalized to the value obtained at a stimulation frequency of 0.4 Hz in C1 and of 1 Hz in C2; thick lines in C1 and C2 are the average of the respective population of neurons, and the dashed lines are the corner frequency (Cf). V, Voltage; F, frequency; C, current.
The sinusoidally modulated responses in all tonic 2°VNs were maximal at the lowest frequency used for the analysis of the responses to ZAP stimuli (1 Hz) and decreased gradually with stimulus frequency (Fig. 2A). Accordingly, the calculated impedance was maximal at 1 Hz (mean, 26.9 ± 5.5 MΩ) and declined in a manner consistent with the nearly passive electronic structure for individual neurons (Fig. 2C2) to reach ∼50% of the initial value at 100 Hz (mean, 14.0 ± 3.0 MΩ). The sinusoidal responses were essentially in-phase with the stimulus at low frequencies (mean, −4.6 ± 1.9° at 1 Hz) but were considerable phase lagged at 100 Hz (mean, −50.6 ± 14.2°) (Fig. 2C2). This phase shift was variable between individual tonic 2°VNs and reached up to −90° at 100 Hz in some neurons. Given the gradual reduction in impedance and the increasing phase lag of the responses at higher stimulus frequencies, tonic 2°VNs behaved like a low-pass filter. Because in all tonic 2°VNs the impedance was maximal at the lowest modulation frequency, the Q value (see Material and Methods) was 1, thus indicating the absence of a resonance of the impedance in these 2°VNs.
To exclude the possibility that the reduction in the impedance with increasing frequency was related to the absence of a steady-state frequency in the ZAP stimuli, sequences of sinusoidally modulated currents with discrete frequencies (between 0.4 and 100 Hz) were applied (Fig. 2B). As for the ZAP stimuli, the impedance of the tested neurons (n = 5) was maximal at the lowest frequency used for stimulation and gradually decreased with increasing frequency in parallel with an increase in phase lag (Fig. 2C1) as for the ZAP stimuli (Fig. 2C2). Independent of the stimulus paradigm, the impedance profile exhibited characteristic low-pass filter-like properties with a range of the corner frequency in most neurons between 5 and 20 Hz (Fig. 2C1,C2).
Phasic second-order vestibular neurons
The dynamics of the intrinsic membrane properties was tested in 47 phasic 2°VNs using injection of sinusoidal currents up to 100 Hz in the ZAP mode or with sequences of discrete frequencies. At resting membrane potential (mean, −64.8 ± 1.2 mV; n = 47), sinusoidally modulated currents of ± 0.6 nA evoked a mean peak-to-peak voltage modulation at low stimulus frequencies of ∼16 mV that was subthreshold for spike discharge (see Figs. 3A1–A3, 4A,C). The mean impedance of phasic 2°VNs at 1 Hz was on the average 17.0 ± 1.6 MΩ, and responses were in-phase with the stimulus (mean, −0.4 ± 0.6°) (Fig. 3B). At a stimulus frequency of 100 Hz, the impedance decreased to ∼60% of the initial value (mean, 10.8 ± 1.6 MΩ), with an average phase lag of −52.5 ± 7.7° (Fig. 3B). Compared with tonic 2°VNs, the impedance of phasic 2°VNs was significantly lower (p ≤ 0.05), compatible with the larger current required for approximately the same peak-to-peak responses in the latter neurons (Straka et al., 2004).
Figure 3.

Response dynamics of phasic 2°VNs. A1–A3, Typical examples of impedance profiles of three different phasic 2°VNs calculated from responses to injection of small-amplitude ZAP currents. Based on their shape, responses were classified as nonresonant (A1), simple resonant (A2), or trough resonant (A3). Simple-resonant responses exhibit a single resonance peak (*), and trough-resonant responses exhibit a trough-like depression (black diamond) before the resonance peak (**). Horizontal dashed lines indicate resting membrane potential (−67 mV in A1; −66 mV in A2; −63 mV in A3). Calibration in A3 applies to A1 and A2. B, Bode plots comparing impedance and phase profiles of all phasic (filled circles) and tonic (filled stars) 2°VNs; phasic neurons were further separated as nonresonant (gray circles), simple resonant (gray circles), and trough resonant (gray triangles).V, Voltage; F, frequency; C, current.
Figure 4.
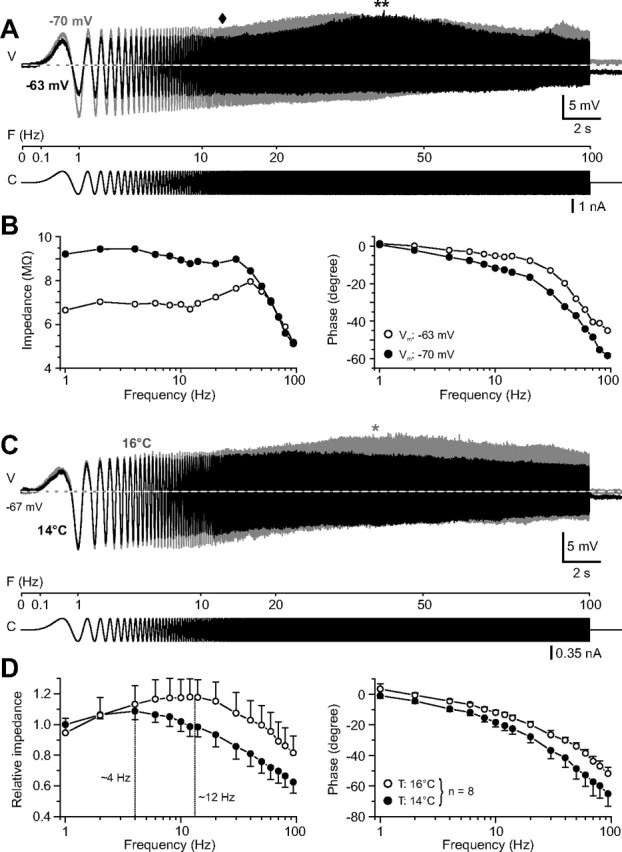
Membrane potential and temperature dependence of the impedance profile of phasic 2°VNs. A, Responses of a phasic 2°VN evoked by injection of small-amplitude ZAP currents at two membrane potentials at −63 mV (black trace) and −70 mV (gray trace). At the more depolarized membrane potential, the response exhibited a trough-like depression (black diamond) before the resonance peak (**) that is facilitated and shifted to higher frequencies compared with the resonance peak at the more hyperpolarized membrane potential. B, Bode plots of impedance and phase of the responses at the two membrane potentials (white and black circles) shown in A. C, Responses of a phasic 2°VN evoked by injection of small-amplitude, ZAP currents at two recording temperatures (14°C, black trace; 16°C, gray trace). Note the increased impedance of the response at higher stimulus frequencies and the pronounced resonance peak (*) at 16°C. D, Bode plots summarizing the impedance and phase of the responses of phasic neurons (n = 8) recorded at both 14°C (black circles) and 16°C (white circles). Vertical dashed lines indicate resonance peak frequencies. V, Voltage; F, frequency; C, current.
Most importantly, in contrast to tonic 2°VNs, the sinusoidally modulated responses of most phasic 2°VNs (36 of 47 neurons; 77%) increased in amplitude with stimulus frequency to exhibit a maximum at frequencies ranging from 2 to 60 Hz in different neurons (Fig. 3A). Because the impedance resonance at resting membrane potential varied in magnitude and frequency between different phasic 2°VNs, the impedance profile was quantified by determining the ratio between the impedance at the resonance frequency and at the lowest stimulus frequency used for the analysis (1 Hz; Q value; see Materials and Methods). Three different types of responses of phasic 2°VNs were distinguished (Fig. 3A1–A3; B, gray squares, circles, and triangles). The most common profile (n = 31) had a Q value >1, with a resonance centered at ∼4 Hz (simple-resonant response) (Fig. 3A2, *; B, gray circles). A second group of phasic 2°VNs (n = 11) had a Q value of 1, with an impedance profile comparable with those of tonic 2°VNs (nonresonant response) (Fig. 3A1; B, gray squares). Finally, five phasic 2°VNs were recorded that had Q values of ∼1 but exhibited a trough-like depression (Figs. 3A3, 4A, black diamonds) before the resonance peak (Figs. 3A3, 4A, **) (trough-resonant response). The trough usually occurred above 10 Hz, whereas the resonance peak was usually at ∼45 Hz (Figs. 3B, gray triangles, 4B). Thus, up to ∼20–30 Hz, the impedance of most phasic 2°VNs (simple- and trough-resonant neurons) decreased only slightly with stimulus frequencies, whereas the impedance of tonic 2°VNs declined gradually and continuously from the lowest frequencies (Fig. 3B).
The different response profiles of phasic 2°VNs, however, do not imply the presence of distinctly different subtypes of phasic 2°VNs but suggest that the response dynamics of the phasic cells are variable and depend on particular membrane parameters. Trough-resonant responses were observed in neurons with a more depolarized resting membrane potential (−59.0 ± 3.0 mV; n = 5; p ≤ 0.05) compared with simple-resonant (−66.4 ± 2.4 mV; n = 31) or nonresonant (−66.7 ± 1.6 mV; n = 11) responses. In a given neuron, the resonance changed in magnitude and frequency with polarization of the membrane potential. After membrane hyperpolarization, trough-resonant responses changed into simple-resonant responses, as illustrated by the responses of the phasic 2°VNs in Figure 4 (A, gray and black traces, B, black and white circles). The observed shift in the profile and the occurrence of trough-resonant responses at a more depolarized membrane potential was always accompanied by a decrease in impedance (Fig. 4B), compatible with the general observation that neurons with trough-resonant responses had a significantly lower impedance than neurons exhibiting other impedance profiles (p ≤ 0.01). Assuming thus a continuous range of impedance resonance profiles that depend on the actual membrane potential, phasic 2°VNs seem to vary between different, interchangeable response modes.
Different conductances in tonic and phasic second-order vestibular neurons
Responses evoked by sinusoidally modulated current injections of both tonic and phasic 2°VNs exhibited a marked asymmetry (Fig. 5A). This asymmetry resulted from different relative contributions of the depolarizing and the hyperpolarizing half cycles to the peak-to-peak responses and was oppositely oriented in tonic and phasic 2°VNs and particularly obvious for responses with peak-to-peak amplitudes >20–25 mV (Fig. 5A1,A2). The asymmetry was quantified by calculating the ratio of the amplitudes (>20 mV) of the depolarizing and hyperpolarizing half cycles of sinusoidally modulated responses at low stimulus frequencies (Fig. 5A1,A2, arrows). This ratio indicated that the depolarizing half waves of all tonic 2°VNs were larger than the hyperpolarizing half waves (ratio >1) (Fig. 5A1,A3). In contrast, in phasic 2°VNs, the sinusoidal responses were dominated by the considerably larger amplitude of the hyperpolarizing half cycle (ratio <1) (Fig. 5A2,A3). In some phasic 2°VNs with a resting membrane potential close to −60 mV, the asymmetry between the hyperpolarizing and depolarizing component was pronounced and resulted from a particularly small depolarizing half wave (Fig. 5B, red trace). In addition, with larger current stimulus amplitude, a distortion appeared in the falling phase of the depolarizing half wave response of these neurons (Fig. 5B, pink and black traces). This was attributable to the fact that the membrane potential started to hyperpolarize (white arrowhead and vertical dashed line) before the maximal depolarizing current is reached (vertical dotted line). This distortion likely reflects the activation of a voltage-dependent conductance with a threshold close to the resting membrane potential of this neuron. The increase in amplitude and advance of the peak depolarization with current intensity (Fig. 5B, red, pink, and black traces) is compatible with previous results on the slope threshold of phasic neurons during ramp-like current injection (Straka et al., 2004).
Figure 5.

Response asymmetry in tonic and phasic 2°VNs. A, The ratio of the depolarizing (black arrows in A1, A2)/hyperpolarizing half wave (red arrow in A1, A2) of the responses evoked by sinusoidally modulated currents is >1 for tonic and <1 for phasic 2°VNs (A3). Horizontal dashed lines in A1 and A2 indicate resting membrane potential at −64 mV (A1) and −66 mV (A2); arrows and numbers in A3 indicate mean ± SD of the ratios for tonic and phasic 2°VNs. Calibration in A2 applies to A1. B, Response of a phasic 2°VN evoked by ZAP currents. The response shows a marked asymmetry and a particular distortion in the falling phase of the depolarizing half wave at higher stimulus intensities (pink and black traces; see inset for extended timescale); the response peak (white arrowhead and vertical dashed line) occurs before the maximal depolarizing current is reached (vertical dotted line), and the membrane potential starts to hyperpolarize. C, D, Overlay of responses evoked by injection of ZAP currents at resting membrane potential (red traces) and during constant depolarization (black traces) of a tonic (C) and a phasic 2°VN (D). The impedance during depolarization of the membrane potential (Vm) increases in tonic but decreases in phasic 2°VNs at low- and mid-range frequencies (black triangles in C2, D2). Dashed lines in C1 and D1 indicate membrane potential before the onset of the stimulus. V, Voltage; F, frequency; C, current.
The differential sinusoidal responses of the two types of 2°VNs suggest that the impedance in tonic 2°VNs increases with depolarization, whereas the impedance in phasic 2°VNs increases with hyperpolarization. Such an antagonistic behavior was in fact observed in neurons in which the membrane potential was changed by constant-current injections (Fig. 5C,D). The impedance of tonic 2°VNs increased by 50–100% with membrane depolarizations of ∼10 mV at low stimulus frequencies of up to 10 Hz (Fig. 5C1,C2). This increase was particularly obvious during the depolarizing half cycles (Fig. 5C1, compare red and black traces) and complies with the dominance of this half cycle in the responses of tonic 2°VNs (Fig. 5A1,C). This suggests an activation of non-inactivating calcium or sodium inward currents that would allow boosting excitatory responses in these neurons. In contrast, the impedance of phasic 2°VNs decreased by ∼50% during a depolarization of similar magnitude for stimulus frequencies of up to 40 Hz (Fig. 5D1,D2). The decreased impedance, however, reduced the hyperpolarizing half cycle to a larger extent than the depolarizing half cycle (Fig. 5D1, compare red and black traces). Given the pronounced decrease in impedance during depolarization, the intrinsic membrane properties of phasic 2°VNs appear to be dominated by voltage-gated potassium conductances that are activated during depolarization of the neuron. Moreover, the kinetics of the latter conductance might be essential for the particularly fast termination of the discharge during injection of step-like currents.
Discharge dynamics of phasic and tonic second-order vestibular neurons
Using large-amplitude sinusoidal currents, spike discharge was evoked in both tonic and phasic 2°VNs. Because none of the recorded 2°VNs were spontaneously active at resting membrane potential (see discussion by Straka et al., 2004), there was no modulation of a tonic activity but rather a correlation of the discharge with the depolarizing half cycles of the sinusoidal responses. In accordance with the differences in subthreshold responses, the discharge dynamics of the two types of neurons differed as well.
Tonic second-order vestibular neurons
Injection of large sinusoidally modulated currents in tonic 2°VNs at resting membrane potential (n = 10) evoked voltage modulations with peak-to-peak amplitudes of ∼35 mV and superimposed action potentials on the depolarizing half cycle (Fig. 6A,B). At low stimulus frequencies, the discharge consisted of multiple spikes per depolarizing half cycle (Fig. 6B1) that decreased in number with increasingly shorter cycle length up to 6 Hz (Fmod; mean, 5.7 ± 0.6 Hz; n = 10). Thus, the spike discharge between the lowest stimulus frequency (Fmin of 1 Hz) and Fmod was modulated in firing rate in relation to the underlying membrane potential. Above Fmod, only single spikes were triggered that were synchronized with the depolarizing half cycle (Fig. 6B2,C1). The regular and reliable firing with each depolarizing half cycle stopped at ∼20 Hz (Fmax; mean, 22.3 ± 3.5 Hz) (Fig. 6B3). Above Fmax, few single spikes were elicited on some depolarizing half cycles, but increasingly more cycles were skipped (Fig. 6C2).
Figure 6.

Discharge dynamics of tonic 2°VNs. A, Example of the discharge evoked by injection of large-amplitude ZAP currents. B, Responses of a tonic 2°VN to injection of sinusoidally modulated currents at discrete frequencies of 1 Hz (B1), 4 Hz (B2), and 60 Hz (B3). C, Transition from multiple to single spike discharge (8.7 Hz in C1) and upper limit of single spike synchronization (16.9 Hz in C2) of the neuron shown in A (see arrows in A). Responses in A–C are single sweeps, and horizontal dashed lines indicate resting membrane potential at −72 mV (A, C) and −82 mV (B). Calibration in B3 applies to B1 and B2. D, Distribution of the upper limits of multiple spike modulation (black squares and solid line; Fmod) and of single spike synchronization (white circles and dashed line; Fmax) among the tested tonic 2°VNs (n = 10). Note that <50% of the tonic 2°VNs fire multiple spikes above ∼6 Hz (dashed vertical line) and single spikes above ∼20 Hz (dotted vertical line) on each depolarizing half cycle. V, Voltage; F, frequency; C, current.
The discharge pattern was qualitatively similar in all tonic 2°VNs, suggesting a homogeneous population of neurons. However, Fmod and Fmax differed between individual neurons and were sigmoidally distributed across the population (Fig. 6D). According to this distribution, <50% of the neurons discharged multiple spikes above 6 Hz (Fig. 6D, dashed vertical line, Fmod) and fired a single spike at each depolarizing half cycle above ∼20 Hz (Fig. 6D, dotted vertical line, Fmax). Inspection indicated, however, that the two limits (Fmod, Fmax) not only depended on the amplitude of the current stimulus but also on the actual resting membrane potential. Therefore, in neurons with a more negative resting membrane potential (e.g., −82 mV in the neuron shown in Fig. 6B), both limits were lower compared with neurons with a less negative resting membrane potential (e.g., −72 mV in the neuron shown in Fig. 6A,C). The restriction of discharge modulation and synchronization to lower stimulus frequencies is compatible with the observed low-pass filter-like properties of the subthreshold responses. However, the upper limit of the evoked discharge is not fixed but depends on the membrane potential. In fact, it can be shifted to considerably higher values with increasing membrane depolarization. At membrane potentials close to spike threshold, tonic 2°VNs reliably fire action potentials that are synchronized with each depolarizing half cycle at stimulus frequencies up to ∼70 Hz (data not shown) as long as the amplitude of the underlying depolarization reaches spike threshold.
This differential behavior indicates that the filter properties of tonic 2°VNs can be modified by alterations of the membrane potential. Thus, tonic 2°VNs behave like low-pass filters with low cutoff frequencies at particularly negative membrane potentials. With increasing depolarization, e.g., as a result of augmented excitatory inputs or higher temperatures (see below), the cutoff frequency is shifted to higher values, thereby extending the frequency bandwidth for signal transmission. This suggests that, at the more depolarized membrane potentials, the response properties of tonic 2°VNs would be adjusted to the dynamics of the synaptic inputs from labyrinthine nerve afferents that code static head deviation in vivo (see Discussion).
Phasic second-order vestibular neurons
Injection at resting membrane potential of large sinusoidally modulated currents in 29 phasic 2°VNs triggered action potentials at stimulus frequencies above ∼10 Hz (Fig. 7A1,A2,B2,C,D). At stimulus frequencies below ∼10 Hz, no spike discharge was evoked (Fig. 7B1,D), even with stimulus intensities that exceeded approximately twice the spike threshold at higher frequencies. Analysis indicated that, for peak-to-peak voltage amplitudes of ∼30 mV, the minimum frequency required to trigger action potentials was on the average 19.3 ± 1.6 Hz (n = 29). Above this lower limit, the discharge consisted of single action potentials that were synchronized with the peaks of each depolarizing half cycle (Fig. 7B2,C). This particular firing mode continued with increasing frequency until a sudden cutoff was reached at 40–60 Hz (mean, 47.9 ± 2.7 Hz; n = 29). This upper limit depended on the amount of injected current, was shifted to higher frequencies with larger current intensity (Fig. 7, compare A1, A2), and was variable between individual phasic 2°VNs. In some neurons, the discharge was maintained up to 70 Hz. As for tonic 2°VNs, the upper firing limit seemed to be correlated with the decrease in impedance at higher stimulus frequencies as indicated by the reduction in the peak-to-peak response amplitude (Fig. 7B3).
Figure 7.

Discharge dynamics of phasic 2°VNs. A, Discharge evoked by injection of ZAP currents. With increasing current intensity (A1–A3), responses increased in amplitude and triggered spikes (A1, A2) at a stimulus frequency of ∼20 Hz. B, Responses of a phasic 2°VN to injection of multiple cycles of sinusoidally modulated currents at constant frequencies of 4 Hz (B1), 30 Hz (B2), and 60 Hz (B3). C, Responses of a phasic 2°VN evoked by injection of sinusoidally modulated currents below (gray) and above (black) spike threshold; spikes occurred at the resonance peak of the subthreshold response (gray trace). The inset in C shows superimposed subthreshold responses (gray) and the four spikes (black, amplitude truncated) riding on top of the depolarizing half cycles at the resonance peak (37 Hz) at an extended timescale. Responses in A–C are single sweeps, and horizontal dashed lines indicate resting membrane potential at −78 mV (A), −70 mV (B), and −67 mV (C). Calibration in A1 and B3 applies to A2, A3 and B1, B2, respectively. D, Frequency dependence of single (white circles) and multiple (white squares) spike modulation in tonic (n = 10) and phasic (filled triangles; n = 29) 2°VNs. The frequency dependence of the discharge probability for multiple spike discharge (white squares) in tonic 2°VNs was calculated by determining the proportion of neurons that fired two or more spikes per sine wave, respectively, at each one of the 16 tested frequencies between 1 and 100 Hz. Accordingly, the discharge probability for single spike synchronization in tonic (white circles) and phasic (filled triangles) 2°VNs was calculated as the proportion of neurons at each particular frequency point that fired one spike per sine wave. V, Voltage; F, frequency; C, current.
In contrast to the upper firing limit, the lower limit of phasic 2°VNs was generally more homogeneous. The absence of a spike discharge below ∼10 Hz is likely to be related to the fact that the generation of action potentials in phasic 2°VNs not only depends on a particular membrane potential threshold but also on the rate of change of the membrane potential to reach this threshold (∼1.4 mV/ms) (Straka et al., 2004). This particular rate threshold is usually not reached with sinusoidally modulated currents <10 Hz and peak-to-peak sine-wave response amplitudes of ∼30 mV, thus corroborating the absence of spike discharge at low frequencies in these neurons.
Comparison of the discharge parameters with the subthreshold sinusoidal response parameters indicated that the variability of the lower and upper limits of the evoked discharge in phasic 2°VNs was related to nonresonant, simple-resonant, and trough-resonant impedance profiles of these neurons. Phasic 2°VNs with nonresonant or simple-resonant impedance profiles started to fire action potentials at significantly lower frequencies (17.5 ± 1.4 Hz; n = 42) compared with phasic 2°VNs with a trough-resonant impedance profile (29.9 ± 4.8 Hz; n = 5; p ≤ 0.05). In the latter neurons, the midpoint of the firing bandwidth (mean, 43.7 ± 3.5 Hz; n = 5) and the extended upper limit of the firing range (mean, 60.4 ± 3.4) coincides very well with the resonance peak frequency of the subthreshold responses (∼45 Hz) and the impedance profile at high frequencies (Figs. 3B, 4B). The similarities in the discharge parameters of nonresonant and simple-resonant phasic 2°VNs furthermore support the idea of a continuum of neurons with overlapping and adaptable membrane and discharge properties.
The particular firing behavior and subthreshold responses of phasic 2°VNs can be described as bandpass filters, with peaks centered at 20–40 Hz (Fig. 7D, black triangles) and a bandwidth for firing that ranges from 15 to 100 Hz. This contrasts with the low-pass filter properties of tonic 2°VNs in which spike discharge modulation (Fig. 7D, white squares) and synchronized activity (Fig. 7D, white circles) is restricted to the lower and middle range frequency domains.
Temperature dependence of subthreshold responses and discharge range
A direct comparison of the resulting functional aspects of the in vitro experiments with data obtained in vivo in intact animals is usually aggravated by the temperature difference between both experimental conditions. To facilitate a functional interpretation of the dynamics of frog 2°VNs, the frequency range of responses was determined at different recording temperatures. After a temperature increase of the Ringer's solution in the recording chamber from 14 to 16°C, the impedance of a given phasic 2°VN increased at higher stimulus frequencies (Fig. 4C) and the resonance peak shifted by ∼8 Hz from 4.0 ± 2.3 to 12.2 ± 2.5 Hz (p ≤ 0.01; n = 8) (Fig. 4D). Because the membrane potential did not change during the 2°C increase, this shift in the resonance profile must be attributable to the elevated temperature. An even larger temperature increase consistently caused a depolarization of the membrane potential and thus any change of the impedance resonance profile at higher recording temperatures is attributable to a combined effect of both depolarization (Fig. 4A,B) and increased temperature (Fig. 4C,D). The observed impedance increase and the shift of the subthreshold response profiles of phasic 2°VNs at 16°C was paralleled at larger injected sine-wave currents by an extension of the discharge range by 15–20 Hz (n = 5; data not shown) toward higher frequencies. In tonic 2°VNs (n = 2), a qualitatively similar change, although much less pronounced than in phasic 2°VNs, was observed during a temperature increase from 14 to 16°C. At larger sinusoidal currents that triggered spike discharge, the upper firing limit in the tonic 2°VNs increased by ∼10 Hz during the 2°C temperature increase. Taking both the effect of membrane depolarization and higher temperatures on membrane properties into account, a considerably higher impedance peak resonance and upper firing limit of frog vestibular neurons can be assumed in in vivo experiments, usually performed at a room temperature of ∼22°C (Precht et al., 1974; Rossi and Martini, 1986).
Effect of 4-aminopyridine on the responses of phasic second-order vestibular neurons
The bandpass filter-like properties of phasic 2°VNs require specific conductances that differ from those of tonic 2°VNs. The particularly phasic response to current steps, the marked impedance resonance and its voltage dependence, and the distorted depolarizing half cycle of some phasic 2°VNs (Fig. 5B) are likely related to the activation of a voltage-dependent potassium conductance. Bath application of 4-AP at a concentration of 5 μm to 1 mm (n = 18) was used to test the presence of inactivating potassium conductances. At high concentrations of 4-AP (>100 μm), which also blocks IA potassium channels, all recorded 2°VNs became spontaneously active with broad spikes. At low concentrations of 4-AP (5–10 μm; n = 10), known to specifically block the ID potassium channel (Storm, 1988; McCormick, 1991; Wu et al., 2001), neurons remained silent but the amplitude of the responses evoked by injection of sinusoidally modulated currents increased (Fig. 8A1,A2). In particular, the amplitude of the depolarizing half cycle was enhanced by 4-AP, whereas the hyperpolarizing component remained unchanged. Because of this selective increase of the depolarizing half cycle, the asymmetric responses of phasic 2°VNs (ratio, 0.60 ± 0.29) (Fig. 5A) became more symmetrical after application of 4-AP (ratio, 0.88 ± 0.19; n = 7; p ≤ 0.01). Comparison of the profiles indicated that the increase in impedance by ∼50–60% after application of 4-AP (Fig. 8A2,A3) mostly occurred for frequencies below 40 Hz. Because of the impedance increase, the typical resonance disappeared almost completely and the impedance profile became more similar to the low-pass filter-like impedance profile of tonic 2°VNs (Fig. 8A3). The distortion of the sine-wave response observed in some phasic 2°VNs with a resting membrane potential close to −60 mV (Fig. 8B, black trace) was also eliminated by the application of 10 μm 4-AP to reveal an undistorted depolarizing half cycle (Fig. 8B, red trace). This effect of 4-AP corroborates the notion that the initial distortion of the response observed at particular low membrane potentials in phasic 2°VNs is in fact attributable to the activation of a voltage-dependent ID conductance before the peak of the depolarizing half cycle is reached.
Figure 8.

Effect of 4-AP on impedance and resonance of phasic 2°VNs. A, Overlay of responses evoked by injection of ZAP currents (A1) before (control, black) and after (red) application of 10 μm 4-AP. Bode plots illustrate the impedance increase of the phasic 2°VN shown in A1 (A2) and of the population of all tested phasic 2°VNs (A3); in A3, the relative impedance is the average of the values normalized to the impedance at 1 Hz of each neuron before drug application. B, Sinusoidally modulated responses of a phasic 2°VN before (control, black) and after (red) application of 10 μm 4-AP; the distortion in the falling phase of the depolarizing half wave (*) was abolished by 4-AP. C, Spike discharge of the 2°VN shown in A evoked by sinusoidally modulated current injection before (control, black *) and after (red *) application of 10 μm 4-AP; the control range of spike discharge (black arrow) is mainly extended toward lower frequencies (red arrow) by 4-AP. Horizontal dashed lines indicate resting membrane potentials at −65 mV (A1, C) and −63 mV (B). D, Transverse section through the vestibular nuclei at the level indicated in the top left corner of D1 treated with an antibody for the Kv1.1 potassium channel. Immunopositive neurons are located in the dorsal (auditory) nucleus (DN), the descending (DVN) and lateral (LVN) vestibular nuclei, but not the medial vestibular nucleus (MVN); higher magnification of labeled neurons in the lateral vestibular nucleus of this section (D2) and in the descending vestibular nucleus of the adjacent rostral section (D3). Outlines of vestibular nuclei are based on Kuruvilla et al. (1985). Scale bars: D1, 100 μm; D2, D3, 20 μm. Arrow in D1 indicates the sulcus limitans. V, Voltage; F, frequency; C, current.
At higher intensities of the sinusoidally modulated current, a limited number of action potentials were evoked on the depolarizing half cycle at a frequency centered around the subthreshold resonance (Fig. 8C, black *). Bath application of 10 μm 4-AP not only increased the subthreshold sinusoidal responses (Fig. 8C, red trace) but also extended the firing range for action potentials, mainly toward lower frequencies (Fig. 8C, red *). However, spikes were never encountered within the first 15–20 cycles after application of 10 μm 4-AP.
The activation of the ID conductance in phasic 2°VNs, in conjunction with one or more other potassium conductances, explains the absence of pacemaker activity in these neurons (Straka et al., 2005). This is primarily attributable to the fact that the potassium conductances shunt any slow inward current that could generate the depolarization necessary to reach spike threshold and cause a repetitive discharge in the absence of synaptic inputs. This also suggests that the low spontaneous activity of frog 2°VNs in vivo (Dieringer and Precht, 1979) is caused by the presynaptic activity of labyrinthine nerve afferent fibers. Consequently, the absence of afferent activity in the isolated frog whole brain attributable to the disconnection from the end organs would explain the absence of a resting discharge in 2°VNs in vitro.
The structural correlate of the ID conductance is the Kv1 potassium channel (Harvey, 1997). In particular, the Kv1.1 potassium channel has been shown to be present in the embryonic chicken tangential vestibular neurons that also have an ID conductance and a pronounced firing accommodation (Gamkrelidze et al., 1998; Popratiloff et al., 2003). Kv1.1 immunohistochemistry on isolated frog whole brains and on perfused and freshly fixed brains was used to study the presence of this potassium channel protein in neurons of the dorsal hindbrain (Fig. 8D). Kv1.1 immunolabeled neurons were encountered along the whole rostrocaudal extent of the vestibular nuclei with predominance in the lateral and descending vestibular nuclei (Fig. 8D1). Fewer neurons were encountered in the superior vestibular nucleus and the dorsal (acoustic) nucleus, whereas in the medial vestibular nucleus, Kv1.1 immunolabeled neurons were sparse (Fig. 8D1). The large number of Kv1.1 immunopositive neurons in vestibular nuclei known to give rise to descending spinal projections corroborates previous findings that relatively more phasic 2°VNs were antidromically activated from the spinal cord than from the oculomotor nuclei (Straka et al., 2004).
At the cellular level, the Kv1.1 immunolabeling varied in intensity between different neurons and consisted of a more or less complete staining of the cell body that only spared the cell nucleus (Fig. 8D2,D3). The majority of the labeled neurons were oval shaped, medium to large sized, with an average diameter of 21.7 ± 4.0 μm (long axis, 26.8 ± 6.5 μm; short axis, 16.6 ± 3.3 μm; n = 45). Comparison with unlabeled neurons in the same area (average diameter, 17.9 ± 6.2 μm; n = 56) indicated that Kv1.1 immunolabeled neurons were significantly larger (p ≤ 0.001), compatible with the lower input resistance of phasic 2°VNs (Straka et al., 2004). The apparent size difference between Kv1.1-positive and -negative neurons might in part explain the larger numbers of recorded phasic versus tonic 2°VNs. The possible relationship between the Kv1.1 labeling intensity of the neuron and the strength of its discharge adaptation during positive currents steps will be explored in future studies.
Differential synaptic processing of vestibular nerve afferent inputs in phasic and tonic 2°VNs
Experiments on the isolated frog whole brain allows for synaptic activation of 2°VN by selective electrical stimulation of individual vestibular nerve branches. It is therefore possible to investigate the consequences of the different membrane properties of tonic and phasic 2°VN on synaptic signal processing of labyrinthine inputs. Activation of synaptic inputs at different membrane potentials indicated that the voltage-dependent opposite impedance changes of tonic and phasic 2°VNs not only affect external current responses but also determine the processing of afferent synaptic inputs. In fact, monosynaptic EPSP amplitude subthreshold to spike discharge change with depolarization and hyperpolarization by 6–10 mV of tonic and phasic 2°VNs at membrane potentials between spike threshold and approximately −68 mV (Fig. 9). In tonic 2°VNs, monosynaptic EPSPs were larger in amplitude during depolarizing and smaller during hyperpolarizing current steps when compared with EPSPs at resting membrane potential (Fig. 9A1,A2, 1–3). The increase in EPSP amplitude, however, was not only obtained by changing the membrane potential by injection of positive current steps (Fig. 9A1) but also during membrane depolarization attributable to preceding EPSPs (Fig. 9A3, dashed lines). Thus, monosynaptic EPSPs evoked by a train of single electrical pulses to an individual semicircular canal nerve increased in amplitude with each stimulus (Fig. 9A3,A4, 1–3) until spike threshold was reached (data not shown). Thus, independent of how membrane depolarization was achieved, EPSPs in tonic 2°VNs were more and more enlarged with increasing membrane depolarization (Fig. 9C1, white circles, C2, white squares). This is compatible with the fact that, during current steps, the input resistance of tonic 2°VNs increased with depolarization and decreased with hyperpolarization (Fig. 9C3, white triangles).
Figure 9.

Differential synaptic processing of semicircular canal nerve afferent inputs in phasic and tonic 2°VNs. A, B, Monosynaptic EPSPs in a tonic (A) and a phasic (B) 2°VN evoked by electrical pulse stimulation of the anterior vertical canal (AC) nerve (white arrowheads). Different membrane potentials were obtained by current injection (A1, A2, B1, B2), or by preceding EPSPs in a stimulus train (A3, A4, B3, B4). A1, B1, EPSPs in a tonic (A1) and a phasic (B1) 2°VN during depolarizing (3) and hyperpolarizing (1) current steps (current traces plotted below) and in the absence of membrane polarization (2). A3, B3, Sequence of three EPSPs (1–3) in the same tonic (A3) and phasic (B3) 2°VNs evoked by a pulse train to the anterior vertical canal nerve at 50 Hz; EPSPs (1–3) start from successively more depolarized membrane potentials (dashed lines). Higher-magnification overlays (A2, A4, B2, B4) illustrate the increase of EPSP amplitudes in tonic (A2, A4) and the decrease of EPSP amplitudes in phasic 2°VNs (B2, B4) with depolarization. Horizontal dashed lines indicate membrane potentials at rest (−67 mV in A; −65 mV in B) and during polarization. C, Correlation between EPSP amplitude and membrane potential altered by depolarizing and hyperpolarizing current steps (C1), respectively, or by preceding EPSPs (C2) in tonic (white circles and squares with dashed lines) and phasic (black circles and squares with solid lines) 2°VNs; the slope of the linear regressions in C1 and C2 is significantly different from zero in all cases (p ≤ 0.001, except for white squares in C2, for which p ≤ 0.05). In C3, the inverse correlation between EPSP amplitude and membrane polarization (white and black circles from C1; white and black squares from C2) in tonic and phasic 2°VNs is corroborated by respective changes in input resistance during depolarization and hyperpolarizing current steps (white and black triangles). Values in C3 were obtained by normalization using control values at resting membrane potential (dashed lines). V, Voltage; C, current.
In contrast, phasic 2°VNs exhibited an opposite behavior. The amplitudes of monosynaptic EPSPs became smaller during depolarizing and larger during hyperpolarizing current steps when compared with EPSPs at resting membrane potential (Fig. 9B1,B2, 1–3). The decrease of EPSP amplitudes with membrane depolarization was not only observed during positive current steps (Fig. 9B1) but also during membrane depolarization attributable to preceding EPSPs (Fig. 9B3, dashed lines). Accordingly, the monosynaptic EPSPs evoked by a train of single electrical pulses to an individual semicircular canal nerve decreased in amplitude with each stimulus (Fig. 9B3,B4, 1–3). This change in EPSP amplitude (Fig. 9C1, black circles, C2, black squares) fits well with the fact that, during current steps, the input resistance of phasic 2°VNs decreased with depolarization and increased with hyperpolarization (Fig. 9C3, black triangles). Based on this differential change of amplitudes, the EPSPs in phasic and tonic 2°VNs exhibit opposite behaviors during membrane polarization regardless of how the membrane potential was altered (Fig. 9C1,C2). Boosting EPSP amplitudes by depolarization in tonic 2°VNs comprises an efficient mechanism for amplification and integration of synaptic inputs. In contrast, the decrease of EPSP amplitudes in phasic 2°VNs likely attributable to the activation of a gKD restores the membrane potential and thus enables efficient event detection.
Discussion
The intrinsic membrane properties of frog tonic and phasic 2°VNs show low-pass and bandpass filter-like characteristics, respectively. In addition, the low-frequency impedance increases during depolarization in the former and decreases in the latter, which enhances the ability of tonic neurons to integrate synaptic inputs, whereas the resonance properties of phasic neurons are well suited for synchronization and event detection. The bandpass filter-like properties of the latter neurons depend on the activation of an ID conductance, which is consistent with the presence of the Kv1.1 channel protein in vestibular neurons. The existence of two discrete sets of vestibular neurons for processing different frequency ranges of sensory inputs suggests that vestibulo-motor pathways are organized into frequency-tuned channels.
Membrane conductances underlying the different dynamic working range of frog 2°VNs
The response dynamics of tonic and phasic 2°VNs results from the activation of different sets of conductances. The characteristic increase in impedance during depolarization of tonic 2°VNs suggests the activation of a steady-state negative conductance, which would cause larger responses at more depolarized membrane potentials. Functionally, this would allow tonic 2°VNs to boost synaptic inputs in the membrane potential range of ∼10 mV below spike threshold, consistent with non-inactivating calcium or sodium inward currents (Crill, 1996). The activation of a steady-state negative conductance could promote synaptic integration (Major and Tank, 2004), as well as amplification of inhibitory and excitatory inputs (Vervaeke et al., 2006). This latter effect is compatible with the response properties of tonic 2°VNs (Straka et al., 2004) and would render these neurons especially suitable for the processing of tonic presynaptic inputs having slow dynamics.
The sensitivity of both the subthreshold resonance as well as the corresponding discharge of phasic 2°VNs to very low concentrations of 4-AP suggests the activation of a voltage-dependent ID-type potassium conductance (Wu et al., 2001), with properties similar to those of principal tangential vestibular neurons in chicken embryos (Gamkrelidze et al., 1998, 2000). The absence of spikes in phasic 2°VNs at stimulus frequencies below 10 Hz, even in the presence of 4-AP, suggests that other potassium conductances are likely involved in determining the particular bandpass filter properties of the phasic 2°VNs. An IA, or more likely a delayed rectifier, could be activated in addition to the ID conductance to account for the pronounced spike discharge adaptation and the impedance decrease during depolarization of these neurons. The dominance of potassium conductances for shaping the filter properties of frog phasic 2°VNs is compatible with the widespread occurrence of these conductances as a mechanism for specific frequency tuning of neuronal discharge (Peusner et al., 1998; Hutcheon and Yarom, 2000).
Intrinsic membrane properties as basis for filter properties of phasic and tonic neurons
Neuronal types with complementary frequency bandwidths as frog tonic and phasic 2°VNs (Fig. 10A) seem to be a widespread phenomenon in the nervous system [e.g., entorhinal cortex (Haas and White, 2002; Erchova et al., 2004), auditory cortex (Schwarz et al., 1998), and retinal ganglion cells (Tabata and Kano, 2002)]. Any difference in resonance and frequency response behavior of phasic and tonic neurons is likely related to the processing of presynaptic signals with different dynamics. It is thus not specific to any particular aspects of vestibular information processing but can be generalized to all vertebrate neurons with similar membrane properties and firing patterns as observed in phasic and tonic 2°VNs.
Figure 10.
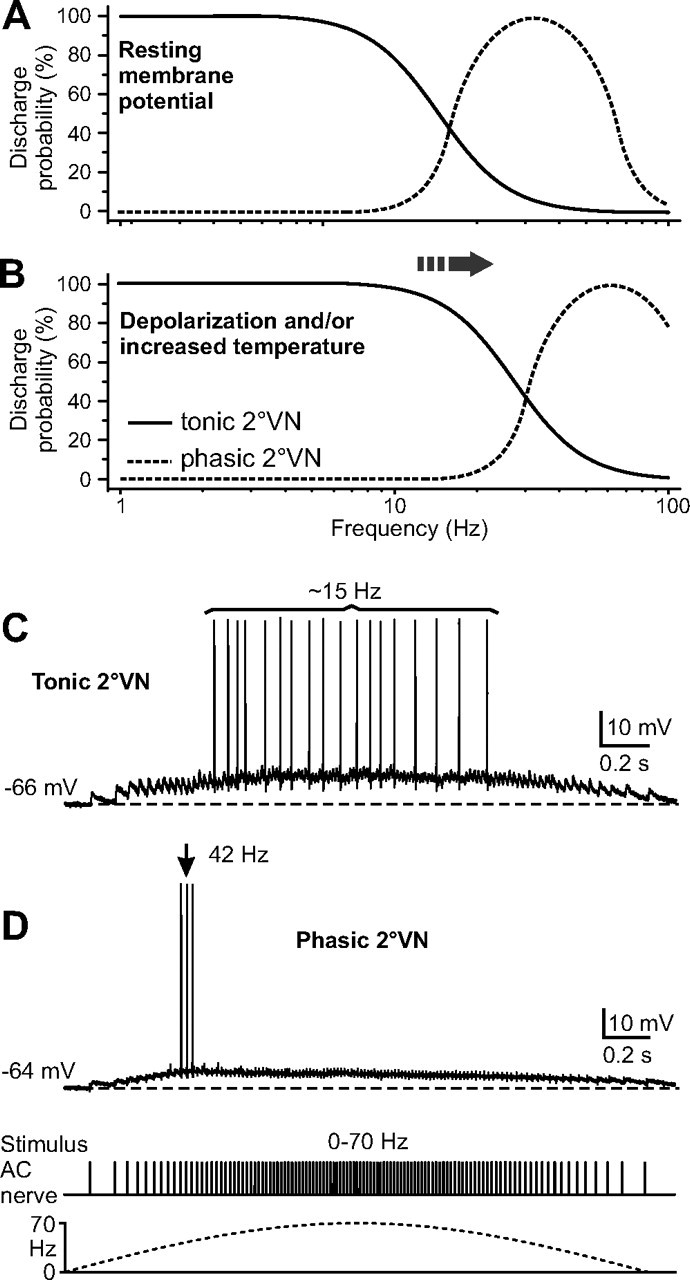
Filter properties of tonic and phasic 2°VNs affect their synaptic response dynamics. A, B, Schematic filter characteristics of tonic and phasic 2°VN discharge at resting membrane potential (A) shift to higher frequencies (arrow) during depolarization and/or increased temperature (B). C, D, Typical responses of a tonic (C) and a phasic (D) 2°VN to stimulation of the anterior vertical canal (AC) nerve with a train of electrical pulses that were sinusoidally modulated in frequency between 0 and 70 Hz (bottom trace). The discharge in the tonic 2°VN essentially mirrors the subthreshold compound response and has a relatively low rate (∼15 Hz); the discharge in the phasic 2°VN consists of three spikes at the response peak at a rate (∼40 Hz) that matches the resonance bandwidth of these neurons.
Neurons with a subthreshold resonance form filters with characteristic frequency bandwidths that preferentially allow presynaptic inputs to trigger a discharge when they are close to the resonant frequency (Hutcheon and Yarom, 2000; Izhikevich et al., 2003). This suggests that the different filter properties of the two types of frog 2°VNs might be adjusted to the activity spectrum of the different types of labyrinthine nerve afferent fibers (Goldberg, 2000). Accordingly, the filter characteristics of phasic 2°VNs should be adjusted to the discharge pattern of phasic, thick-diameter afferent fibers during head movements to detect high-dynamic response components (Goldberg, 2000). In contrast, the filter properties of tonic 2°VNs should be adapted to the regular discharge of the tonic, thin-diameter fibers that transmit sensory signal components related to static head deviation (Goldberg, 2000).
Assuming that the filter properties of tonic and phasic 2°VNs are in fact adapted to the input from labyrinthine nerves, how is this implemented on a single-cell level? Stimulation of semicircular canal nerves with sinusoidally modulated pulse trains showed that the time course of the synaptically evoked response and the discharge pattern of action potentials differ between tonic and phasic 2°VNs (Fig. 10C,D). The evoked discharge in tonic 2°VNs is primarily linear, mirrors the waveform of the underlying depolarization of the membrane potential, and follows stimulus frequencies of up to 15 Hz (Fig. 10C). This result clearly demonstrates that the dynamics of the synaptically evoked response coincides with the filter properties of these neurons revealed by intracellular current injection (Fig. 10A). Moreover, the synaptic response of phasic 2°VNs is nonlinear, with only few spikes around the advanced subthreshold response peak in which individual stimuli have a frequency of 40–50 Hz (Fig. 10D), again consistent with their resonance bandwidth. The differential responses of the two types of 2°VNs indicate that the intrinsic filter properties determine a specific frequency range at which synaptic inputs preferentially evoke spikes.
The preferred frequency ranges of tonic and phasic 2°VNs in our study, however, is lower than the frequency bandwidth of signals in semicircular canal afferent fibers recorded in vivo at room temperature (Precht et al., 1971; Blanks and Precht, 1976; Rossi and Martini, 1986; Honrubia et al., 1989). This difference can be explained by a more depolarized resting membrane potential of frog 2°VNs and a higher temperature in vivo (Precht et al., 1974; Dieringer and Precht, 1979; Rossi and Martini, 1986; Rossi et al., 1989). Both parameters affect membrane conductances and shift resonance peaks to higher frequencies (Fig. 10A,B) in 2°VNs as in other CNS neurons (Lampl and Yarom, 1997; Tennigkeit et al., 1999; Hu et al., 2002; Erchova et al., 2004).
Compensating for experimental conditions, an average resonance frequency of >100 Hz in phasic 2°VNs and a cutoff frequency of ∼90 Hz for spike discharge in tonic 2°VNs under in vivo conditions can be assumed. These frequencies would fit well with the dynamic ranges of responses that characterize adapting and nonadapting vestibular afferent fibers, respectively (Precht et al., 1971; Blanks and Precht, 1976; Rossi and Martini, 1986; Honrubia et al., 1989; Rossi et al., 1989). This coadaptation of discharge properties of afferent fibers and response frequency bandwidths of 2°VNs suggests the presence of parallel pathways that separately process different dynamic aspects of head movement-related signals (Goldberg, 2000; Straka and Dieringer, 2004).
Compared with the dichotomy of frog tonic and phasic 2°VNs, rodent type A and type B vestibular neurons identified in vitro are more homogeneous in their response dynamics (du Lac et al., 1995) but are most likely the functional mammalian counterparts (Straka et al., 2005). Both type A and type B vestibular neurons exhibit pacemaker activity as well as a resonance below 10 Hz. However, type B vestibular neurons have a higher gain of spike discharge modulation (Ris et al., 2001; Beraneck et al., 2003). The complex repertoire of nonlinear, voltage-dependent channels in type B but not type A neurons (Serafin et al., 1990, 1991) is ideally suited for a function of the former ones as signal detectors (Straka et al., 2005). According to real data and neuronal modeling (Av-Ron and Vidal, 1999; Ris et al., 2001; Moore et al., 2004), type A and type B neurons also form separate channels for encoding low- and high-frequency signals, but with more continuous filter tuning than frog tonic and phasic 2°VNs. The different dynamic tuning of frog versus rodent vestibular neurons might mirror the differences in head movement-related signal dynamics attributable to the particular locomotor patterns of the different species.
Frequency-tuned channels for sensorimotor signal processing
Parallel pathways with different dynamics for the processing of head movement-related signals seem to be a common organizational principle of the vertebrate vestibulo-ocular system. On the sensory side at the level of labyrinthine hair cells, vestibular nerve afferent fibers, and central vestibular neurons, multiple cell types with complementary response dynamics for detection and coding of different components of the frequency spectrum of naturally occurring head movements are present (Baird, 1994a,b; Eatock et al., 1998; Goldberg, 2000; Straka and Dieringer, 2004; Straka et al., 2005). A similar organization occurs on the motor side, in which extraocular motoneurons and their target muscles form separate functional subunits that are responsible for different dynamic aspects of eye movements (Evinger and Baker, 1991; Straka and Dieringer, 2004; Büttner-Ennever, 2005; Spencer and Porter, 2005). The differences in response dynamics and preferred frequency bandwidths of corresponding neuronal populations at each synaptic stage are mainly attributable to a specific tuning of intrinsic properties at the cellular level. Accordingly, the activation of distinct membrane properties generates sets of neurons with particular filter properties along the vestibulo-ocular pathway that form flexible, frequency-tuned channels for optimal mediation of all dynamic aspects necessary for gaze stabilization.
Footnotes
This work was supported by the Marie-Curie Training Sites Contracts QLK5-CT-2000-60087 (Germany) and HPMT-CT-2000-00008 (France) and by Deutscher Akademischer Austauschdienst Grant D/05/40377.
References
- Av-Ron E, Vidal PP. Intrinsic membrane properties and dynamics of medial vestibular neurons: a simulation. Biol Cybern. 1999;80:383–392. doi: 10.1007/s004220050533. [DOI] [PubMed] [Google Scholar]
- Baird RA. Comparative transduction mechanisms of hair cells in the bullfrog utriculus. I. Responses to intracellular current. J Neurophysiol. 1994a;71:666–684. doi: 10.1152/jn.1994.71.2.666. [DOI] [PubMed] [Google Scholar]
- Baird RA. Comparative transduction mechanisms of hair cells in the bullfrog utriculus. II. Sensitivity and response dynamics to hair bundle displacement. J Neurophysiol. 1994b;71:685–705. doi: 10.1152/jn.1994.71.2.685. [DOI] [PubMed] [Google Scholar]
- Beraneck M, Hachemaoui M, Idoux E, Ris L, Uno A, Godaux E, Vidal PP, Moore LE, Vibert N. Long-term plasticity of ipsilesional medial vestibular nucleus neurons after unilateral labyrinthectomy. J Neurophysiol. 2003;90:184–203. doi: 10.1152/jn.01140.2002. [DOI] [PubMed] [Google Scholar]
- Blanks RH, Precht W. Functional characterization of primary vestibular afferents in the frog. Exp Brain Res. 1976;25:369–390. doi: 10.1007/BF00241728. [DOI] [PubMed] [Google Scholar]
- Büttner-Ennever JA. The extraocular motor nuclei: organization and functional neuroanatomy. Prog Brain Res. 2005;151:95–125. doi: 10.1016/S0079-6123(05)51004-5. [DOI] [PubMed] [Google Scholar]
- Cant NB, Benson CG. Parallel auditory pathways: projection patterns of the different neuronal populations in the dorsal and ventral cochlear nuclei. Brain Res Bull. 2003;60:457–474. doi: 10.1016/s0361-9230(03)00050-9. [DOI] [PubMed] [Google Scholar]
- Crill WE. Persistent sodium current in mammalian central neurons. Annu Rev Physiol. 1996;58:349–362. doi: 10.1146/annurev.ph.58.030196.002025. [DOI] [PubMed] [Google Scholar]
- Dieringer N, Precht W. Mechanisms of compensation for vestibular deficits in the frog. I. Modification of the excitatory commissural system. Exp Brain Res. 1979;36:311–328. doi: 10.1007/BF00238914. [DOI] [PubMed] [Google Scholar]
- Dieringer N, Precht W. Functional organization of eye velocity and eye position signals in abducens motoneurons of the frog. J Comp Physiol. 1986;158:179–194. [Google Scholar]
- du Lac S, Lisberger SG. Cellular processing of temporal information in medial vestibular nucleus neurons. J Neurosci. 1995;15:8000–8010. doi: 10.1523/JNEUROSCI.15-12-08000.1995. [DOI] [PMC free article] [PubMed] [Google Scholar]
- Eatock RA, Rusch A, Lysakowski A, Saeki M. Hair cells in mammalian utricles. Otolaryngol Head Neck Surg. 1998;119:172–181. doi: 10.1016/S0194-5998(98)70052-X. [DOI] [PubMed] [Google Scholar]
- Erchova I, Kreck G, Heinemann U, Herz AV. Dynamics of rat entorhinal cortex layer II and III cells: characteristics of membrane potential resonance at rest predict oscillation properties near threshold. J Physiol (Lond) 2004;560:89–110. doi: 10.1113/jphysiol.2004.069930. [DOI] [PMC free article] [PubMed] [Google Scholar]
- Evinger C, Baker R. Are there subdivisions of extraocular motoneuronal pools that can be controlled separately. In: Humphrey D, Freund H-J, editors. Motor control: concepts and issues. Chichester, UK: Wiley; 1991. pp. 22–31. [Google Scholar]
- Gamkrelidze G, Giaume C, Peusner KD. The differential expression of low-threshold sustained potassium current contributes to the distinct firing patterns in embryonic central vestibular neurons. J Neurosci. 1998;18:1449–1464. doi: 10.1523/JNEUROSCI.18-04-01449.1998. [DOI] [PMC free article] [PubMed] [Google Scholar]
- Gamkrelidze G, Giaume C, Peusner KD. Firing properties and dendrotoxin-sensitive sustained potassium current in vestibular nuclei neurons of the hatchling chick. Exp Brain Res. 2000;134:398–401. doi: 10.1007/s002210000501. [DOI] [PubMed] [Google Scholar]
- Goldberg JM. Afferent diversity and the organization of central vestibular pathways. Exp Brain Res. 2000;130:277–297. doi: 10.1007/s002210050033. [DOI] [PMC free article] [PubMed] [Google Scholar]
- Haas JS, White JA. Frequency selectivity of layer II stellate cells in the medial entorhinal cortex. J Neurophysiol. 2002;88:2422–2429. doi: 10.1152/jn.00598.2002. [DOI] [PubMed] [Google Scholar]
- Harvey AL. Recent studies on dendrotoxins and potassium ion channels. Gen Pharmacol. 1997;28:7–12. doi: 10.1016/s0306-3623(96)00173-5. [DOI] [PubMed] [Google Scholar]
- Hausser M, Spruston N, Stuart GJ. Diversity and dynamics of dendritic signaling. Science. 2000;290:739–744. doi: 10.1126/science.290.5492.739. [DOI] [PubMed] [Google Scholar]
- Honrubia V, Hoffman LF, Sitko S, Schwartz IR. Anatomic and physiological correlates in bullfrog vestibular nerve. J Neurophysiol. 1989;61:688–701. doi: 10.1152/jn.1989.61.4.688. [DOI] [PubMed] [Google Scholar]
- Hu H, Vervaeke K, Storm JF. Two forms of electrical resonance at theta frequencies, generated by M-current, h-current and persistent Na+ current in rat hippocampal pyramidal cells. J Physiol (Lond) 2002;545:783–805. doi: 10.1113/jphysiol.2002.029249. [DOI] [PMC free article] [PubMed] [Google Scholar]
- Hutcheon B, Yarom Y. Resonance, oscillation and the intrinsic frequency preferences of neurons. Trends Neurosci. 2000;23:216–222. doi: 10.1016/s0166-2236(00)01547-2. [DOI] [PubMed] [Google Scholar]
- Hutcheon B, Miura RM, Yarom Y, Puil E. Low-threshold calcium current and resonance in thalamic neurons: a model of frequency preference. J Neurophysiol. 1994;71:583–594. doi: 10.1152/jn.1994.71.2.583. [DOI] [PubMed] [Google Scholar]
- Izhikevich EM. Resonate-and-fire neurons. Neural Netw. 2001;14:883–894. doi: 10.1016/s0893-6080(01)00078-8. [DOI] [PubMed] [Google Scholar]
- Izhikevich EM, Desai NS, Walcott EC, Hoppensteadt FC. Bursts as a unit of neural information: selective communication via resonance. Trends Neurosci. 2003;26:161–167. doi: 10.1016/S0166-2236(03)00034-1. [DOI] [PubMed] [Google Scholar]
- Johnson KO, Hsiao SS. Neural mechanisms of tactual form and texture perception. Annu Rev Neurosci. 1992;15:227–250. doi: 10.1146/annurev.ne.15.030192.001303. [DOI] [PubMed] [Google Scholar]
- Kuruvilla A, Sitko S, Schwartz IR, Honrubia V. Central projections of primary vestibular fibers in the bullfrog. I. The vestibular nuclei. Laryngoscope. 1985;95:692–707. doi: 10.1288/00005537-198506000-00012. [DOI] [PubMed] [Google Scholar]
- Lampl I, Yarom Y. Subthreshold oscillations and resonant behavior: two manifestations of the same mechanism. Neuroscience. 1997;78:325–341. doi: 10.1016/s0306-4522(96)00588-x. [DOI] [PubMed] [Google Scholar]
- Major G, Tank D. Persistent neural activity: prevalence and mechanisms. Curr Opin Neurobiol. 2004;14:675–684. doi: 10.1016/j.conb.2004.10.017. [DOI] [PubMed] [Google Scholar]
- McCormick DA. Functional properties of a slowly inactivating potassium current in guinea pig dorsal lateral geniculate relay neurons. J Neurophysiol. 1991;66:1176–1189. doi: 10.1152/jn.1991.66.4.1176. [DOI] [PubMed] [Google Scholar]
- Merigan WH, Maunsell JH. How parallel are the primate visual pathways? Annu Rev Neurosci. 1993;16:369–402. doi: 10.1146/annurev.ne.16.030193.002101. [DOI] [PubMed] [Google Scholar]
- Moore LE, Buchanan JT. The effects of neurotransmitters on the integrative properties of spinal neurons in the lamprey. J Exp Biol. 1993;175:89–114. doi: 10.1242/jeb.175.1.89. [DOI] [PubMed] [Google Scholar]
- Moore LE, Hachemaoui M, Idoux E, Vibert N, Vidal PP. The linear and non-linear relationships between action potential discharge rates and membrane potential in model vestibular neurons. Nonlinear Studies. 2004;11:423–447. [Google Scholar]
- Peusner KD, Gamkrelidze G, Giaume C. Potassium currents and excitability in second-order auditory and vestibular neurons. J Neurosci Res. 1998;53:511–520. doi: 10.1002/(SICI)1097-4547(19980901)53:5<511::AID-JNR1>3.0.CO;2-C. [DOI] [PubMed] [Google Scholar]
- Popratiloff A, Giaume C, Peusner KD. Developmental change in expression and subcellular localization of two shaker-related potassium channel proteins (Kv1.1 and Kv1.2) in the chick tangential vestibular nucleus. J Comp Neurol. 2003;461:466–482. doi: 10.1002/cne.10702. [DOI] [PubMed] [Google Scholar]
- Precht W, Llinas R, Clarke M. Physiological responses of frog vestibular fibers to horizontal angular rotation. Exp Brain Res. 1971;13:378–407. doi: 10.1007/BF00234338. [DOI] [PubMed] [Google Scholar]
- Precht W, Richter A, Ozawa S, Shimazu H. Intracellular study of frog's vestibular neurons in relation to the labyrinth and spinal cord. Exp Brain Res. 1974;19:377–393. doi: 10.1007/BF00234462. [DOI] [PubMed] [Google Scholar]
- Ris L, Hachemaoui M, Vibert N, Godaux E, Vidal PP, Moore LE. Resonance of spike discharge modulation in neurons of the guinea pig medial vestibular nucleus. J Neurophysiol. 2001;86:703–716. doi: 10.1152/jn.2001.86.2.703. [DOI] [PubMed] [Google Scholar]
- Roche King J, Comer C. Visually elicited turning behavior in rana pipiens: comparative organization and neural control of escape and prey capture. J Comp Physiol. 1996;178:293–305. [Google Scholar]
- Rossi ML, Martini M. Afferent activity recorded during rotation from single fibres of the posterior nerve in the isolated frog labyrinth. Exp Brain Res. 1986;62:312–320. doi: 10.1007/BF00238850. [DOI] [PubMed] [Google Scholar]
- Rossi ML, Bonifazzi C, Martini M, Fesce R. Static and dynamic properties of synaptic transmission at the cyto-neural junction of frog labyrinth posterior canal. J Gen Physiol. 1989;94:303–327. doi: 10.1085/jgp.94.2.303. [DOI] [PMC free article] [PubMed] [Google Scholar]
- Schwarz DW, Tennigkeit F, Adam T, Finlayson P, Puil E. Membrane properties that shape the auditory code in three nuclei of the central nervous system. J Otolaryngol. 1998;27:311–317. [PubMed] [Google Scholar]
- Serafin M, Khateb A, de Waele C, Vidal PP, Muhlethaler M. Low threshold calcium spikes in medial vestibular nuclei neurones in vitro: a role in the generation of the vestibular nystagmus quick phase in vivo? Exp Brain Res. 1990;82:187–190. doi: 10.1007/BF00230850. [DOI] [PubMed] [Google Scholar]
- Serafin M, de Waele C, Khateb A, Vidal PP, Muhlethaler M. Medial vestibular nucleus in the guinea-pig. I. Intrinsic membrane properties in brainstem slices. Exp Brain Res. 1991;84:417–425. doi: 10.1007/BF00231464. [DOI] [PubMed] [Google Scholar]
- Shapley R. Visual sensitivity and parallel retinocortical channels. Annu Rev Psychol. 1990;41:635–658. doi: 10.1146/annurev.ps.41.020190.003223. [DOI] [PubMed] [Google Scholar]
- Spencer RF, Porter JD. Biological organization of the extraocular muscles. Prog Brain Res. 2005;151:43–80. doi: 10.1016/S0079-6123(05)51002-1. [DOI] [PubMed] [Google Scholar]
- Storm JF. Temporal integration by a slowly inactivating K+ current in hippocampal neurons. Nature. 1988;336:379–381. doi: 10.1038/336379a0. [DOI] [PubMed] [Google Scholar]
- Straka H, Dieringer N. Electrophysiological and pharmacological characterization of vestibular inputs to identified frog abducens motoneurons and internuclear neurons in vitro. Eur J Neurosci. 1993;5:251–260. doi: 10.1111/j.1460-9568.1993.tb00491.x. [DOI] [PubMed] [Google Scholar]
- Straka H, Dieringer N. Basic organization principles of the VOR: lessons from frogs. Prog Neurobiol. 2004;73:259–309. doi: 10.1016/j.pneurobio.2004.05.003. [DOI] [PubMed] [Google Scholar]
- Straka H, Biesdorf S, Dieringer N. Canal-specific excitation and inhibition of frog second-order vestibular neurons. J Neurophysiol. 1997;78:1363–1372. doi: 10.1152/jn.1997.78.3.1363. [DOI] [PubMed] [Google Scholar]
- Straka H, Beraneck M, Rohregger M, Moore LE, Vidal PP, Vibert N. Second-order vestibular neurons form separate pathways with different membrane and discharge properties. J Neurophysiol. 2004;92:845–861. doi: 10.1152/jn.00107.2004. [DOI] [PubMed] [Google Scholar]
- Straka H, Vibert N, Vidal PP, Moore LE, Dutia MB. Intrinsic membrane properties of vertebrate vestibular neurons: function, development and plasticity. Prog Neurobiol. 2005;76:349–392. doi: 10.1016/j.pneurobio.2005.10.002. [DOI] [PubMed] [Google Scholar]
- Tabata T, Kano M. Heterogeneous intrinsic firing properties of vertebrate retinal ganglion cells. J Neurophysiol. 2002;87:30–41. doi: 10.1152/jn.00179.2001. [DOI] [PubMed] [Google Scholar]
- Tennigkeit F, Schwarz DW, Puil E. Modulation of frequency selectivity by Na+- and K+-conductances in neurons of auditory thalamus. Hear Res. 1999;127:77–85. doi: 10.1016/s0378-5955(98)00174-9. [DOI] [PubMed] [Google Scholar]
- Vervaeke K, Hu H, Graham LJ, Storm JF. Contrasting effects of the persistent Na+ current on neuronal excitability and spike timing. Neuron. 2006;49:257–270. doi: 10.1016/j.neuron.2005.12.022. [DOI] [PubMed] [Google Scholar]
- Wu N, Hsiao CF, Chandler SH. Membrane resonance and subthreshold membrane oscillations in mesencephalic V neurons: participants in burst generation. J Neurosci. 2001;21:3729–3739. doi: 10.1523/JNEUROSCI.21-11-03729.2001. [DOI] [PMC free article] [PubMed] [Google Scholar]