

Abstract
The optic tectum is a visual center in vertebrates. It receives topographically ordered visual inputs from the retina in the superficial layers and then sends motor outputs from the deeper layers to the premotor reticulospinal system in the hindbrain. Although the topographic patterns of the retinotectal projection are well known, it is not yet well understood how tectal efferents in the tectobulbar tract project to the hindbrain. The retinotectal and the tectobulbar projections were visualized in a zebrafish stable transgenic line Tg(brn3a-hsp70:GFP). Using a single-neuron labeling system in combination with the cre/loxP and Gal4/UAS systems, we showed that the tectal neurons that projected to rhombomeres 2 and 6 were distributed with distinctive patterns along the anterior–posterior axis. Furthermore, we found that ephrinB2a was critically involved in increasing the probability of neurons projecting to rhombomere 2 through a reverse signaling mechanism. These results may provide a neuroanatomical and molecular basis for the motor command map in the tectum.
Keywords: zebrafish, tectobulbar projection, Cre/loxP, Gal4/UAS, ephrinB, reverse signaling
Introduction
How information is reorganized between the sensory and motor maps remains a key issue in the study of sensorimotor transformation. The optic tectum is one of the best model systems for investigating visuomotor transformation. It receives topographically ordered visual inputs from the retina in the superficial layers and sends motor outputs from the deeper layers to the premotor reticulospinal system in the hindbrain (Wurtz and Albano, 1980).
The tectal efferents have two pathways in rats, the contralateral (crossed) and ipsilateral (uncrossed) descending tectobulbar tracts (Dean et al., 1989). In goldfish, microstimulation of the tectum evokes eye and tail movements that are characteristic for specific stimulation sites and parameters (current strength and pulse rate) (Salas et al., 1997; Herrero et al., 1998). However, it remains to be elucidated how such characteristic responses are realized by the tectal neuron projection to the reticulospinal system.
In teleost fishes, the reticulospinal system is a segmentally organized motor center (Metcalfe et al., 1986) that develops within hindbrain segments, rhombomeres (r) 0–8 (Moens and Prince, 2002). Mauthner neurons in r4 initiate fast escape responses (Eaton et al., 1981), and their firing can be triggered by visual, auditory, or multimodal sensory stimuli (Eaton et al., 1991). Recent studies have shown that a majority of other reticulospinal neurons are also activated during escape behavior, suggesting coordinate functions of multiple reticulospinal neurons (Liu and Fetcho, 1999; Gahtan et al., 2002; Nakayama and Oda, 2004). However, little is known about how each reticulospinal neuron receives projections from the tectum.
The Ephrin/Eph ligand/receptor family is critically involved in the topographic targeting of the retinotectal projection (for review, see Flanagan and Vanderhaeghen, 1998; O'Leary and McLaughlin, 2005). These molecules function through forward and reverse-signaling mechanisms. The molecular mechanisms for the tectobulbar projections, however, remain unknown.
In this study, we established a novel system to observe the tectal neuron projections to the hindbrain in zebrafish by single-neuron labeling using cre/loxP and Gal4/UAS systems under the control of the zebrafish brn3a promoter. Brn3a is a POU-domain transcription factor expressed in specific central neurons and primary sensory neurons (He et al., 1989; Xiang et al., 1995). A stable transgenic line Tg(brn3a-hsp70:GFP) expressing GFP under the control of the brn3a promoter (Aizawa et al., 2005) allowed visualization of the retinotectal and tectobulbar projections. By using this single-neuron labeling system, we explored the mapping of regions of the tectum onto the hindbrain. We found that the neurons projecting to r2 and r6 were distributed with distinctive anterior–posterior patterns in the tectum. In addition, ephrinB2a was found to be critically involved in increasing the probability of neurons projecting to r2, through reverse signaling. Our findings should provide a neuroanatomical and molecular basis for understanding the motor command map in the tectum and the mechanisms of visuomotor transformation.
Materials and Methods
Plasmid construction.
Zebrafish brn3a cDNA was used to screen the zebrafish PAC library (Incyte Genomics, Wilmington, DE). An isolated PAC clone contained two SacI fragments (∼5.1 kb and 6.0 kb) covering the entire coding region of the brn3a and the flanking sequences. The intron 1 sequence of the brn3a gene was PCR amplified with primers (5′-TGAA-GACTCGTAAAAACGAGCTCCA-3′ and 5′-ACGAATTCTCAGCTGCGCATCGGGA-3′) and cloned into the BglII–EcoRI sites of hsp70:GFP (Halloran et al., 2000) to generate intron-hsp70:GFP. A 5.1 kb SacI fragment containing the 5′ flanking region and exon 1 of the brn3a gene was subcloned into the same site of intron-hsp70:GFP to generate brn3a-hsp70:GFP. brn3a-hsp70:Gal4VP16 was obtained by replacing GFP with a BamHI–NotI fragment of Gal4VP16 PCR-amplified from pBGal4VP16 (Koster and Fraser, 2001). Pgk-neo was removed from Pgk-neo-Flox by digestion with EcoRI, and PCR-amplified DsRed from pDsRed2–1 (Clontech, Mountain View, CA) was cloned into the EcoRI site to generate loxP:DsRed:loxP. The loxP:DsRed:loxP fragment was subcloned into the SacII site of brn3a-hsp70:Gal4VP16 to generate brn3a-hsp70:loxP:DsRed:loxP:Gal4VP16. pCS2:cre was generated by cloning PCR-amplified cre into the EcoRI-NotI sites of pCS2. The zebrafish ephrinB2a cDNA was isolated by PCR amplification (Chan et al., 2001). ephrinB2a ΔC (amino acids 1–256) (Durbin et al., 1998) was produced by inserting a stop codon with PCR. An upstream regulatory sequence (UAS) from pBUASE1BGFP (Koster and Fraser, 2001) was cloned into the HindIII–EcoRI sites of pCS2, and then EcoRI fragments of the ephrinB2a and the ephrinB2a ΔC were subcloned into the same site to obtain UAS:ephrinB2a and UAS:ephrinB2a ΔC, respectively. A UAS:GFP fragment was subcloned into the SacII site of UAS:ephrinB2a and UAS:ephrinB2a ΔC to generate UAS:ephrinB2a:UAS:GFP and UAS:ephrinB2a ΔC :UAS:GFP, respectively.
Injection of plasmid DNA.
Zebrafish were maintained as described previously (Westerfield, 1995). Embryos were staged according to Kimmel et al. (1995). Plasmid DNA was prepared using QIAprep miniprep kits (Qiagen, Hilden, Germany). For single-neuron labeling, a mixture of three plasmids, brn3a-hsp70:loxP:DsRed:loxP:Gal4VP16, pCS2:cre, and UAS:GFP (20 ng/μl each) was injected into one- to four-cell-stage embryos. Injected embryos were raised at 28.5°C, and those with labeled tectal neurons were selected under a fluorescent dissection microscope (MZFLIII; Leica, Wetzlar, Germany) and fixed in 4% paraformaldehyde at 7 d postfertilization (dpf). For ectopic expression, UAS:ephrinB2a:UAS:GFP or UAS:ephrinB2a ΔC :UAS:GFP was used instead of the UAS:GFP. Injected embryos with tectal neurons strongly labeled with GFP were selected for additional analysis.
Imaging.
The brain was removed from fixed embryos and mounted on a coverslip imaging chamber in 70% glycerol. Imaging was performed using a confocal microscope (LSM510; Zeiss, Oberkochen, Germany) with a 20×/0.75 numerical aperture (NA) objective. Approximately 30–80 optical sections were obtained at 0.8–0.9 μm intervals for each view. Excitation was provided by an Ar laser (488 nm) and a HeNe laser (543 nm), which allowed simultaneous capturing of GFP and DsRed images. For time-lapse imaging, embryos were mounted in 0.5% agarose in an imaging chamber on the confocal microscope. Images were obtained using the 20×/0.75 NA objective, at 15 min intervals for 25 h. Approximately 30–60 confocal sections at 1.5–2.0 μm intervals were compiled into a three-dimensional projection for each time point.
Statistical analysis.
The distributions of neurons projecting to different hindbrain segments in wild-type embryos were compared by the differences in the centers of gravity using a nonparametric one-way ANOVA, the Kruskal–Wallis test with the Bonferroni posttest (36 comparisons in nine groups). Statistical analysis was performed using Matlab software (MathWorks, Natick, MA). Analyses were performed for the coordinates of the neurons projecting to the anterior–posterior axis. No significant differences were detected when we compared the coordinates of the neurons projecting to the mediolateral axis. For comparisons of the probabilities of the neurons projecting to r2 between the posterior and the nonposterior regions, the binomial test with the Bonferroni posttest was performed (for nine comparisons with regard to r0 through r8). For comparisons of the probabilities of neurons in each tectal region, the binomial test with the Bonferroni posttest was performed (for two comparisons of wild-type with ephrinB2a and ephrinB2aΔC embryos). Differences were considered significant for p < 0.05.
Retrograde labeling, immunohistochemistry, and in situ hybridization.
Reticulospinal neurons were retrogradely labeled with rhodamine-conjugated dextran (Invitrogen, Carlsbad, CA), as described previously (Moens et al., 1996). Cryostat sectioning, immunohistochemistry, and whole-mount in situ hybridization were performed according to standard protocols (Westerfield, 1995). We used anti-GAD65/67 antibody (1:500 dilution; Biomol, Plymouth Meeting, PA), anti-VGLUT2 antibody (1:1000 dilution; Millipore, Billerica, MA), a secondary antibody conjugated to Alexa Fluor 532 (1:500 dilution; Invitrogen), zebrafish EphB4a cDNA (Cooke, 1997), and EphA4a cDNA (Bovenkamp and Greer, 1997). For nucleic acid staining, sections were incubated in SYTOX orange (1:1000 dilution; Invitrogen) for 30 min at room temperature. The stained sections were viewed by confocal microscopy. Images of the hybridized embryos were captured using a differential interference contrast microscope (Axioplan2; Zeiss) with a CCD camera (AxioCam HRc; Zeiss).
Results
Visualization of visuomotor neural networks
To investigate neural networks involving visuomotor transformation, we used a stable transgenic line Tg(brn3a-hsp70:GFP)rw0110a (Aizawa et al., 2005). The transgene brn3a-hsp70:GFP is composed of a regulatory region of the zebrafish brn3a gene containing the 4.9 kb upstream region, a part of the first exon and the first intron, hsp70 as a basal promoter, and GFP as a reporter (Fig. 1 A). In wild-type embryos, brn3a was mainly expressed in the retina and the tectum, as well as in the habenula and the cranial sensory ganglia (supplemental Fig. 1, available at www.jneurosci.org as supplemental material, and data not shown) (He et al., 1989; Xiang et al., 1995). The expression began ∼30 h postfertilization (hpf) in the anterior midbrain and spread more posteriorly within the tectum during development. Consistent with the expression of the brn3a mRNA, the transgenic embryos expressed GFP mainly in the retina and the tectum (Fig. 1 B,C), but also in the habenula, the pretectum, and the torus semicircularis from ∼34 hpf (Fig. 1 D,E). The optic tract, a subset of intertectal commissures, and the ventral tectal fascicles were clearly visualized in the brain at 5 dpf (Fig. 1 D,E).
Figure 1.

GFP expression in Tg(brn3a-hsp70:GFP) embryos. A, Structure of the zebrafish brn3a gene and the brn3a-hsp70:GFP transgene. A regulatory region of the brn3a gene contains a 4.9 kb upstream region (thick bar), a noncoding region (blue box), a part of the coding region (black box), and an intron (gray box). hsp70 promoter (yellow box) and EGFP (green box) sequences were inserted downstream of the regulatory region. The transcription start site is indicated as +1. S, SacI. B, C, Bright-field (B) and GFP fluorescence (C) images of a transgenic embryo at 3 dpf. D, Anterolateral view of the brain at 5 dpf. E, A transverse section of the brain at 7 dpf. Dorsal is upward. ITC, Intertectal commissure; Ha, habenula; OT, optic tract; Pt, pretectum; TS, torus semicircularis; VTF, ventral tectal fascicles; TeO, optic tectum; e, eye. Scale bar, 50 μm.
We examined the expression of GFP in the tectum in more detail. From nuclear staining of cryosections of the brain, we estimated that 47 ± 4% of cells in the tectum expressed GFP at 7 dpf (n = 8 from three embryos; data not shown). Descending efferents from the tectum were apparent in ventral view (Fig. 2 A, arrowhead). The contralaterally descending and ipsilaterally descending tectobulbar tracts were clearly distinguished after DiI injection into the right tectal hemisphere (Fig. 2 B, arrowheads), suggesting that GFP selectively visualized the ipsilaterally descending tectobulbar tract. In lateral view, the tectobulbar tract extended branches dorsally and segmentally in the hindbrain (Fig. 2 C, asterisks). A transverse section in the hindbrain showed that the dorsal branches elaborated around the ventral dendrites of the reticulospinal neurons (Fig. 2 D), suggesting that the tectobulbar tract plays a major role in transmitting visual information to the premotor reticulospinal system in the hindbrain. Immunohistochemistry showed that most of the GFP-expressing neurons in the tectum were glutamatergic, except for a subset of commissural neurons that were GABAergic (supplemental Fig. 2, available at www.jneurosci.org as supplemental material).
Figure 2.

Ipsilaterally descending tectobulbar tracts expressing GFP in Tg(brn3a-hsp70:GFP). A, C, D, Reticulospinal neurons were retrogradely labeled with rhodamine-conjugated dextran (red). A, Ventral view; anterior is upward. The arrowhead indicates the tip of the tectobulbar tract. B, Ventral view; anterior is upward. DiI (red) was injected into the right tectal hemisphere at 7 dpf. The ipsilaterally descending (filled arrowhead) and the contralaterally descending (open arrowhead) tectobulbar tracts were labeled with GFP and DiI, respectively. C, Lateral view; anterior is left, and dorsal is upward. Asterisks indicate each branching point from the tectobulbar tract. D, A transverse section of the brain from the location shown by the rectangle in A. E, F, Transverse sections of the adult brain. Red fluorescence indicates nuclei stained with SYTOX orange. M, Mauthner neuron; MiD, middle dorsal; MiV, middle ventral; mlf, medial longitudinal fascicle; n ve, vestibular nucleus; PGZ, periventricular gray zone; SAC, stratum album centrale; SFGS, stratum fibrosum et griseum superficiale; SGC, stratum griseum centrale; SO, stratum opticum; SPV, stratum periventriculare; TeO, optic tectum; TSc and TSvl, central and ventrolateral nucleus of torus semicircularis, respectively; TTB, tectobulbar tract. Scale bars: A, C, 50 μm; D, F, 20 μm; E, 100 μm.
The transgenic fish continued to express GFP at adult stages (Fig. 2 E,F). The adult tectum has a layered structure (Meek, 1983). GFP was expressed in the superficial layers of the tectum, which receive inputs from the retina. In addition, there were neurons expressing GFP in the deeper layers of the tectum (Fig. 2 F). Given that the tectum sends motor outputs from the deeper layers (Al-Akel et al., 1986), it is likely that these neurons were involved in sending motor outputs to the hindbrain. Together, these results show that the Tg(brn3a-hsp70:GFP) fish enabled visualization of the optic tract projecting to the superficial layers in the contralateral tectum and also the tectobulbar tract descending from the deeper layers ipsilaterally to the hindbrain reticulospinal neurons.
Development of the tectobulbar tract
We used the transgenic embryos to examine the development of the tectobulbar tract. The tectobulbar tract began to extend posteriorly from the ventral midbrain at ∼40 hpf (Fig. 3 A, arrowhead), reached r4 in which Mauthner neurons are located at ∼50 hpf (Fig. 3 B,C, arrowheads), and then developed branches that extended dorsally and segmentally within the hindbrain (Fig. 3 D and supplemental movie, available at www.jneurosci.org as supplemental material). The dorsal branches began to develop at ∼60 hpf (Fig. 3 E, arrows) and were well elaborated by 80 hpf (Fig. 3 F, asterisks). Considering the development of the other components in the visuomotor system, the tectobulbar tract begins to extend before the retinal axons reach the tectum at ∼48 hpf (Stuermer, 1988), and it begins to develop the dorsal branches during the period of retinal axon arborization, which occurs from ∼60 hpf (Stuermer, 1988). The onset of visually evoked neural activity in the tectum and startle responses are observed later on, at ∼66 and 68 hpf, respectively (Easter and Nicola, 1996; Niell and Smith, 2005). These findings suggest that the initial tectobulbar projection develops without visual inputs and that the dorsal branches develop coincidentally with retinal axon and tectal dendrite arborizations in the tectum, during the development of visuomotor behaviors.
Figure 3.

Development of the tectobulbar tract in Tg(brn3a-hsp70:GFP) embryos. A–C, Embryos fixed at 40 hpf (A) and 50 hpf (B, C) shown in lateral view (A, B) and dorsal view (C). The arrowhead indicates the tip of the tectobulbar tract. A, Inset, A region surrounded by a white rectangle in dorsal view. D, Time-lapse imaging of the tectobulbar tract from 52 hpf. Anterior is left, and dorsal is upward. Asterisks indicate the branching points. E, F, Brain fixed at 60 hpf (E) and 80 hpf (F) shown in lateral view. Arrows indicate initial dorsal branches. Asterisks indicate branching points. e, Eye; M, Mauthner neuron; OT, optic tract; ov, otic vesicle; TeO, optic tectum. Scale bars: A, D, 50 μm; E, 10 μm.
Genetic single-neuron labeling in zebrafish
To address the question of whether the GFP-positive tectal neurons project to the reticulospinal system with a defined spatial pattern, we established a genetic single-neuron labeling system in zebrafish (Fig. 4). Usually, injection of a plasmid or a tracer is used to label neurons. These procedures, however, can be limited by inefficiency or by the technical difficulty of avoiding clustered labelings or by insufficient labeling intensity. To circumvent these limitations, we coinjected three plasmids, pCS2:cre, brn3a-hsp70:loxP:DsRed2:loxP:Gal4VP16, and UAS:GFP into embryos at the one- to four-cell stage (Fig. 4 A). This procedure stochastically induced the expression of Gal4VP16 under the control of the brn3a-hsp70 promoter after excision of the DsRed sequence by Cre recombinase, resulting in the induction of GFP expression (Dong and Stuart, 2004; Kimura et al., 2006). In the injected embryos, neurons incorporating the plasmid brn3a-hsp70:loxP:DsRed2:loxP:Gal4VP16 expressed DsRed, whereas only neurons that simultaneously incorporated all three plasmids expressed GFP (Fig. 4 B,C, arrowheads). In addition, labeled neurons showed different colors, such as green or yellow, depending on the level of Cre-mediated recombination in multiple copies of the incorporated plasmids (Fig. 4 C, brackets). This allowed us to distinguish the axon for some neurons. We confirmed that the differences in color of labeled neurons were stable by 8 dpf. Thus, we found this strategy to be simple and useful for stochastically labeling single neurons with sufficient fluorescence intensity.
Figure 4.

Genetic single-neuron labeling system and labeled neurons. A, Single-neuron labeling system in combination with Cre/loxP and Gal4/VP16 systems. B–K, Filled arrowheads indicate the soma of a labeled neuron. Open arrowheads indicate the final projection site of the labeled axon. B, J, K, An example of a brain with labeled neurons in the tectum at 7 dpf, shown in lateral view (B), dorsal view (J), and ventral view (K). C, Tectal neurons with dendrites labeled in different colors (brackets), at 7 dpf, shown in dorsal view. D–I, Several types of neuron labeled in this study shown in dorsal view (D, F, H) and lateral view (E, G, I): a neuron with wide-field radial dendrites and an ipsilaterally descending axon (D, E), a neuron with small-field horizontal dendrites and an ipsilaterally descending axon (F, G), an interneuron without a descending projection (F, small arrow), a neuron with an axon through the tectal commissure (H, arrowhead), and a neuron in the torus semicircularis (I). J, Open circle indicates the location of the soma. K, An overlaid image of labeled reticulospinal neurons indicates projection to r2 in the hindbrain. Scale bars: B, C, D, J, 50 μm.
Mapping of tectobulbar projections
Using this system, several types of neuron were labeled in the tectum (Fig. 4 D–H) and in the torus semicircularis (Fig. 4 I). In this study, we focused on labeled neurons in the tectum at 7 dpf, because visuomotor behaviors such as the visually evoked startle and the optokinetic response, and also the tectal dendritic arborization, have matured by this stage (Easter and Nicola, 1996, 1997; Niell et al., 2004). The neurons were classified into four groups, depending on the size of the dendritic arborization fields (Fig. 5): very large (n = 5), large (n = 20) (Fig. 4 D, arrowhead), middle (n = 26), and small (n = 36) (Fig. 4 F, arrowhead). The labeled neurons had radial dendrites (Fig. 4 E, closed arrowhead) or horizontal dendrites (Fig. 4 G, closed arrowhead) with an ipsilaterally descending axon (Fig. 4 E,G, open arrowheads). We observed interneurons with no descending projections (Fig. 4 F, arrow), which likely correspond to the tectum opticum (TO)-interneurons in salamanders (Roth et al., 1999). In a few cases, we identified neurons with an axon that crossed the dorsal midline through the tectal commissure (Fig. 4 H, arrowhead) (Herrero et al., 1999), which was consistent with the GFP expression in the transgenic embryos (Fig. 1 D,E). Of the labeled tectal neurons, projections were examined for all those with ipsilaterally descending axons, which likely correspond to the TO2–TO4 tectum opticum neurons in salamanders (Roth et al., 1999). Two parameters, location of the soma and final projection site (Fig. 4 B,E,G, closed and open arrowheads, respectively), were determined for these neurons. The location of the soma was determined from a dorsal view (Fig. 4 J, open circle). Using a ventral view, the final projection site in the hindbrain was identified by overlying an image of reticulospinal neurons. For example, for the labeled axon shown in Figure 4 K, the final projection site was identified as r2 (Fig. 4 K, open arrowhead).
Figure 5.

Dendritic arborization fields of labeled neurons. Ratios of dendritic arborization fields (as shown by the polygon in Fig. 4 J) to the areas of the tectal hemisphere (as outlined by the thin line in Fig. 4 J) are plotted for the labeled neurons at 7 dpf (n = 87). The means (±SE, SEM) are shown by the horizontal bars for the total tectal neurons (black) and the four different groups (very large, 14.56 ± 1.37%, red; large, 9.17 ± 0.16%, orange; middle, 6.88 ± 0.08%, green; small, 4.10 ± 1.18%, blue).
Figure 6 A shows the data obtained from 114 neurons labeled in the tectum. We mapped the somatic locations in the tectum with respect to the final projection sites in the hindbrain (Fig. 6 A, colored circles). The distribution of neurons showed that each small region of the tectum contained multiple neurons projecting to different hindbrain segments. For example, the arborization field of a single retinal axon, as delineated by a pink polygon in Figure 6 B, contained 14 neurons projecting to different hindbrain segments (Fig. 6 A, bottom). This suggests that the tectum is organized as a mosaic of subregions, with each providing different combinations of descending projections to different hindbrain segments. We then compared the distributions of neurons projecting to each hindbrain segment (Fig. 6 C). The neurons projecting to each hindbrain segment were not distributed uniformly in the anterior–posterior axis of the tectum (p = 0.024; Kruskal–Wallis). The distribution of neurons projecting to r2 was significantly different from those projecting to r6, based on the centers of gravity (p < 0.05; Kruskal–Wallis with Bonferroni posttest) (Fig. 6 D). Thus, the labeled neurons projecting to r2 and r6 were distributed with distinctive anterior–posterior patterns. To examine whether there was any bias in the distribution of the neurons projecting to r2, we arbitrarily defined the posterior region of the tectum as shaded in Figure 6 D. The ratio of the number of neurons projecting to r2 to the total number of labeled neurons (hereafter referred to as the “probability” of neurons projecting to r2), was calculated for the posterior region (Fig. 7 A, posterior) and the other (nonposterior) region of the tectum (Fig. 7 A, nonposterior). We found that the probability of the neurons in the posterior tectum projecting to r2 was significantly higher than the corresponding probability of the neurons in the nonposterior tectum (Fig. 7 D, wild type) (p < 0.05; two-tailed binomial with Bonferroni posttest, for nine comparisons with regard to r0 through r8).
Figure 6.

Distributions of labeled neurons in the tectum. A, Locations of somata for 114 labeled neurons in the tectum at 7 dpf, shown in the right hemisphere in dorsal view. Somata are indicated by circles that are color-coded according to the projection to each hindbrain segment. The pink polygon (bottom) indicates the arborization field of a single retinal axon (shown in B), with an overlay of the somata located within the same region. B, A brain with labeled neurons at 7 dpf shown in dorsal view. Thick and thin lines outline the midbrain and tectum, respectively. C, The locations of somata are shown for the projection to each hindbrain segment from r0 to r8. Crosses indicate centers of gravity. D, Comparison of the distributions of neurons projecting to r2 with those projecting to r6 in the centers of gravity (p < 0.05; Kruskal–Wallis with Bonferroni posttest). The shaded region indicates an arbitrarily defined posterior region of the tectum.
Figure 7.
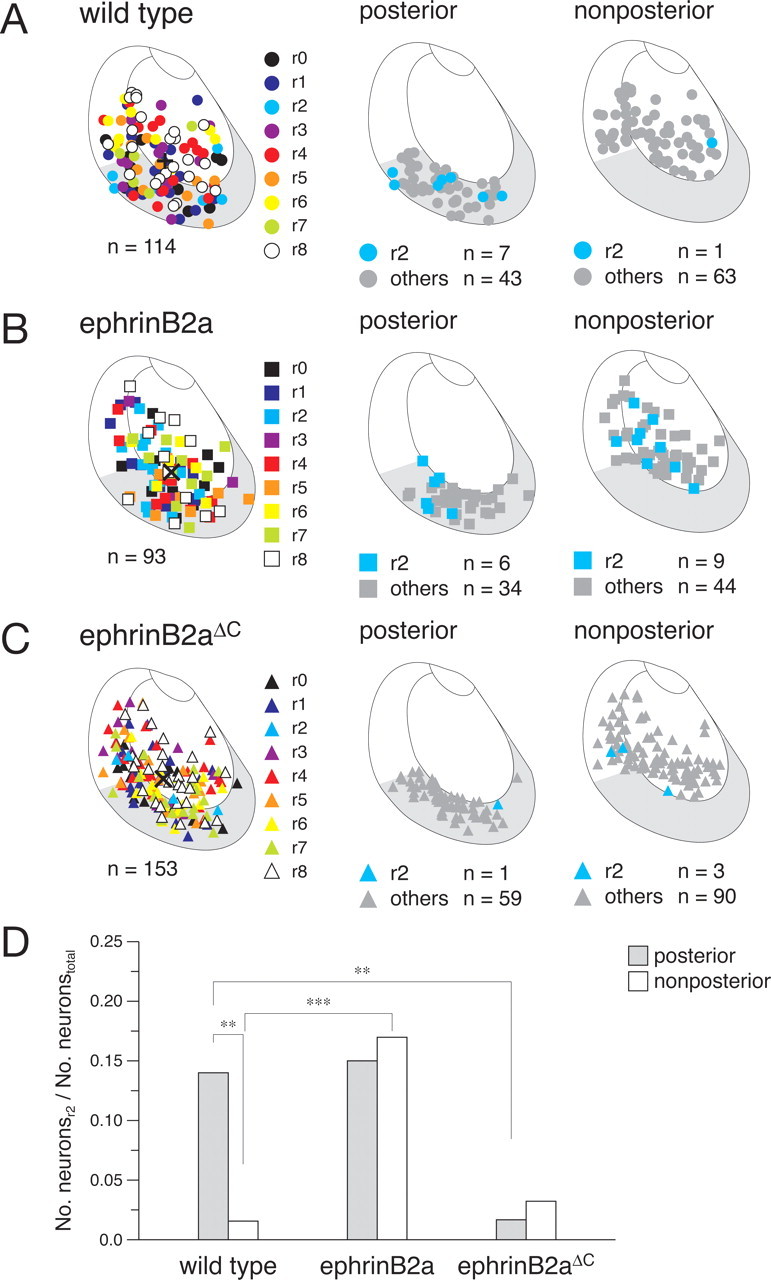
Effects of the ectopic expression of ephrinB2a and ephrinB2a ΔC on the probabilities of neurons projecting to r2. A, Locations of somata for 114 labeled neurons in wild-type embryos (colored circles, left). Wild-type neurons projecting to r2 (blue circles) and the other labeled neurons (gray circles) in the posterior tectum (middle) and the nonposterior tectum (right). B, Locations of somata for 93 labeled neurons expressing ephrinB2a (left, colored squares). ephrinB2a-expressing neurons projecting to r2 (blue squares) and the other labeled neurons (gray squares) in the posterior tectum (middle) and the nonposterior tectum (right). C, Locations of somata for 153 labeled neurons expressing ephrinB2a ΔC (left, colored triangles). ephrinB2a ΔC-expressing neurons projecting to r2 (blue triangles) and the other labeled neurons (gray triangles) in the posterior tectum (middle) and the nonposterior tectum (right). A–C, Crosses indicate the centers of gravity of the distributions of labeled neurons. D, Ratios of the number of neurons projecting to r2 to the total number of labeled neurons in the posterior tectum (shaded columns) and in the nonposterior tectum (open columns) for wild-type, ephrinB2a, and ephrinB2aΔC embryos. Pairwise comparisons of ratios with significant differences: **p < 0.01 and ***p < 0.001 (two-tailed binomial test).
ephrinB2a functions in r2 projections
To address the question of which kinds of molecules are involved in determining the probability of neurons projecting to r2, we focused on the ephrin-Eph ligand-receptor family. These molecules play a major role in the topographic projection of retinotectal neural connections (Flanagan and Vanderhaeghen, 1998; O'Leary and McLaughlin, 2005). In zebrafish, ephrinB2a is expressed medially in the tectum at 36 hpf (Chan et al., 2001) and is localized in the most posterior tectum at 3 dpf (supplemental Fig. 3B, available at www.jneurosci.org as supplemental material) (Wagle et al., 2004). This area of expression coincided approximately with the above-defined posterior region of the tectum, within which almost all of the neurons projecting to r2 were distributed (Fig. 6 D, shaded region). In Xenopus, ephrinB in the retina functions as a receptor by attractive and reverse-signaling mechanisms (Mann et al., 2002), suggesting the possibility that ephrinB in the tectum could influence the projection of tectal neurons to the hindbrain. Moreover, the ephrin-Eph ligand receptors are segmentally expressed in the hindbrain at early stages of development (Flanagan and Vanderhaeghen, 1998; Cooke et al., 2001). In situ hybridization for the ephrinB2 counterparts EphB4a and EphA4a showed that EphB4a was expressed in r2, r5, and r6 and that EphA4a was expressed in r3 and r5 at the stages when the tectobulbar tract was projecting to the hindbrain (supplemental Fig. 3C–F, available at www.jneurosci.org as supplemental material). This suggests that ephrinB2 may function by interacting with Eph receptors in the hindbrain.
Therefore, we ectopically expressed zebrafish ephrinB2a in tectal neurons concomitantly with GFP by applying the construct UAS:ephrinB2a:UAS:GFP to the single-neuron labeling system (Fig. 4 A). Double staining by immunohistochemistry for GFP and in situ hybridization for ephrinB2a showed that most of the GFP-expressing neurons expressed ephrinB2a in the injected embryos (90.3 ± 1.5%; n = 72 cells; data not shown). The gross morphology of the dendritic arbors expressing ephrinB2a appeared normal (data not shown). We mapped the somatic locations of 93 ephrinB2a-expressing neurons with respect to their final projection sites (rhombomeres) (Fig. 7 B, left, colored squares). The overall distribution of the neurons expressing ephrinB2a in the tectum was not significantly different from that of wild-type neurons, based on comparison of the centers of gravity (p > 0.05; Kruskal–Wallis with Bonferroni posttest). The ratios of the number of ephrinB2a-expressing neurons in the posterior tectum (43.01%) (Fig. 7 B, middle) (n = 40) and the nonposterior tectum (56.99%) (Fig. 7 B, right) (n = 53) to the total number of ephrinB2a-expressing neurons in the whole tectal region (Fig. 7 B, left) (n = 93) were not significantly different from the corresponding ratios (43.86 and 56.14%, respectively) in wild-type embryos (p > 0.05; two-tailed binomial with Bonferroni posttest, for two comparisons of wild type with ephrinB2a and ephrinB2ΔC in each region).
We calculated the probabilities of neurons projecting to r2 for the posterior tectum (Fig. 7 B, middle) (n = 6) and the nonposterior tectum (Fig. 7 B, right) (n = 9). In contrast to the case in the wild-type neurons, the probability of the nonposterior ephrinB2a-expressing neurons projecting to r2 increased to a level similar to that of the posterior neurons. These probabilities were not significantly different (Fig. 7 D, ephrinB2a) (p > 0.05; two-tailed binomial with Bonferroni posttest for nine comparisons). Furthermore, because the probability of the ephrinB2a-expressing neurons projecting to r2 in the posterior tectum was not significantly different from the corresponding probability of wild-type neurons (Fig. 7 D) (p > 0.05; two-tailed binomial with Bonferroni posttest for two comparisons), the probability of the neurons projecting to r2 in the nonposterior tectum could be judged to have increased up to the level of the corresponding probability in the posterior tectum of wild-type neurons.
ephrinB2a functions through reverse signaling
To examine whether ephrinB2a functions through a reverse-signaling mechanism, we overexpressed ephrinB2a ΔC, a dominant-negative form of ephrinB2a that lacked the cytoplasmic domain (amino acids 257–332) (Durbin et al., 1998), using the same system (Fig. 4 A). As ephrinB2a is expressed from earlier stages of development in the hindbrain and the retina (Chan et al., 2001; Cooke et al., 2001), it was essential to use a method that would selectively suppress ephrinB2a function in the tectum during the stage of projection to the hindbrain without affecting its function in other regions of the embryo.
We mapped the somatic locations of 153 ephrinB2a ΔC-expressing neurons with respect to their final projection sites (rhombomeres) (Fig. 7 C, left, colored triangles). The overall distribution of the neurons expressing ephrinB2a ΔC in the tectum was not significantly different from that of wild-type neurons, by comparison of the centers of gravity (p > 0.05; Kruskal–Wallis with Bonferroni posttest). The ratios of the number of ephrinB2a ΔC-expressing neurons in the posterior (39.22%) and the nonposterior (60.78%) regions to the total number of ephrinB2a ΔC-expressing neurons in the whole tectal region (Fig. 7 C, left) (n = 153) were not significantly different from the corresponding ratios (43.86% and 56.14%, respectively) in wild-type embryos (p > 0.05; two-tailed binomial with Bonferroni posttest for two comparisons).
We determined the probability of neurons projecting to r2 in the posterior and the nonposterior tectal regions (Fig. 7 C, middle, right; Fig. 7 D, ephrinB2aΔC). In contrast to the case in the ephrinB2a-expressing neurons, the probability of the posterior ephrinB2a ΔC-expressing neurons projecting to r2 decreased to a level similar to that of the nonposterior neurons. These probabilities were not significantly different (Fig. 7 D, ephrinB2aΔC) (p > 0.05; two-tailed binomial with Bonferroni posttest for nine comparisons). Moreover, because the probability of the ephrinB2a ΔC-expressing neurons projecting to r2 in the nonposterior tectum was not significantly different from the corresponding probability of wild-type neurons (Fig. 7 D) (p > 0.05; two-tailed binomial with Bonferroni posttest for two comparisons), the probability of the neurons projecting to r2 in the posterior tectum could be judged to have decreased to the level of the corresponding probability in the nonposterior tectum of wild-type embryos. These results clearly indicate that ephrinB2a is critically involved in increasing the probability of neurons projecting to r2 via a reverse-signaling mechanism.
We also observed results suggesting that ephrinB2a somehow influenced the probabilities of those neurons projecting to r6 and r7 (supplemental Figs. 4, 5, available at www.jneurosci.org as supplemental material). However, at present, the mechanism for this remains unclear. No significant differences were detected between the posterior and the nonposterior tectum in the probabilities of neurons projecting to the other hindbrain segments, in wild-type, eprhrinB2a, or ephrinB2aΔC embryos (data not shown; p > 0.05; two-tailed binomial with Bonferroni posttest for two comparisons).
Discussion
Genetic single-neuron labeling in zebrafish
To address the question of how the tectum sends projections to the premotor reticulospinal system in the hindbrain, we established a single-neuron labeling system combining Cre/loxP with Gal4/UAS systems in zebrafish. By coinjecting the three plasmids into fertilized eggs, we drove the expression of GFP under the control of the brn3a-hsp70 promoter through Cre-mediated excision of the DsRed sequence, which enabled us to stochastically label neurons. We used a transient expression system (instead of stable transgenic lines), which had the advantage of increasing the copy number of incorporated plasmids so as to obtain sufficient fluorescent signals. This technique also reduced the probability of excessive simultaneous labeling of multiple neurons, and it produced useful differences in color of the labeled neurons. Furthermore, combining this method with the Gal4/UAS system enabled us to drive the expression of selected molecules under the control of the brn3a-hsp70 promoter, so that we could explore cell-autonomous functions of the molecules in the labeled neurons.
Several different strategies have been used to genetically label neurons in vivo. In Drosophila, mosaic analysis with a repressible cell marker (MARCM) is one of the sophisticated strategies to label homozygous mutant cells using FLP/FRT-mediated mitotic recombination and the Gal4/UAS binary expression system (Lee and Luo, 1999). In mice, genetic mosaics are also applied via mosaic analysis with double markers (MADM), using Cre/loxP-mediated mitotic recombination for simultaneous labeling and mutation of single neurons (Zong et al., 2005). The Cre/loxP recombination system was recently used for isolated labeling in zebrafish (Dong and Stuart, 2004; Kimura et al., 2006). Compared with these methods using transgenic animals, our strategy is more convenient for labeling neurons at the single-cell level.
Mosaic organization of the tectum in its projections to different rhombomeres
Using this strategy, we investigated the distributions of neurons projecting to each hindbrain segment in the tectum. Every tectal site contained multiple neurons projecting to different hindbrain segments, revealing a mosaic organization of the tectum. These results suggest that a single retinotopic visual input could be transformed into segregated motor outputs, and the pattern of the outputs would be different at different sites within the tectum. Indeed, the tectal neurons projecting to r2 and r6 were distributed with distinct anterior–posterior patterns. These data might provide a basis for the visuomotor transformation. Our results would be supported by a two-dimensionally ordered motor command map in the tectum (Stryker and Schiller, 1975). However, additional study is necessary to correlate the neuroanatomically identified projection patterns with the electrophysiologically characterized motor command map in the tectum. In goldfish, the injection sites of tracers in the tectum show a colinear anterior–posterior relationship with the sites containing the peak number of labeled synaptic boutons in the mesencephalic reticular formation, although such a relationship is not found in the rhombencephalic reticular formation (Perez-Perez et al., 2003). The discrepancy between these observations in goldfish and our results is likely attributable to the differences in labeling strategies (single-neuron labeling vs tracer injection) and in examined parameters for the tectum and the hindbrain (somatic locations and the final projection site vs injection sites and the number of synaptic boutons).
ephrinB2a in the tectal neuron projection to r2
Ectopic expression of the wild-type zebrafish ephrinB2a using our labeling system resulted in a significant increase in the probability of neurons projecting to r2 in the nonposterior tectal region. This effect is not additive because the overexpression of ephrinB2a did not cause any additional increase in the probability of the neurons projecting to r2 in the posterior tectum. In addition, ectopic expression of a dominant-negative form of ephrinB2a further supported an essential role for ephrinB2a in regulating the probability of neurons projecting to r2 through a reverse-signaling mechanism. However, not all of the neurons expressing ephrinB2a in the tectum projected to r2, suggesting involvement of multiple factors in regulation of the tectal neuron projection, among which ephrinB2a is one component contributing to the enhancement of the stochastic probability of projection to r2.
In Xenopus, ephrinB2 in the retina functions as an attractive signal through the reverse-signaling mechanism for dorsoventral topographic projections to the tectum (Mann et al., 2002). In mice, ephrinB2 is also required to supply repulsive signals for axon guidance in the anterior commissure (Cowan et al., 2004). Thus, ephrinB2 can provide both attractive and repulsive cues through reverse signaling (Davy and Soriano, 2005). In the hindbrain, the major ephrinB2 counterparts EphB4 and EphA4 were expressed weakly in r2 and strongly in r3, respectively (supplemental Fig. 3C–F, available at www.jneurosci.org as supplemental material). Therefore, a possible explanation for our results would be that ephrinB2a acts as an attractive cue for EphB4a in r2 and/or as a repulsive cue for EphA4a in r3.
Putative role of the projection from the posterior tectum to r2
In this study, we revealed that r2 predominantly received projections from the posterior region of the tectum. From an evolutionary perspective, it is believed that animals have adapted to produce escape responses when a visual stimulus approaches from the dorsoposterior position (thereby indicating a risk of predation), with consequent activation of the posterior tectum (Dean et al., 1989). In goldfish, electrical microstimulation of the posterior tectum, corresponding to a visual stimulus from above behind, evokes escape-like movements (Herrero et al., 1998). In the rat superior colliculus, it is suggested that the uncrossed descending pathway is involved in escape or avoidance movements, whereas the crossed descending pathway is involved in orienting movements toward a visual target (Dean et al., 1989). Similarly, in zebrafish, we observed both ipsilateral and contralateral descending projections to the hindbrain (Fig. 2 B). Therefore, the posterior tectal neurons ipsilaterally descending to r2 in addition to those descending to r4 and r5 may play a role in producing the coordinated motor outputs for visually evoked escape movements. An in vivo calcium imaging study in zebrafish has indicated that the reticulospinal neurons in r2, as well as the Mauthner cells and MiD2cs in r4 and r5, are activated during escape behavior (Gahtan et al., 2002). However, additional investigation will be necessary to elucidate the specific contributions of the connection between the posterior tectum and r2 to visually evoked escape behaviors.
Footnotes
This work was supported in part by Internal Research Fund of RIKEN Brain Science Institute (H.O.) and by Grant-in-Aid 16700296 for Young Scientists from the Japan Society for the Promotion of Science (T.S.). We thank Dr. J. Kuwada for kindly providing hsp70:GFP, Dr. S. Fraser for pBGal4VP16 and pBUASE1BGFP, and Dr. S. Jesuthasan for the zebrafish ephrinB2a probe.
References
- Aizawa H, Bianco IH, Hamaoka T, Miyashita T, Uemura O, Concha ML, Russell C, Wilson SW, Okamoto H. Laterotopic representation of left-right information onto the dorso-ventral axis of a zebrafish midbrain target nucleus. Curr Biol. 2005;15:238–243. doi: 10.1016/j.cub.2005.01.014. [DOI] [PMC free article] [PubMed] [Google Scholar]
- Al-Akel AS, Guthrie DM, Banks JR. Motor responses to localized electrical stimulation of the tectum in the freshwater perch (Perca fluviatilis) Neuroscience. 1986;19:1381–1391. doi: 10.1016/0306-4522(86)90150-8. [DOI] [PubMed] [Google Scholar]
- Bovenkamp DE, Greer P. Novel Eph-family receptor tyrosine kinase is widely expressed in the developing zebrafish nervous system. Dev Dyn. 1997;209:166–181. doi: 10.1002/(SICI)1097-0177(199706)209:2<166::AID-AJA3>3.0.CO;2-G. [DOI] [PubMed] [Google Scholar]
- Chan J, Mably JD, Serluca FC, Chen JN, Goldstein NB, Thomas MC, Cleary JA, Brennan C, Fishman MC, Roberts TM. Morphogenesis of prechordal plate and notochord requires intact Eph/ephrin B signaling. Dev Biol. 2001;234:470–482. doi: 10.1006/dbio.2001.0281. [DOI] [PubMed] [Google Scholar]
- Cooke J, Moens C, Roth L, Durbin L, Shiomi K, Brennan C, Kimmel C, Wilson S, Holder N. Eph signalling functions downstream of Val to regulate cell sorting and boundary formation in the caudal hindbrain. Development. 2001;128:571–580. doi: 10.1242/dev.128.4.571. [DOI] [PubMed] [Google Scholar]
- Cooke JE. Characterization of five novel zebrafish Eph-related receptor tyrosine kinases suggests roles in patterning the neural plate. Dev Genes Evol. 1997;206:515–531. doi: 10.1007/s004270050082. [DOI] [PubMed] [Google Scholar]
- Cowan CA, Yokoyama N, Saxena A, Chumley MJ, Silvany RE, Baker LA, Srivastava D, Henkemeyer M. Ephrin-B2 reverse signaling is required for axon pathfinding and cardiac valve formation but not early vascular development. Dev Biol. 2004;271:263–271. doi: 10.1016/j.ydbio.2004.03.026. [DOI] [PubMed] [Google Scholar]
- Davy A, Soriano P. Ephrin signaling in vivo: look both ways. Dev Dyn. 2005;232:1–10. doi: 10.1002/dvdy.20200. [DOI] [PubMed] [Google Scholar]
- Dean P, Redgrave P, Westby GW. Event or emergency? Two response systems in the mammalian superior colliculus. Trends Neurosci. 1989;12:137–147. doi: 10.1016/0166-2236(89)90052-0. [DOI] [PubMed] [Google Scholar]
- Dong J, Stuart GW. Transgene manipulation in zebrafish by using recombinases. Methods Cell Biol. 2004;77:363–379. doi: 10.1016/s0091-679x(04)77020-x. [DOI] [PubMed] [Google Scholar]
- Durbin L, Brennan C, Shiomi K, Cooke J, Barrios A, Shanmugalingam S, Guthrie B, Lindberg R, Holder N. Eph signaling is required for segmentation and differentiation of the somites. Genes Dev. 1998;12:3096–3109. doi: 10.1101/gad.12.19.3096. [DOI] [PMC free article] [PubMed] [Google Scholar]
- Easter SS, Jr, Nicola GN. The development of vision in the zebrafish (Danio rerio) Dev Biol. 1996;180:646–663. doi: 10.1006/dbio.1996.0335. [DOI] [PubMed] [Google Scholar]
- Easter SS, Jr, Nicola GN. The development of eye movements in the zebrafish (Danio rerio) Dev Psychobiol. 1997;31:267–276. doi: 10.1002/(sici)1098-2302(199712)31:4<267::aid-dev4>3.0.co;2-p. [DOI] [PubMed] [Google Scholar]
- Eaton RC, Lavender WA, Wieland CM. Identification of Mauthner-initiated response patterns in goldfish: evidence from simultaneous cinematography and electrophysiology. J Comp Physiol A Neuroethol Sens Neural Behav Physiol. 1981;144:521–531. [Google Scholar]
- Eaton RC, DiDomenico R, Nissanov J. Role of the Mauthner cell in sensorimotor integration by the brain stem escape network. Brain Behav Evol. 1991;37:272–285. doi: 10.1159/000114365. [DOI] [PubMed] [Google Scholar]
- Flanagan JG, Vanderhaeghen P. The ephrins and Eph receptors in neural development. Annu Rev Neurosci. 1998;21:309–345. doi: 10.1146/annurev.neuro.21.1.309. [DOI] [PubMed] [Google Scholar]
- Gahtan E, Sankrithi N, Campos JB, O'Malley DM. Evidence for a widespread brain stem escape network in larval zebrafish. J Neurophysiol. 2002;87:608–614. doi: 10.1152/jn.00596.2001. [DOI] [PubMed] [Google Scholar]
- Halloran MC, Sato-Maeda M, Warren JT, Su F, Lele Z, Krone PH, Kuwada JY, Shoji W. Laser-induced gene expression in specific cells of transgenic zebrafish. Development. 2000;127:1953–1960. doi: 10.1242/dev.127.9.1953. [DOI] [PubMed] [Google Scholar]
- He X, Treacy MN, Simmons DM, Ingraham HA, Swanson LW, Rosenfeld MG. Expression of a large family of POU-domain regulatory genes in mammalian brain development. Nature. 1989;340:35–41. doi: 10.1038/340035a0. [DOI] [PubMed] [Google Scholar]
- Herrero L, Rodriguez F, Salas C, Torres B. Tail and eye movements evoked by electrical microstimulation of the optic tectum in goldfish. Exp Brain Res. 1998;120:291–305. doi: 10.1007/s002210050403. [DOI] [PubMed] [Google Scholar]
- Herrero L, Perez P, Nunez Abades P, Hardy O, Torres B. Tectotectal connectivity in goldfish. J Comp Neurol. 1999;411:455–471. doi: 10.1002/(sici)1096-9861(19990830)411:3<455::aid-cne8>3.0.co;2-7. [DOI] [PubMed] [Google Scholar]
- Kimmel CB, Ballard WW, Kimmel SR, Ullmann B, Schilling TF. Stages of embryonic development of the zebrafish. Dev Dyn. 1995;203:253–310. doi: 10.1002/aja.1002030302. [DOI] [PubMed] [Google Scholar]
- Kimura Y, Okamura Y, Higashijima S. alx, a zebrafish homolog of Chx10, marks ipsilateral descending excitatory interneurons that participate in the regulation of spinal locomotor circuits. J Neurosci. 2006;26:5684–5697. doi: 10.1523/JNEUROSCI.4993-05.2006. [DOI] [PMC free article] [PubMed] [Google Scholar]
- Koster RW, Fraser SE. Tracing transgene expression in living zebrafish embryos. Dev Biol. 2001;233:329–346. doi: 10.1006/dbio.2001.0242. [DOI] [PubMed] [Google Scholar]
- Lee T, Luo L. Mosaic analysis with a repressible cell marker for studies of gene function in neuronal morphogenesis. Neuron. 1999;22:451–461. doi: 10.1016/s0896-6273(00)80701-1. [DOI] [PubMed] [Google Scholar]
- Liu KS, Fetcho JR. Laser ablations reveal functional relationships of segmental hindbrain neurons in zebrafish. Neuron. 1999;23:325–335. doi: 10.1016/s0896-6273(00)80783-7. [DOI] [PubMed] [Google Scholar]
- Mann F, Ray S, Harris W, Holt C. Topographic mapping in dorsoventral axis of the Xenopus retinotectal system depends on signaling through ephrin-B ligands. Neuron. 2002;35:461–473. doi: 10.1016/s0896-6273(02)00786-9. [DOI] [PubMed] [Google Scholar]
- Meek J. Functional anatomy of the tectum mesencephali of the goldfish. An explorative analysis of the functional implications of the laminar structural organization of the tectum. Brain Res. 1983;287:247–297. doi: 10.1016/0165-0173(83)90008-5. [DOI] [PubMed] [Google Scholar]
- Metcalfe WK, Mendelson B, Kimmel CB. Segmental homologies among reticulospinal neurons in the hindbrain of the zebrafish larva. J Comp Neurol. 1986;251:147–159. doi: 10.1002/cne.902510202. [DOI] [PubMed] [Google Scholar]
- Moens CB, Prince VE. Constructing the hindbrain: insights from the zebrafish. Dev Dyn. 2002;224:1–17. doi: 10.1002/dvdy.10086. [DOI] [PubMed] [Google Scholar]
- Moens CB, Yan YL, Appel B, Force AG, Kimmel CB. valentino: a zebrafish gene required for normal hindbrain segmentation. Development. 1996;122:3981–3990. doi: 10.1242/dev.122.12.3981. [DOI] [PubMed] [Google Scholar]
- Nakayama H, Oda Y. Common sensory inputs and differential excitability of segmentally homologous reticulospinal neurons in the hindbrain. J Neurosci. 2004;24:3199–3209. doi: 10.1523/JNEUROSCI.4419-03.2004. [DOI] [PMC free article] [PubMed] [Google Scholar]
- Niell CM, Smith SJ. Functional imaging reveals rapid development of visual response properties in the zebrafish tectum. Neuron. 2005;45:941–951. doi: 10.1016/j.neuron.2005.01.047. [DOI] [PubMed] [Google Scholar]
- Niell CM, Meyer MP, Smith SJ. In vivo imaging of synapse formation on a growing dendritic arbor. Nat Neurosci. 2004;7:254–260. doi: 10.1038/nn1191. [DOI] [PubMed] [Google Scholar]
- O'Leary DD, McLaughlin T. Mechanisms of retinotopic map development: Ephs, ephrins, and spontaneous correlated retinal activity. Prog Brain Res. 2005;147:43–65. doi: 10.1016/S0079-6123(04)47005-8. [DOI] [PubMed] [Google Scholar]
- Perez-Perez MP, Luque MA, Herrero L, Nunez-Abades PA, Torres B. Connectivity of the goldfish optic tectum with the mesencephalic and rhombencephalic reticular formation. Exp Brain Res. 2003;151:123–135. doi: 10.1007/s00221-003-1432-6. [DOI] [PubMed] [Google Scholar]
- Roth G, Dicke U, Grunwald W. Morphology, axonal projection pattern, and response types of tectal neurons in plethodontid salamanders. II. Intracellular recording and labeling experiments. J Comp Neurol. 1999;404:489–504. doi: 10.1002/(sici)1096-9861(19990222)404:4<489::aid-cne6>3.0.co;2-0. [DOI] [PubMed] [Google Scholar]
- Salas C, Herrero L, Rodriguez F, Torres B. Tectal codification of eye movements in goldfish studied by electrical microstimulation. Neuroscience. 1997;78:271–288. doi: 10.1016/s0306-4522(97)83048-5. [DOI] [PubMed] [Google Scholar]
- Stryker MP, Schiller PH. Eye and head movements evoked by electrical stimulation of monkey superior colliculus. Exp Brain Res. 1975;23:103–112. doi: 10.1007/BF00238733. [DOI] [PubMed] [Google Scholar]
- Stuermer CA. Retinotopic organization of the developing retinotectal projection in the zebrafish embryo. J Neurosci. 1988;8:4513–4530. doi: 10.1523/JNEUROSCI.08-12-04513.1988. [DOI] [PMC free article] [PubMed] [Google Scholar]
- Wagle M, Grunewald B, Subburaju S, Barzaghi C, Le Guyader S, Chan J, Jesuthasan S. EphrinB2a in the zebrafish retinotectal system. J Neurobiol. 2004;59:57–65. doi: 10.1002/neu.10340. [DOI] [PubMed] [Google Scholar]
- Westerfield M. The zebrafish book. Eugene, OR: University of Oregon; 1995. [Google Scholar]
- Wurtz RH, Albano JE. Visual-motor function of the primate superior colliculus. Annu Rev Neurosci. 1980;3:189–226. doi: 10.1146/annurev.ne.03.030180.001201. [DOI] [PubMed] [Google Scholar]
- Xiang M, Zhou L, Macke JP, Yoshioka T, Hendry SH, Eddy RL, Shows TB, Nathans J. The Brn-3 family of POU-domain factors: primary structure, binding specificity, and expression in subsets of retinal ganglion cells and somatosensory neurons. J Neurosci. 1995;15:4762–4785. doi: 10.1523/JNEUROSCI.15-07-04762.1995. [DOI] [PMC free article] [PubMed] [Google Scholar]
- Zong H, Espinosa JS, Su HH, Muzumdar MD, Luo L. Mosaic analysis with double markers in mice. Cell. 2005;121:479–492. doi: 10.1016/j.cell.2005.02.012. [DOI] [PubMed] [Google Scholar]