

Abstract
Efficient behavior requires that internally specified motor plans be integrated with incoming sensory information. Motor preparation and visual signals converge in the intermediate and deep layers of the superior colliculus (SC) to influence saccade planning and execution; however, the mechanism by which these sometimes conflicting signals are combined remains unclear. We studied this issue by presenting visual distractors as monkeys prepared saccades toward an upcoming target whose timing and location were fully predictable. Monkeys made more distractor-directed errors when the spatial location of visual distractors more closely coincided with the saccadic goal. Concomitant pretarget activity of SC visuomotor neurons, whose response fields were centered on the saccadic goal, was similarly increased by the presentation of nearby distractors and inhibited by the presentation of distant distractors. Finally, subthreshold microstimulation of the SC shifted the pattern of distractor-directed errors away from the saccadic goal toward that specified by the site of stimulation. Together, our results suggest that the likelihood of saccade generation is influenced by the spatial register of internal motor preparation signals and external sensory signals across the topographically organized SC map.
Keywords: saccade, superior colliculus, motor preparation, motor control, sensorimotor integration, target selection
Introduction
Athletes employ deceptive feints in an effort to lure their opponents into choosing a particular action among many possible alternatives. These ploys can become overwhelmingly effective in eliciting a response, however, when an opponent is preparing only one course of action. For example, before the ball is put in play, a runner in baseball and a lineman in American football are preparing the motor programs necessary for lunging forward to steal a base and initiate a tackle, respectively. Rules in both sports deter the opposing team from unfairly triggering these actions with misleading (“balking”) or early (“false start”) sensory cues. Using a behavioral task analogous to these examples, the goal of this study is to uncover some of the principles by which the primate nervous system combines internal plans with incoming sensory stimuli to generate motor behaviors.
Within the visual-saccadic system, it is well established that both the properties of sensory stimuli and internal goals are used to select which of many targets to foveate, yet little is known about how these signals are combined in the neural substrate. Computational models based on a competitive integration mechanism have been able to account for effects on saccadic endpoint, trajectory, and latency that occur when these two classes of signals are combined (Kopecz, 1995; Trappenberg et al., 2001; Usher and McClelland, 2001; Godijn and Theeuwes, 2002).
We hypothesize that the intermediate layers of the superior colliculus (SC) form a neural substrate in which sensory signals and internal goals are integrated for movement selection. SC neurons receive a wide variety of sensory, motor, and cognitive inputs from both cortical and subcortical areas and send commands to the brainstem saccade generating circuitry (Wurtz et al., 2000). Signals associated with the presentation of visual stimuli are encoded as transient bursts of action potentials, whereas the planning of the metrics and timing of upcoming saccades are encoded as low-frequency activity (Glimcher and Sparks, 1992; Dorris et al., 1997; Basso and Wurtz, 1998; Dorris and Munoz, 1998).
To test the functionality of the SC properties outlined above, we trained monkeys on a novel biased distractor task (see Fig. 1) in which both motor preparation and visual signals interact during saccade programming. As monkeys prepared a saccade toward an upcoming target whose location and timing were prespecified, we probed the system with an abrupt onset visual distractor that could appear at one of many locations. We found that the pattern of activity recorded extracellularly from the SC correlated to the pattern of distractor-directed saccadic errors. Furthermore, this pattern of saccadic errors was lawfully affected when SC activity was altered with low-level microstimulation. Together, our results suggest that the selection of saccades is strongly influenced by the spatial register of internal motor preparation signals and external sensory signals across the intermediate layers of the SC map.
Figure 1.

Schematic of biased distractor task. A, Control trial. B, Distractor trial. C, Stimulation distractor trials. D, Spatial presentation of visual stimuli. Gray circles represent the relative locations of possible distractors. The dashed circle represents the approximate spatial extent of an SC saccade-related neuron response field. The green arrow represents a distractor-directed saccade error and red arrow represents a target-directed correct saccade. FP, Fixation point; T, target; D, distractor; Eye, horizontal eye position; Stim, electrical microstimulation; SRT, saccadic reaction time.
Materials and Methods
Subjects and physiological procedures.
We recorded the extracellular activity of single neurons and applied electrical microstimulation in the intermediate layers of the SC of two male rhesus monkeys (Macaca mulatta) weighing between 7.0 and 9.5 kg each. All procedures were approved by the Queen's University Animal Care Committee and complied with the guidelines of the Canadian Council on Animal Care. Animals were under the close supervision of the university veterinarian. Physiological recording techniques as well as the surgical procedures have been described previously (Munoz and Istvan, 1998).
Experimental procedures.
Behavioral paradigms, visual displays, delivery of liquid reward, and storage of both neuronal discharge and eye movement data were under the control of a personal computer running a real-time data acquisition system (REX) (Hays et al., 1982). REX controlled the presentation of the visual stimuli through digital-to-analog converters that moved mirror galvanometers (General Scanning, Watertown, MA) in orthogonal planes. Separate mirrors could independently control the location of a red (5 cd/m2) and a green (0.05 cd/m2) light-emitting diode on the translucent screen in front of the monkey. Horizontal and vertical eye and mirror positions were digitized at 500 Hz. Eye position was sampled at 500 Hz using the magnetic search coil technique. The activity of single neurons was recorded with tungsten microelectrodes (1–2 MΩ at 1 kHz; FHC, Bowdoin, ME) and sampled at 1 kHz.
Behavioral paradigms.
Each experimental session began with target-directed saccades as we searched for neurons in the intermediate layers of the SC. Monkeys were required to fixate a central red fixation point (FP) and then make a saccade to a red target that was presented at various locations on the translucent screen in front of them. The center of response field of the neuron was defined as the location relative to the central FP associated with the most vigorous activity for target-directed saccades.
After a unit was isolated, monkeys performed the biased distractor task, which was composed of randomly interleaved control (20%) and distractor (80%) trials (see Fig. 1). During control trials (see Fig. 1A), monkeys were required to fixate the central FP and make a saccade to a red target that always appeared in the center of the response field of the neuron 300 ms after FP disappearance. Distractor trials (see Fig. 1B) were identical to control trials except that an irrelevant green distractor was presented 100 ms before the red target. Those saccades initiated between 70 and 300 ms after target presentation that ended within the invisible computer controlled window (usually 3 by 3°) surrounding the target were defined as correct saccades and were accompanied by a liquid reward. Saccades initiated between 70 and 170 ms after distractor presentation that ended within an invisible computer-controlled window (usually 3 by 3°) surrounding the distractor were classified as error saccades and were not accompanied by a liquid reward.
On each trial, a single distractor was presented with a 5% probability at one of 16 possible locations by applying amplitude and direction multipliers to the target vector as outlined in Table 1 and shown schematically in Figure 1D. The amplitude multipliers resulted in three hypometric distractors, a distractor at the target location, and three hypermetric distractors. For nine experimental sessions, a distractor was also presented at the central fixation location. The direction multipliers resulted in a circle of distractors surrounding the fixation point at the eccentricity of the target. For each distractor location, between 7 and 12 correct trials in which the saccade was directed to the target were collected within a block of trials. While recording from 17% of the neurons, a second block of trials with larger or smaller amplitude and direction multipliers were used to provide additional resolution of the effects of distractors throughout the visual field (see Fig. 2A).
Table 1.
Multipliers for determining distractor locations relative to target location
| Horizontal multiplier | Vertical multiplier | ||
|---|---|---|---|
| Amplitude series (for biased distractor task) | |||
| Horizontal component of optimal vector | 0a | Vertical component of optimal vector | 0a |
| 0.3 | 0.3 | ||
| 0.6 | 0.6 | ||
| 0.8 | 0.8 | ||
| 1.0 | 1.0 | ||
| 1.3 | 1.3 | ||
| 1.7 | 1.7 | ||
| 2.2 | 2.2 | ||
| Direction mulitpliers (for all conditions) | |||
| Radius of optimal vector | 0.9 | Radius of optimal vector | 0.5 |
| 0.5 | 0.9 | ||
| 0 | 1.0 | ||
| −0.5 | 0.9 | ||
| −1.0 | 0 | ||
| −0.5 | −0.9 | ||
| 0 | −1.0 | ||
| 0.5 | −0.9 | ||
| 0.9 | −0.5 | ||
| Amplitude multipliers (for stimulation-biased distractor task) | |||
| Horizontal component of stimulation vector | 0 | Vertical component of stimulation vector | 0 |
| 0.6 | 0.6 | ||
| 0.8 | 0.8 | ||
| 1.0 | 1.3 | ||
| −0.6 | −0.6 | ||
| −0.8 | −0.8 | ||
| −1.3 | −1.3 | ||
aUsed for nine experimental sessions.
Figure 2.
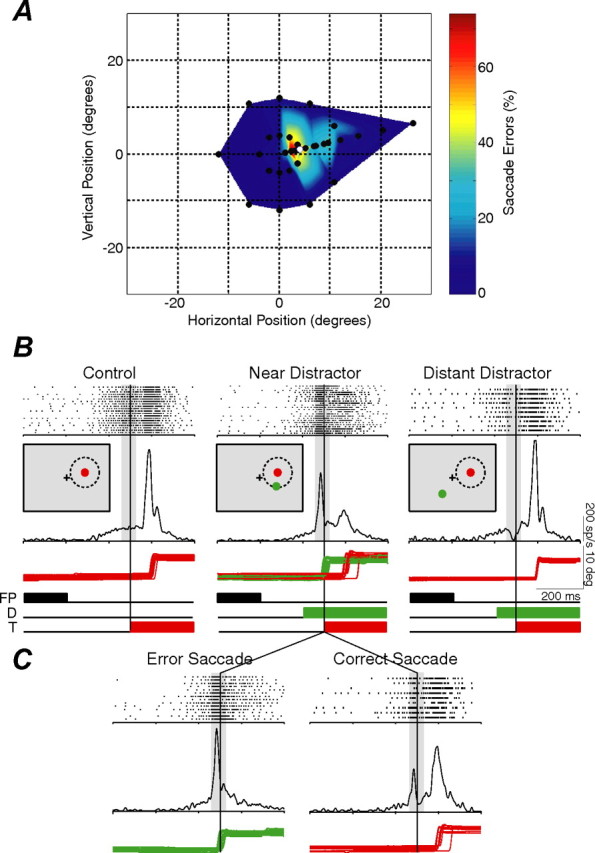
Influence of distractor location on the generation of saccade errors and the activity of a SC saccade-related neuron. A, Distribution of saccade errors directed to distractors throughout the visual field (black circles) relative to the saccade target (white circle). The color map is constructed by extrapolating between nearby distractor locations. B, Activity of a SC saccade-related neuron during the control condition when no distractor was presented (left), during the presentation of a distractor near the target (middle), and during the presentation of a distractor distant from the target (right). Insets, Relative locations of the fixation point (FP; black cross), target (T; red), distractor (D; green), and response field (dashed circle) during each of these conditions. Each tick mark represents the timing of an action potential, and each row of tick marks represents the activity during a single trial. The waveform represents the average postsynaptic activation function for the action potentials for all trials in each condition. The vertical gray bars represent the epoch during which preparatory and visual activity are integrated and represent the period during which neuronal activity is sampled during subsequent analyses. The red and green traces represent horizontal eye position of correct and error saccades, respectively. C, The neuronal activity and eye traces during the near distractor condition were further segregated into error and correct saccades.
Stimulation distractor trials were identical to distractor trials except that low-level microstimulation was applied during 50% of the trials at a location on the SC saccadic map at the mirror image location relative the target (see Fig. 1C), and the distractor locations differed slightly to provide additional resolution near the site of the stimulating electrode (Table 1). After mapping the response field of an SC neuron, stimulation was then applied through the same electrode (150 ms duration, 300 Hz, 0.3 ms biphasic pulses) while the monkey fixated the central fixation point to induce saccades. The stimulation vector was determined by increasing stimulation current until the saccadic amplitude saturated. In all cases, the stimulation vector was in close agreement with the response field as measured during neuronal recording. Stimulation frequency and current strength together were reduced to subthreshold levels such that stimulation by itself never induced a saccade. Currents ranged from 20 to 39 μA and frequencies ranged from 100 to 170 Hz. The frequency of stimulation was at the high end, but within the physiological range, of pretarget activity recorded during the biased distractor task (e.g., the neuron in Fig. 4B fires at a mean level of 130 Hz during this interval during control trials). Stimulation began at the time of distractor presentation and lasted 150 ms. Stimulation ended 50 ms after target presentation, which was before target-related information reached saccade-related neurons in the SC as measured during our neuronal recordings.
Figure 4.
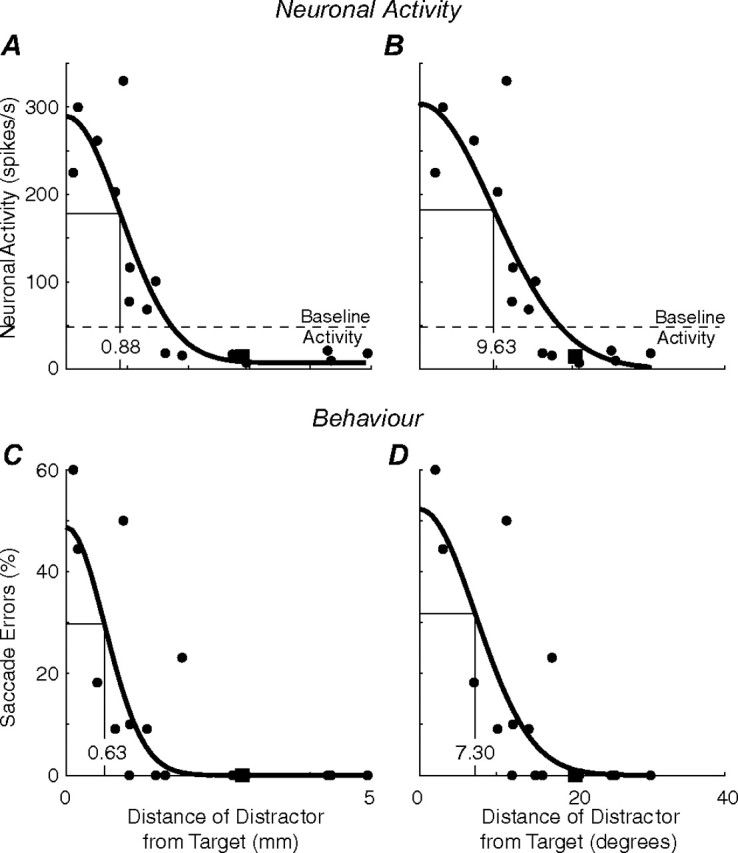
Neurometric and psychometric functions constructed from a single experimental session. A, B, Neurometric functions. Neuronal activity as a function of the distance of the distractor from the target plotted in SC space (A) and visual space (B). The average baseline activity during control trials in which no distractor was presented is denoted by the horizontal dashed line. C, D, Psychometric functions. The percentage of error saccades as a function of the distance of the distractor from the target plotted in SC space (C) and visual space (D). Each datum point is the average of the trials with the same distractor location. The square data points represent the case when the distractor was presented at central fixation. The thick black lines represent the Gaussian fits to these data (see Materials and Methods). The thin black lines with inset numbers represent the tuning width of each Gaussian.
Data analysis.
Computer software determined the beginning and end of each saccade using velocity and acceleration threshold and template matching criteria. These events were verified by an experimenter to ensure accuracy. To quantify neuronal activity, each spike train was convolved with a postsynaptic activation function with a rise time of 1 ms and a decay time of 20 ms (Hanes et al., 1995). For the biased distractor task, we were interested in the effect of the distractor on low-level activity present before target appearance. The effect of the presentation of the distractor on neuronal activity was quantified as follows:
where Dact was the highest (for increased activity) or lowest (for decreased activity) level in the postsynaptic activation function 70–120 ms after distractor presentation and Cact was the average level of activity during this same epoch during the control condition in which no distractor was presented.
Similarly, the effect of the distractor at each location on the generation of saccadic errors was quantified as follows:
 |
We were also interested in comparing the extent and distribution to which distractors presented at locations within the visual field affected both neuronal activity and behavior. To determine the variation in neuronal activity or behavior with distractor location, the level of response as a function of distractor location was fit with a Gaussian function of the form
where response (R) as a function of location (ϕ) [in degrees from the center of the response field of the neuron (see Fig. 4)] depended on the baseline discharge rate (B), maximum discharge rate (M), optimum location (Φ), and directional tuning (TΦ) (Bruce and Goldberg, 1985; Schall et al. 1995).
To convert degrees of visual space into millimeters of SC space, we used an established logarithmic mapping function of the SC (Ottes et al., 1986) that allowed us to compare the distribution of neuronal activity and behaviors in the same coordinate frame.
where u is the anatomic distance from the SC foveal representation measured along the horizontal meridian (in millimeters), S is scaling constant determining the size of the SC map along its u axis (in millimeters), A is another constant that determines the shape of the mapping (in degrees), and R is the retinal eccentricity of the optimal saccade amplitude (in degrees). The constants were set at the following values: A = 3.0, and S = 1.4.
Neuronal classification.
To be included in our analysis, SC neurons were required to display the following: (1) a transient burst of activity that was time locked to the presentation of the target in the center of the response field of the neuron during control trials. We labeled this activity “visual” because it was aligned to the onset of the presentation of stimuli in the response field of the neuron, although we are cognizant that this burst of activity has the potential to trigger a saccade if robust enough (Edelman and Keller, 1996; Dorris et al., 1997). This increase in activity had to occur <100 ms after target presentation and reach a rate of at least 50 spikes/s above the baseline at fixation (the 100 ms preceding fixation point disappearance); (2) early, pretarget activity during the end of the gap period (50 ms before to 50 ms after target presentation) on control trials that was significantly greater than the baseline at fixation (paired t test, p < 0.01); and (3) saccade-related activity >100 spikes/s for saccades into the center of the response field of the neuron.
Results
We recorded the activity of 100 neurons from four SC of two monkeys during the biased distractor task (Fig. 1A,B). Of these, we collected sufficient data from 28 neurons (monkey A, 12 neurons; monkey B, 16 neurons) that met our criteria for inclusion (see Materials and Methods). The majority of excluded neurons were excluded because they lacked early, pretarget activity. Neurons coded for saccadic vectors ranging from 1.5 to 30° in eccentricity.
Combining visual and preparatory processes to influence saccade generation and SC activity
During each experimental session, a certain proportion of saccades were “captured” by the presentation of the visual distractors (i.e., error saccades) (Sommer, 1994; Theeuwes et al., 1998) rather than being directed toward the prespecified saccadic goal (i.e., correct saccades). The distribution of error saccades as a function of the location of distractors in the visual field (black circles) is shown for a typical experimental session in Figure 2A. Error saccades were not captured by all distractor locations equally but were instead directed preferentially toward distractors presented near rather than distant from the location of the upcoming target (white circle). We reasoned that this pattern of saccade errors reflected the manner in which transient activity aligned to the presentation of the distractors interacted with preexisting saccade preparation activity within the visuomotor circuitry.
To characterize how these visual and preparatory signals interact, we recorded the activity of SC visuomotor neurons as monkeys performed this task. Like the pattern of saccadic errors, SC neuronal activity was not influenced by distractors presented at all locations equally. Neuronal activity and the corresponding horizontal eye position traces are shown during control trials (i.e., no distractor presented) and during distractor trials when the distractor was presented near or distant to the location of the upcoming saccadic target (Fig. 2B). Removal of the fixation point resulted in an increase in activity in saccade-related neurons across the SC map because its removal acts both as a warning signal and causes the release of active fixation (Munoz and Wurtz, 1995; Dorris et al., 1997). Beyond this generalized increase in SC activity resulting from fixation point removal, here we are concerned with spatially localized increases that vary with foreknowledge of the timing and location of upcoming saccadic targets (Dorris and Munoz, 1998). Indeed, a high level of preparatory activity associated with the target-directed saccade is supported by the behavioral observation that nearly all correct saccades were initiated with extremely short reaction times (∼100 ms), in the range of express saccades (Paré and Munoz, 1996; Dorris et al., 1997). We hypothesize that the activity we record from the SC associated with the target vector will reflect the manner in which saccade preparatory signals and visual signals interact across the SC map and that these interactions should correlate with the observed patterns of saccadic errors.
Distractors presented near the target (Fig. 2B, middle) resulted in both distractor-directed error saccades (green eye traces) and target-directed correct saccades (red eye traces). These two types of saccades were reflected in two peaks of neuronal activity: the first associated with the presentation of the distractor and the second associated with the presentation of the target. Segregating this neuronal activity based on whether it was associated with an error or correct saccade (Fig. 2C) uncovered the differential response of this neuron under these two conditions. Error saccades (Fig. 2C, left) had one peak of activity equally aligned on both the presentation of the distractor and the generation of the express saccade to the distractor (Edelman and Keller, 1996; Dorris et al., 1997). Conversely, correct saccades had two peaks of neural activity, an initial distractor-aligned peak and a second peak equally aligned on the presentation of the target and the generation of the saccade to the target. The results from the near distractor suggest that an error saccade was triggered only if activity surpassed a certain threshold level of activity on SC visuomotor neurons (Hanes and Schall, 1996; Dorris et al., 1997). Indeed, when distractors were presented in the center of the response field for all neurons (i.e., at the target location), the distractor-aligned peak was higher for error saccades (225 ± 21 spikes/s) than for correct saccades (174 ± 20 spikes/s) (paired t test, p < 0.001, n = 21 neurons with a sufficient number of correct and error saccades).
The presentation of distractors at locations distant from the response field of the recorded neuron led to a transient drop in the level of pretarget activity (Fig. 2B, right, gray bar). In this case, no error saccades were triggered toward the distractor. Although activity was not directly measured on the SC map at these distant sites, evidence suggests that saccade errors were not triggered toward distractors presented at these locations because there would be little pretarget activity associated SC locations distant from the prespecified saccadic goal (Dorris and Munoz, 1998).
Correlation between neuronal activity and the proportion of saccade errors
To understand further how saccade preparation and visual signals were combined to influence behavior, we tested whether there was a correlation between SC neuronal activity and the proportion of saccadic errors. The change in pretarget activity associated with the presentation of the distractor at each location in the visual field was calculated for each neuron, as was the proportion of saccade errors directed to each distractor location. The peak (or valley) of activity was sampled 70–120 ms after distractor presentation for each distractor location and normalized to the mean level of control activity during this same epoch (Fig. 2B, gray bars) (control condition). Finally, both neuronal activity and saccadic errors were plotted in the same coordinates of collicular space to allow for their direct comparison (see Materials and Methods). This analysis revealed that near distractors elicited neuronal activity, and distant distractors inhibited neuronal activity (Fig. 3A) in a manner that mirrored the distribution of saccadic errors (Fig. 3B). For this neuron, there was a statistically significant correlation between the proportion of saccadic errors and neuronal activity (Fig. 3C) (r = 0.77; p < 0.01). In fact, all neurons displayed a positive correlation for this comparison, with 19 of 28 neurons displaying statistically significant correlations (p < 0.01) (Fig. 3D, gray bars). The mean correlation coefficient for the sample of neurons was 0.52, which was significantly different from zero (p < 0.001).
Figure 3.

Correlation between neuronal activity and saccade errors. A, B, Influence of distractor location on neuronal activity normalized to control activity (A) and the proportion of saccade errors (B). Same conventions as Figure 2A are shown, except data are transformed into millimeters of SC space rather than degrees of visual space (see Materials and Methods). C, Correlation between normalized neuronal activity and saccade errors for the same experimental session shown in A and B. Each datum point represents the percentage of saccade errors directed toward a distractor presented at a given location. The black line represents the linear least-square regression fit to this data. D, Histogram of correlation coefficients for the sample of 28 neurons. Those neurons whose activity showed a statistically significant correlation with saccade errors are filled gray.
Spatial interactions of saccade preparation and visual signals
Our next goal was to compare the spatial interactions between preparatory and visual signals observed in both neuronal activity and behavior. However, the influence of distractors on neuronal activity was measured in millimeters of SC, whereas the influence of distractors on saccade errors was measured in degrees of visual space. Therefore, to compare these parameters, it was necessary to generate neurometric and psychometric functions that are expressed in comparable coordinate frames.
To accomplish this, behavior and neuronal activity were plotted as a function of the distance of the distractor from the target, expressed in both degrees of visual space and millimeters of SC space. The distractor-associated variability in both behavior and neuronal activity was well described by a Gaussian function (see Materials and Methods) in both coordinate frames as exemplified in a representative experimental session [R2 = 0.79 (Fig. 4A); R2 = 0.74 (B); R2 = 0.60 (C); R2 = 0.63 (D); all p < 0.01]. For the remaining analyses, only the 20 experimental sessions in which the location of the distractors resulted in sufficient sampling to allow our optimization routine to converge to a satisfactory Gaussian solution are included. Although the data were fit reasonably well by a Gaussian function, it is plausible that we were “over-fitting” data that was adequately fit with a simpler linear function. To rule out this possibility, we compared the quality of fit of these functions using the model selection criterion (MSC) statistic, which is derived from Akaike's Information Criterion (Akaike, 1973; Sakamoto et al., 1986). This statistic compares the quality of fit of competing models to experimental data by relating the coefficient of determination to the number of free parameters. Although a Gaussian function would be expected to account for more variability in the observed data because it has four free parameters (see Eq. 3) compared with two for a linear function, the MSC statistic gauges whether this extra complexity is warranted. Indeed, more variability was accounted for across these 20 experimental sessions by Gaussian compared with linear functions [mean R2 Gaussian vs linear (reported in the same order as Fig. 4), 0.67 vs 0.55; 0.52 vs 0.47; 0.60 vs 0.45 and 0.59 vs 0.46; p < 0.05 in all cases]. Moreover, despite more free parameters, the MSC statistic associated with the Gaussian fits were greater than for the linear fits in 60% of the experimental sessions, suggesting the Gaussian was a superior model. These results are consistent with previous findings that have shown that Gaussian functions describe the interactions between multiple visual stimuli in saccade-related brain areas (Bruce and Goldberg, 1985; Schall et al., 1995).
Having the data represented in a comparable format allowed us to test the hypothesis that visual and saccade preparation signals are combined as a function of the distance separating them in the SC (i.e., millimeters of neural tissue). Convenient shorthand for expressing the volume of neural activity or visual space activated during this integration process is the tuning width of the Gaussians (Fig. 4). The logarithmic representation of visual and saccadic space in the intermediate layers of the SC (see Materials and Methods) (Ottes et al., 1986; Robinson, 1972) should translate into differences in the tuning width of these interactions across the visual field that will be tested below.
First, we tested whether neuronal tuning widths varied with the location of the saccadic goal. The tuning widths of neuronal activity remained relatively constant, at 0.88 ± 0.05 mm of SC space, as the location of the saccadic target (or equivalently, the center of the response field of the neuron) increased in eccentricity (Fig. 5A) [r = −0.25, Fisher's r to z test, not significant (n.s.)]. When these neuronal tuning widths were represented in degrees of visual space, however, there was a significant positive correlation with target location across the visual field (Fig. 5B) (slope, 0.57; r = 0.85; p < 0.01). Therefore, neuronal tuning widths appear to activate a constant volume of neural tissue in the SC, which, because of the logarithmic scaling of the SC map, translates into increasing representation of the affected visual field with larger eccentricities.
Figure 5.
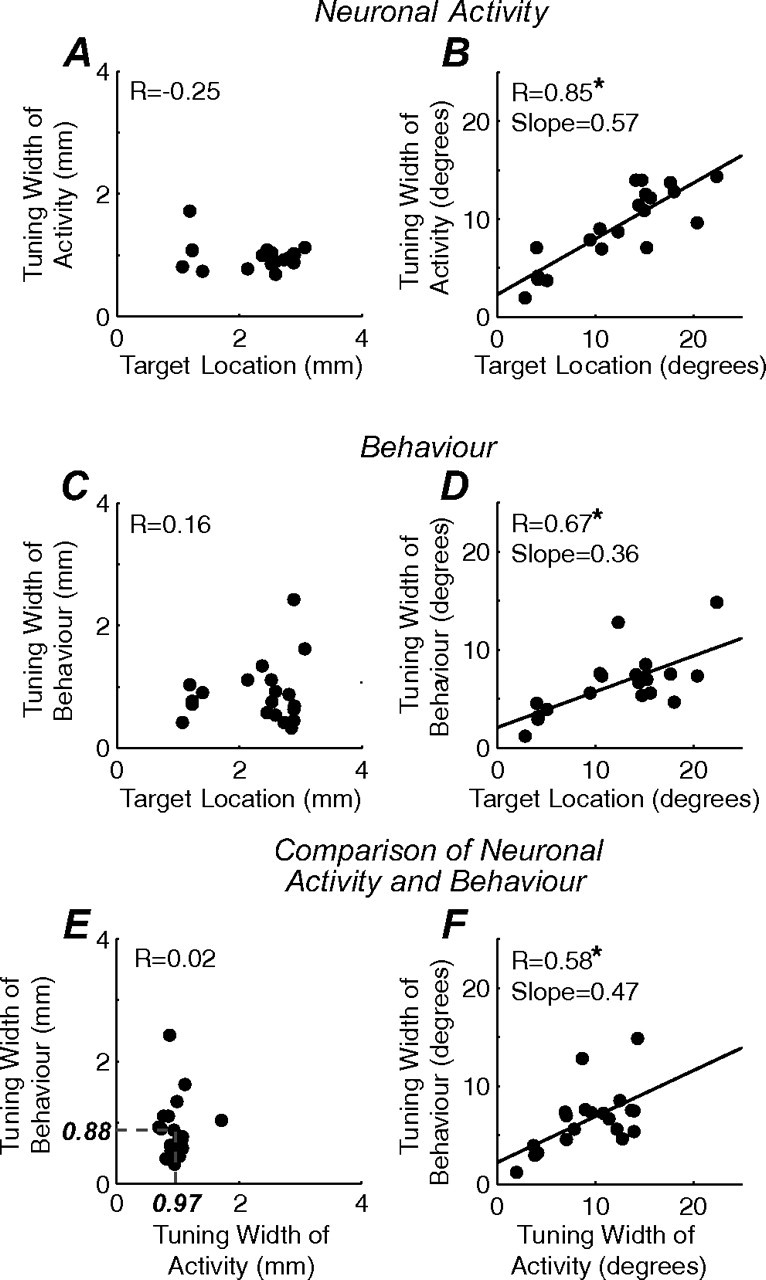
Comparison of neurometric and psychometric tuning widths across SC and visual space for all sessions. A, B, Neuronal tuning widths as a function of target location in SC (A) and visual (B) space. C, D, Psychometric tuning widths as a function of target location in SC (C) and visual (D) space. Each datum point represents the tuning width of neuronal activity or behavior collected from a single experimental session. The black lines represent the linear least-square regressions. Statistically significant regressions (p < 0.01) are denoted with an asterisk. E, F, Comparison of neurometric and psychometric functions in common coordinate frames. E, A relatively constant volume of neuronal activity (mean tuning width, 0.97 mm) and saccadic errors (mean tuning width, 0.88 mm) was activated by distractors when plotted in SC space. F, The tuning widths of neuronal activity and behavior covary when plotted in visual space.
Second, we tested whether the behavioral tuning widths varied with the location of the saccadic goal. The results mimicked those found with neuronal tuning widths. When plotted in SC space, the behavioral tuning widths remained relatively constant at 0.97 ± 0.11 mm as the location of the target varied across the visual field (Fig. 5C) (r = 0.16, n.s.). When the same behavioral tuning widths were plotted in visual space, there was a significant positive correlation with target location across the visual field (Fig. 5D) (slope, 0.36; r = 0.67; p < 0.01). These patterns of behavioral tuning widths are again compatible with an underlying mechanism whereby a constant volume of tissue is activated across the logarithmic representation of the SC map.
Finally, we compared directly the neurometric and psychometric functions in the same coordinate frames. If visual and motor preparation signals are integrated at the level of the SC in a manner that impacts behavior, both neurometric and psychometric functions must be related when plotted in the same coordinate frames. Indeed, when represented in SC space, neuronal and behavioral tuning widths remained relatively constant, and these distributions did not differ from each other (Fig. 5E) (r = 0.02, n.s.; paired t test, n.s.). When represented in visual space, neuronal and behavioral tuning widths covaried (Fig. 5F) (slope, 0.47; r = 0.58; p < 0.01). This correspondence between neurometric and psychometric functions suggests that visual and motor preparation signals are combined to activate a constant volume of collicular tissue, which translates into behavioral effects that scale with the eccentricity of the saccadic goal.
Direct test of SC involvement in saccade selection
Although we demonstrated correlations between the level and distribution of SC neuronal activity and saccadic behaviors during the integration of visual and motor preparation signals, these correlations do not establish a causal link between this neuronal activity and behavior. Receptive fields that are Gaussian-shaped and whose size scale with target eccentricity are fairly ubiquitous features in brain areas involved in visuosaccadic processing. Therefore, to establish a causal link that changes in baseline activity within the intermediate layers of the SC are involved in the observed behavior, we used a stimulation-biased distractor task (Fig. 1C). This task was nearly the same as the biased distractor task (for details, see Materials and Methods and Table 1), except that randomly, on half of the trials, low-frequency, subthreshold microstimulation was applied to the SC intermediate layers at a location coding a saccadic vector that was the mirror image of the prespecified saccadic goal. This microstimulation was meant to mimic the low-frequency preparatory activity recorded from neurons in advance of the highly predictable saccadic target during the biased distractor task (Fig. 2B, pretarget activity) at a distant SC site to determine whether this influenced the pattern of error saccades.
We hypothesized that the observed pattern of saccadic errors during the biased distractor task resulted, in large part, from the pattern of activation across the SC map resulting from the integration of motor preparation and visual signals. Two predictions follow from this hypothesis that can be tested with the stimulation-biased distractor task. First, during stimulation trials, the number of saccadic errors should increase to distractors presented near the location specified by the site of stimulation because the distractor-related burst of activity can summate with the stimulation-induced activity to more easily surpass saccadic threshold. A second prediction, which would provide support for the SC being actively involved in the process of competitive integration, is that the proportion of saccade errors should decrease toward distractors presented near the target during stimulation trials. That is, not only should neurons near the electrode be activated by the stimulation, but stimulation would also inhibit the distant SC activity associated with preparing the target-directed saccade.
The results from these stimulation experiments fulfill these predictions. Figure 6 shows the effects of stimulation on the pattern of saccadic errors during a single experimental session for a stimulation site coding a saccadic vector of 4° right and 1° up. The percentage of error saccades directed to the distractor is plotted in SC coordinates. However, during nonstimulated distractor trials (Fig. 6A), error saccades were directed toward distractors presented near the target location. During stimulation trials (Fig. 6B), the proportion of error saccades directed toward distractors presented near the stimulation site increased, and the proportion directed toward the prespecified goal decreased. Critically, these saccade errors were not caused solely by the application of stimulation because saccades were not triggered toward the stimulation vector in the absence of a distractor (i.e., during control trials with stimulation). These results suggest that stimulation increased the low-frequency SC activity surrounding the electrode, but additional visual input provided by the presentation of the distractor was necessary to ultimately surpass saccadic threshold.
Figure 6.

Application of subthreshold microstimulation affects the distribution of saccadic errors. A, B, Influence of distractor location on the pattern of saccade errors during interleaved distractor (A) and stimulation distractor (B) trials during a single experimental session. The gray circle represents the location of the stimulation electrode (gray triangle) within the SC determined by the vector of the saccade elicited by suprathreshold stimulation. Note the different scaling of the color maps in A and B.
This stimulation-biased distractor task was performed at 18 stimulation sites in four SCs of three monkeys. At 10 of those sites, both sufficient data were obtained and stimulation was presumed to be subthreshold because of the absence of stimulation-induced saccades during control trials in which no distractor was presented. More saccadic errors were directed to the distractor presented near the site of the stimulating electrode during stimulation (27.5 ± 4.8%) than nonstimulation (11.2 ± 6.5%) trials (paired t test, p < 0.001). The percentage of error saccades directed toward distractors presented near the stimulating electrode on stimulation trials (27.5 ± 4.8%) was less than was directed to distractors presented near the target location during nonstimulation (73.0 ± 9.4%) trials (p < 0.001). This observation likely was the result of microstimulation-induced activity that did not mimic precisely endogenous preparatory activity in the SC; microstimulation itself is artificial in nature, and we used fairly conservative stimulation parameters (see Materials and Methods). Finally, there were more saccade errors directed toward the distractor presented at the target location during nonstimulation (73.0 ± 9.4%) than stimulation (25.9 ± 9.4%) trials (p < 0.001). Overall, the results from these stimulation experiments extend our neurophysiological findings to provide causal evidence that the pattern of visual and preparatory signals within the SC influence saccadic behaviors and that the SC is involved in the network that competitively integrates these signals.
Discussion
Our results demonstrate the functional role of the SC in integrating visual and motor preparation signals to select among possible saccadic eye movements. Monkeys performed a task involving strong saccadic preparation attributable to the fact that the timing and location of the target was fully predictable throughout a block of trials (Dorris and Munoz, 1998). Abrupt onset visual distractors presented before the upcoming target were used to index this otherwise covert saccadic preparatory process at a given location in the visual field by its ability to trigger erroneous saccades. These preparatory and visual signals interacted at the collicular level to influence saccadic generation as evidenced by the correlation between the patterns of distractor-associated neuronal activity and distractor-directed saccade errors. The functional role of the SC during the saccade selection process was further illustrated by the altered pattern of saccadic errors resulting from collicular subthreshold microstimulation. Microstimulation shifted errors away from distractors presented near the saccadic goal and toward distractors presented near the location encoded by the site of stimulation. Together, we conclude that the degree of overlap between saccadic preparation and visual signals within the intermediate layers of the SC strongly influences the saccade selection process and that the SC is involved in the network that competitively integrates these signals.
Saccade preparation biases saccade target selection
These experiments highlight the powerful biasing influence that ongoing saccade preparation can exert on the processes underlying saccade target selection. Previous evidence of competitive integration processes during saccade generation comes primarily from studies in which multiple visual stimuli (a target among one or more distractors) are presented simultaneously (Schall and Hanes, 1993; McPeek and Keller, 2002; McPeek et al., 2003). Competitive integration between multiple stimuli can modify ongoing saccadic commands through changes in endpoints, latency, and curvature of trajectories (Walker et al., 1997; Edelman and Keller, 1998; Gold and Shadlen, 2000; Godijn and Theeuwes, 2002; McPeek et al., 2003). The design of such visual search tasks essentially negates any influence of preparatory processes on target selection because the locations of the distractors and targets are randomized from trial to trial. Even then, small biases can be observed in perceptual and motor processes, as evidenced by the effect that previous trials and experimental sessions have on subsequent neuronal activity and behaviors (Bichot and Schall, 1999; Dorris et al., 2000; Fecteau et al., 2004; Fecteau and Munoz, 2003). Instead of minimizing these biasing effects, the current experimental task maximizes them by making the timing and location of the upcoming target fully predictable (Dorris and Munoz, 1998; Sommer, 1994; van Zoest et al., 2004). Unlike competition between visual signals, which influence parameters related to ongoing saccades, preparatory signals influence the preexisting baseline activity to affect whether a visual stimulus will trigger a saccade in the first place (Dorris et al., 1997). Although extreme in its degree, we argue that the current study describes the neural mechanisms underlying a more ubiquitous and naturalistic form of competitive integration, in which visual stimuli and internal goals both contribute to the generation of behavior rather than a situation in which multiple visual stimuli simultaneously pop into existence without previous expectations.
Temporal and spatial interaction of visual and saccade preparation signals
Our results provide important information regarding the timing of the interaction between visual and saccade preparation signals on the SC map. Preparatory signals in the SC are known to have slow onset times and can be maintained for several seconds during delay periods (Glimcher and Sparks, 1992; Dorris et al., 1997; Basso and Wurtz, 1998; Fecteau et al., 2004). Conversely, abrupt onset visual stimuli result in a burst of activity on SC visuomotor neurons lasting ∼50 ms that is putatively related to the transient facilitation of attention, saccadic eye movements, and saccadic trajectories that occur toward its location (Jonides and Yantis, 1988; Theeuwes et al., 1999; McPeek et al., 2003; Fecteau et al., 2004). Under the conditions used here, the interaction between preparation and visual signals appears to last only as long as the burst of SC visuomotor neuron activity related to the presentation of the distractor. Distractor-directed errors have very short SRTs, which show little variability consistent with the proposition that this sensory burst of activity can act as a saccadic trigger directly (Edelman and Keller, 1996; Dorris et al., 1997). When the distractor did not trigger an erroneous saccade, neuronal firing rate quickly rebounded from the distractor-induced excitation/inhibition to resume a similar pattern of activity seen during control trials (Fig. 2B). This resumption of SC neuronal activity was also reflected in the SRTs of target-directed saccades after distractor presentation (mean SRT for target-directed saccades during distractor trials, 119.4 ± 4.4 ms), which did not differ significantly from those in which no distractor was presented (mean SRT during control trials, 132.1 ± 7.3 ms) (t test, p = 0.14, n = 26). Previous work from our laboratory, however, has shown that excitatory or inhibitory processes can develop in the SC with longer asynchronies between distractor and target depending on whether the distractor is predictive or unpredictive, respectively, of where the target will be presented (Dorris et al., 2002; Fecteau et al., 2004).
By presenting distractors at many locations relative to the prespecified saccadic goal, we have demonstrated how visual and preparatory signals are spatially combined within the SC. The strength of the interaction was strongly excitatory when these signals were spatially coincident (near), switching to inhibitory as these signals became spatially disparate (distant). The Gaussian tuning widths that described these interactions maintained a relatively constant size in collicular space but increased with eccentricity when calculated in visual space (Fig. 5), consistent with the logarithmic scaling of saccadic vectors on the SC map (Ottes et al., 1986, Robinson, 1972). The tuning width of the Gaussians that describe the interaction of preparatory and visual signals within the SC (∼0.97 mm) is in close agreement with estimates of the amount of SC activated by the presentation of a single visual stimulus (Munoz and Wurtz, 1995; Rodgers et al., 2004; Saito and Isa, 2004).
Furthermore, these experiments provide evidence against another form of competitive integration proposed to occur preferentially between rostrally located fixation neurons and more caudally located saccade neurons in the SC. This extended fixation zone hypothesis proposes that distractors exert their behavioral effects by activating fixation neurons when presented at locations up to 10° eccentric from central fixation that, in turn, inhibit SC saccade-related neurons (Walker et al., 1997; Gandhi and Keller, 1999). However, we showed that distractors presented beyond 10° can inhibit SC saccade preparatory activity as long as their location on the SC map is sufficiently distant from the recorded neuron (Fig. 4A,B). In fact, there was no difference between the mean firing rate of neurons when a distractor was presented at fixation (31.9 ± 11.9 spikes/s) compared with when an eccentric distractor was presented at a comparable distance from the neuron on the SC map (31.2 ± 13.4 spikes/s; paired t test, p = 0.78, n = 9) (Fig. 4A, square vs nearest circle).
A causal role of the SC in saccade selection
Our microstimulation experiments (Fig. 6) demonstrate that low-level SC activity is causally involved in selecting saccadic targets and that selection for one target necessarily inhibits the selection of distant targets. Subthreshold microstimulation resulted in an increase in the proportion of distractor-directed saccade errors toward the location represented by the stimulating electrode. Although this result suggests that low-level activity on the SC map is causally involved in selecting the vector for a saccade (Glimcher and Sparks, 1993), it does not address the issue of competitive integration. However, subthreshold microstimulation also resulted in a decrease in the proportion of saccadic errors toward distractors presented near the prespecified saccadic goal. If there was no competition, both saccadic plans could develop independently, resulting in saccadic errors directed toward the locations represented by both the stimulating electrode and saccadic goal. These results, together with those demonstrating that microstimulation and pharmacological interventions of the SC alter ongoing saccadic trajectories (Quaia et al., 1998; McPeek and Keller, 2003) and goals (Carello and Krauzlis, 2004), indicate a causal role for the SC in the competitive processes involved in the selection and execution of saccades.
Does the competitive integration between sensory and preparatory signals observed here arise through nearby excitatory and distant inhibitory connections locally within the SC itself or through the external pattern of excitatory and inhibitory that impinges on the SC? A within-SC mechanism is supported by collicular microstimulation experiments that induce nearby excitation (McIlwain, 1982) and distant inhibition (Meredith and Ramoa, 1998; Munoz and Istvan, 1998) as recorded within the SC. Moreover, local competitive integration mechanism has been the foundation of a number of successful models of SC-mediated saccade generation (Van Opstal and Van Gisbergen, 1989; Arai et al., 1994; Trappenberg et al., 2001). An extrinsic SC mechanism is supported by in vitro rodent work combining photostimulation using caged glutamate and whole-cell patch-clamp recordings (Ozen et al., 2004; Lee and Hall, 2006). These studies avoid the potential problem of stimulating fibers of passage inherent in in vivo experiments. These experiments failed to find evidence for nearby excitation or distant inhibition across the intermediate layers of the SC. Other in vivo work involving pharmacological activation of the intermediate SC resulted in facilitation of saccadic behaviors associated with the affected site, but there was no evidence for distant collicular inhibition (Watanabe et al., 2005). Therefore, the competitive integration observed both physiologically and behaviorally here may be substantiated through collicular–cortical loops (Sommer and Wurtz, 2004a,b; Wurtz and Sommer, 2004), possibly involving the substantia nigra pars reticulata (Hikosaka et al., 2000). Although the issue of whether competitive integration arises locally or extrinsic to the SC remains in question, the current experiments clearly demonstrate that the resultant SC activity is shaped by competitive integration of preparatory and visual signals in a manner that is closely correlated to saccadic behavior. Moreover, we conclude that this SC activity is not simply correlational to, but is a functional part of, this behavior-generating circuit because low-level microstimulation of the SC alters the pattern of subsequent saccades.
Footnotes
This work was supported by Canadian Institutes of Health Research operating and group grants (to D.P.M. and M.C.D.). Both D.P.M. and M.C.D. hold Canadian Research Chairs. E.O. and M.C.D. were supported by a short-term fellowship and career development award from the Human Frontier Science Program, respectively. We thank A. Lablans, S. Hickman, F. Paquin, and S. Hickman for technical assistance.
References
- Akaike H. Information theory and an extension of the maximum likelihood principle. In: Petrov BN, Csazi F, editors. Second international symposium of information theory. Budapest: Akademiai Kiado; 1973. [Google Scholar]
- Arai K, Keller EL, Edelman JA. Two-dimensional neural network model of the primate saccadic system. Neural Netw. 1994;7:1115–1135. [Google Scholar]
- Basso MA, Wurtz RH. Modulation of neuronal activity in superior colliculus by changes in target probability. J Neurosci. 1998;18:7519–7534. doi: 10.1523/JNEUROSCI.18-18-07519.1998. [DOI] [PMC free article] [PubMed] [Google Scholar]
- Bichot NP, Schall JD. Effects of similarity and history on neural mechanisms of visual selection. Nat Neurosci. 1999;2:549–554. doi: 10.1038/9205. [DOI] [PubMed] [Google Scholar]
- Bruce CJ, Goldberg ME. Primate frontal eye fields. I. Single neurons discharging before saccades. J Neurophysiol. 1985;53:603–635. doi: 10.1152/jn.1985.53.3.603. [DOI] [PubMed] [Google Scholar]
- Carello CD, Krauzlis RJ. Manipulating intent: evidence for a causal role of the superior colliculus in target selection. Neuron. 2004;43:575–583. doi: 10.1016/j.neuron.2004.07.026. [DOI] [PubMed] [Google Scholar]
- Dorris MC, Munoz DP. Saccadic probability influences motor preparation signals and time to saccadic initiation. J Neurosci. 1998;18:7015–7026. doi: 10.1523/JNEUROSCI.18-17-07015.1998. [DOI] [PMC free article] [PubMed] [Google Scholar]
- Dorris MC, Paré M, Munoz DP. Neuronal activity in monkey superior colliculus related to the initiation of saccadic eye movements. J Neurosci. 1997;17:566–579. doi: 10.1523/JNEUROSCI.17-21-08566.1997. [DOI] [PMC free article] [PubMed] [Google Scholar]
- Dorris MC, Paré M, Munoz DP. Immediate neural plasticity shapes motor performance. J Neurosci. 2000;20(RC52):1–5. doi: 10.1523/JNEUROSCI.20-01-j0005.2000. [DOI] [PMC free article] [PubMed] [Google Scholar]
- Dorris MC, Klein RM, Everling S, Munoz DP. Contribution of the superior colliculus to inhibition of return. J Cogn Neurosci. 2002;14:1256–1263. doi: 10.1162/089892902760807249. [DOI] [PubMed] [Google Scholar]
- Edelman JA, Keller EL. Activity of visuomotor burst neurons in the superior colliculus accompanying express saccades. J Neurophysiol. 1996;76:908–926. doi: 10.1152/jn.1996.76.2.908. [DOI] [PubMed] [Google Scholar]
- Edelman JA, Keller EL. Dependence on target configuration of express saccade-related activity in the primate superior colliculus. J Neurophysiol. 1998;80:1407–1426. doi: 10.1152/jn.1998.80.3.1407. [DOI] [PubMed] [Google Scholar]
- Fecteau JH, Munoz DP. Exploring the consequence of the previous trial. Nat Rev Neurosci. 2003;4:435–443. doi: 10.1038/nrn1114. [DOI] [PubMed] [Google Scholar]
- Fecteau JH, Bell AH, Munoz DP. Neural correlates of the automatic and goal-driven biases in orienting spatial attention. J Neurophysiol. 2004;92:1728–1737. doi: 10.1152/jn.00184.2004. [DOI] [PubMed] [Google Scholar]
- Gandhi NJ, Keller EL. Comparison of saccades perturbed by stimulation of the rostral superior colliculus, the caudal superior colliculus, and the omnipause region. J Neurophysiol. 1999;82:3236–3253. doi: 10.1152/jn.1999.82.6.3236. [DOI] [PubMed] [Google Scholar]
- Glimcher PW, Sparks DL. Movement selection in advance of action in the superior colliculus. Nature. 1992;355:542–545. doi: 10.1038/355542a0. [DOI] [PubMed] [Google Scholar]
- Glimcher PW, Sparks DL. Effects of low-frequency stimulation of the superior colliculus on spontaneous and visually guided saccades. J Neurophysiol. 1993;69:953–964. doi: 10.1152/jn.1993.69.3.953. [DOI] [PubMed] [Google Scholar]
- Godijn R, Theeuwes J. Programming of endogenous and exogenous saccades: evidence for a competitive integration model. J Exp Psychol Hum Percept Perform. 2002;28:1039–1054. doi: 10.1037//0096-1523.28.5.1039. [DOI] [PubMed] [Google Scholar]
- Gold JI, Shadlen MN. Representation of a perceptual decision in developing oculomotor commands. Nature. 2000;404:390–394. doi: 10.1038/35006062. [DOI] [PubMed] [Google Scholar]
- Hanes DP, Schall JD. Neural control of voluntary movement initiation. Science. 1996;274:427–430. doi: 10.1126/science.274.5286.427. [DOI] [PubMed] [Google Scholar]
- Hanes DP, Thompson KG, Schall JD. Relationship of presaccadic activity in frontal eye field and supplementary eye field to saccade initiation in macaque: poisson spike train analysis. Exp Brain Res. 1995;103:85–96. doi: 10.1007/BF00241967. [DOI] [PubMed] [Google Scholar]
- Hays AV, Jr, Richmond BJ, Optician LM. A UNIX-based multiple process system for real-time data acquisition and control. WESCON Conf Proc. 1982;2:1–10. [Google Scholar]
- Hikosaka O, Takikawa Y, Kawagoe R. Role of the basal ganglia in the control of purposive saccadic eye movements. Physiol Rev. 2000;80:953–978. doi: 10.1152/physrev.2000.80.3.953. [DOI] [PubMed] [Google Scholar]
- Jonides J, Yantis S. Uniqueness of abrupt visual onset in capturing attention. Percept Psychophys. 1988;43:34–54. doi: 10.3758/bf03208805. [DOI] [PubMed] [Google Scholar]
- Kopecz K. Saccadic reaction time in gap/overlap paradigm: a model based on integration of intentional and visual information on neural, dynamic fields. Vision Res. 1995;35:2911–2925. doi: 10.1016/0042-6989(95)00066-9. [DOI] [PubMed] [Google Scholar]
- Lee P, Hall WC. An in vitro study of horizontal connections in the intermediate layer of the superior colliculus. J Neurosci. 2006;26:4763–4768. doi: 10.1523/JNEUROSCI.0724-06.2006. [DOI] [PMC free article] [PubMed] [Google Scholar]
- McIlwain JT. Lateral spread of neural excitation during microstimulation in intermediate gray layer of cat's superior colliculus. J Neurophysiol. 1982;47:167–178. doi: 10.1152/jn.1982.47.2.167. [DOI] [PubMed] [Google Scholar]
- McPeek RM, Keller EL. Superior colliculus activity related to concurrent processing of saccade goals in a visual search task. J Neurophysiol. 2002;87:1805–1815. doi: 10.1152/jn.00501.2001. [DOI] [PubMed] [Google Scholar]
- McPeek RM, Han JH, Keller EL. Competition between saccade goals in the superior colliculus produces saccade curvature. J Neurophysiol. 2003;89:2577–2590. doi: 10.1152/jn.00657.2002. [DOI] [PubMed] [Google Scholar]
- Meredith MA, Ramoa AS. Intrinsic circuitry of the superior colliculus: pharmacophysiological identification of horizontally oriented inhibitory interneurons. J Neurophysiol. 1998;79:1597–1602. doi: 10.1152/jn.1998.79.3.1597. [DOI] [PubMed] [Google Scholar]
- Munoz DP, Istvan PJ. Lateral inhibitory interactions in the intermediate layers of the monkey superior colliculus. J Neurophysiol. 1998;79:1193–1209. doi: 10.1152/jn.1998.79.3.1193. [DOI] [PubMed] [Google Scholar]
- Munoz DP, Wurtz RH. Saccade-related activity in monkey superior colliculus. I. Characteristics of burst and buildup cells. J Neurophysiol. 1995;73:2313–2333. doi: 10.1152/jn.1995.73.6.2313. [DOI] [PubMed] [Google Scholar]
- Ottes FP, Van Gisbergen JA, Eggermont JJ. Visuomotor fields of the superior colliculus: a quantitative model. Vision Res. 1986;26:857–873. doi: 10.1016/0042-6989(86)90144-6. [DOI] [PubMed] [Google Scholar]
- Ozen G, Helms MC, Hall WC. Intracollicular neuronal network. In: Hall WC, Moschovakis AK, editors. The superior colliculus. Boca Raton, FL: CRC; 2004. pp. 147–158. [Google Scholar]
- Paré M, Munoz DP. Saccadic reaction time in monkey: advanced preparation of oculomotor programs is primarily responsible for express saccade occurrence. J Neurophysiol. 1996;76:3666–3681. doi: 10.1152/jn.1996.76.6.3666. [DOI] [PubMed] [Google Scholar]
- Quaia C, Aizawa H, Optican LM, Wurtz RH. Reversible inactivation of monkey superior colliculus. II. Maps of saccadic deficits. J Neurophysiol. 1998;79:2097–2110. doi: 10.1152/jn.1998.79.4.2097. [DOI] [PubMed] [Google Scholar]
- Robinson DA. Eye movements evoked by collicular stimulation in the alert monkey. Vision Res. 1972;12:1795–1808. doi: 10.1016/0042-6989(72)90070-3. [DOI] [PubMed] [Google Scholar]
- Rodgers CK, Levy R, Marino RA, Munoz DP. Spatiotemporal activity patterns across superior colliculus neurons determined from multi-unit recordings. Soc Neurosci Abstr. 2004;30:880–13. [Google Scholar]
- Saito Y, Isa T. Laminar specific distribution of lateral excitatory connections in the rat superior colliculus. J Neurophysiol. 2004;92:3500–3510. doi: 10.1152/jn.00033.2004. [DOI] [PubMed] [Google Scholar]
- Sakamoto Y, Ishigura M, Kitagawa G. Dordrecht, The Netherlands: Reidel; 1986. Akaike information criterion statistics. [Google Scholar]
- Schall JD, Hanes DP. Neural basis of saccade target selection in frontal eye field during visual search. Nature. 1993;366:467–469. doi: 10.1038/366467a0. [DOI] [PubMed] [Google Scholar]
- Schall JD, Hanes DP, Thompson KG, King DJ. Saccade target selection in frontal eye field of macaque. I. Visual and premovement activation. J Neurosci. 1995;15:6905–6918. doi: 10.1523/JNEUROSCI.15-10-06905.1995. [DOI] [PMC free article] [PubMed] [Google Scholar]
- Sommer MA. Express saccades elicited during visual scan in the monkey. Vision Res. 1994;34:2023–2038. doi: 10.1016/0042-6989(94)90030-2. [DOI] [PubMed] [Google Scholar]
- Sommer MA, Wurtz RH. What the brain stem tells the frontal cortex. I. Oculomotor signals sent from the superior colliculus to frontal eye field via mediodorsal thalamus. J Neurophysiol. 2004a;91:1381–1402. doi: 10.1152/jn.00738.2003. [DOI] [PubMed] [Google Scholar]
- Sommer MA, Wurtz RH. What the brain stem tells the frontal cortex. II. Role of the SC-MD-FEF pathway in corollary discharge. J Neurophysiol. 2004b;91:1403–1423. doi: 10.1152/jn.00740.2003. [DOI] [PubMed] [Google Scholar]
- Theeuwes J, Kramer AF, Hahn S, Irwin DE. Our eyes do not always go where we want them to go: capture of the eyes by new objects. Psychol Sci. 1998;9:379–385. [Google Scholar]
- Theeuwes J, Kramer AF, Hahn S, Irwin DE, Zelinsky GJ. Influence of attentional capture on oculomotor control. J Exp Psychol Hum Percept Perform. 1999;25:1595–1608. doi: 10.1037//0096-1523.25.6.1595. [DOI] [PubMed] [Google Scholar]
- Trappenberg TP, Dorris MC, Munoz DP, Klein RM. A model of saccade initiation based on the competitive integration of exogenous and endogenous signals in the superior colliculus. J Cogn Neurosci. 2001;13:256–271. doi: 10.1162/089892901564306. [DOI] [PubMed] [Google Scholar]
- Usher M, McClelland JL. The time course of perceptual choice: the leaky, competing accumulator model. Psychol Rev. 2001;108:550–592. doi: 10.1037/0033-295x.108.3.550. [DOI] [PubMed] [Google Scholar]
- Van Opstal AJ, Van Gisbergen JA. A nonlinear model for collicular spatial interactions underlying the metrical properties of electrically elicited saccades. Biol Cybern. 1989;60:171–183. doi: 10.1007/BF00207285. [DOI] [PubMed] [Google Scholar]
- van Zoest W, Donk M, Theeuwes J. The role of stimulus-driven and goal-driven control in saccadic visual selection. J Exp Psychol Hum Percept Perform. 2004;30:746–759. doi: 10.1037/0096-1523.30.4.749. [DOI] [PubMed] [Google Scholar]
- Walker R, Deubel H, Schneider WX, Findlay JM. Effect of remote distractors on saccade programming: evidence for an extended fixation zone. J Neurophysiol. 1997;78:1108–1119. doi: 10.1152/jn.1997.78.2.1108. [DOI] [PubMed] [Google Scholar]
- Watanabe M, Kobayashi Y, Inoue Y, Isa T. Effects of local nicotinic activation of the superior colliculus on saccades in monkeys. J Neurophysiol. 2005;93:519–534. doi: 10.1152/jn.00558.2004. [DOI] [PubMed] [Google Scholar]
- Wurtz RH, Sommer MA. Identifying corollary discharges for movement in the primate brain. Prog Brain Res. 2004;144:47–60. doi: 10.1016/S0079-6123(03)14403-2. [DOI] [PubMed] [Google Scholar]
- Wurtz RH, Basso MA, Paré M, Sommer MA. The superior colliculus and the cognitive control of movement. In: Gazzaniga MS, editor. The new cognitive neurosciences. Ed 2. Cambridge, MA: MIT; 2000. pp. 573–405. [Google Scholar]