

Abstract
Overactivation of NMDA receptors (NMDARs) is believed to play a role in degeneration of striatal medium-sized spiny neurons (MSNs) in Huntington's disease (HD). This hereditary disorder is caused by an expansion >35 in the polyglutamine (polyQ) region of the protein huntingtin (htt). Previous work has shown that NMDAR current, calcium signaling, and/or toxicity are enhanced in striatal MSNs in a variety of transgenic mice and cellular models of HD, but whether the enhancement is specific for MSNs or correlated with mutant htt (mhtt) polyQ length is not known. Furthermore, the mechanism underlying the increase in NMDAR activity has not been elucidated. Here we report polyQ length-dependent enhancement of peak NMDAR current density by mhtt in cultured MSNs, but not cortical neurons, from the yeast artificial chromosome (YAC) transgenic HD mouse model. We also observed a shift of NMDAR subunits NR1 and NR2B from internal pools to the plasma membrane and a significantly faster rate of NMDAR insertion to the surface in YAC72 MSNs. In comparing YAC72 with wild-type striatal tissue, subcellular fractionation revealed a relative enrichment of NR1 C2′-containing NMDARs in the vesicle/microsome-enriched fraction, and coimmunoprecipitation experiments demonstrated an increased proportion of NR1 C2′ isoforms associated with NR2 subunits, which may contribute to faster forward trafficking of these receptors. Our results suggest that altered NMDAR trafficking may underlie potentiation of NMDAR-mediated current and toxicity in the YAC72 HD mouse model. This polyQ length-dependent, neuronal-specific change in NMDAR activity induced by mhtt may contribute to selective neuronal degeneration in HD.
Keywords: Huntington's disease, huntingtin, polyglutamine, NMDA receptor, trafficking, transgenic
Introduction
Huntington's disease (HD) is a progressive and fatal neurodegenerative disorder affecting predominantly striatal GABAergic medium-sized spiny neurons (MSNs) (for review, see Vonsattel and DiFiglia, 1998; Sieradzan and Mann, 2001). Pathology results from a CAG repeat expansion (>35) in the coding region of the gene for huntingtin (htt), leading to an expanded polyglutamine (polyQ) tract in the translated protein (Huntington's Disease Collaborative Research Group, 1993). The normal function of htt is not clear; however, evidence implicates a role for the protein in vesicular transport and protein trafficking (Velier et al., 1998).
Excitotoxic damage from overactivation of NMDA receptors (NMDARs) has been hypothesized to contribute to HD pathogenesis (DiFiglia, 1990). Initially, this hypothesis was based on studies of postmortem human brain showing a disproportionate loss of striatal NMDARs in early-stage HD (Young et al., 1988; Albin et al., 1990) and striatal injection of NMDAR agonists in rodents or nonhuman primates that reproduced the pattern of neuronal damage seen in HD (Beal et al., 1986, 1991; Sanberg et al., 1989; Hantraye et al., 1990; Ferrante et al., 1993). Recent findings in transgenic mouse models also support this hypothesis. NMDAR-mediated current density, intracellular calcium responses, and toxicity are enhanced in MSNs from yeast artificial chromosome (YAC) transgenic mice expressing polyQ-expanded full-length human htt compared with wild type (wt) (Zeron et al., 2002, 2004). Larger NMDAR currents and increased calcium levels have also been observed in MSNs from the R6/2 HD mouse model (Cepeda et al., 2001; Hansson et al., 2001). Coexpression of mutant (but not wt) htt with NMDARs in a cell line leads to enhanced NMDAR-mediated current and increased susceptibility to apoptotic cell death (Chen et al., 1999; Zeron et al., 2001). This effect is specific for NR1/NR2B-type NMDARs, consistent with the enrichment of NR2B in MSNs compared with other NR2 subunits and neuronal populations (Landwehrmeyer et al., 1995; Christie et al., 2000; Li et al., 2003b). Moreover, YAC transgenic mouse models expressing only exons 1 and 2 of the CAG-expanded HD gene, or full-length polyQ-expanded htt mutated to eliminate cleavage by caspase-6, show complete amelioration of HD symptoms associated with resistance of striatal neurons to NMDAR-mediated excitotoxicity (Slow et al., 2005; Graham et al., 2006). However, it is not known whether mutant htt (mhtt)-induced potentiation of NMDAR current is polyQ length dependent or specific for striatal MSNs.
The mechanism underlying enhanced NMDAR signaling with mhtt expression has not been elucidated. NR1 and NR2B protein expression levels are similar in striatal tissues from YAC transgenic mice expressing mhtt and from wt littermates (Li et al., 2003b). Furthermore, in HEK293 cells, the single-channel conductance and open probability of NR1/NR2B are similar when these receptors are coexpressed with mutant or wt htt. (Chen et al., 1999). Here, we use the YAC transgenic mouse model to determine the relationship between mhtt-induced potentiation of NMDAR current density and polyQ length, as well as neuronal type, and investigate the mechanism underlying enhancement of NMDAR current density.
Materials and Methods
Transgenic mice.
Primary striatal neuronal cultures were prepared from offspring of crosses between two homozygous YAC transgenic mice on a pure FVB/N strain background (Hodgson et al., 1999; Leavitt et al., 2006). YAC46 (668 line) and YAC72 (2511 line) mice were used as models expressing full-length human mhtt containing 46 or 72 polyQ repeats (46Q or 72Q) and compared with FVB/N wt mice. These mice were also compared against YAC18 (212 line) mice, which express full-length human htt but contain a nonpathogenic number (18Q) of polyQ repeats. All mice were bred and maintained according to Canadian Council on Animal Care guidelines.
Primary culture of mouse striatal or cortical neurons.
Primary cultures of striatal MSNs or cortical pyramidal neurons were prepared as described previously (Zeron et al., 2002). Briefly, striata or frontal cortices were dissected from postnatal day 0 (P0) to P1 FVB/N wt, YAC18, YAC46, or YAC72 mice in ice-cold divalent-free HBSS (Invitrogen, Burlington, Ontario, Canada), chopped into small pieces, and incubated for ∼10 min at 37°C with HBSS containing ∼40 U/ml papain. Papain-treated cells were then transferred to neurobasal media (NBM) (Invitrogen) supplemented with 0.25% (w/v) bovine serum albumin (BSA), 0.25% (w/v) trypsin inhibitor, and 20 μg/ml DNase. Cells were subsequently dissociated by repeated passage through a graded series of successively smaller bore-size Pasteur pipettes, after which they were seeded onto dishes with flame-sterilized 12 mm round glass coverslips (Paul Marienfeld, Lauda-Königshofen, Germany) that were precoated with 50 μg/ml lower molecular weight (30,000–70,000) poly-d-lysine. Cells were seeded at a density of ∼0.6–1 × 10⁶ cells/ml and maintained in NBM supplemented with B27 (Invitrogen), 2 mm (for striatal cultures) or 0.5 mm (for cortical cultures) glutamine, and 100 U/ml penicillin–streptomycin (Invitrogen) in a humidified 37°C, 5% CO2 environment. Half of the existing media was exchanged for fresh media every 4–5 d after plating, and cells were used for experiments at 9–10 d in vitro (d.i.v.) (for striatal MSNs) or at 4–7 d.i.v. (for cortical pyramidal neurons). Under our culture conditions, ∼85% of all cells in striatal cultures showed features characteristic of MSNs, and ∼9% were astrocytes (Shehadeh et al., 2006).
Electrophysiology.
Whole-cell patch-clamp recordings were performed on cultured neurons at 4–7 d.i.v. (for cortical pyramidal neurons) or 9–10 d.i.v. (for striatal MSNs), using techniques similar to those described previously (Price et al., 1999). Cells were selected for recording based on morphological characteristics resembling cortical pyramidal neurons or striatal MSNs (Shehadeh et al., 2006). Coverslipped neurons were placed in a recording chamber on the stage of an inverted microscope (Axiovert 100; Zeiss, Thornburg, NY). During whole-cell recording under voltage clamp, superfusion of neurons with different solutions was achieved using a gravity-fed solenoid system attached to a theta tube. In all experiments, 50 μm glycine was present in both control and 1 mm NMDA- or kainate-containing extracellular solutions. The intracellular recording solution contained the following: 115 mm CsMeSO3, 10 mm HEPES, 10 mm BAPTA, 4 mm Mg-ATP, 20 mm K2-creatine phosphate, and 50 U/ml creatine phosphokinase, titrated to pH 7.25 using CsOH. Extracellular recording solution contained the following: 167 mm NaCl, 2.4 mm KCl, 1.8 mm CaCl2, 10 mm d-(+)glucose, and 10 mm HEPES titrated to pH 7.35 with 10 m NaOH. Tetrodotoxin (0.3 μm) was added to the extracellular recording solution immediately before each experiment to block voltage-gated sodium currents. All experiments were conducted at room temperature (20–21°C). Currents were sampled at 5 kHz and acquired and analyzed using pClamp 8.1 software and an Axopatch 200A amplifier (Molecular Devices, Palo Alto, CA). Current amplitude measurements and kinetic fittings were performed using Clampfit 8.1 software.
During whole-cell recording under voltage clamp (VH of −60 mV), 1 mm NMDA was applied over a 4 s period every 60 s, for a total of three trials. This stimulation paradigm was then repeated in the presence of 3 μm ifenprodil (IFN) (NR2B-selective antagonist). IFN was washed out, and the stimulation paradigm was repeated to monitor recovery of NMDAR current from IFN block. In some experiments, 1 mm kainate was used instead of 1 mm NMDA to assess possible changes in AMPA/kainate receptor current density. Kainate was used because it activates AMPA receptors (AMPARs) in a nondesensitizing manner (Hollmann and Heinemann, 1994). IFN was not used in these experiments.
Electrophysiological recovery of current after use-dependent channel block.
Whole-cell patch-clamp recordings were performed under voltage clamp (VH of −80 mV, to minimize any possibility of MK-801 [(+)-5-methyl-10,11-dihydro-5H-dibenzo [a,d] cyclohepten-5,10-imine maleate] dissociation) on cultured striatal MSNs at 9–10 d.i.v. as described above. NMDAR-mediated current was evoked by bath application of 1 mm NMDA. To achieve irreversible blockade of all surface NMDARs, 5 μm MK-801 (use-dependent, open-channel blocker) was coapplied with 1 mm NMDA for 9 s immediately after 1 s application of NMDA alone. During this period, whole-cell NMDA current could be observed to decay to pre-NMDA application levels. Thirty seconds after initial blockade, this protocol was repeated to ensure complete block of the receptors. After extensive washout of MK-801, subsequent recovery of NMDAR-mediated current was measured at 5 min intervals by stimulating three times with 500 ms applications of 1 mm NMDA, 30 s apart. The responses were recorded and averaged at each time point and expressed as average area under the curve (AUC) for the NMDA-evoked current, normalized to cell capacitance (picofarads) to obtain a measure of integrated current density.
Immunostaining and quantification.
Coverslips of striatal MSNs isolated from P0 or P1 mouse pups and cultured for 9–10 d.i.v. were rinsed in PBS and fixed for 15 min at room temperature in PBS containing 4% paraformaldehyde. Cells were then washed in PBS with gentle shaking before blocking in PBS containing 10% normal goat serum (NGS) for 30 min, again at room temperature. Surface NR1 was then labeled green by incubation with a mouse anti-NR1 extracellular M3–M4 loop domain primary antibody in PBS supplemented with 1% BSA for 1.5 h, followed by AlexaFluor 488 secondary antibody for 30 min at room temperature. Subsequently, neurons were permeabilized with PBS and 0.5% Triton X-100 and blocked again in PBS with 10% NGS for another 30 min. Internal NR1 was then labeled with the same primary antibody as before, but followed by cyanine 3 (Cy3) secondary antibody incubation to label internal receptors red. Cells were then washed three times in PBS, and the coverslips mounted onto glass slides using the Fluoromount reagent (Southern Biotechnology, Birmingham, AL). Fluorescent images of cells at 630× magnification were captured using a CCD camera mounted on a fluorescence microscope (Axiophot; Zeiss). The ratio of surface-to-internal NR1 signals was compared among FVB/N wt, YAC18, and YAC72 samples. Five independent experiments using different batches of cultures were performed, with samples from all three genotypes processed and analyzed in parallel within each experiment. Data is analyzed from four random fields in each of five coverslips for each genotype in every experiment. To quantify NR1 expression on the surface or inside the cell, we measured intensity of NR1 staining of MSNs in both green and red channels, respectively. Images were exported into Northern Eclipse (Empix Imaging, Mississauga, Ontario, Canada), and fluorescence intensity was measured using custom-written software IDL 3.1 (T.H.M., unpublished data) for 12 subfields selected covering somata and processes of MSNs in each field. Intensities were corrected for background in each color channel, and surface-to-internal ratio of NR1 expression was calculated by dividing the green channel values by the red channel values. Data from a total of 20 fields (4 fields per coverslip × 5 coverslips per genotype) were then pooled for each individual experiment.
Immunoblot analysis.
Protein samples resolved by SDS-PAGE were transferred by wet electrophoresis onto polyvinylidene difluoride membranes. Membranes were then wetted in methanol, equilibrated in water and Tris-buffered saline (TBS), and then blocked for 2 h in TBS containing 0.5% Tween-20 and 3% (w/v) BSA. After a brief rinse in TBS and 0.5% Tween-20 (TBS-T), membranes were incubated with primary antibody dissolved in the blocking solution typically for 1–2 h with shaking at room temperature and then overnight at 4°C. Membranes were then washed three times in TBS-T, incubated for 1 h at room temperature with the appropriate horseradish peroxidase-coupled secondary antibody in blocking solution, washed again, and visualized by the addition of the enhanced chemiluminescence reagents (Amersham Biosciences) and exposure on film.
Antibodies for immunoblotting and immunostaining.
The following antibodies were used: anti-actin, goat polyclonal antibody (Santa Cruz Biotechnology, Santa Cruz, CA); anti-calnexin, rabbit polyclonal antibody (formerly StressGen; Nventa Biopharmaceuticals, San Diego, CA); anti-glutamate receptor subunit 1 (GluR1), rabbit polyclonal antibody (formerly Upstate; Millipore, Billerica, MA); anti-NR1 extracellular loop between M3 and M4, mouse monoclonal antibody (formerly Chemicon; Millipore); Anti-NR1A CT, rabbit polyclonal antibody (formerly Upstate; Millipore); anti-NR1 C2, rabbit polyclonal antibody (PhosphoSolutions, Aurora, CO); anti-NR1 C2′, rabbit polyclonal antibody (PhosphoSolutions); anti-NR2B, mouse monoclonal antibody (BD Transduction Laboratories, San Jose, CA); anti-GluR1, rabbit polyclonal antibody (formerly Chemicon; Millipore); anti-postsynaptic density 95 (PSD-95), mouse monoclonal antibody (formerly Chemicon; Millipore); and anti-synaptophysin, mouse monoclonal antibody (generous gift from Dr. S. Vincent, University of British Columbia, Vancouver, British Columbia, Canada).
Biotinylation assay of surface expression and rate of surface receptor loss.
Striatal MSNs cultured for 9 d.i.v. were precooled to 4°C to halt biological processes within the cell. Cells were washed twice with ice-cold PBS and incubated with 1.5 mg/ml NHS-SS-Biotin (Pierce, Rockford, IL) in PBS supplemented with 0.1 mm Ca2+ and 1 mm Mg2+ for 12 min at 4°C to label surface proteins. Excess biotin label was removed by two washes of 0.1% BSA in PBS containing 0.1 mm CaCl2 and 1 mm MgCl2, and cells were replaced in conditioned media and then harvested. To assess the rate of surface receptor loss, sister dishes of cells were returned to the 37°C, 5% CO2 incubator for 12 or 24 h before the cells were harvested. Collected cells were then solubilized with 1% Triton X-100 to isolate the total soluble lysate, from which 20% of the volume was set aside as the “lysate” sample. The remainder (80%) was incubated with end-over-end rotation in the presence of preequilibrated NeutrAvidin biotin-binding resin (Pierce) for 2 h at 4°C. The resin was subsequently washed four times with solubilization buffer, and bound biotin-tagged proteins were eluted from the washed resin by incubation with 3× protein sample buffer for 30 min at 4°C. Samples were then resolved by SDS-PAGE and subjected to immunoblotting. The biotinylation eluate fraction represents the portion of proteins present on the cell surface during the biotin labeling step that has not yet undergone proteasomal or lysosomal degradation.
Biotinylation assay with lysosomal block.
Biotinylation assay was performed as described above for the degradation assay, but with the addition of 100 μg/ml leupeptin (lysosome inhibitor; EMD Biosciences, San Diego, CA) to the culture media 1 h before biotin labeling.
Biotinylation assay of surface receptor accumulation after blockade of endocytosis and recycling.
Sister dishes of cultured striatal MSNs at 9–10 d.i.v. were treated with the endocytosis and recycling inhibitor chlorpromazine (Wang et al., 1993; Zhu et al., 2005) for 0, 0.5, or 6 h at 37°C. At the concentration used (10 μm), cells retained a healthy appearance up to 6 h after treatment, whereas drug concentrations ≥15 μm were noted in pilot studies to cause significant morphological changes and detachment of MSNs from the culture dish over the same time period. At each time point, one dish of neurons was precooled to 4°C to halt biological processes within the cell. Cells were washed twice with ice-cold PBS and incubated with 1.5 mg/ml NHS-SS-Biotin (Pierce) in PBS supplemented with 0.1 mm Ca2+ and 1 mm Mg2+ for 12 min at 4°C to label surface proteins. Excess biotin label was removed by two washes with 0.1% BSA in PBS with 0.1 mm Ca2+ and 1 mm Mg2+ and a third wash in PBS. Cells were then harvested and samples processed as for the degradation assay as described above, followed by resolution by SDS-PAGE and immunoblotting. The biotinylation eluate fraction represents the portion of proteins present on the cell surface during the biotin labeling step.
Biochemical fractionation.
Tissue from mouse striatum was subjected to biochemical fractionation based on a protocol modified from Dunah and Standaert (2001) and Hell and Jahn (1994). Striatal tissue was isolated and pooled from FVB/N wt or YAC72 mice (10 animals of each genotype were used for two of the sets of fractionations, and 30 animals each were used in a third set of fractionations), in each case from two or more litters, at 2 months of age. Tissue was homogenized with nine strokes at 900 rpm in ice-cold homogenization buffer (HB) (in mm: 320 sucrose, 4 HEPES, pH7.4, and 1 EGTA) supplemented with protease inhibitors, using ∼10 ml of HB per gram of wet brain tissue (∼15 ml for striatal tissue from 30 mice). Homogenate was then subjected to a series of centrifugation steps as outlined in Figure 6a. For hypo-osmotic lysis of the washed crude synaptosomal fraction, the P2′ pellet was resuspended in HB to of the initial volume, diluted with 9 vol of ice-cold water, and lysed with three strokes at 2000 rpm. HEPES-NaOH, pH 7.4, was then added to ∼8.5 mm final concentration, and the lysed P2′ was then centrifuged further as outlined in Figure 6a. Fractions were then quantified for protein content, resolved by SDS-PAGE, and subjected to immunoblotting to determine the subcellular distribution of the proteins of interest.
Figure 6.

NR1 C2′ isoform is present in the P3 fraction at higher levels in striatal tissue from YAC72 versus wt mice. Pooled tissue from 2-month-old mice was fractionated by centrifugation into different subcellular components and analyzed by immunoblotting. a, Schematic for biochemical fractionation; for details of the protocol as depicted in this schematic, see Materials and Methods. b, Characterization of fractionated subcellular compartments of striata from wt mice. Fractions were resolved by SDS-PAGE and immunoblotted with antibodies against GluR1 (topmost), NR1 (top middle), PSD-95 (middle), synaptophysin (bottom middle), and calnexin (bottommost). Synaptophysin (syp) is most highly expressed in LP2, calnexin (calnxn) is concentrated in P3, and PSD-95 is enriched in LP1, whereas NR1 and GluR1 are present in both LP1 and P3 fractions. c, Sample blot showing the relative distribution of each of NR1, NR1 C2, and NR1 C2′ in two fractions, LP1 and P3. Twenty micrograms of protein were loaded for each sample. Expression of the NR1 C2′ isoform, but not of NR1 C2 or the NR1 subunit in general, was enhanced in the P3 fraction of striatal tissue from YAC72 mice compared with wt. d, Quantitation of the C2′/C2 ratio in LP1 and P3 fractions of striatal tissue from 2-month-old YAC72 mice relative to wt. C2′/C2 ratios were calculated for each genotype, and ratios for YAC72 were then normalized to wt values in each of the paired experiments. Bars represent mean ± SEM from experiments using n = 3 independent fractionations each of striatal tissue pooled from 10 to 30 mice of each genotype. The C2′/C2 ratios for YAC72 normalized to those for wt tissue are significantly higher in the P3 fraction compared with LP1. Significantly different, *p < 0.05 by paired t test.
Immunoprecipitation from striatal tissue.
FVB/N and YAC72 mice were killed at 2 months of age, and striatal tissue was harvested in PBS containing 1 mm EDTA/1 mm EGTA and supplemented with protease inhibitors. Tissue was homogenized by eight up and down strokes at 2000 rpm and centrifuged. After removal of the supernatant, tissue pellets were resuspended in lysis buffer containing 1% NP-40 in 150 mm NaCl/50 mm Tris, pH 8.0. DNA was digested by treatment with DNase, and proteins were solubilized by sonication. Lysates were first precleared with protein A and G resin before incubation with primary antibody and additional resin. Immunoprecipitation of NR2A and NR2B was performed as described previously (Li et al., 2003a). Immunoprecipitated proteins and their binding partners were subsequently eluted by resuspending in 3× protein sample buffer, resolved by SDS-PAGE, and subjected to immunoblotting.
Materials.
Chemicals and reagents were purchased from Sigma-Aldrich (Oakville, Ontario, Canada) unless otherwise noted.
Results
NMDAR-mediated whole-cell current from cultured striatal MSNs varies with mhtt polyQ length
Our laboratory has reported previously that coexpression of NR1/NR2B-containing NMDARs with mhtt in HEK293 cells leads to enhanced NMDAR-mediated current density (Chen et al., 1999). This potentiation of NMDAR current is also observed in acutely dissociated striatal neurons from 2-month-old YAC transgenic mice expressing full-length human htt containing 72Q (Zeron et al., 2002). To further investigate the relationship between mhtt polyQ length and NMDAR-mediated current, we established primary cultures of striatal MSNs from neonatal mice of a pure FVB/N strain (wt) or from YAC transgenic mice expressing full-length human htt containing 18Q (nonpathogenic), 46Q, or 72Q (Hodgson et al., 1999). We observed increasing NMDAR peak current density correlating with htt polyQ length (YAC18 vs YAC72, p < 0.01; YAC46 vs YAC72, p < 0.05; by one-way ANOVA with Bonferroni's post hoc test) (Fig. 1a). Compared with wt MSNs, YAC72 MSNs also exhibited significantly increased peak current density, similar to the difference reported with acutely dissociated MSNs from 2-month-old mice (Zeron et al., 2002). This potentiating effect was specific to NMDA-activated GluRs, because bath application of kainate (an agonist for both classes of non-NMDA ionotropic GluRs: kainate and AMPA receptors) led to comparable current responses in wt and YAC72 MSNs (Fig. 1a).
Figure 1.
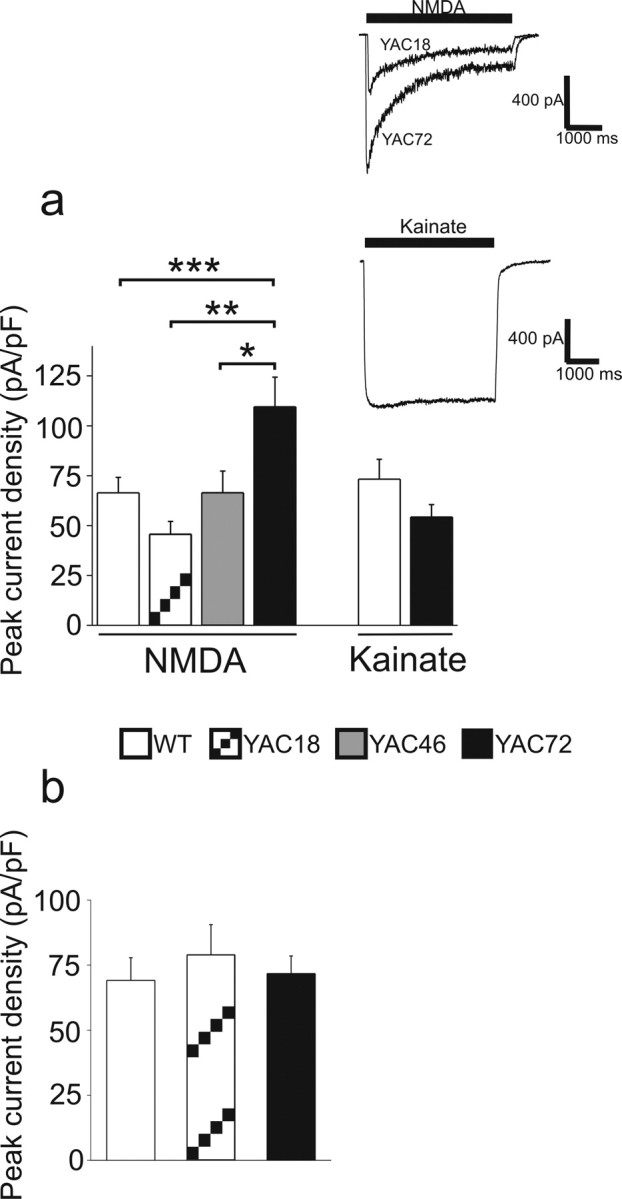
Peak current density induced by NMDA but not kainate varies with htt polyQ length in cultured striatal MSNs but not in cortical neurons. a, Whole-cell patch-clamp recording was performed on cultured striatal MSNs at 9–10 d.i.v. stimulated with either NMDA or kainate (1 mm). Bars represent mean ± SEM peak current density (peak current normalized for cell capacitance). n = 42 (wt), 13 (YAC18), 11 (YAC46), or 16 (YAC72) cells for NMDA; n = 11 (wt) or 10 (YAC72) cells for kainate. Insets, Sample traces for NMDA-induced (top) and kainate-induced (bottom) current. Significant difference between genotypes, *p < 0.05, **p < 0.01 ***p < 0.001 by one-way ANOVA, Bonferroni's post hoc test. b, Whole-cell current density was also measured from cortical neurons in culture for 4–7 d.i.v. from wt or YAC72 mice, stimulated with 1 mm NMDA. Bars represent mean ± SEM peak current density from n = 20 (wt), 11 (YAC18), or 19 (YAC72) cells.
In HD, striatal MSNs are the first to degenerate and show losses up to 95% in late stages of the disease; in contrast, other neuronal populations, including cortical pyramidal neurons, begin to show signs of degeneration at later stages of HD with reduced levels of neuronal loss (up to ∼50%) (Vonsattel and DiFiglia, 1998). We found that NMDA-evoked peak current densities were similar in cultured cortical pyramidal neurons from wt, YAC18, and YAC72 mice (Fig. 1b); because we found no difference between YAC72 and YAC18 or wt neurons in NMDAR current density, we did not pursue these recordings in YAC46 cortical neurons. These data indicate that neither overexpression of human htt nor increased polyQ length play a role in the regulation of NMDAR activity in cortical neurons, suggesting that htt polyQ length-dependent facilitation of NMDAR-mediated current is cell type specific and may contribute to the specific vulnerability of the striatum to excitotoxic damage in HD.
NR2 subunits determine differences in NMDAR channel properties, including peak open probability, single-channel conductance, and desensitization (for review, see Schoepfer et al., 1994; Cull-Candy et al., 2001). To determine whether mhtt potentiation of NMDAR current is a result of altered receptor subunit composition, we repeated our whole-cell recordings from striatal MSNs in the presence of 3 μm IFN, a selective antagonist of NR1/NR2B-containing NMDARs (Williams, 1993). As summarized in Table 1, the majority of current was mediated by NR2B-containing NMDARs, and this proportion was similar across genotypes. As well, the extent of desensitization of NMDA-evoked current responses (represented by steady-state to peak current ratio, Iss/Ip) recorded from YAC transgenic MSNs was not significantly different regardless of htt polyQ length (Table 1). In addition, YAC46 and YAC72 MSNs showed similar Iss/Ip ratios compared with wt MSNs; only YAC18 MSNs exhibited significantly less extensive NMDAR desensitization than wt MSNs (Table 1). Similarly, desensitization and the proportion of current that was IFN sensitive were not different among the genotypes in recordings from cortical neurons. Together, these results indicate that mhtt likely did not alter the subunit composition of NMDARs expressed at the cell surface. Conversely, the proportion of current mediated by NR2B-containing NMDARs was significantly smaller in cortical compared with striatal neurons in both wt and YAC72 mice (p < 0.01 for wt and p < 0.05 for YAC72, comparing the percentage of IFN-sensitive current in cortical vs striatal neurons).
Table 1.
Steady-state to peak current ratios (Iss/Ip) are shown for NMDA-evoked current in primary cultures of 9–10 d.i.v. striatal MSNs or 4–7 d.i.v. cortical pyramidal neurons from wt, YAC18, YAC46, and YAC72 mice
| Striatal MSNs |
Cortical neurons |
||||||
|---|---|---|---|---|---|---|---|
| wt (n = 42) | YAC18 (n = 13) | YAC46 (n = 11) | YAC72 (n = 16) | wt (n = 20) | YAC18 (n = 11) | YAC72 (n = 19) | |
| Iss/Ip, % (mean ± SEM) | 23.8 ± 1.9 | 36.5 ± 6.5 * | 17.0 ± 1.6 | 26.1 ± 3.7 | 20.1 ± 2.1 | 27.6 ± 3.3 | 21.4 ± 2.8 |
| IFN-sensitive current, % of total peak (mean ± SEM) | 66.1 ± 2.9 (n = 18) | 52.7 ± 3.9 (n = 5) | 58.9 ± 7.5 (n = 5) | 69.0 ± 5.2 (n = 5) | 50.5 ± 4.8 (n = 9) | 41.6 ± 10.1 (n = 6) | 52.4 ± 4.6 (n = 10) |
| Cm(mean ± SEM) | 12.6 ± 0.5 | 15.5 ± 2.3 | 15.1 ± 1.2 | 12.1 ± 0.9 | 20.8 ± 1.7 | 26.0 ± 1.8 | 20.9 ± 2.1 |
Values obtained in the absence or presence of 3 μm IFN (NR1/NR2B antagonist) and mean cell capacitance (Cm) are also shown. Comparable sensitivity to IFN in MSNs across genotypes indicates similar levels of NR2B expression, which suggests that subunit composition does not play a role in the genotypic differences in the current density or Iss/Ip ratio. Significant difference from wt,
*p < 0.05 by one-way ANOVA with Bonferroni's post hoc test.
NR1 localization is shifted from internal pools to the cell surface in YAC72 MSNs
Despite an increase in the current mediated by NR2B-containing NMDARs, overall protein expression levels of NR1 and NR2B were not different in striatal tissue from wt and YAC72 mice (Li et al., 2003b). Therefore, we investigated whether the subcellular distribution of NMDARs was altered by expression of mhtt. We chose to compare YAC72 with wt or YAC18 MSNs and not to pursue experiments with YAC46 MSNs because of the very mild phenotype in YAC46 mice (Hodgson et al., 1999). Consistent with the larger NMDAR current density in YAC72 MSNs, we found a relative shift in the localization of the NR1 subunit from internal compartments to the cell surface in cultured striatal MSNs from YAC72 mice compared with wt (Fig. 2a,b). Although MSNs from YAC18 mice exhibited a similar ratio of surface-to-internal NR1 expression as wt MSNs, YAC72 MSNs displayed a significantly increased (by ∼50%) surface-to-internal ratio of NR1 protein expression (p < 0.01 by one-way ANOVA).
Figure 2.
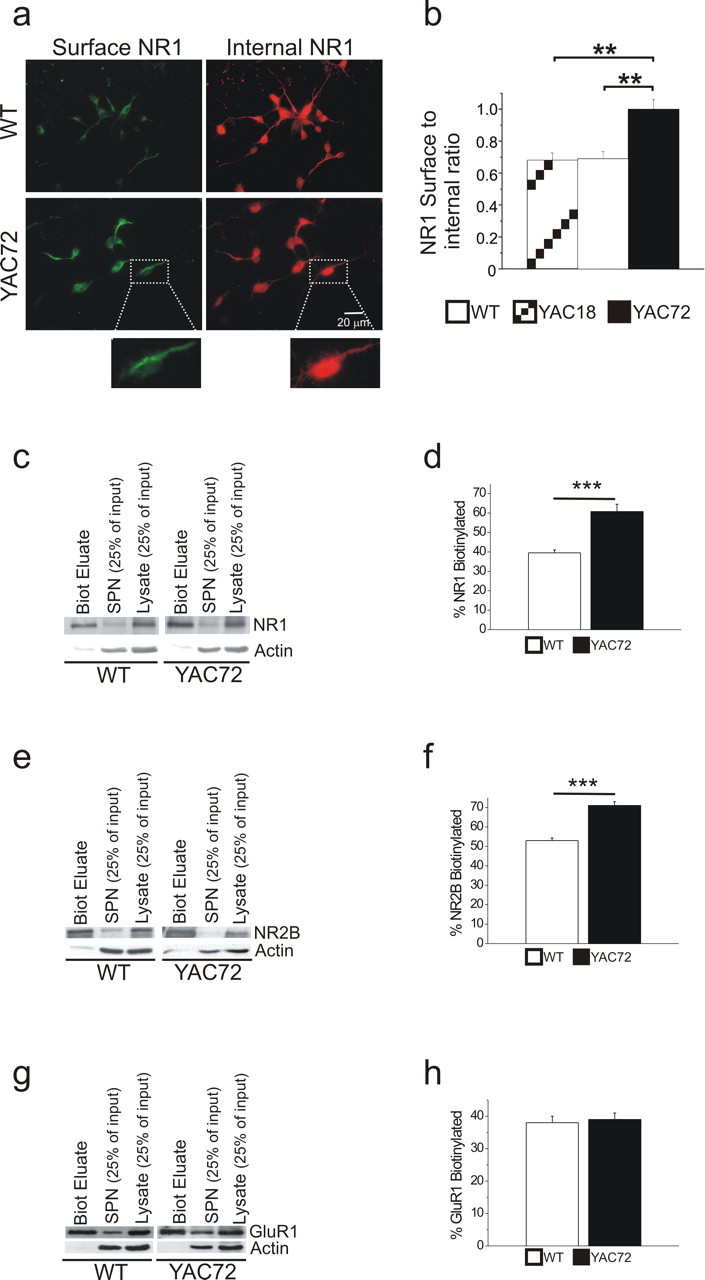
NRDAR surface expression is higher in cultured striatal MSNs from YAC72 versus wt or YAC18 (control) mice. a, Representative fields of immunostained 9–10 d.i.v. striatal neurons are shown, with an enlarged sample neuron depicted in insets; immunostaining, fluorescence imaging, and image capturing were all done in parallel for these wt and YAC72 MSNs. Surface NR1 was labeled green by incubation with primary antibody followed by AlexaFluor 488 secondary antibody. Subsequently, neurons were permeabilized with detergent, and internal NR1 was labeled red by incubation with primary antibody followed by Cy3 secondary antibody. b, Quantitation of the ratio of surface-to-internal NR1 staining. Bars represent mean ± SEM from five batches of cultured neurons for each genotype, and, for each experiment, samples from all three genotypes were processed and analyzed in parallel (see Materials and Methods). Data is analyzed from four random fields in each of five coverslips for each batch. Significantly different compared with wt or YAC18, **p < 0.01 by one-way ANOVA, Bonferroni's post hoc test. No significant difference between wt and YAC18. c, Representative Western blots showing the relative band densities for biotin-tagged surface NR1 [biotinylation eluate (Biot Eluate)], intracellular NR1 [in the supernatant (SPN) from the NeutrAvidin bead precipitation of biotinylated proteins], and total NR1 [in cell lysate (Lysate)]. Actin was probed as a loading control and confirms that the large majority of biotinylated protein is at the cell surface. d, Quantitation of amount of biotinylated surface NR1 as percentage of total NR1 (see Materials and Methods). Bars represent mean ± SEM from six (wt) or seven (YAC72) independent experiments performed with different batches of cultured neurons. e, As in c but for NR2B. f, Quantitation of amount of biotinylated surface NR2B as percentage of total NR2B. Bars represent mean ± SEM from five independent experiments performed with different batches of cultured neurons. g, As in c but for GluR1. h, Quantitation of amount of biotinylated surface GluR1 as percentage of total GluR1. Bars represent mean ± SEM from 10 (wt) or 11 (YAC72) independent experiments performed with different batches of cultured neurons. Significantly different compared with wt, ***p < 0.001 by unpaired t test.
To confirm our immunocytochemical observations, we probed for changes in surface NR1 and NR2B expression from cultured striatal neurons at 9 d.i.v. using a biotinylation-based assay similar to one described previously (Ehlers, 2000) (see Materials and Methods). For these and subsequent experiments, we restricted our comparison to YAC72 and wt MSNs, because wt and YAC18 MSNs appeared identical with regard to NMDAR surface expression as determined from immunocytochemical experiments. As with our immunostaining data, findings from our biotinylation studies indicated an ∼50% increase in the steady-state expression levels of surface NR1 in YAC72 MSNs compared with wt (surface NR1 comprised 39 ± 4% of total NR1 for wt and 61 ± 9% for YAC72; p < 0.001 by unpaired t test) (Fig. 2c,d). A significant increase (34%) in NR2B surface expression in YAC72 MSNs was also observed (Fig. 2e,f). The lower proportion of surface-localized NR1 relative to NR2B in both wt and YAC72 MSNs is consistent with previous studies showing a substantial intracellular pool of unassembled NR1 subunits in neurons (for review, see Prybylowski and Wenthold, 2004). Notably, the percentage of AMPA receptor subunit GluR1 expressed at the surface as assessed by the biotinylation assay was similar for YAC72 and wt MSNs (Fig. 2g,h), in agreement with the similar kainate-evoked current densities recorded from MSNs cultured from these two genotypes (Fig. 1a). Thus, increased surface expression of NMDARs in striatal MSNs may explain the potentiating effect of polyQ-expanded htt on NMDAR-mediated current.
Enhanced rate of surface NMDAR loss in YAC72 MSNs
Altered kinetics of NMDAR insertion to, or loss from, the surface might underlie the elevated steady-state level of NMDAR surface expression in YAC72 MSNs. To examine the rate of surface NMDAR loss in cultured striatal MSNs, we determined the amounts of biotin-tagged NMDAR subunits remaining at various time points after initial biotinylation of surface proteins (Fig. 3a) (Ehlers, 2000). As shown in Figure 3b, the fraction of NR1 expressed at the surface at any given time was represented by the amount present in the “Biot El” (biotinylation eluate) lane when cells were harvested immediately after live cell incubation with the biotinylating reagent (0 h time point). At 12 and 24 h after biotinylation, during which time the neurons were maintained under normal culturing conditions of 37°C, 5% CO2, lysates were collected and analyzed for the fraction of full-length NR1 that remained biotinylated (Fig. 3b,d). The percentage of biotinylated NR1 compared with total NR1 was calculated for each time point and normalized to the initial surface percentage (Fig. 3e) to determine the rate of loss of surface NMDARs. To ensure that the time-dependent loss of NR1 signals from the “Biot El” samples was not attributable to nonspecific cleavage of the C-terminal epitope recognized by the antibody used, we repeated the experiments using an antibody raised against an extracellular epitope of the NR1 subunit to probe the blots and obtained similar results (data not shown). Additionally, inclusion of the lysosomal inhibitor leupeptin (100 μg/ml) reduced the loss of biotinylated NR1 signal at 12 h after initial biotin labeling (Fig. 3c). Without leupeptin, the band density at 12 h was 48 ± 6% of that observed at 0 h, whereas with leupeptin, the 12 h band density was 77 ± 7% of the initial, indicating that treatment with leupeptin reduced the amount degraded over 12 h by 64 ± 12% (n = 3); these data suggest that loss of biotin-tagged NR1 occurs predominantly via the lysosomal pathway.
Figure 3.

More rapid degradation of surface NR1/NR2B in cultured striatal MSNs from YAC72 versus wt mice. a, Scheme of biotinylation experiment to analyze receptor degradation. Striatal neurons at 9–10 d.i.v. were incubated with NHS-SS-Biotin for 12 min at 4°C to label surface proteins, washed extensively, and then replaced in their original culture media at 37°C, 5% CO2. Neurons were then harvested at 0, 12, or 24 h after biotinylation, and total soluble lysate was incubated with NeutrAvidin beads to precipitate biotin-tagged proteins, which were then resolved by SDS-PAGE and subjected to immunoblotting. b, Representative immunoblot showing degradation of biotin-tagged NR1. Biot Eluate, Biotinylation eluate; SPN, supernatant. c, Degradation of surface NR1 occurs via the lysosomal pathway. Surface NR1 levels in 9–10 d.i.v. striatal neurons were assessed at 0 or 12 h after biotinylation, in the presence (+leup) or absence (−leup) of 100 μg/ml leupeptin (lysosomal inhibitor). Blot shown is representative of three independent experiments from different batches of wt or YAC72 MSNs. d, Plot of degradation of biotin-tagged NR1 (left) or NR2B (right) over time. Values represent mean ± SEM from n = 5–12 (NR1) or 2–3 (NR2B) independent experiments with different batches of cultured neurons. e, Plot of degradation of biotin-tagged NR1 (left) or NR2B (right) with values of the 0 h time point in each genotype normalized to 100%. Values represent means normalized to 100% at 0 h ± SEM. Significantly different compared with wt, **p < 0.01 by unpaired t test.
We found a time-dependent decrease in the amount of biotinylated NR1, as would be expected of any protein as it undergoes biological turnover. Somewhat surprisingly, the rate of surface NR1 loss proceeded more rapidly in YAC72 MSNs compared with wt MSNs (p < 0.01 at 12 h time point) (Fig. 3b,d,e). In a small number of experiments, the assay was repeated probing for NR2B, and a similar trend was observed (Fig. 3d,e, right columns) (n = 2 for wt and n = 3 for YAC72). In contrast, the rate of loss of GluR1 in YAC72 MSNs resembled that observed in wt MSNs (70 ± 14 and 71 ± 10% remaining at 12 h; 51 ± 12 and 35 ± 11% remaining at 24 h, for YAC72 and wt MSNs, respectively; n = 5–6 and 2–4 different experiments for each time point for YAC72 and wt MSNs, respectively) The data for NR1 and NR2B are seemingly at odds with the observation of a higher steady-state level of surface NMDAR expression in YAC72 MSNs. It is conceivable, however, that striatal MSNs from YAC72 mice exhibit faster kinetics for NMDAR trafficking in both removal from and insertion to the cell surface, because these two arms of the trafficking cycle together dictate the overall distribution of surface and internal receptors.
Increased rate of NMDAR insertion to the surface membrane in YAC72 MSNs
To determine whether insertion of NMDARs occurs at a faster rate in cultured MSNs from YAC72 mice compared with wt mice, we used two different methods. The first of these was an electrophysiological approach similar to that described previously (Lan et al., 2001; Tovar and Westbrook, 2002; Mu et al., 2003; Lin et al., 2004), monitoring recovery of NMDAR-mediated current after functional blockade of surface receptors by the use-dependent NMDAR antagonist MK-801. To fully activate and then block all surface NMDARs, NMDA was applied, first alone and then in conjunction with MK-801, followed by extensive washout of the drugs. Once blocked, the receptors remained inactivated throughout the course of the experiment, because MK-801 binding to the NMDAR channel is expected to be irreversible under the voltage-clamp conditions used and for the duration of our experiments (Huettner and Bean, 1988). Any recovery of NMDAR-mediated current should thus reflect insertion of new receptors to the surface. After confirmation of complete NMDAR block by MK-801 (Fig. 4a), NMDA-evoked current was monitored at 5 min intervals. To estimate numbers of NMDARs inserted per unit area of neuronal membrane (i.e., density of new receptors), NMDAR current amplitude recovery was normalized to membrane capacitance. As well, we analyzed the integrated NMDA-evoked current over a 500 ms application time to minimize the effect of noise on the accuracy of measuring peak amplitude of these relatively small whole-cell currents. Recovery of NMDA-induced current was threefold, threefold, and twofold higher in YAC72 compared with wt striatal MSNs at 5, 10, and 15 min after MK-801 washout, respectively (Fig. 4c), a difference that was significant at the 10 and 15 min time points (p < 0.01 at 10 min; p < 0.05 at 15 min). This marked increase in the rate of NMDAR current recovery indicates a more rapid insertion of NMDARs to the plasma membrane from internal, plasma membrane-proximal pools in YAC72 MSNs.
Figure 4.

Recovery of NMDA-evoked current after functional blockade of surface receptors is faster in cultured striatal MSNs from YAC72 versus wt mice. a, Sample trace for NMDA-induced current from whole-cell patch-clamp recording of cultured striatal MSNs at 9–10 d.i.v., before (Pre-Block) and after (Post-Block) blockade of surface NMDARs by coapplication of 1 mm NMDA and 5 μm MK-801. b, Representative recording from YAC72 MSN showing NMDA-evoked current recovery after MK-801 block; each current trace represents average of three consecutive responses to 500 ms pulses of 1 mm NMDA. c, Plot of recovery of NMDA-induced IAUC (integrated current, normalized to Cm) over time. Values represent mean ± SEM from n = 15, 10, 6 (wt) and 8, 6, 5 (YAC72) cells for 5, 10, and 15 min time points, respectively, after block by MK-801. *p < 0.05, **p < 0.01 determined by two-way ANOVA, Bonferroni's post hoc test.
Because we were also interested in characterizing the rate of NMDAR insertion over a longer timescale, we performed a modified version of the biotinylation assay to examine accumulation of NR1 on the cell surface at time points up to 6 h after block of endocytic and recycling processes (Fig. 5a). Chlorpromazine, used in the treatment of psychotic disorders, is a cationic amphiphilic drug shown previously to inhibit clathrin-dependent endocytosis and recycling (Wang et al., 1993; Zhu et al., 2005). Treatment of cultured striatal MSNs with chlorpromazine followed by biotin labeling of surface proteins allowed us to track the accumulation of NMDARs resulting from insertion of new, but not recycled, receptors to the plasma membrane. We found that NR1 accumulated at the cell surface more rapidly in chlorpromazine-treated MSNs from YAC72 mice compared with wt (Fig. 5b). Although the proportion of total NR1 present at the cell surface remained at ∼40% in MSNs from wt mice over the 6 h period examined, the percentage of surface NR1 increased from 59 to 67% in YAC72 neurons (Fig. 5c). Values normalized to initial surface NR1 percentages at the 0 h time point revealed a statistically significant increase of surface NR1 levels in YAC72 but not wt MSNs (p < 0.05 by unpaired t test) (Fig. 5d), confirming a more rapid rate of NMDAR insertion in the absence of receptor endocytosis/recycling. Similar results were obtained in a small number of experiments in which we probed for NR2B (Fig. 5c,d, right columns) (n = 2 each for wt and YAC72 MSNs). Conversely, rates of surface insertion of GluR1 in YAC72 MSNs resembled that found in wt MSNs (surface expression: 41 ± 3% at 0 h and 45 ± 7% at 6 h for YAC72, and 34 ± 2% at 0 h and 30 ± 4% at 6 h for wt MSNs; n = 4; p > 0.05 for change from baseline to 6 h by unpaired t test, comparing wt with YAC72 MSNs).
Figure 5.

Insertion of NR1/NR2B to the surface over hours proceeds more rapidly in cultured striatal MSNs from YAC72 versus wt mice. a, Scheme of biotinylation experiment to analyze receptor insertion in the absence of endocytosis or recycling. Striatal neurons at 9–10 d.i.v. were treated with 10 μm chlorpromazine, an inhibitor of clathrin-dependent endocytosis and recycling, for 0, 0.5, or 6 h. Surface proteins were then labeled with biotin and analyzed as in Figure 3. b, Representative immunoblot showing insertion of NR1 to the surface. Biot Eluate, Biotinylation eluate; SPN, supernatant. Accumulation of surface NR1 typically results in a decrease in the NR1 band density for SPN and/or an increase in the NR1 band density for Biot Eluate relative to the 0 h time point. c, Plot of surface insertion of NR1 (left) or NR2B (right) over time. Symbols represent mean ± SEM from n = 6–8 (NR1) or the mean of 2 (NR2B; with the 2 data points indicated by horizontal lines) independent experiments from different batches of cultured neurons. d, Plot of surface NR1 (left) or NR2B (right) insertion over time, with values of the 0 h time point in each genotype normalized to 100%. Symbols represent means normalized to 100% at 0 h, with error bars (mean ± SEM) shown for NR1 and two data points indicated by horizontal lines for NR2B. Significantly different compared with wt, *p < 0.05 by unpaired t test.
Altered ratio of NR1 C2′ to C2 isoforms in YAC72 MSNs
To investigate further the mechanisms underlying the increased surface-to-internal ratio of NR1 in striatal neurons from YAC72 mice, we examined relative expression levels of NR1 subunit isoforms. The predominant isoform of NR1 expressed in striatal MSNs is NR1-1a (Kuppenbender et al., 1999), which contains both the C1 and C2 cassettes. Alternative splicing of NR1 mRNA has been shown to regulate the rate of NMDAR export from the endoplasmic reticulum (ER), which in turn affects the kinetics of forward trafficking (Okabe et al., 1999). Recent studies have shown that ER export can be accelerated by the presence of the C2′ domain (Scott et al., 2001; Mu et al., 2003). In light of these reports, we examined the expression of C2- or C2′-containing NR1 subunit isoforms in striatal tissue from wt and YAC72 mice.
We found the expression of total NR1 and its C2- and C2′-containing isoforms to be similar in total lysates from wt and YAC72 striatal tissue (data not shown). To assess possible changes at the subcellular level in the ratio of C2′- to C2-containing NR1 subunits, we fractionated striatal tissue from 2-month-old mice and analyzed expression of NR1 as well as the C2 and C2′ isoforms in different subcellular fractions. Notably, we found the relative expression of the NR1 C2′ isoform (compared with the C2 isoform) to be enriched in the P3 fraction, which primarily comprises light microsomal components, including endoplasmic reticulum and other vesicular and extra-synaptosomal membranes (Hallett et al., 2005), from YAC72 striatal tissue compared with wt (the mean C2′/C2 ratio was 0.81 ± 0.27 vs 0.38 ± 0.10 for YAC72 and wt, respectively; n = 3 different subcellular fractionations and 5 independent experiments in which immunoblotting analysis of striatal tissue from YAC72 and wt was performed in parallel). Although the C2′/C2 ratio in the P3 fraction was larger for YAC72 than wt in each of the five paired experiments, the magnitudes of these ratios were too variable for the difference in absolute values to reach statistical significance. However, normalization of ratios for the P3 fraction from YAC72 tissue to those obtained in paired wt tissue revealed that the fold difference (twofold increase in C2′/C2 ratio for YAC72 to wt) was significant compared with that obtained for the synaptosomal fraction, LP1 (fold difference was 0.91) (Fig. 6c,d). Total NR1 expression in both the P3 and LP1 fractions was similar for wt and YAC72 striatal tissue. Our results indicated that the NMDAR complexes in transit to or from the cell surface in YAC72 striatum are enriched for the C2′-containing NR1 isoform.
Increased association of NR1 C2′ isoforms with NR2 subunits in YAC72
Because C2′-containing NR1 isoforms can traffic to the membrane surface without complexing with NR2 (for review, see Wenthold et al., 2003), we asked whether the proportion of NR1 C2′ isoforms was increased in NR2-containing NMDAR complexes in YAC72 striatum. We performed immunoprecipitation experiments using antibodies directed against either NR2A (Fig. 7a) or NR2B (Fig. 7b) and probed for binding of C2′-containing NR1 splice variants or total NR1 in striatal tissue from wt and YAC72 mice. The association of NR2 subunits with NR1 C2′ isoforms was significantly increased in YAC72 striatal tissue (Fig. 7c); importantly, antibody-free control samples were processed in parallel and confirmed lack of nonspecific binding of proteins to the resin (data not shown). Our results suggest that NR2B- and NR2A-containing NMDARs are trafficked more quickly to the surface in YAC72 neurons by virtue of their increased association with NR1 splice variants that accelerate ER export. Notably, the increase in NR1 C2′ associated with NR2B in YAC72 compared with wt MSNs was significantly larger than that observed for NR2A (Fig. 7d). This finding is consistent with previous work, suggesting that mhtt particularly enhances NR2B-dependent current and excitotoxicity (Chen et al., 1999; Zeron et al., 2001, 2002).
Figure 7.

Association of NR2 subunits with NR1 C2′ is increased in striatal tissue from YAC72 versus wt mice. a, Representative immunoblots from anti-NR2A immunoprecipitations. Interacting NR1 subunits in general (left) or NR1 C2′ isoforms (right) in particular are detected by immunoblotting. Lys, Lysate; IP, immunoprecipitate; SPN, supernatant. b, Representative immunoblots from anti-NR2B immunoprecipitations. c, Plot showing fraction of immunoprecipitated NR1 C2′ normalized to NR1. Fractions of total NR1 or C2′-containing NR1 that coprecipitated with NR2A or NR2B were individually calculated. Values for NR1 C2′ were then normalized to NR1 values. Bars represent mean ± SEM of the normalized immunoprecipitated NR1 C2′/NR1 ratio, from n = 3 independent experiments in which wt and YAC72 samples were processed and analyzed in parallel. Significantly different compared with wt, *p < 0.05 by paired t test. d, Plot showing fold change in YAC72 versus wt ratios of normalized immunoprecipitated NR1 C2′/NR1. Values shown are averaged from n = 3 experiments in which both wt and YAC72 samples were processed and analyzed in parallel. Significantly different compared with NR2A, *p < 0.05 by paired t test.
Discussion
PolyQ length-dependent increase in NMDAR current density by mhtt is selective for neuronal type and GluR subclass
The excitotoxic hypothesis in HD stipulates that selective vulnerability of MSNs results from excessive activation of GluRs; evidence suggests that NMDARs are more effective, and selective, than other GluR subclasses in mediating excitotoxic damage (for review, see DiFiglia, 1990). We show in cultured MSNs from YAC transgenic mice expressing full-length human htt that NMDAR current density is proportional to htt polyQ length, consistent with the correlation between increasing polyQ length and earlier onset of HD (Brinkman et al., 1997) and confirming that polyQ expansion (not overexpression of the YAC or htt itself) is required for the effect on NMDAR activity. Together with previous studies showing enhanced polyQ length-dependent NMDAR-mediated apoptosis of MSNs (Zeron et al., 2002; Shehadeh et al., 2006), our results indicate that aberrant NMDAR signaling may contribute to neuronal degeneration in HD.
We found that mhtt enhanced NMDAR- but not AMPA/kainate receptor-mediated current in MSNs, an effect selective for neuronal type because it was not observed in cortical pyramidal neurons. The lack of mhtt potentiation of non-NMDA-type GluRs agrees with results from the R6/2 mouse model (Cepeda et al., 2001), supporting the idea of a selective functional interaction between NMDARs and mhtt. The absence of NMDAR current potentiation by mhtt in cortical neurons is consistent with a recent report in R6/2 mice (Andre et al., 2006) and may result in part from lower levels of NR2B relative to NR2A compared with MSNs (Li et al., 2003b), because previous work suggests that the NR2B subunit plays a role in mediating the functional effect of mhtt on NMDARs (Chen et al., 1999). A lower NR2B content in cortical neurons is supported by our results showing reduced IFN sensitivity compared with MSNs. The absence of increased NMDAR activity may help explain the preservation of cortical neurons until late stages of HD (Vonsattel and DiFiglia, 1998) in contrast to the selective vulnerability of MSNs.
Altered NMDAR trafficking in mhtt-expressing MSNs
Possible explanations for potentiation of NMDAR current by mhtt include altered NMDAR channel properties, subunit composition, overall expression levels, and/or numbers of functional receptors at the cell surface. Previous studies showed no change in NR1/NR2B total expression or single-channel properties (Chen et al., 1999; Li et al., 2003b). Although changes in NMDAR subunit composition may contribute to the increased NMDAR current found in R6/2 MSNs (Ali and Levine, 2006), our data do not support this mechanism in transgenic YAC MSNs. Instead, we observed a higher surface-to-internal ratio of NMDAR expression in YAC72 MSNs, which could explain the enhanced NMDA-evoked current observed in these neurons.
Given the higher steady-state surface expression of NMDARs in YAC72 MSNs, it was surprising that loss of surface NMDARs proceeded more rapidly in MSNs from YAC72 than wt mice. Conversely, our finding in YAC72 MSNs of upregulated lysosomal NMDAR degradation is consistent with a previous report showing activation of the endosomal/lysosomal pathway and enhanced expression of lysosomal proteases by mhtt (Kegel et al., 2000). Importantly, we also found a significantly faster rate of NMDAR insertion to the surface on a timescale of minutes as well as hours. It is difficult to directly compare our data on rates of surface NR1 loss with rates of insertion to the surface attributable to differences in experimental approach. As an estimate, in a 6 h period, the loss of surface NR1 in YAC72 MSNs exceeded that in wt MSNs by ∼5% of the initial surface receptor pool (Fig. 3d), whereas in that same time period, numbers of newly inserted NR1 were equivalent to nearly 15% of the original surface NR1 pool in YAC72 MSNs without new insertion of NR1 to the surface in wt MSNs (Fig. 5d). These results suggest that forward NMDAR trafficking rates dominate to produce increased steady-state surface receptor expression in YAC72 MSNs.
The rate of NMDAR current recovery after electrophysiological silencing of surface receptors by MK-801 was significantly faster for YAC72 MSNs (by twofold to threefold) within the first 15 min after washout of unbound MK-801, under conditions (VH of −80 mV, 20–21°C) in which unbinding of MK-801 from “silenced” receptors was unlikely to occur. Under these conditions, the recovery of NMDA-evoked current (wt, 1.1 ± 0.8% and YAC72, 3.4 ± 0.9% of initial AUC recovered by 10 min after NMDAR block) implicates the presence of a readily insertable pool of NMDARs in close proximity to the plasma membrane. The faster current recovery in YAC72 MSNs indicates that this NMDAR pool is larger and/or their insertion is facilitated by mhtt. Additional experiments are necessary to investigate the relative contributions of these possibilities.
Chlorpromazine blocks the processes of clathrin-dependent endocytosis and recycling (Wang et al., 1993; Zhu et al., 2005). Enhanced cell surface accumulation of NMDARs after a 6 h chlorpromazine treatment suggests that delivery of newly synthesized NMDARs is facilitated in YAC72 compared with wt MSNs. In contrast to the measurable recovery of NMDAR current within minutes after MK-801 block, we found a small decrease in NR1 surface expression within 30 min of chlorpromazine treatment, consistent with a previous study attributing this effect to block of receptor recycling (Wang et al., 1993). Thus, acute recovery of NMDAR current after MK-801 block may reflect mainly recycling NMDARs, whereas accumulation of surface NMDARs in YAC72 MSNs over the 6 h chlorpromazine treatment likely represents newly synthesized receptors mobilized from the Golgi. The latter process is not expected to be affected by chlorpromazine (Wang et al., 1993; Veyhl et al., 2006), yet new receptor insertion was not observed in wt MSNs and was only modest in YAC72 MSNs over a 6 h period. Chlorpromazine may have additional effects on receptor forward trafficking or else homeostatic changes in receptor exocytosis may be induced in response to blockade of endocytosis, as shown previously for AMPARs over a timescale of minutes (Lledo et al., 1998; Man et al., 2000; Wang and Linden, 2000) (for review, see Groc and Choquet, 2006). Whether these compensatory changes apply to NMDARs and over longer treatment periods remain to be determined. Thus, we may have underestimated the rate of new NMDAR insertion to the surface, although our observation that this rate is faster for YAC72 MSNs remains valid.
Higher NR1 C2′/C2 ratio in striatal microsomal fraction suggests a mechanism for increased rate of NMDAR forward trafficking in YAC72 MSNs
The C-terminal TVV motif of the NR1 C2′ splice variant binds to COPII (coat protein complex II) at ER exit sites, increasing the release rate of NMDAR complexes to the Golgi and enhancing the surface-to-internal ratio of NMDAR expression (Mu et al., 2003). The higher ratio of C2′ to C2 NR1 isoforms in the ER-enriched P3 fraction from striata of YAC72 compared with wt mice could therefore contribute to higher basal levels of surface NMDARs in YAC72 MSNs. Moreover, we conclude that the increased proportion of NR1 C2′ leads to enhanced surface expression of NR2-containing NMDARs and not just homomeric NR1, because we found an increased association of NR1 C2′ splice variants with NR2A and NR2B, and surface expression of both NR1 and NR2B were augmented, in YAC72 MSNs. Additional experiments are required to determine the effect of mhtt on differential splicing of NR1 mRNAs. Although the C2′/C2 ratio regulates surface expression of recombinant NR1/NR2B receptors (Mu et al., 2003), additional NR2B-specific mechanisms may contribute to mhtt enhancement of NMDAR surface expression. One candidate is phosphorylation of NR2B, known to regulate its trafficking to/from the surface (for review, see Wenthold et al., 2003). Notably, htt is found associated with ER membranes (DiFiglia et al., 1995), and altered phosphorylation levels at specific sites of polyQ-expanded htt contribute to its cellular toxicity (Rangone et al., 2004; Pardo et al., 2006).
Despite the presence of the TVV motif in the NR1 C2′ isoform, which also functions as a PDZ (PSD-95/Discs large/zona occludens-1) ligand to bind PSD-95 family members (Kornau et al., 1995), the C2′/C2 ratio in the LP1 fraction was not increased in YAC72 compared with wt striatal tissue. A comparable increase in PDZ domain-containing proteins may be needed to facilitate further synaptic incorporation of NMDARs, and we found no evidence for increased expression of PDZ proteins in total lysates or LP1 fractions from YAC72 compared with wt striatal tissue (M.M.Y.F. and C.M.C., unpublished observations). Thus, in YAC72 striatal tissue, NMDAR complexes enriched in the NR1 C2′ splice variant may be selectively expressed on nonsynaptic plasma membranes (included in the P3 fraction). Augmentation of the extrasynaptic NMDAR pool in YAC72 MSNs may favor cell death signaling by glutamate (Hardingham and Bading, 2003).
Summary
We have shown for the first time that polyQ-expanded htt can alter NMDAR trafficking and enhance receptor surface expression in striatal MSNs. This effect is correlated with an increased ratio of NR1 C2′/C2, which could contribute to faster forward trafficking of NMDARs to the surface. Together with previous reports implicating excitotoxicity in HD, our findings indicate that altered surface expression and trafficking of NMDARs may play a prominent role in the pathology of mhtt expression, suggesting new targets for more effective and selective therapy in this devastating disease.
Footnotes
This work was supported by a Canadian Institutes of Health Research (CIHR) operating grant (L.A.R.) and the Fundamental Innovation in Neurodegenerative Diseases research unit funded by the Michael Smith Foundation for Health Research (MSFHR). M.M.Y.F. has been the recipient of a Doctoral Research Award from the CIHR, a Senior Graduate Studentship Award from the MSFHR, an Imperial Order of Daughters of the Empire War Memorial Scholarship for Doctoral Study, and a Barbara Allan Scholarship in Medicine. H.B.F. is the recipient of a Landmark Graduate Award from the Huntington Society of Canada. M.R.H. is a University Killam Professor and holds a Canada Research Chair in Human Genetics. L.A.R. is a CIHR Investigator and MSFHR Senior Scholar. We thank Esther Yu for assistance with neuronal culture preparation, Drs. A. J. Milnerwood and T. H. Murphy for comments on this manuscript, and Dr. T. H. Murphy for assistance with fluorescence intensity quantification in immunocytochemical experiments. We also thank Dr. S. R. Vincent for generously providing the anti-synaptophysin antibody.
References
- Albin RL, Young AB, Penney JB, Handelin B, Balfour R, Anderson KD, Markel DS, Tourtellotte WW, Reiner A. Abnormalities of striatal projection neurons and N-methyl-d-aspartate receptors in presymptomatic Huntington's disease. N Engl J Med. 1990;322:1293–1298. doi: 10.1056/NEJM199005033221807. [DOI] [PubMed] [Google Scholar]
- Ali NJ, Levine MS. Changes in expression of N-methyl-d-aspartate receptor subunits occur early in the R6/2 mouse model of Huntington's disease. Dev Neurosci. 2006;28:230–238. doi: 10.1159/000091921. [DOI] [PubMed] [Google Scholar]
- Andre VM, Cepeda C, Venegas A, Gomez Y, Levine MS. Altered cortical glutamate receptor function in the R6/2 model of Huntington's disease. J Neurophysiol. 2006;95:2108–2119. doi: 10.1152/jn.01118.2005. [DOI] [PubMed] [Google Scholar]
- Beal MF, Kowall NW, Ellison DW, Mazurek MF, Swartz KJ, Martin JB. Replication of the neurochemical characteristics of Huntington's disease by quinolinic acid. Nature. 1986;321:168–171. doi: 10.1038/321168a0. [DOI] [PubMed] [Google Scholar]
- Beal MF, Ferrante RJ, Swartz KJ, Kowall NW. Chronic quinolinic acid lesions in rats closely resemble Huntington's disease. J Neurosci. 1991;11:1649–1659. doi: 10.1523/JNEUROSCI.11-06-01649.1991. [DOI] [PMC free article] [PubMed] [Google Scholar]
- Brinkman RR, Mezei MM, Theilmann J, Almqvist E, Hayden MR. The likelihood of being affected with Huntington disease by a particular age, for a specific CAG size. Am J Hum Genet. 1997;60:1202–1210. [PMC free article] [PubMed] [Google Scholar]
- Cepeda C, Ariano MA, Calvert CR, Flores-Hernandez J, Chandler SH, Leavitt BR, Hayden MR, Levine MS. NMDA receptor function in mouse models of Huntington disease. J Neurosci Res. 2001;66:525–539. doi: 10.1002/jnr.1244. [DOI] [PubMed] [Google Scholar]
- Chen N, Luo T, Wellington C, Metzler M, McCutcheon K, Hayden MR, Raymond LA. Subtype-specific enhancement of NMDA receptor currents by mutant huntingtin. J Neurochem. 1999;72:1890–1898. doi: 10.1046/j.1471-4159.1999.0721890.x. [DOI] [PubMed] [Google Scholar]
- Christie JM, Jane DE, Monaghan DT. Native N-methyl-d-aspartate receptors containing NR2A and NR2B subunits have pharmacologically distinct competitive antagonist binding sites. J Pharmacol Exp Ther. 2000;292:1169–1174. [PubMed] [Google Scholar]
- Cull-Candy S, Brickley S, Farrant M. NMDA receptor subunits: diversity, development and disease. Curr Opin Neurobiol. 2001;11:327–335. doi: 10.1016/s0959-4388(00)00215-4. [DOI] [PubMed] [Google Scholar]
- DiFiglia M. Excitotoxic injury of the neostriatum: a model for Huntington's disease. Trends Neurosci. 1990;13:286–289. doi: 10.1016/0166-2236(90)90111-m. [DOI] [PubMed] [Google Scholar]
- DiFiglia M, Sapp E, Chase K, Schwarz C, Meloni A, Young C, Martin E, Vonsattel JP, Carraway R, Reeves SA, Boyce FM, Aronin N. Huntingtin is a cytoplasmic protein associated with vesicles in human and rat brain neurons. Neuron. 1995;14:1075–1081. doi: 10.1016/0896-6273(95)90346-1. [DOI] [PubMed] [Google Scholar]
- Dunah AW, Standaert DG. Dopamine D1 receptor-dependent trafficking of striatal NMDA glutamate receptors to the postsynaptic membrane. J Neurosci. 2001;21:5546–5558. doi: 10.1523/JNEUROSCI.21-15-05546.2001. [DOI] [PMC free article] [PubMed] [Google Scholar]
- Ehlers MD. Reinsertion or degradation of AMPA receptors determined by activity-dependent endocytic sorting. Neuron. 2000;28:511–525. doi: 10.1016/s0896-6273(00)00129-x. [DOI] [PubMed] [Google Scholar]
- Ferrante RJ, Kowall NW, Cipolloni PB, Storey E, Beal MF. Excitotoxin lesions in primates as a model for Huntington's disease: histopathologic and neurochemical characterization. Exp Neurol. 1993;119:46–71. doi: 10.1006/exnr.1993.1006. [DOI] [PubMed] [Google Scholar]
- Graham RK, Deng Y, Slow EJ, Haigh B, Bissada N, Lu G, Pearson J, Shehadeh J, Bertram L, Murphy Z, Warby SC, Doty CN, Roy S, Wellington CL, Leavitt BR, Raymond LA, Nicholson DW, Hayden MR. Cleavage at the caspase-6 site is required for neuronal dysfunction and degeneration due to mutant huntingtin. Cell. 2006;125:1179–1191. doi: 10.1016/j.cell.2006.04.026. [DOI] [PubMed] [Google Scholar]
- Groc L, Choquet D. AMPA and NMDA glutamate receptor trafficking: multiple roads for reaching and leaving the synapse. Cell Tissue Res. 2006;326:423–438. doi: 10.1007/s00441-006-0254-9. [DOI] [PubMed] [Google Scholar]
- Hallett PJ, Dunah AW, Ravenscroft P, Zhou S, Bezard E, Crossman AR, Brotchie JM, Standaert DG. Alterations of striatal NMDA receptor subunits associated with the development of dyskinesia in the MPTP-lesioned primate model of Parkinson's disease. Neuropharmacology. 2005;48:503–516. doi: 10.1016/j.neuropharm.2004.11.008. [DOI] [PubMed] [Google Scholar]
- Hansson O, Guatteo E, Mercuri NB, Bernardi G, Li XJ, Castilho RF, Brundin P. Resistance to NMDA toxicity correlates with appearance of nuclear inclusions, behavioural deficits and changes in calcium homeostasis in mice transgenic for exon 1 of the huntington gene. Eur J Neurosci. 2001;14:1492–1504. doi: 10.1046/j.0953-816x.2001.01767.x. [DOI] [PubMed] [Google Scholar]
- Hantraye P, Riche D, Maziere M, Isacson O. A primate model of Huntington's disease: behavioral and anatomical studies of unilateral excitotoxic lesions of the caudate-putamen in the baboon. Exp Neurol. 1990;108:91–104. doi: 10.1016/0014-4886(90)90014-j. [DOI] [PubMed] [Google Scholar]
- Hardingham GE, Bading H. The Yin and Yang of NMDA receptor signaling. Trends Neurosci. 2003;26:81–89. doi: 10.1016/S0166-2236(02)00040-1. [DOI] [PubMed] [Google Scholar]
- Hell JW, Jahn R. Preparation of synaptic vesicles from mammalian brain. In: Celis JE, editor. Cell biology: a laboratory handbook. Vol I. San Diego: Academic; 1994. pp. 567–574. [Google Scholar]
- Hodgson JG, Agopyan N, Gutekunst CA, Leavitt BR, LePiane F, Singaraja R, Smith DJ, Bissada N, McCutcheon K, Nasir J, Jamot L, Li XJ, Stevens ME, Rosemond E, Roder JC, Phillips AG, Rubin EM, Hersch SM, Hayden MR. A YAC mouse model for Huntington's disease with full-length mutant huntingtin, cytoplasmic toxicity, and selective striatal neurodegeneration. Neuron. 1999;23:181–192. doi: 10.1016/s0896-6273(00)80764-3. [DOI] [PubMed] [Google Scholar]
- Hollmann M, Heinemann S. Cloned glutamate receptors. Annu Rev Neurosci. 1994;17:31–108. doi: 10.1146/annurev.ne.17.030194.000335. [DOI] [PubMed] [Google Scholar]
- Huettner JE, Bean BP. Block of N-methyl-d-aspartate-activated current by the anticonvulsant MK-801: selective binding to open channels. Proc Natl Acad Sci USA. 1988;85:1307–1311. doi: 10.1073/pnas.85.4.1307. [DOI] [PMC free article] [PubMed] [Google Scholar]
- Huntington's Disease Collaborative Research Group. A novel gene containing a trinucleotide repeat that is expanded and unstable on Huntington's disease chromosomes. Cell. 1993;72:971–983. doi: 10.1016/0092-8674(93)90585-e. [DOI] [PubMed] [Google Scholar]
- Kegel KB, Kim M, Sapp E, McIntyre C, Castano JG, Aronin N, DiFiglia M. Huntingtin expression stimulates endosomal-lysosomal activity, endosome tabulation, and autophagy. J Neurosci. 2000;20:7268–7278. doi: 10.1523/JNEUROSCI.20-19-07268.2000. [DOI] [PMC free article] [PubMed] [Google Scholar]
- Kornau HC, Schenker LT, Kennedy MB, Seeburg PH. Domain interaction between NMDA receptor subunits and the postsynaptic density protein PSD-95. Science. 1995;269:1737–1740. doi: 10.1126/science.7569905. [DOI] [PubMed] [Google Scholar]
- Kuppenbender KD, Albers DS, Iadarola MJ, Landwehrmeyer GB, Standaert DG. Localization of alternatively spliced NMDAR1 glutamate receptor isoforms in rat striatal neurons. J Comp Neurol. 1999;415:204–217. [PubMed] [Google Scholar]
- Lan JY, Skeberdis VA, Jover T, Grooms SY, Lin Y, Araneda RC, Zheng X, Bennett MV, Zukin RS. Protein kinase C modulates NMDA receptor trafficking and gating. Nat Neurosci. 2001;4:382–390. doi: 10.1038/86028. [DOI] [PubMed] [Google Scholar]
- Landwehrmeyer GB, Standaert DG, Testa CM, Penney JB, Young AB. NMDA receptor subunit mRNA expression by projection neurons and interneurons in rat striatum. Neuroscience. 1995;15:5297–5307. doi: 10.1523/JNEUROSCI.15-07-05297.1995. [DOI] [PMC free article] [PubMed] [Google Scholar]
- Leavitt BR, Raamsdonk JM, Shehadeh J, Fernandes H, Murphy Z, Graham RK, Wellington CL, Raymond LA, Hayden MR. Wild-type huntingtin protects neurons from excitotoxicity. J Neurochem. 2006;96:1121–1129. doi: 10.1111/j.1471-4159.2005.03605.x. [DOI] [PubMed] [Google Scholar]
- Li B, Otsu Y, Murphy TH, Raymond LA. Developmental decrease in NMDA receptor desensitization associated with shift to synapse and interaction with postsynaptic density-95. J Neurosci. 2003a;23:11244–11254. doi: 10.1523/JNEUROSCI.23-35-11244.2003. [DOI] [PMC free article] [PubMed] [Google Scholar]
- Li L, Fan M, Icton CD, Chen N, Leavitt BR, Hayden MR, Murphy TH, Raymond LA. Role of NR2B-type NMDA receptors in selective neurodegeneration in Huntington disease. Neurobiol Aging. 2003b;24:1113–1121. doi: 10.1016/j.neurobiolaging.2003.04.003. [DOI] [PubMed] [Google Scholar]
- Lin Y, Skeberdis VA, Francesconi A, Bennett MV, Zukin RS. Postsynaptic density protein-95 regulates NMDA channel gating and surface expression. J Neurosci. 2004;24:10138–10148. doi: 10.1523/JNEUROSCI.3159-04.2004. [DOI] [PMC free article] [PubMed] [Google Scholar]
- Lledo PM, Zhang X, Sudhof TC, Malenka RC, Nicoll RA. Postsynaptic membrane fusion and long-term potentiation. Science. 1998;279:399–403. doi: 10.1126/science.279.5349.399. [DOI] [PubMed] [Google Scholar]
- Man HY, Lin JW, Ju WH, Ahmadian G, Liu L, Becker LE, Sheng M, Wang YT. Regulation of AMPA receptor-mediated synaptic transmission by clathrin-dependent receptor internalization. Neuron. 2000;25:649–662. doi: 10.1016/s0896-6273(00)81067-3. [DOI] [PubMed] [Google Scholar]
- Mu Y, Otsuka T, Horton AC, Scott DB, Ehlers MD. Activity-dependent mRNA splicing controls ER export and synaptic delivery of NMDA receptors. Neuron. 2003;40:581–594. doi: 10.1016/s0896-6273(03)00676-7. [DOI] [PubMed] [Google Scholar]
- Okabe S, Miwa A, Okado H. Alternative splicing of the C-terminal domain regulates cell surface expression of the NMDA receptor NR1 subunit. J Neurosci. 1999;19:7781–7791. doi: 10.1523/JNEUROSCI.19-18-07781.1999. [DOI] [PMC free article] [PubMed] [Google Scholar]
- Pardo R, Colin E, Regulier E, Aebischer P, Deglon N, Humbert S, Saudou F. Inhibition of calcineurin by FK506 protects against polyglutamine-huntingtin toxicity through an increase of huntingtin phosphorylation at S421. J Neurosci. 2006;26:1635–1645. doi: 10.1523/JNEUROSCI.3706-05.2006. [DOI] [PMC free article] [PubMed] [Google Scholar]
- Price CJ, Kim P, Raymond LA. D1 dopamine receptor-induced cyclic AMP-dependent protein kinase phosphorylation and potentiaiton of striatal glutamate receptors. J Neurochem. 1999;73:2441–2446. doi: 10.1046/j.1471-4159.1999.0732441.x. [DOI] [PubMed] [Google Scholar]
- Prybylowski K, Wenthold RJ. N-methyl-d-aspartate receptors: subunit assembly and trafficking to the synapse. J Biol Chem. 2004;279:9673–9676. doi: 10.1074/jbc.R300029200. [DOI] [PubMed] [Google Scholar]
- Rangone H, Poizat G, Troncoso J, Ross CA, MacDonald ME, Saudou F, Humbert S. The serum- and glucocorticoid-induced kinase SGK inhibits mutant huntingtin-induced toxicity by phosphorylating serine 421 of huntingtin. Eur J Neurosci. 2004;19:273–279. doi: 10.1111/j.0953-816x.2003.03131.x. [DOI] [PubMed] [Google Scholar]
- Sanberg PR, Calderon SF, Giordano M, Tew JM, Normal AB. The quinolinic acid model of Huntington's disease: locomotor abnormalities. Exp Neurol. 1989;105:45–53. doi: 10.1016/0014-4886(89)90170-2. [DOI] [PubMed] [Google Scholar]
- Schoepfer R, Monyer H, Sommer B, Wisden W, Sprengel R, Kuner T, Lomeli H, Herb A, Kohler M, Burnashev N, Gunther W, Ruppersberg P, Seeburg P. Molecular biology of glutamate receptors. Prog Neurobiol. 1994;42:353–357. doi: 10.1016/0301-0082(94)90076-0. [DOI] [PubMed] [Google Scholar]
- Scott DB, Blanpied TA, Swanson GT, Zhang C, Ehlers MD. An NMDA receptor ER retention signal regulated by phosphorylation and alternative splicing. J Neurosci. 2001;21:3063–3072. doi: 10.1523/JNEUROSCI.21-09-03063.2001. [DOI] [PMC free article] [PubMed] [Google Scholar]
- Shehadeh J, Fernandes HB, Zeron Mullins MM, Graham RK, Leavitt BR, Hayden MR, Raymond LA. Striatal neuronal apoptosis is preferentially enhanced by NMDA receptor activation in YAC transgenic mouse model of Huntington disease. Neurobiol Dis. 2006;21:392–403. doi: 10.1016/j.nbd.2005.08.001. [DOI] [PubMed] [Google Scholar]
- Sieradzan KA, Mann DM. The selective vulnerability of nerve cells in Huntington's disease. Neuropathol Appl Neurobiol. 2001;27:1–21. doi: 10.1046/j.0305-1846.2001.00299.x. [DOI] [PubMed] [Google Scholar]
- Slow EJ, Graham RK, Osmand AP, Devon RS, Lu G, Deng Y, Pearson J, Vaid K, Bissada N, Wetzel R, Leavitt BR, Hayden MR. Absence of behavioral abnormalities and neurodegeneration in vivo despite widespread neuronal huntingtin inclusions. Proc Natl Acad Sci USA. 2005;102:11402–11407. doi: 10.1073/pnas.0503634102. [DOI] [PMC free article] [PubMed] [Google Scholar]
- Tovar KR, Westbrook GL. Mobile NMDA receptors at hippocampal synapses. Neuron. 2002;34:255–264. doi: 10.1016/s0896-6273(02)00658-x. [DOI] [PubMed] [Google Scholar]
- Velier J, Kim M, Schwarc C, Kim TW, Sapp E, Chase K, Aronin N, DiFiglia M. Wild-type and mutant huntingtins function in vesicle trafficking in the secretory and endocytic pathways. Exp Neurol. 1998;152:34–40. doi: 10.1006/exnr.1998.6832. [DOI] [PubMed] [Google Scholar]
- Veyhl M, Keller T, Gorboulev V, Vernaleken A, Koepsell H. RS1 (RSC1A1) regulates the exocytotic pathway of Na+-d-glucose cotransporter SGLT1. Am J Physiol Renal Physiol. 2006;291:F1213–F1223. doi: 10.1152/ajprenal.00068.2006. [DOI] [PubMed] [Google Scholar]
- Vonsattel JP, DiFiglia M. Huntington disease. J Neuropathol Exp Neurol. 1998;57:369–384. doi: 10.1097/00005072-199805000-00001. [DOI] [PubMed] [Google Scholar]
- Wang LH, Rothberg KG, Anderson RG. Mis-assembly of clathrin lattices on endosomes reveals a regulatory switch for coated pit formation. J Cell Biol. 1993;123:1107–1117. doi: 10.1083/jcb.123.5.1107. [DOI] [PMC free article] [PubMed] [Google Scholar]
- Wang YT, Linden DJ. Expression of cerebellar long-term depression requires postsynaptic clathrin-mediated endocytosis. Neuron. 2000;25:635–647. doi: 10.1016/s0896-6273(00)81066-1. [DOI] [PubMed] [Google Scholar]
- Wenthold RJ, Prybylowski K, Standley S, Sans N, Petralia RS. Trafficking of NMDA receptors. Annu Rev Pharmacol Toxicol. 2003;43:335–358. doi: 10.1146/annurev.pharmtox.43.100901.135803. [DOI] [PubMed] [Google Scholar]
- Williams K. Ifenprodil discriminates subtypes of the N-methyl-d-aspartate receptor: selectivity and mechanisms at recombinant heteromeric receptors. Mol Pharmacol. 1993;44:851–859. [PubMed] [Google Scholar]
- Young AB, Greenamyre JT, Hollingsworth Z, Albin R, D'Amato C, Shoulson I, Penney JB. NMDA receptor losses in putamen from patients with Huntington's disease. Science. 1988;241:981–983. doi: 10.1126/science.2841762. [DOI] [PubMed] [Google Scholar]
- Zeron MM, Chen N, Moshaver A, Lee AT, Wellington CL, Hayden MR, Raymond LA. Mutant huntingtin enhances excitotoxic cell death. Mol Cell Neurosci. 2001;17:41–53. doi: 10.1006/mcne.2000.0909. [DOI] [PubMed] [Google Scholar]
- Zeron MM, Hansson O, Chen N, Wellington CL, Leavitt BR, Brundin P, Hayden MR, Raymond LA. Increased sensitivity to N-methyl-d-aspartate receptor-mediated excitotoxicity in a mouse model of Huntington's disease. Neuron. 2002;33:849–860. doi: 10.1016/s0896-6273(02)00615-3. [DOI] [PubMed] [Google Scholar]
- Zeron MM, Fernandes HB, Krebs C, Shehadeh J, Wellington CL, Leavitt BR, Baimbridge KG, Hayden MR, Raymond LA. Potentiation of NMDA receptor-mediated excitotoxicity linked with intrinsic apoptotic pathway in YAC transgenic mouse model of Huntington's disease. Mol Cell Neurosci. 2004;25:469–479. doi: 10.1016/j.mcn.2003.11.014. [DOI] [PubMed] [Google Scholar]
- Zhu JX, Goldoni S, Bix G, Owens RT, McQuillan DJ, Reed CC, Iozzo RV. Decorin evokes protracted internalization and degradation of the epidermal growth factor receptor via caveolar endocytosis. J Biol Chem. 2005;280:32468–32479. doi: 10.1074/jbc.M503833200. [DOI] [PubMed] [Google Scholar]