

Abstract
The ability to stop motor responses depends critically on the right inferior frontal cortex (IFC) and also engages a midbrain region consistent with the subthalamic nucleus (STN). Here we used diffusion-weighted imaging (DWI) tractography to show that the IFC and the STN region are connected via a white matter tract, which could underlie a “hyperdirect” pathway for basal ganglia control. Using a novel method of “triangulation” analysis of tractography data, we also found that both the IFC and the STN region are connected with the presupplementary motor area (preSMA). We hypothesized that the preSMA could play a conflict detection/resolution role within a network between the preSMA, the IFC, and the STN region. A second experiment tested this idea with functional magnetic resonance imaging (fMRI) using a conditional stop-signal paradigm, enabling examination of behavioral and neural signatures of conflict-induced slowing. The preSMA, IFC, and STN region were significantly activated the greater the conflict-induced slowing. Activation corresponded strongly with spatial foci predicted by the DWI tract analysis, as well as with foci activated by complete response inhibition. The results illustrate how tractography can reveal connections that are verifiable with fMRI. The results also demonstrate a three-way functional–anatomical network in the right hemisphere that could either brake or completely stop responses.
Keywords: cognitive control, inferior frontal cortex, presupplementary motor area, subthalamic nucleus, tractography, stop signal
Introduction
A fundamental question is how thoughts and actions are controlled. It is likely that the prefrontal cortex is the source of control, exerting its effect by biasing posterior cortical and subcortical structures (Fuster, 1997; Knight et al., 1999; Miller and Cohen, 2001; Miller and D'Esposito, 2005). Here we investigated whether specific frontal and subcortical regions, known to relate to cognitive control, could be directly connected via white matter tracts.
Our tract analysis focused on brain regions important for the rapid countermanding of initiated motor responses, as revealed by the stop-signal paradigm (Logan and Cowan, 1984). On Go trials, subjects respond as fast as they can to an imperative stimulus. On Stop trials, a stop signal is presented at some delay after the Go signal, and subjects try to inhibit their response. Functional magnetic resonance imaging (fMRI) has shown that going activates a premotor–striatal–pallidal–motorcortical circuit (Aron and Poldrack, 2006), whereas stopping activates prefrontal regions, especially the right inferior frontal cortex (IFC) (Rubia et al., 2003; Aron and Poldrack, 2006; Pliszka et al., 2006; Chevrier et al., 2007). These findings are supported by neuropsychological studies indicating that the right IFC is critical for stopping (Aron et al., 2003; Chambers et al., 2006). Neurophysiological, lesion, and imaging studies also implicate the right IFC in stopping in the related Go/NoGo paradigm (for review, see Aron et al., 2004; Buchsbaum et al., 2005; Garavan et al., 2006; Sakagami et al., 2006)
The right IFC, or some other frontal region, may block the execution of the Go response via the basal ganglia. Both patients and experimental animals with basal ganglia damage have trouble stopping (Eagle and Robbins, 2003; Rieger et al., 2003). In particular, a likely role for the subthalamic nucleus (STN) in response inhibition has been revealed by deep brain stimulation in human patients (van den Wildenberg et al., 2006), lesions in rodents (Eagle et al., 2004), local field potential changes (Kuhn et al., 2004), and high-resolution fMRI (Aron and Poldrack, 2006). Activation of the STN may lead to response suppression insofar as the STN projects to the globus pallidus (Mink, 1996), which subsequently may inhibit the thalamo-motorcortical program initiated by the Go response (Coxon et al., 2006).
This model of frontal control over the STN needs an account of the connecting circuitry. Here we used diffusion-weighted imaging (DWI) tractography in humans to examine whether the right IFC projects directly to the ipsilateral STN region, via a so-called “hyperdirect” pathway, as suggested by nonhuman tract tracing (Nambu et al., 1997). We also developed a novel “triangulation” method to examine whether these two regions project to others. We found that they did overlap at another (third) focus, in the presupplementary motor area (preSMA). Identifying a new node in this way predicts the locus of fMRI activation for a task that engages the network functionally. We hypothesized that the preSMA could play a conflict-detection or monitoring role within the overall network, and, if so, the locus of preSMA activation would correspond with the focus predicted by DWI analysis. To evaluate this, we report a second experiment with fMRI. We used a conditional stop-signal test, yielding behavioral and neural signatures of conflict-induced engagement of the posited network.
Materials and Methods
Experiment 1: DWI
Subjects.
Ten healthy young subjects participated (six males; age range, 20–28 years). All subjects gave informed written consent in accordance with ethical approval from the Oxford Research Ethics Committee.
DWI acquisition.
DWI was performed using a 1.5T Siemens (Erlangen, Germany) Sonata at a resolution of 2 × 2 × 2 mm, with 15 repeats of the b = 0 (no diffusion weighting image) and 3 repeats of each of 60 gradient directions at b = 1000 [repetition time (TR), 9 s; echo time (TE), 89 ms]. Diffusion data were corrected for eddy currents and head motion by using affine registration to the first b = 0 reference volume (Jenkinson et al., 2002). Data from the three acquisitions of each diffusion direction were averaged to improve the signal-to-noise ratio.
DWI analysis overview.
DWI analysis consisted of several steps for each individual subject: calculating probability distributions on fiber direction at each voxel, running probabilistic tractography to identify a possible tract between seed regions, and thresholding the result to remove noise. Then, we used a simple metric to determine whether sufficient evidence existed for the posited tract at the group level. We verified our results using the novel triangulation method.
DWI analysis in detail.
We calculated probability distributions on fiber direction at each voxel using previously described methods (Behrens et al., 2003). Then, we ran probabilistic tractography with a model allowing for crossing fibers, using seed points defined in standard [Montreal Neurological Institute (MNI)] space (Behrens, 2006). We used seed regions for the right IFC and putative STN [sphere of 3 mm radius centered on voxel 42, 26, 14 for the IFC and 10, −14, −4 for the STN region, based on a previous fMRI study of stopping (Aron and Poldrack, 2006)]. Although our previous study had used high-resolution fMRI to localize stopping activation to a midbrain hypointense region corresponding to the STN (Aron and Poldrack, 2006), we note that limitations in resolution mean that such fMRI studies cannot unequivocally locate activation in the STN itself [e.g., the substantia nigra and red nucleus are close nearby (Dormont et al., 2004)]. Thus, although circuitry considerations (Mink, 1996) as well as adjunct evidence (Eagle et al., 2004; Kuhn et al., 2004; van den Wildenberg et al., 2006) strongly suggest that the STN itself is recruited by response inhibition, we nevertheless refer hereafter to the “STN region.”
Probabilistic tractography proceeded at the single-subject level to identify a putative IFC–STN tract. For each subject, 5000 tract-following samples were initiated, resulting in a probabilistic map of connectivity. Tracts were only accepted if they passed through both seed areas. The resulting map for each subject was then thresholded at a low level to remove noise (this was 0.02% of the maximum value in the connectivity map, which was a value of 10, in arbitrary units, for IFC and STN regions).
A first analysis at the group level consisted in binarizing the thresholded maps, averaging them, thresholding the result at 0.5, and inspecting it to examine whether a continuous tract was present (i.e., if at least 5 of the 10 subjects had a continuous tract). However, this “maximum overlap” method is overly conservative because it can only show the maximum number of subjects who have a connecting tract between two regions that overlaps in the same point in standard space. Instead, we inspected the individual thresholded subject maps one by one to determine whether a continuous tract existed in each individual, and we then reported the number of subjects (of 10) who met this criterion. This “individual inspection” method is capable of showing the number of subjects who have a continuous tract between two regions, regardless of the standard space location of the trajectory.
We used a novel triangulation method, which proceeded at the single-subject level. We generated tract maps (with 5000 samples, as described above), seeded in the STN region with no target, and seeded in the IFC with no target. Each map was thresholded at 0.02% maximum value (as described above) and binarized. The maps were then multiplied, to show overlap between tracts, and the average overlap map was produced at the group level. This group-level map was thresholded at 0.5 (i.e., at least 5 of 10 subjects had overlap at a given point) and masked using a gray matter standard space mask to identify regions of overlap that were not (trivially) located in white matter.
Experiment 2: fMRI with the conditional stop-signal paradigm
Subjects.
Fifteen right-handed, healthy English-speaking subjects (10 males; mean age, 28.1 ± 4.1 SD) participated in the fMRI study. All subjects were free of neurological or psychiatric history and gave informed consent according to a University of California Los Angeles (UCLA) Institutional Review Board protocol. All 15 subjects had also performed the standard stop-signal paradigm within the same scanning session. We administered conditional and standard paradigms in an approximately counterbalanced order. Behavioral and imaging data for the standard paradigm were reported previously for 13 of these subjects (Aron and Poldrack, 2006).
The conditional stop-signal task.
The stop-signal paradigm consists of a Go task and a Stop task. On each trial, a left- or right-pointing arrow stimulus was displayed on a computer screen. For the Go task, the subject responded as fast as possible with a left or right key press (using index and middle fingers of the right hand). For the Stop task (25% of trials), the subject attempted to stop his/her response when a stop signal was sounded at a particular stop-signal delay (SSD) subsequent to the arrow stimulus, but only if the arrow was pointing in the critical direction: for 8/15 of the subjects, this was leftward pointing; for 7/15 of the subjects, this was rightward pointing (see procedure below). There were 32 Stop and 96 Go trials per scan (128 trials total). In every four trials, there was one Stop trial and three Go trials, and the number of leftward- and rightward-pointing arrows was equal. The SSD value for the Stop trial was sampled from one of the four staircases in turn (see below). Null events were interposed between every Stop or Go trial. The duration of null time ranged between 0.5 and 4 s (mean, 1 s; sampled from an exponential distribution truncated at 4 s). We used a custom Matlab code to select sequences of Go, Stop, and null events and to select the distribution of null time in a way that optimized the detection of hemodynamic responses for the critical contrast of Stop and Go events (cf. Liu et al., 2001).
A Go trial started with a white circular fixation ring (subtending 4.3 × 6.2° when viewed with scanner goggles) appearing in the center of a black background screen. This was followed after 500 ms by a white arrow within the fixation ring. The fixation ring and arrow remained on the screen for up to 1 s (limited hold), after which they disappeared, and the background screen was shown for the null period. When the subject responded within the limited hold window, the fixation ring and arrow disappeared, and the background was shown for the remainder of the limited hold and for the null period. If the subject pressed the wrong key in response to the arrow, the computer recorded it as an erroneous response. A Stop trial was identical to a Go trial, except that a tone (900 Hz; duration, 500 ms) was played at some SSD after the arrow stimulus. If the subjects inhibited their response, then the arrow and fixation ring remained onscreen for the duration of the limited hold. If the subject responded, then the arrow and fixation ring disappeared, and the background screen was displayed for the remainder of the time. The SSD changed dynamically throughout the experiment, depending on the subject's behavior with respect to the critical key. If the subject inhibited successfully on a Stop trial, then inhibition was made more difficult on a subsequent Stop trial by increasing the SSD by 50 ms; if the subject did not successfully inhibit, then inhibition was made easier by decreasing the SSD by 50 ms. Four step-up and step-down algorithms (staircases) were used in this way to ensure convergence to P(inhibit) of 50% by the end of the experiment. The four staircases started with SSD values of 100, 150, 200, and 250 ms, respectively. In each block/scan of trials, there were 96 Go trials and 32 Stop trials, with 16 of these Stop trials for the critical direction. Hence, each staircase moved four times within each block for these critical direction trials. For Stop trials with the noncritical direction, SSDs were yoked to the critical direction values. The staircases were independent but were randomly interleaved (i.e., each particular Stop trial belonged to one particular staircase, but the order of the staircases was random trial by trial).
Conditional stop-signal procedure.
Before scanning, the subjects were trained to perform Go and Stop trials. We made clear to the subjects that stopping and going were equally important and that it would not always be possible to stop. Within the scanner, subjects responded with the index and middle fingers of their right hands on an MR-compatible button box. For eight subjects, the instruction was to only inhibit an index finger response if the stop signal occurred. For the other seven subjects, the critical finger was the middle one. Stop tones were played through headphones at a level that was both sufficient to exceed scanner noise and comfortable to the subject. Each scan was preceded by an instruction screen and was followed by feedback in the form of median-correct reaction time (RT) and the number of discrimination errors on the Go trials.
Behavioral analysis.
Several measures were computed for each subject: mean Go RT for both critical and noncritical trials; percentage of Stop trials with inhibition (StopInhibit) for the critical direction; number of Stop trials with inhibition for the noncritical direction; and mean RT on Stop trials without inhibition (StopRespond) for both critical and noncritical directions. Our main comparison of interest was noncritical Stop trials versus noncritical Go trials, which indexes “conflict-induced slowing.” To better characterize the difference between these conditions, we also examined the SD of responses (within subjects) as well as the overall shape of the distributions (pooling observations for all subjects in each condition). In addition, we examined successful inhibition itself by applying the standard Race Model (Logan and Cowan, 1984) to compute the stop-signal reaction time (SSRT). Because the dynamic tracking of SSD (see above) was varied to yield ∼50% P(inhibit), we estimated SSRT by subtracting the average SSD from the mean correct Go RT (Logan and Cowan, 1984; Band et al., 2003). We computed the average SSD for each subject, using the values of the four staircases after the subject had converged on 50% P(inhibit). To give a stable SSD estimate, we averaged the values for the last six moves in each of the four staircases (see above). This proved to be highly reliable within subjects, as assessed by comparing the average of staircases 1 and 2 with staircases 3 and 4 (r = 0.81; p < 0.001).
fMRI data acquisition.
The experiment was run using a 3T Siemens Allegra MRI scanner at the UCLA Ahmanson-Lovelace Brain Mapping Center. Each scanning run acquired 166 functional T2*-weighted echoplanar images (EPIs) [4 mm slice thickness; 33 slices; TR, 2 s; TE, 30 ms; flip angle, 90°; matrix, 64 × 64; field of view (FOV), 200; in-plane resolution, 3.125 mm]. The first two volumes in each run were discarded to allow for T1 equilibrium effects. Additionally, for registration purposes, a T2-weighted matched-bandwidth high-resolution anatomical scan (same slice prescription as EPI) and magnetization-prepared rapid gradient echo (MP-RAGE) were acquired for each subject. The MP-RAGE acquisition parameters were as follows: TR, 2.3; TE, 2.1; FOV, 256; matrix, 192 × 192; sagittal plane; slice thickness, 1 mm; 160 slices. Stimulus presentation and the timing of all stimuli and response events were achieved using Matlab (Mathworks, Natick, MA) and the Psychtoolbox (www.psychtoolbox.org) on an Apple PowerBook running Mac OS 9.
fMRI preprocessing and registration.
Data were preprocessed using the Functional Magnetic Resonance Imaging of the Brain (FMRIB) Software Library (FSL) (www.fmrib.ox.ac.uk/fsl). The functional time series were realigned to compensate for small head movements (Jenkinson et al., 2002). Translational movement parameters never exceeded 1 voxel in any direction for any subject or scan. All images were denoised using MELODIC independent components analysis within the FSL (Poldrack et al., 2005). Data were spatially smoothed using a 5 mm full-width half-maximum Gaussian kernel. The data were filtered in the temporal domain using a nonlinear high-pass filter with a 66 s cutoff. We used a three-step registration procedure whereby we first registered the EPIs to the matched-bandwidth high-resolution scan, then to the MP-RAGE structural image, and finally into standard space by using 12-parameter affine transformation to the MNI152 template with the FSL FLIRT registration tool (Jenkinson and Smith, 2001).
fMRI modeling.
Three different models were fit, with slightly different regressors. These were as follows: (1) basic model: Go_critical, Go_noncritical, StopInhibit_critical, StopRespond_critical, StopRespond_noncritical, and a nuisance event consisting of Go trials in which subjects did not respond or made errors and/or of StopInhibit_noncritical trials; (2) parametric analysis: this consisted in the basic model plus two extra regressors, Go_noncritical_param and StopRespond_noncritical_param, which added RT for these trial types; and (3) verification analysis: this consisted of the basic model in which Go_noncritical and StopRespond_noncritical were split into three regressor types each: fast, medium, and slow according to a division of RT into three bins (with equal numbers of observations) for each subject.
fMRI statistical analysis.
For the basic model, for each subject, and for each of three scans, we computed two contrast images: StopInhibit_critical − Go_critical, and StopRespond_noncritical − Go_noncritical. For the parametric analysis, we computed the following contrast: StopRespond_noncritical_param − Go_noncritical_param. For the verification analysis, we computed the following: StopRespond_noncritical − null and Go_noncritical − null, all done separately for fast, medium, and slow RT conditions.
Analysis was performed using FEAT (FMRI Expert Analysis Tool) version 5.1, part of FSL. Higher-level analysis (one-sample t test) was performed using OLS (ordinary least squares simple mixed effects). Z (Gaussianized T/F) statistic images were thresholded using clusters determined by Z > 2.3 and a (corrected) cluster significance threshold of p = 0.05 [using Gaussian Random Field Theory (GRFT)].
A regression of SSRT against StopInhibit_critical − Go_critical activation was performed using a small-volume correction for anatomically defined regions of interest (ROIs) for the right IFC, preSMA, and the STN region. For this analysis, we corrected activation maps for multiple comparisons by using small-volume correction based on GRFT (Z > 2.3; corrected cluster threshold, p < 0.05).
ROIs were as follows: the right IFC consisted of combined pars opercularis and pars triangularis from the Automated Anatomical Labeling (AAL) template (Tzourio-Mazoyer et al., 2002); the right STN region consisted of a box of size of 10 × 10 × 10 mm, centered at MNI coordinates 10, −15, −5, which provides full STN coverage according to an atlas of subcortical structures (Lucerna et al., 2002); and the preSMA comprised the SMA (y > 0) region from the AAL template.
We performed a conjunction analysis (Nichols et al., 2005) for the parametric conflict-induced slowing effect and outright inhibition by taking the parametric contrast of StopRespond_noncritical − Go_noncritical (Z > 2.3; p < 0.05, corrected for multiple comparisons), binarizing it, and multiplying it by the StopInhibit − Go contrast (Z >2.3; p < 0.05, corrected for multiple comparisons; also binarized).
Results
Experiment 1: tractography analysis of a frontal–subcortical network
We discovered that a continuous tract between the right IFC and the right STN region was evident in 9 of 10 subjects after low-level thresholding to exclude noise (Fig. 1 A). Because there is currently no formal test to establish the statistical significance of a tractography pathway, we used a novel triangulation approach to increase confidence in our results. Given any two potential nodes in a network, this approach made predictions about other potential connected nodes. If a third node was found, then we repeated the triangulation analysis to validate the existence of the original nodes.
Figure 1.

Diffusion-weighted tractography results. A, 3-D rendering of the tracts between the right IFC, the right preSMA, and the right STN region. B, Triangulation method for determining the third point in a network from the other two. Tracts originating in one brain area are overlaid on tracts originating from another. The overlap is superimposed on a gray matter mask in standard space. Tracts clearly overlap in the white matter space, but the overlap in gray matter is fairly unique: the preSMA only for tracts originating in the IFC and STN regions; the IFC and anterior prefrontal cortex (not shown) for tracts originating in the preSMA and the STN region and the thalamus only for tracts originating in the preSMA and the IFC.
When we performed triangulation analysis with tracts originating in the IFC and in the STN region, there was only a single gray matter region where the tracts overlapped in >50% of subjects: This was a region of the superior frontal gyrus, consistent with the anterior preSMA (Fig. 1 B, top row). This indicates a putative network involving the preSMA, the IFC, and the STN region in the right hemisphere. To confirm this, we examined whether tracts existed between the preSMA and the STN region and between the preSMA and the IFC. We found a continuous tract between the preSMA and the STN region in 7 of 10 subjects and a continuous tract between the preSMA and the IFC in 8 of 10 subjects.
Next, we used the triangulation method to examine whether the STN region and the preSMA could predict the IFC region and whether the IFC and the preSMA could predict the STN region. When pathways seeded in the STN region and the preSMA were overlapped, there were two areas outside the seeds that survived thresholding: one of these was the IFC (Fig. 1 B, middle row), and the other was in the anterior prefrontal cortex (data not shown). When pathways seeded in the IFC and the preSMA were overlapped, the only gray matter region outside the seed areas to survive in 50% of subjects was one that included the STN region and the centromedial nucleus of the thalamus (Fig. 1 B, bottom row).
These results clearly establish a network in the right hemisphere including the preSMA, IFC, and STN region. This is unlikely an artifact of choice of IFC and putative STN seed regions because, in each case, independently choosing two seed regions showed overlap almost uniquely in the vicinity of the third. This DWI analysis also predicted the potential functional importance of the preSMA region, something we examined in experiment 2 using fMRI.
Experiment 2: functional imaging of conflict-induced slowing
The tractography analysis in experiment 1 established that the right IFC and STN are connected and, moreover, that they are both connected to the preSMA. Our finding of connectivity with the preSMA is striking because a recent study reported that patients with damage to the right superior medial frontal lobe had deficits in stop-signal response inhibition (Floden and Stuss, 2006). It is also noteworthy that microstimulation studies in human subjects have identified a “negative” motor region in the anterior SMA (preSMA) where stimulation produces hesitation, arrest, or control of manual or vocal responses (Penfield and Welch, 1951; Luders et al., 1988; Fried et al., 1991; Stuphorn and Schall, 2006; Isoda and Hikosaka, 2007).
Although the right IFC could play a role in implementing the inhibition at the neural level (Aron, 2007), via inputs to the STN, the role of the preSMA remains unclear. One possibility is that the preSMA detects/monitors/resolves conflict and then either generates control or else interacts with the control functions of the lateral prefrontal cortex, consistent with much research (Bush et al., 2000; Gehring and Knight, 2000; Schall et al., 2002; Botvinick et al., 2004; Ridderinkhof et al., 2004; Rushworth et al., 2004; Yeung et al., 2004; Isoda and Hikosaka, 2007). The hypothesis that a preSMA-based conflict function may interact with a response control system was also motivated by computational modeling work, which suggests that the same putative STN mechanism that supports outright response inhibition could be recruited to slow responses in high-conflict situations (Frank, 2006).
Although we did find robust preSMA activation in our previous fMRI study of standard stopping (Aron and Poldrack, 2006), it was not possible to test the conflict hypothesis because there was no behavioral index of conflict detection/monitoring/resolution. Therefore, to test the hypothesis that the preSMA plays a conflict role in a network including the IFC and the STN, we used a conditional version of the stop-signal paradigm (Logan, 1994; De Jong et al., 1995). For each subject, one finger was designated as “critical,” and another was designated as “noncritical” (Fig. 2). The instruction was to inhibit the response only if the stop signal occurred and the response involved the critical finger. If the response involved the noncritical finger and the stop signal occurred, then the subject was required to respond anyway. In this design, a noncritical Stop trial involves conflict between a salient stop signal and a rule that says to ignore this stop signal for this particular stimulus context.
Figure 2.

The conditional stop-signal paradigm. A, Critical and noncritical Stop trials. On Go trials, the subject has 1 s (the hold period) to press a left or right button in response to a stimulus, using the index or middle finger of the right hand. On a Stop trial, a tone is played at some delay (SSD) after the arrow stimulus. The SSD changes dynamically throughout the experiment. Subjects are instructed in advance whether the critical finger is the index or middle one. If the arrow stimulus is in the critical direction and a tone occurs, then the subject must try to inhibit, but if the arrow is in the noncritical direction and a tone occurs, then the subject must respond anyway. B, The different trial types with descriptions. L, Left; R, right.
Based on previous results (De Jong et al., 1995), we expected that responses on noncritical trials would not be canceled by the stop signal but that they would, nevertheless, be significantly slowed (relative to noncritical trials without a stop signal), something we refer to as the “conflict-induced slowing” effect. Furthermore, we hypothesized that if the slowing effect was generated by conflict detection/monitoring/resolution, then there would be significant activation of the preSMA region. Moreover, if the preSMA region performed a functional role within the circuit between the preSMA, the IFC, and the STN region, then there would also be activation for the IFC and the STN region, and critically, activation at these three foci would correspond to the locations predicted by the DWI tractography analysis.
Behavior
Behavioral data are reported in Table 1. There was a significant conflict-induced slowing effect of 41 ms, on average (StopRespond_noncritical, 416 ± 51 ms; Go_noncritical, 375 ± 44 ms; t (14) = 6.19; p < 0.001). Although the presence of stop signals on noncritical trials slowed responses, it almost never canceled them; on average, there was less than one such trial for each subject. To better characterize the difference between StopRespond and Go on noncritical trials, we examined the SD of responses as well as the shape of the underlying distributions. StopRespond RT was significantly more variable than Go RT (t (14) = 6.77; p < 0.001). This might suggest that subjects sometimes completely stopped their responses on such StopRespond trials, only to restart them again. This would predict that the shape of the underlying distributions would be different, with a longer tail for StopRespond than Go. However, this was not borne out when examining the shape of the underlying distributions, which was very similar (supplemental Fig. 1, available at www.jneurosci.org as supplemental material).
Table 1.
Behavioral data
| Trial description | Measure | Value |
|---|---|---|
| Critical direction | ||
| Go a | Reaction time | 465 (85) ms |
| StopInhibit | % Inhibition | 54 (11.5) % |
| StopRespond | Reaction time | 416 (49) ms |
| Noncritical direction | ||
| Go | Reaction time | 375 (44) ms |
| StopInhibit | Number of omissions | 0.53 (0.64) |
| StopRespond b | Reaction time | 416 (51) ms |
| Go | STDEV of reaction time | 60.8 (17.8) |
| StopRespond c | STDEV of reaction time | 103.4 (32.7) |
| Other variables | ||
| Go discrim. errors | Number of errors | 2.7 (2.5) |
| Mean SSD | Time | 199 (101) |
| SSRT | Reaction time | 266 (53) |
Values shown are means and SDs (in parentheses). Mean SSD refers to the average stop-signal delay, computed from four staircases (see Materials and Methods) and the point at which p(inhibit) = ∼0.5. The SSRT is computed for each subject as Go_critical − meanSSD. discrim., Discrimination.
aGo_critical is significantly slower than Go_noncritical (p < 0.001).
bStopRespond_noncritical is significantly slower than Go_noncritical (p < 0.001).
cStopRespond trials were significantly more variable than Go trials in the noncritical direction (p < 0.001).
With respect to critical trials, subjects responded quickly (465 ± 85 ms) and accurately (making only 2.7 discrimination errors, on average). The dynamic adjustment of SSD converged on a probability of inhibition that was close to 50% (actual value, 54 ± 11.5%). Using the Race Model, SSRT was estimated at 266 ± 53 ms.
Functional imaging
Unless stated otherwise, all contrasts reported here were corrected for multiple comparisons at the whole-brain level by using the cluster-based GRFT (see Materials and Methods).
Conflict-induced slowing
To examine conflict-induced slowing, we contrasted noncritical trials with a stop signal (StopRespond) with noncritical trials that had no stop signal (Go). We found significant activation in the bilateral auditory cortex (the stop tone was presented binaurally), the right preSMA, IFC, the STN region, and in other regions (supplemental Table 1, available at www.jneurosci.org as supplemental material) (Fig. 3 A). If activation of the preSMA, the IFC, and the STN region is specifically related to conflict-induced slowing, activation of these regions may change in proportion to the degree of RT slowing. To address this, our parametric analysis compared whether activation on noncritical trials with a stop signal correlated with RT to a greater degree than activation on noncritical trials without a stop signal (see Materials and Methods). We noted a significantly greater correlation with RT for noncritical Stop versus Go trials in a mainly right-lateralized network that included the preSMA, the IFC, and the STN region (Fig. 3 B). A confirmatory analysis examined mean activation of these regions, anatomically defined (see Materials and Methods), for noncritical trials with and without stop signals across three quantiles of RT (fast, medium, and slow). Activation on stop signal trials increased significantly more with increasing RT than for trials without stop signals (interaction between trial type and RT level: F (2,28) = 11.1; p < 0.0001) (Fig. 3 C). We examined the spatial correspondence between activation of the preSMA, the IFC, and the STN region with the foci predicted by the DWI tractography by overlaying the tracts on the parametric image (Fig. 3 B). There was a strong correspondence in location (see Table 2 for coordinates). This validates the identification of new tracts between the preSMA and the IFC, the preSMA and the STN region, and the IFC and the STN region because the predictions about the nodes making up the network were verified by the functional activation pattern.
Figure 3.

Conflict-induced slowing. A, Regions of significant activation are shown for the contrast of StopRespond − Go (in the noncritical direction) (Z > 2.3; p < 0.05, corrected for multiple comparisons at the whole-brain level). There is significant activation in a predominantly right-lateralized network including the preSMA/anterior cingulate, the IFC, the right middle frontal gyrus, the right STN region (shown overlaid on anatomical location of the STN ROI; see Materials and Methods), the auditory cortex (stop-signal tone), and the right caudate. B, Parametric analysis of brain activation with increasing RT. On noncritical trials, separate regressors were created for trials with a stop signal (StopRespond) and trials without (Go), each parametrically modulated by RT. Shown is the contrast between the following: StopRespond_parametric − Go_parametric (Z >2.3; p < 0.05, whole-brain corrected). Activations were found in preSMA, IFC, and STN regions. Superimposed on the activation map are the triangulation method tract overlaps. Green, The preSMA is the gray matter overlap for tracts originating in the IFC and STN region; blue, the IFC is the overlap for tracts originating in the preSMA and the STN region; red, the STN is the overlap for tracts originating in the preSMA and IFC. C, Confirmatory analysis shows increases of activation with slowing for stop-signal but not for no-signal trials on noncritical trials. The mean activation in each of the IFC, STN, and preSMA regions (anatomically defined; see Materials and Methods) is shown for each of StopRespond and Go for each of three RT bins (fast, medium, and slow, defined on a subject-by-subject basis). D, Conjunction analysis between conflict-induced slowing and outright inhibition. This image shows loci where the parametric increase in activation with increasing RT (B) overlaps with loci activated by outright inhibition (Fig. 4 A), in which each individual group map was itself corrected for multiple comparisons. In the bottom right panel, the anatomical locus of the STN (Lucerna et al., 2002) is indicated with a blue region of interest.
Table 2.
Correspondence between DWI tractography nodes and fMRI activation
| Conflict-induced slowing (parametric) | Outright inhibition | |
|---|---|---|
| STN region | 6, −18, −4 | 8, −16, −6 |
| IFC | 58, 18, 6 | 50, 16, 10 |
| preSMA | 10, 24, 50 | 10, 24, 48 |
These results are consistent with a role for the preSMA in conflict monitoring/detection/resolution, as well as with the hypothesis that the STN could be recruited to slow responses, pending the resolution of conflict (Frank, 2006). Both the STN region and the IFC were significantly activated, moreover, in proportion to the degree of response slowing. This result suggests that the same system that outright inhibits responses could also be recruited to temporarily withhold them (i.e., to put on the brakes). If so, IFC activation and activation of the STN region should be evident for outright stopping, the locus of activation should correspond with activation for the IFC and the STN region with conflict-induced slowing, and the degree of activation at these foci should predict how fast subjects can stop themselves. We evaluated these predictions by examining outright inhibition for critical trials.
Comparing outright stopping with conflict-induced slowing
We examined the neural correlates of successful (outright) response inhibition for critical direction trials. We contrasted successfully stopped trials (StopInhibit_critical) with Go trials (Go_critical). This contrast controlled for the initiation of a motor response (which occurs in both cases) and looks at the effect of the stop process (triggered some 200 ms later, on average) (cf. Aron and Poldrack, 2006). There was significant activation of the bilateral auditory cortex (the stop tone was presented binaurally), the right STN region, the bilateral caudate, the right preSMA, the right parietal cortex, the right globus pallidus, the right middle frontal gyrus, and the right IFC extending from the insula into the pars opercularis/triangularis region (Brodmann's area 44/45) (see Fig. 4 A,B and supplemental Table 2, available at www.jneurosci.org as supplemental material). Although the STN is a small region, the locus of activation was very similar to standard stopping in our previous study using identical MRI parameters and the same scanner (Aron and Poldrack, 2006) (see supplemental Fig. 2, available at www.jneurosci.org as supplemental material, for a conjunction analysis). Moreover, in that previous study, we verified activation of the STN region using the standard stopping paradigm and a high-resolution imaging protocol.
Figure 4.
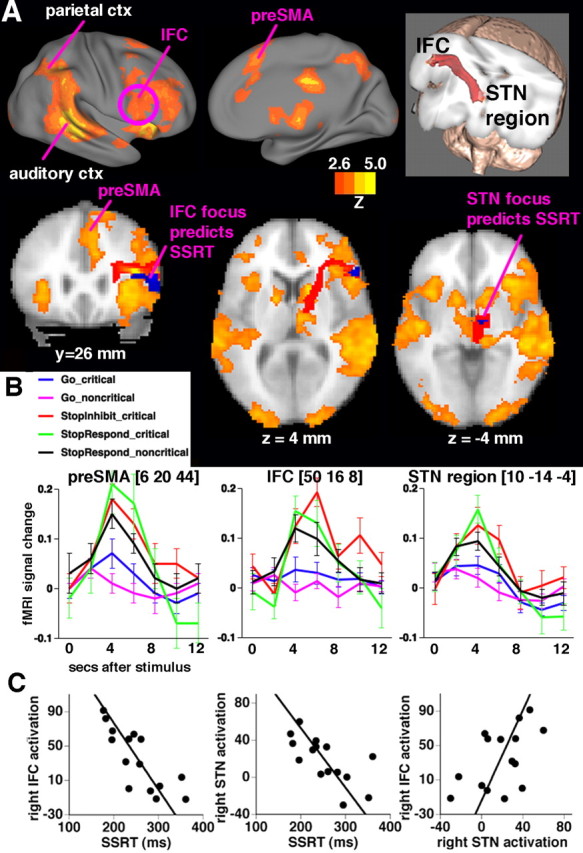
Outright response inhibition: relationships between activation, tracts, and SSRT. A, Regions of significant activation are shown for the contrast of StopInhibit − Go (in the critical direction) (Z > 2.3; p < 0.05, corrected for multiple comparisons at the whole-brain level). Right lateral and medial views, along with slices, show activation in a mainly right-lateralized network including the preSMA/anterior cingulate, the IFC, the STN region, the auditory cortex (auditory ctx; stop-signal tone), and the parietal cortex (parietal ctx). On the slices, blue regions at the IFC and the STN region denote foci where there was a significant correlation between SSRT and activation (small-volume correction for anatomically defined IFC and STN regions). The white matter tract connecting the IFC and the STN region is overlayed in red (see also top right inset). B, Mean peristimulus time courses (and SEs) extracted from each of the right preSMA, IFC, and STN regions for each event type. C, Subjects who inhibit more quickly activate the right IFC and the STN region more. SSRT was regressed against StopInhibit − Go activation in each of right IFC, preSMA and STN regions, anatomically defined, and the results were corrected for multiple comparisons. Activation was significant in the right IFC (MNI: 44, 22, 12; Z = 3.84; p < 0.05, small-volume correction) and the STN region (MNI: 14, −8, −4; Z = 3.02; p < 0.05, small-volume correction) but not in the preSMA. Mean activation was extracted from a sphere (radius, 3 mm) centered on the peak voxel. Activation of the right IFC and the right STN region was also significantly correlated across subjects (r = 0.53; p = 0.04).
We performed a conjunction analysis to examine whether the IFC, the STN, and the preSMA regions that were activated by outright response inhibition all correspond to those activated by conflict-induced slowing. The conjunction map reflected regions that were significantly activated for (parametric) conflict-induced slowing and for outright inhibition (see Materials and Methods). The preSMA, IFC, and STN regions were present in the conjunction image, and the location of activation corresponded strongly with the DWI tractography results (Fig. 3 D, Table 2).
To relate behavioral stopping to activation, SSRT was regressed against mean activation on critical trials (StopInhibit − Go) across subjects, separately for anatomically defined right IFC, right STN, and right preSMA regions (using a small-volume correction for multiple comparisons). There was no significant relationship between the preSMA activation and SSRT. However, at very similar foci to those we reported for standard stopping (Aron and Poldrack, 2006), those subjects who inhibited more quickly activated the IFC (MNI: 44, 22, 12; Z = 3.84; p = 0.0080, small-volume correction) and the STN region (MNI: 14, −8, −4; Z = 3.02; p = 0.049, small-volume correction) significantly more (Fig. 4 C). Also, mean activation in the IFC and the STN region was significantly correlated (r = 0.53; p = 0.04). Overall, these results confirm that functional activation at the right IFC and the STN region relates to the behavioral index of stopping.
Discussion
The results provide converging tractography and functional imaging evidence for a frontal–subcortical network for response control. DWI tractography demonstrated a three-way white matter network between the preSMA, the IFC, and the STN region in the right hemisphere. The conditional-stopping paradigm taxed this network functionally. The presentation of a stop signal on noncritical trials led to a slowing of RT (relative to trials with no such signal) and to a concomitant increase in activation of right-lateralized preSMA, the IFC, and the STN region. There was a strong correspondence between activation of this functional network and the nodes predicted by triangulation analysis of tractography data in different subjects. Moreover, this functional network overlapped heavily with that recruited by outright stopping. This suggests that conflict-induced slowing may operate by temporarily suppressing the motor system.
Our tract analysis was motivated by previous nonhuman primate tracing that had demonstrated a connection between the ventral premotor cortex and the STN (Nambu et al., 1997). Although we find evidence for a connection between the IFC and the STN region, this does not necessarily imply that the IFC (as implicated here) should be considered part of the human premotor cortex. As the primate tracing data show, there are multiple connections between the STN and ipsilateral sectors of the frontal cortex (Nambu et al., 2002).
By seeding the IFC and the STN-originating tracts in the triangulation analysis, we revealed a unique gray matter overlap in the preSMA (Fig. 1). This allowed us to assess putative tracts between the IFC and the preSMA and between the preSMA and the STN region. It also allowed us to repeat our triangulation analysis for each pair of regions. The IFC and the preSMA-originating tracts overlapped in the STN region as well as in the centromedial nucleus of thalamus. Overlap in the thalamus is expected (because the thalamus projects to multiple frontal regions), but this probably represents a different focus from the STN region. We note that the locus of the STN predicted by triangulation analysis corresponded very well with activation of the STN region by stopping (see also Aron and Poldrack, 2006) and that engagement of the STN by stopping is predicted by circuitry considerations (Mink, 1996) as well as adjunct evidence from other stop-signal and NoGo studies (Eagle et al., 2004; Kuhn et al., 2004; van den Wildenberg et al., 2006).
Tracts originating in the STN region and the preSMA also overlapped in the IFC as well as in an anterior prefrontal cortex focus. The finding of a tract between the preSMA and the STN region is supported by nonhuman tract tracing (Inase et al., 1999), whereas the finding of a preSMA–IFC tract is consistent with a previous DWI study in humans (Johansen-Berg et al., 2004). Importantly, the DWI triangulation analysis revealed a network that predicted the loci of activation in the fMRI experiment.
The conditional-stopping paradigm required subjects to hold in mind a conditional rule concerning what to do when a stop signal sounded depending whether they had initiated critical or noncritical responses (Fig. 2). As expected, although the stop signal was irrelevant on noncritical trials, subjects were significantly slowed by it (Table 1). One possible explanation is that the subject could always outright inhibit the response and then restart it if needed. However, this appears unlikely because the conflict-induced slowing effect was only 41 ms, on average, which is too quick for a response to be reinitiated. Another possibility is that responses are outright inhibited on just a few trials (producing the activation profile of response inhibition) and reinitiated on a few trials, which would produce the observed small average increase in StopRespond RT. If so, the shape of the distributions of noncritical StopRespond and Go trials would be different, which was not the case. Instead, the data are more consistent with a “braking” account. Conflict-induced slowing may be induced on noncritical Stop trials because of conflict between a salient stop signal and a rule that says to ignore this stop signal for this particular stimulus context. This could induce some degree of inhibition until the conflict is resolved. Presumably, conflict resolution requires retrieving the relevant conditional rule, which takes time. We found that the degree of such slowing predicted the degree of activation in a mainly right-hemisphere network including the preSMA, the IFC, and the STN region, even when controlling for a simple relationship between activation and RT (Fig. 3). This result suggests that the neural braking system is held on for longer, producing greater metabolic activity, when the conflict effect is greatest.
There was a striking overlap of activation in the preSMA, the IFC, and the STN region for conflict-induced slowing and outright response inhibition, verified by conjunction analysis (Fig. 3 D). This suggests that the braking system for conflict could recruit the same system by which responses are suppressed outright. Although the data reveal an underlying anatomic network between these three regions, they cannot speak to the necessity, causality, or directionality of the functional connections between regions. The functional projection between the preSMA and the STN region could be direct (via a putative preSMA–STN tract) or indirect (via a putative preSMA–IFC–STN route). But if conflict-induced slowing is generated via a preSMA–STN route, then it is unclear why the right IFC should be activated. It is unlikely that the role of the right IFC is merely to implement stop-signal processing or attentional functions. A recent study found robust right IFC activation for NoGo response inhibition even when controlling for oddball frequency (Chikazoe et al., 2007) (see also Heinen et al., 2006), and neurophysiological recording studies in the lateral prefrontal cortex have demonstrated neural responses specific to the meaning of the NoGo cue, rather than the stimulus properties (Sakagami et al., 2001). Based on diverse data, we have speculated that the role of the right IFC in the stop-signal paradigm is one of implementing an active mechanism of neural inhibition (Aron et al., 2004; Aron, 2007). The current finding of a direct tract between the right IFC and the STN region supports this account, as does the finding that those subjects who inhibited more quickly activated the right IFC and STN regions significantly more (Fig. 4). The loci showing the correlation between stopping activation and SSRT were almost identical to those found in our previous study with standard stopping (Aron and Poldrack, 2006), and they corresponded well with the nodes predicted by triangulation analysis (Fig. 3 B).
Although such a relationship between SSRT and activation was not evident in the preSMA (at a corrected threshold), neural inhibition could still depend, in some way, on the preSMA. A recent study found that SSRT was significantly longer in nine patients with right dorsomedial frontal damage relative to controls (Floden and Stuss, 2006). Microstimulation studies in human subjects have identified a “negative” motor region in the anterior SMA (preSMA) where stimulation produces hesitation or arrest of manual or vocal responses (Penfield and Welch, 1951; Luders et al., 1988; Fried et al., 1991). Furthermore, microstimulation of the superior medial frontal cortex (including specifically the preSMA) in nonhuman primates has been shown to exert executive control over saccades, moreover at a time scale consistent with a causal role in behavioral control (Stuphorn and Schall, 2006; Isoda and Hikosaka, 2007). The preSMA could thus implement an active mechanism of neural inhibition (perhaps by inputting directly to the STN) or it could play some other role such as monitoring or control recruiting, consistent with an extensive literature on the dorsomedial frontal cortex (Bush et al., 2000; Gehring and Knight, 2000; Schall et al., 2002; Botvinick et al., 2004; Ridderinkhof et al., 2004; Rushworth et al., 2004; Yeung et al., 2004). Future research may elucidate the precise functional role of the preSMA within the wider network of preSMA, IFC, and STN regions apparently underlying behavioral stopping.
The current results accord with computational simulations of basal ganglia circuitry (Frank, 2006). These model how cortical conflict signals could generate a temporary delay of motor output via activation of the STN. Simulated STN lesions led to premature responding and impaired high-conflict decisions. This is consistent with observations that lesions of the STN in rodents produce premature responding (Baunez et al., 2001; Desbonnet et al., 2004) and that deep-brain stimulation of the STN can impair cognitive control (Hershey et al., 2004). A recent study shows that stimulating the STN interferes with patients' ability to modulate their RTs by the degree of response conflict, thereby causing impulsive behavior (M. J. Frank, J. Samanta, and S. J. Sherman, unpublished observation).
We thus find that the preSMA, the IFC, and the STN region are key nodes in a network that is apparently recruited across a range of motor control, from outright inhibition to conflict-induced slowing. The results are relevant for disorders such as stuttering and Parkinson's disease, which are associated with pathology of this same network (Brown et al., 2005; Burghaus et al., 2006; Grafton et al., 2006). The results also illuminate everyday phenomena such as “motoric freezing” or hesitation when one's stride, swing, or conversation is interrupted by conflict or surprise. These experiences could arise from a temporary braking of motor output by the same means as responses are completely stopped. Future studies could examine whether this braking system could explain other cognitive psychological phenomena such as Stroop and interference effects. The study also has methodological import. Currently, it is difficult to interpret results from diffusion tractography studies that posit the existence of a previously unknown connection. We propose a method by which tractography can form specific hypotheses which are testable in an independent experiment with fMRI.
Footnotes
This work was supported by a 21st Century Science Award from the James S. McDonnell Foundation (R.A.P.) and by the United Kingdom Medical Research Council (T.E.B.). We thank David Flitney for three-dimensional rendering, Joe Devlin for helpful comments on this manuscript, and Bill Lanouette for editing assistance.
References
- Aron AR. The neural basis of inhibition in cognitive control. The Neuroscientist. 2007 doi: 10.1177/1073858407299288. in press. [DOI] [PubMed] [Google Scholar]
- Aron AR, Poldrack RA. Cortical and subcortical contributions to Stop signal response inhibition: role of the subthalamic nucleus. J Neurosci. 2006;26:2424–2433. doi: 10.1523/JNEUROSCI.4682-05.2006. [DOI] [PMC free article] [PubMed] [Google Scholar]
- Aron AR, Fletcher PC, Bullmore ET, Sahakian BJ, Robbins TW. Stop-signal inhibition disrupted by damage to right inferior frontal gyrus in humans. Nat Neurosci. 2003;6:115–116. doi: 10.1038/nn1003. [DOI] [PubMed] [Google Scholar]
- Aron AR, Robbins TW, Poldrack RA. Inhibition and the right inferior frontal cortex. Trends Cogn Sci. 2004;8:170–177. doi: 10.1016/j.tics.2004.02.010. [DOI] [PubMed] [Google Scholar]
- Band GP, van der Molen MW, Logan GD. Horse-race model simulations of the stop-signal procedure. Acta Psychol (Amst) 2003;112:105–142. doi: 10.1016/s0001-6918(02)00079-3. [DOI] [PubMed] [Google Scholar]
- Baunez C, Humby T, Eagle DM, Ryan LJ, Dunnett SB, Robbins TW. Effects of STN lesions on simple vs choice reaction time tasks in the rat: preserved motor readiness, but impaired response selection. Eur J Neurosci. 2001;13:1609–1616. doi: 10.1046/j.0953-816x.2001.01521.x. [DOI] [PubMed] [Google Scholar]
- Behrens TE. Probabilistic diffusion tractography with multiple fibre orientations: what can we gain? NeuroImage. 2007;34:144–155. doi: 10.1016/j.neuroimage.2006.09.018. [DOI] [PMC free article] [PubMed] [Google Scholar]
- Behrens TE, Woolrich MW, Jenkinson M, Johansen-Berg H, Nunes RG, Clare S, Matthews PM, Brady JM, Smith SM. Characterization and propagation of uncertainty in diffusion-weighted MR imaging. Magn Reson Med. 2003;50:1077–1088. doi: 10.1002/mrm.10609. [DOI] [PubMed] [Google Scholar]
- Botvinick MM, Cohen JD, Carter CS. Conflict monitoring and anterior cingulate cortex: an update. Trends Cogn Sci. 2004;8:539–546. doi: 10.1016/j.tics.2004.10.003. [DOI] [PubMed] [Google Scholar]
- Brown S, Ingham RJ, Ingham JC, Laird AR, Fox PT. Stuttered and fluent speech production: an ALE meta-analysis of functional neuroimaging studies. Hum Brain Mapp. 2005;25:105–117. doi: 10.1002/hbm.20140. [DOI] [PMC free article] [PubMed] [Google Scholar]
- Buchsbaum BR, Greer S, Chang WL, Berman KF. Meta-analysis of neuroimaging studies of the Wisconsin Card-Sorting task and component processes. Hum Brain Mapp. 2005;25:35–45. doi: 10.1002/hbm.20128. [DOI] [PMC free article] [PubMed] [Google Scholar]
- Burghaus L, Hilker R, Thiel A, Galldiks N, Lehnhardt FG, Zaro-Weber O, Sturm V, Heiss WD. Deep brain stimulation of the subthalamic nucleus reversibly deteriorates stuttering in advanced Parkinson's disease. J Neural Transm. 2006;113:625–631. doi: 10.1007/s00702-005-0341-1. [DOI] [PubMed] [Google Scholar]
- Bush G, Luu P, Posner MI. Cognitive and emotional influences in anterior cingulate cortex. Trends Cogn Sci. 2000;4:215–222. doi: 10.1016/s1364-6613(00)01483-2. [DOI] [PubMed] [Google Scholar]
- Chambers CD, Bellgrove MA, Stokes MG, Henderson TR, Garavan H, Robertson IH, Morris AP, Mattingley JB. Executive “brake failure” following deactivation of human frontal lobe. J Cogn Neurosci. 2006;18:444–455. doi: 10.1162/089892906775990606. [DOI] [PubMed] [Google Scholar]
- Chevrier A, Noseworthy, Schachar R. Dissociation of response inhibition and performance monitoring in the stop signal task using event-related fMRI. Hum Brain Mapp. 2007 doi: 10.1002/hbm.20355. in press. [DOI] [PMC free article] [PubMed] [Google Scholar]
- Chikazoe J, Konishi S, Asari T, Jimura J, Miyashita Y. Activation of right inferior frontal gyrus during response inhibition across response modalities. J Cogn Neurosci. 2007;19:59–68. doi: 10.1162/jocn.2007.19.1.69. [DOI] [PubMed] [Google Scholar]
- Coxon JP, Stinear CM, Byblow WD. Intracortical inhibition during volitional inhibition of prepared action. J Neurophysiol. 2006;95:3371–3383. doi: 10.1152/jn.01334.2005. [DOI] [PubMed] [Google Scholar]
- De Jong R, Coles MG, Logan GD. Strategies and mechanisms in nonselective and selective inhibitory motor control. J Exp Psychol. 1995;21:498–511. doi: 10.1037//0096-1523.21.3.498. [DOI] [PubMed] [Google Scholar]
- Desbonnet L, Temel Y, Visser-Vandewalle V, Blokland A, Hornikx V, Steinbusch HW. Premature responding following bilateral stimulation of the rat subthalamic nucleus is amplitude and frequency dependent. Brain Res. 2004;1008:198–204. doi: 10.1016/j.brainres.2004.02.032. [DOI] [PubMed] [Google Scholar]
- Dormont D, Ricciardi KG, Tande D, Parain K, Menuel C, Galanaud D, Navarro S, Cornu P, Agid Y, Yelnik J. Is the subthalamic nucleus hypointense on T2-weighted images? A correlation study using MR imaging and stereotactic atlas data. AJNR Am J Neuroradiol. 2004;25:1516–1523. [PMC free article] [PubMed] [Google Scholar]
- Eagle DM, Robbins TW. Inhibitory control in rats performing a stop-signal reaction-time task: effects of lesions of the medial striatum and d-amphetamine. Behav Neurosci. 2003;117:1302–1317. doi: 10.1037/0735-7044.117.6.1302. [DOI] [PubMed] [Google Scholar]
- Eagle DM, Baunez C, Shah AP, Lehmann O, Robbins TW. Inhibitory control in rats performing a stop-signal reaction time time: effects of lesions of the orbitofrontal cortex, infralimbic cortex and subthalamic nucleus. Soc Neurosci Abstr. 2004;30:781–712. [Google Scholar]
- Floden D, Stuss DT. Inhibitory control is slowed in patients with right superior medial frontal damage. J Cogn Neurosci. 2006;18:1843–1849. doi: 10.1162/jocn.2006.18.11.1843. [DOI] [PubMed] [Google Scholar]
- Frank M. Hold your horses: a dynamic computational role for the subthalamic nucleus in decision making. Neural Netw. 2006;19:1120–1136. doi: 10.1016/j.neunet.2006.03.006. [DOI] [PubMed] [Google Scholar]
- Fried I, Katz A, McCarthy G, Sass KJ, Williamson P, Spencer SS, Spencer DD. Functional organization of human supplementary motor cortex studied by electrical stimulation. J Neurosci. 1991;11:3656–3666. doi: 10.1523/JNEUROSCI.11-11-03656.1991. [DOI] [PMC free article] [PubMed] [Google Scholar]
- Fuster JM. Philadelphia: Lippincott-Raven; 1997. The prefrontal cortex: anatomy, physiology and neuropsychology of the frontal lobe. [Google Scholar]
- Garavan H, Hester R, Murphy K, Fassbender C, Kelly C. Individual differences in the functional neuroanatomy of inhibitory control. Brain Res. 2006;1105:130–142. doi: 10.1016/j.brainres.2006.03.029. [DOI] [PubMed] [Google Scholar]
- Gehring WJ, Knight RT. Prefrontal-cingulate interactions in action monitoring. Nat Neurosci. 2000;3:516–520. doi: 10.1038/74899. [DOI] [PubMed] [Google Scholar]
- Grafton ST, Turner RS, Desmurget M, Bakay R, Delong M, Vitek J, Crutcher M. Normalizing motor-related brain activity: subthalamic nucleus stimulation in Parkinson disease. Neurology. 2006;66:1192–1199. doi: 10.1212/01.wnl.0000214237.58321.c3. [DOI] [PubMed] [Google Scholar]
- Heinen SJ, Rowland J, Lee BT, Wade AR. An oculomotor decision process revealed by functional magnetic resonance imaging. J Neurosci. 2006;26:13515–13522. doi: 10.1523/JNEUROSCI.4243-06.2006. [DOI] [PMC free article] [PubMed] [Google Scholar]
- Hershey T, Revilla FJ, Wernle A, Gibson PS, Dowling JL, Perlmutter JS. Stimulation of STN impairs aspects of cognitive control in PD. Neurology. 2004;62:1110–1114. doi: 10.1212/01.wnl.0000118202.19098.10. [DOI] [PubMed] [Google Scholar]
- Inase M, Tokuno H, Nambu A, Akazawa T, Takada M. Corticostriatal and corticosubthalamic input zones from the presupplementary motor area in the macaque monkey: comparison with the input zones from the supplementary motor area. Brain Res. 1999;833:191–201. doi: 10.1016/s0006-8993(99)01531-0. [DOI] [PubMed] [Google Scholar]
- Isoda M, Hikosaka O. Switching from automatic to controlled action by monkey medial frontal cortex. Nat Neurosci. 2007;10:240–248. doi: 10.1038/nn1830. [DOI] [PubMed] [Google Scholar]
- Jenkinson M, Smith S. A global optimisation method for robust affine registration of brain images. Med Image Anal. 2001;5:143–156. doi: 10.1016/s1361-8415(01)00036-6. [DOI] [PubMed] [Google Scholar]
- Jenkinson M, Bannister P, Brady M, Smith S. Improved optimization for the robust and accurate linear registration and motion correction of brain images. NeuroImage. 2002;17:825–841. doi: 10.1016/s1053-8119(02)91132-8. [DOI] [PubMed] [Google Scholar]
- Johansen-Berg H, Behrens TE, Robson MD, Drobnjak I, Rushworth MF, Brady JM, Smith SM, Higham DJ, Matthews PM. Changes in connectivity profiles define functionally distinct regions in human medial frontal cortex. Proc Natl Acad Sci USA. 2004;101:13335–13340. doi: 10.1073/pnas.0403743101. [DOI] [PMC free article] [PubMed] [Google Scholar]
- Knight R, Staines WR, Swick D, Chao L. Prefrontal cortex regulates inhibition and excitation in distributed neural networks. Acta Psychol. 1999;101:159–178. doi: 10.1016/s0001-6918(99)00004-9. [DOI] [PubMed] [Google Scholar]
- Kuhn AA, Williams D, Kupsch A, Limousin P, Hariz M, Schneider GH, Yarrow K, Brown P. Event-related beta desynchronization in human subthalamic nucleus correlates with motor performance. Brain. 2004;127:735–746. doi: 10.1093/brain/awh106. [DOI] [PubMed] [Google Scholar]
- Liu TT, Frank LR, Wong EC, Buxton RB. Detection power, estimation efficiency, and predictability in event-related fMRI. NeuroImage. 2001;13:759–773. doi: 10.1006/nimg.2000.0728. [DOI] [PubMed] [Google Scholar]
- Logan G. On the ability to inhibit thought and action: a users' guide to the stop signal paradigm. In: Dagenbach D, Carr TH, editors. Inhibitory processes in attention, memory and language. San Diego: Academic; 1994. pp. 189–239. [Google Scholar]
- Logan GD, Cowan WB. On the ability to inhibit thought and action: a theory of an act of control. Psychol Rev. 1984;91:295–327. doi: 10.1037/a0035230. [DOI] [PubMed] [Google Scholar]
- Lucerna S, Salpietro FM, Alafaci C, Tomasello F. Berlin: Springer; 2002. In vivo atlas of deep brain structures. [Google Scholar]
- Luders H, Lesser RP, Dinner DS, Morris HH, Wyllie E, Godoy J. Localization of cortical function: new information from extraoperative monitoring of patients with epilepsy. Epilepsia. 1988;29(Suppl 2):S56–S65. doi: 10.1111/j.1528-1157.1988.tb05799.x. [DOI] [PubMed] [Google Scholar]
- Miller BT, D'Esposito M. Searching for “the top” in top-down control. Neuron. 2005;48:535–538. doi: 10.1016/j.neuron.2005.11.002. [DOI] [PubMed] [Google Scholar]
- Miller EK, Cohen JD. An integrative theory of prefrontal cortex function. Annu Rev Neurosci. 2001;24:167–202. doi: 10.1146/annurev.neuro.24.1.167. [DOI] [PubMed] [Google Scholar]
- Mink JW. The basal ganglia: focused selection and inhibition of competing motor programs. Prog Neurobiol. 1996;50:381–425. doi: 10.1016/s0301-0082(96)00042-1. [DOI] [PubMed] [Google Scholar]
- Nambu A, Tokuno H, Inase M, Takada M. Corticosubthalamic input zones from forelimb representations of the dorsal and ventral divisions of the premotor cortex in the macaque monkey: comparison with the input zones from the primary motor cortex and the supplementary motor area. Neurosci Lett. 1997;239:13–16. doi: 10.1016/s0304-3940(97)00877-x. [DOI] [PubMed] [Google Scholar]
- Nambu A, Tokuno H, Takada M. Functional significance of the cortico-subthalamo-pallidal “hyperdirect” pathway. Neurosci Res. 2002;43:111–117. doi: 10.1016/s0168-0102(02)00027-5. [DOI] [PubMed] [Google Scholar]
- Nichols T, Brett M, Andersson J, Wager T, Poline JB. Valid conjunction inference with the minimum statistic. NeuroImage. 2005;25:653–660. doi: 10.1016/j.neuroimage.2004.12.005. [DOI] [PubMed] [Google Scholar]
- Penfield W, Welch K. The supplementary motor area of the cerebral cortex; a clinical and experimental study. AMA Arch Neurol Psychiatry. 1951;66:289–317. doi: 10.1001/archneurpsyc.1951.02320090038004. [DOI] [PubMed] [Google Scholar]
- Pliszka SR, Glahn DC, Semrud-Clikeman M, Franklin C, Perez R, III, Xiong J, Liotti M. Neuroimaging of inhibitory control areas in children with attention deficit hyperactivity disorder who were treatment naive or in long-term treatment. Am J Psychiatry. 2006;163:1052–1060. doi: 10.1176/ajp.2006.163.6.1052. [DOI] [PubMed] [Google Scholar]
- Poldrack RA, Tom S, Aron AR. Using independent components analysis with MELODIC. the Human Brain Mapping meeting; Toronto, Ontario, Canada. 2005. [Google Scholar]
- Ridderinkhof KR, Ullsperger M, Crone EA, Nieuwenhuis S. The role of the medial frontal cortex in cognitive control. Science. 2004;306:443–447. doi: 10.1126/science.1100301. Paper presented at. [DOI] [PubMed] [Google Scholar]
- Rieger M, Gauggel S, Burmeister K. Inhibition of ongoing responses following frontal, nonfrontal, and basal ganglia lesions. Neuropsychology. 2003;17:272–282. doi: 10.1037/0894-4105.17.2.272. [DOI] [PubMed] [Google Scholar]
- Rubia K, Smith AB, Brammer MJ, Taylor E. Right inferior prefrontal cortex mediates response inhibition while mesial prefrontal cortex is responsible for error detection. NeuroImage. 2003;20:351–358. doi: 10.1016/s1053-8119(03)00275-1. [DOI] [PubMed] [Google Scholar]
- Rushworth MF, Walton ME, Kennerley SW, Bannerman DM. Action sets and decisions in the medial frontal cortex. Trends Cogn Sci. 2004;8:410–417. doi: 10.1016/j.tics.2004.07.009. [DOI] [PubMed] [Google Scholar]
- Sakagami M, Tsutsui K, Lauwereyns J, Koizumi M, Kobayashi S, Hikosaka O. A code for behavioral inhibition on the basis of color, but not motion, in ventrolateral prefrontal cortex of macaque monkey. J Neurosci. 2001;21:4801–4808. doi: 10.1523/JNEUROSCI.21-13-04801.2001. [DOI] [PMC free article] [PubMed] [Google Scholar]
- Sakagami M, Pan X, Uttl B. Behavioral inhibition and prefrontal cortex in decision-making. Neural Netw. 2006;19:1255–1265. doi: 10.1016/j.neunet.2006.05.040. [DOI] [PubMed] [Google Scholar]
- Schall JD, Stuphorn V, Brown JW. Monitoring and control of action by the frontal lobes. Neuron. 2002;36:309–322. doi: 10.1016/s0896-6273(02)00964-9. [DOI] [PubMed] [Google Scholar]
- Stuphorn V, Schall JD. Executive control of countermanding saccades by the supplementary eye field. Nat Neurosci. 2006;9:925–931. doi: 10.1038/nn1714. [DOI] [PubMed] [Google Scholar]
- Tzourio-Mazoyer N, Landeau B, Papathanassiou D, Crivello F, Etard O, Delcroix N, Mazoyer B, Joliot M. Automated anatomical labeling of activations in SPM using a macroscopic anatomical parcellation of the MNI MRI single-subject brain. NeuroImage. 2002;15:273–289. doi: 10.1006/nimg.2001.0978. [DOI] [PubMed] [Google Scholar]
- van den Wildenberg WP, van Boxtel GJ, van der Molen MW, Bosch DA, Speelman JD, Brunia CH. Stimulation of the subthalamic region facilitates the selection and inhibition of motor responses in Parkinson's disease. J Cogn Neurosci. 2006;18:626–636. doi: 10.1162/jocn.2006.18.4.626. [DOI] [PubMed] [Google Scholar]
- Yeung N, Cohen JD, Botvinick MM. The neural basis of error detection: conflict monitoring and the error-related negativity. Psychol Rev. 2004;111:931–959. doi: 10.1037/0033-295x.111.4.939. [DOI] [PubMed] [Google Scholar]