

Abstract
Typical absence has long been considered as the prototypic form of generalized nonconvulsive epileptic seizures. Recent investigations in patients and animal models suggest that absence seizures could originate from restricted regions of the cerebral cortex. However, the cellular and local network processes of seizure initiation remain unknown. Here, we show that absence seizures in Genetic Absence Epilepsy Rats from Strasbourg, a well established genetic model of this disease, arise from the facial somatosensory cortex. Using in vivo intracellular recordings, we found that epileptic discharges are initiated in layer 5/6 neurons of this cortical region. These neurons, which show a distinctive hyperactivity associated with a membrane depolarization, lead the firing of distant cortical cells during the epileptic discharge. Consistent with their ictogenic properties, neurons from this “focus” exhibit interictal and preictal oscillations that are converted into epileptic pattern. These results confirm and extend the “focal hypothesis” of absence epilepsy and provide a cellular scenario for the initiation and generalization of absence seizures.
Keywords: absence epilepsy, somatosensory cortex, thalamus, cortical synchronization, in vivo, focal epilepsy
Introduction
Typical absence is the prototypic form of generalized nonconvulsive epileptic seizures (Panayiotopoulos, 1997). It occurs during early childhood and is characterized by an abrupt alteration of consciousness associated with generalized spike-and-wave discharges (SWDs) on the scalp electroencephalogram. Although it is well established that SWDs result from paroxysmal oscillations in corticothalamic networks, the specific contributions of neocortex and thalamus in the initiation of paroxysmal activities are still debated (Meeren et al., 2005; van Luijtelaar and Sitnikova, 2006). It was first hypothesized that SWDs originate from a subcortical pacemaker with widespread and diffuse cortical projections (Jasper and Kershman, 1941; Penfield and Jasper, 1954). Consistent with this “centrencephalic” concept, experimental studies suggested that SWDs could result from abnormal rhythmic oscillations in the intrathalamic network, which may impose its rhythm to the cortex (Buzsaki, 1991; Bal et al., 1995; Avanzini et al., 2000). However, in a cat pharmacological model of SWDs, oscillations arise in the neocortex (Steriade and Contreras, 1998) and produce, through corticofugal projections, a powerful excitation of thalamic GABAergic reticular neurons that induce, in turn, a prolonged postsynaptic inhibition in thalamocortical neurons (Steriade and Contreras, 1995; Timofeev and Steriade, 2004). Recent findings in a rat genetic model of absence epilepsy, the Wistar Albino Glaxo/Rijswijk (WAG/Rij) rat (Coenen and van Luijtelaar, 2003), provided additional evidence for a leading role of the cerebral cortex. In this model, nonlinear correlation analysis of SWDs demonstrated the existence of a cortical “focus” within the perioral region of the somatosensory cortex (Meeren et al., 2002, 2005). When recorded at other cortical sites, or in the ventrobasal nuclei of the thalamus, SWDs consistently lagged behind the focal site during the first 500 ms of the seizure (Meeren et al., 2002). The hypothesis that absence seizures have a focal cortical origin in WAG/Rij rats is also supported by the alteration of SWDs after pharmacological inhibition of the focal region (Sitnikova and van Luijtelaar, 2004) and the specific increase in functional magnetic resonance imaging signals in the perioral somatosensory cortex during SWDs (Nersesyan et al., 2004). However, the cellular events occurring within the focus during the seizure remain unknown.
Here, we confirm in another rat model of absence epilepsy, the Genetic Absence Epilepsy Rats from Strasbourg (GAERS) (Depaulis and Van Luijtelaar, 2005), that SWDs are initiated in the facial region of the somatosensory cortex. Using in vivo intracellular recordings, we show that deep layer (5/6) neurons of this cortical region exhibit a specific elevated and regular firing rate during (ictal) and between (interictal) seizures. This was correlated with a more depolarized membrane potential compared with other cortical neurons recorded in GAERS and in the somatosensory cortex of nonepileptic rats. Paroxysmal firing in deep layer neurons of the cortical focus systematically led the discharge of more superficial cells and distant cortical neurons. Consistent with their ictogenic properties, the leading neurons showed short periods of suprathreshold oscillations during interictal and preictal epochs, which could eventually initiate the epileptic activity. Altogether, these findings provide the first cellular scenario for the “cortical focus theory” of absence seizure.
Materials and Methods
All experiments were performed in accordance with local Ethical Committee and European Union guidelines (directive 86/609/EEC), and every precaution was taken to minimize stress and the number of animals used in each series of experiments.
Multisites local field potential recordings in freely moving rats.
Experiments were performed in seven adult GAERS. They were anesthetized (0.4 mg/kg diazepam, i.p. plus 100 mg/kg ketamine, i.p.) and placed into a stereotaxic frame. Stainless steel wire electrodes (Ø, 0.125 mm, polyester isolated) were unilaterally implanted at different sites in the S1 somatosensory cortex [anteroposterior (AP), from +2.7 to −1.3; mediolateral (ML), 5.5; dorsoventral (DV), 3.0] (Paxinos and Watson, 1986), with bregma as the reference, and motor cortex (AP, from +3.2 to +0.7; ML, 3.5; DV, 2.3) (Paxinos and Watson, 1986). In five rats, two electrodes were inserted in the ventroposteromedial thalamus (AP, −2.8, −3.6; ML, 2.8, 2.5; DV, 6, 6.2). A reference and a ground electrode were placed over the cerebellum. All electrodes were fixed to the skull with cyanoacrylate and dental acrylic cement and connected to a female connector.
A week after surgery, rats were placed in a Plexiglas box, where they could freely move and were recorded for a maximum of 1 h. Local field potentials (LFPs) were amplified through a miniature headstage preamplifier (MPA-8-I, 8-channel single-ended amplifier with one common subtracting input for an indifferent electrode; voltage gain, ×10; frequency band, DC 5 kHz; Multi Channel Systems, Reutlingen, Germany) connected to a 32-channel programmable gain amplifier (PGA-32, voltage gain, ×200; low cutoff frequency, 1.0 Hz; high cutoff frequency, 5 kHz Multi Channel Systems) and sampled at 10 kHz (16 bit ADC). Ten minute recording samples were collected on a personal computer via a CED interface (Cambridge Electronic Design, Cambridge, UK) using the Spike 2 software.
Time-frequency analysis of seven SWDs obtained in four different rats was performed using an in-house developed toolbox of Statistical Parametric Mapping 5 software (www.fil.ion.ucl.ac.uk/spm; Wellcome Department of Imaging Neuroscience, University College London, London, UK) for dynamical analysis of intracortical LFPs. For each SWD, the amplitude (square-root of power) of oscillatory activity between 1 and 40 Hz, from 5 s before the onset of seizure at focus and up to 10 s thereafter, was obtained using standard time–frequency analysis based on the Morlet wavelet transform (Le Van Quyen et al., 2001). For each frequency, the amplitude was computed on seven period length sliding time window, providing an effective frequency-specific time resolution. Time-frequency sampling of the time-frequency plane was 19.5 ms/4 Hz. Finally, the time–frequency plane was averaged over SWDs to obtain the common pattern between SWDs.
Animal preparation for in vivo intracellular recordings.
Experiments were performed from 19 adult female and male GAERS and on five adult female rats from the nonepileptic Wistar HAN outbreed (Charles River, L'Arbresle, France). Animals were initially anesthetized with sodium pentobarbital (40 mg/kg, i.p.; Sanofi, Libourne, France) and ketamine (100 mg/kg, i.m.; Imalgène, Merial, France). A cannula was inserted into the trachea, and the animal was placed in a stereotaxic frame. Wounds and pressure points were repeatedly (every 2 h) infiltrated with lidocaïne (2%). Once the surgical procedures had been completed (see below), rats were analgesied and maintained in a narcotized and sedated state by injections of fentanyl (3 μg/kg, i.p.; Janssen-Cilag, Issy-les-Moulinaux, France) repeated every 20–30 min (Charpier et al., 1999; Slaght et al., 2004). To obtain long-lasting stable intracellular recordings, rats were immobilized with gallamine triethiodide (40 mg, i.m., every 2 h; Specia, Paris, France) and artificially ventilated. The degree of anesthesia was assessed by continuously monitoring the electrocorticogram (ECoG) and heart rate, and additional doses of fentanyl were administered at the slightest change toward an awaked pattern (i.e., an increase in the frequency and reduction in the amplitude of the ECoG waves and/or an increase in heart beat rate). Body temperature was maintained (36.5–37.5°C) with a homoeothermic blanket. At the end of the experiments, animals received an overdose of sodium pentobarbital (200 mg/kg, i.p.).
Electrophysiological recordings.
ECoG recordings from the anesthetized animal were obtained with a low impedance (≈60 kΩ) silver electrode placed on the dura above the motor cortex and above the S1 somatosensory cortex as defined in the freely moving GAERS (see above). The reference electrode was placed in a muscle at the side of the head.
Intracellular recordings were performed using glass micropipettes filled with 2 m potassium acetate (50–70 MΩ). Measurements of apparent membrane input resistance and time constant were based on the linear electrical cable theory applied to an idealized isopotential neuron (Rall, 1969). Apparent membrane input resistance was assessed by measurement of the mean (n ≥ 10) membrane potential change at the end of hyperpolarizing current pulses of −0.4 nA (100–200 ms duration, applied every 1.25 s), and the membrane time constant was given by the coefficient of the exponential decay fit of the hyperpolarization. Modification in membrane input resistance during SWDs was assessed by the mean voltage response to repetitive injections of short-duration (<50 ms) current pulses.
In each intracellularly recorded cell, the value of membrane potential corresponds to the mean of the distribution of continuous subthreshold activity (≥5 s duration) (see Fig. 3 D) recorded during interictal epochs. When an extracellular tip potential was recorded after termination of the intracellular recording, the membrane potential values were corrected accordingly.
Figure 3.

Interictal and ictal intracellular activities in the different layers of the cortical focus. A–C, Segments (1 s duration) of intracellular activity (bottom traces), and corresponding surface ECoG (top traces), recorded during interictal (left) and ictal (right) periods in a layer 2/3 (A), layer 4 (B), and layer 5/6 (C) neuron. The dashed lines indicate the mean value of interictal membrane potential. Note in the deep layer neuron the occurrence, during interictal activity, of rhythmic membrane potential fluctuations generating cyclic firing (horizontal bar). This neuron also exhibited a spontaneous interictal intrinsic burst (oblique arrow) immediately followed by a pronounced hyperpolarization (asterisk). D, Interictal membrane potential (MP) distributions (bin, 0.2 mV; continuous record of 10 s) of layer 2/3 (top), layer 4 (middle), and layer 5/6 (bottom) neurons illustrated in A–C. The mean value of membrane potentials, indicated by the arrows, were −62 (SD, 6.7 mV), −66 (SD, 6.8 mV), and −58 mV (SD, 2.3 mV), respectively. E, Pooled values of interictal membrane potential (MP; left), mean firing rate during ictal (open circle) and interictal (filled circles) periods (middle), and coefficient of variation (CV) of interictal ISIs (right) in layer 2/3 (n = 6), layer 4 (n = 5), and layer 5/6 (n = 17) neurons. *p = 0.003; **p < 0.001. Action potentials are truncated for clarity.
Cortical cells, located within the facial S1 cortex, were recorded in front of the ECoG electrode at the stereotaxic coordinates as defined from the freely moving GAERS (see above), 0.5–3.7 mm under the cortical surface.
Cortical cells, located within the orofacial motor cortex of GAERS, were recorded within 500 μm of the ECoG electrode at the following coordinates: 3.0 mm anterior to the bregma, 3.5–3.8 mm lateral to the midline, and 1.1–2.2 mm under the cortical surface.
Morphological identification.
Intracellularly recorded neurons were labeled using 1% neurobiotin (Vector Laboratories, Burlingame, CA) added to the intracellular recording solution. At 1–2 h after the injection, the animal received a lethal dose of pentobarbital and was perfused via the ascending aorta with 500 ml of Ringer's solution followed by 500 ml of 0.3% glutaraldehyde and 4% paraformaldehyde in phosphate buffer (PB), 0.1 m, pH 7.4. Brains were postfixed for 2 h in the same fixative solution without glutaraldehyde and then immersed in 30% sucrose PB at 4°C until sectioning. Frozen sections of fixed brains were cut at 50–70 μm in the frontal plane (somatosensory cortex neurons) or transversal plane (motor cortex neurons) and serially collected in PB. After several rinses in PB, neurobiotin was revealed by incubation of the sections in the avidin-biotin peroxidase complex (1:100; Vector Laboratories) in PB containing 0.3% Triton X-100 for at least 12 h at 4°C. Incubated sections were washed in PB before immersion in a solution containing 0.005% 3,3′-diaminobenzidine tetrahydrochloride (Sigma, St. Louis, MO), 0.4% nickel-ammonium sulfate, and 0.0006% H2O2. After several washes in PB, sections were mounted on gelatin-coated slides, counterstained with safranin (0.1%), and dehydrated through alcohol to xylene for light microscopic examination. The location of labeled neurons within the cortex was confirmed using the atlas of Paxinos and Watson (1986) and Zilles (1985).
Data acquisition and analysis.
Intracellular recordings were obtained under current-clamp conditions using the active bridge mode of an Axoclamp-2B amplifier (Molecular Devices, Union City, CA). Data were stored on-line on a DRA 800 digital tape recorder (Biologic, Claix, France) and then digitized with a sampling rate of 10 kHz (intracellular signal) or 1 kHz (ECoG) for off-line analysis. To perform spectral analysis of ECoG potentials, fast Fourier transforms were applied using Spike 2 (CED Software; Cambridge Electronic Design). The amplitude of action potentials was calculated as the potential difference between their voltage threshold, measured as the membrane potential at which the dV/dt exceeded 10 V.s−1 (Fricker et al., 1999), and the peak of the spike waveform. The tonic membrane hyperpolarization of cortical cells during SWDs was measured as the voltage difference between the mean interictal membrane potential and the extreme value of cell polarization. The start and end of an SWD in the ECoG were taken to be the first and last spike-wave complexes, respectively, where the size of the spike was at least two times the peak-to-peak amplitude of the baseline ECoG. Numerical values are given as means ± SEM.
Statistical significance was assessed by performing appropriate statistical tests, t test, one-way ANOVA, Mann–Whitney rank sum test, and Kruskal–Wallis one-way ANOVA on ranks. In some measurements, a Gaussian-Laplace fit was performed. Statistical analysis and curve fitting were performed with Origin 7.0 (Microcal Software, Northampton, MA) and SigmaStat 3.0 (SPSS, Chicago, IL).
Results
SWDs are generated in the facial somatosensory cortex
Simultaneous multisite LFPs were recorded in freely moving GAERS (n = 7) from motor (n = 8 recordings) and somatosensory (n = 39 recordings) cortices, as well as from the ventrobasal complex of thalamus (n = 7 recordings). They revealed that 91.9% of SWDs (102 of 111) began in the somatosensory cortex (Fig. 1), whereas 8.1% (n = 9 of 111) of epileptic discharges started simultaneously at all cortical sites. In none of the cases, paroxysmal activity arose from the motor cortex or the thalamus, a finding consistent with the extensive, cortical and thalamic, mapping of SWDs previously described in GAERS (Vergnes et al., 1990). As classically observed in GAERS (Depaulis and Van Luijtelaar, 2005), SWDs were always concomitant with a behavioral arrest, a decrease of neck muscle tone, clonies of the vibrissae and/or light chewings.
Figure 1.

SWDs are initiated within the facial somatosensory cortex. A, Simultaneous recordings in freely moving GAERS of LFPs from the somatosensory and motor cortices, as well as from the ventrobasal complex of thalamus. The location of recording electrodes is indicated by the corresponding numbers in B. Left, SWDs began in the cortical somatosensory area before propagating to motor cortex and thalamus. Right, Periods of spontaneous LFPs, obtained during the same recording session as shown at left, revealing the occurrence of spike-and-wave activity in the somatosensory cortex without concomitant paroxysm in motor cortex and thalamus. B, Superimposed slice drawings, made from the stereotaxic rat brain atlas from Paxinos and Watson (1986) at the indicated distances (in millimeters) from the bregma. Red, blue, and green dots represent the recording sites in the somatosensory cortex, motor cortex, and ventrobasal complex of the thalamus, respectively.
A consistent delay was observed between the beginning of SWDs in somatosensory cortex and their onset in both the motor cortex (+1.01 ± 0.09 s; n = 111 SWDs) and the ventrobasal thalamus (+1.34 ± 0.21 s; n = 51 SWDs) (Fig. 1 A, left, B). Moreover, short discharges (1.6 ± 0.2 s; n = 31) of spike and wave complexes were observed at somatosensory cortical sites where SWDs are initiated, without concomitant paroxysmal event in motor cortex or thalamus (Fig. 1 A, right). In five rats, such epileptic-like isolated activities were observed from two to five times during continuous recording sessions of 10 min. They were not accompanied with obvious behavioral changes and were apparently uncorrelated with the occurrence of generalized SWDs. Nissl staining of electrodes location indicated that SWDs emerged from the rostral parts of S1 area (i.e., the region of the somatosensory cortex of the face) (Chapin and Lin, 1984).
The present cortical and thalamic multisite recordings indicate that SWDs in GAERS are initiated within the facial somatosensory cortex, a region that closely matches the cortical focus, as described in another genetic rat model of absence epilepsy (Meeren et al., 2002).
Location and morphological identification of neurons recorded in the cortical focus
To determine the cell typology and the location of recorded neurons within the cortical focus, in vivo intracellular recordings were performed using neurobiotin-filled micropipettes. Intracellularly labeled neurons (n = 28) were located within the focal region as determined from freely moving animals (Fig. 1), including the superficial layers (2/3) (n = 6), layer 4 (n = 5), and the deep layers (5/6) (n = 17) (Fig. 2).
Figure 2.

Morphological properties of neurons from cortical focus and corresponding spontaneous intracellular activities in vivo. A–C, Microphotographs of neurobiotin-injected neurons in layer 2/3 (A) (scale bar, 100 μm), layer 4 (B) (scale bar, 25 μm), and layer 5/6 (C) (scale bar: left, 100 μm; expansion of the somatodendritic region at right, 25 μm) of the cortical focus and the corresponding intracellular activity (bottom trace) simultaneously recorded with the focal ECoG (top trace). In the three cell types, the occurrence of an SWD in the ECoG resulted in rhythmic membrane depolarizations superimposed on a tonic hyperpolarization. Note the elevated interictal and ictal firing rate in the layer 5/6 neuron compared with the upper layer neurons. Here and in the following figures, the arrowhead at the left of the intracellular record indicates the mean value of interictal membrane potential during the 5 s just preceding seizure onset, −62, −71, and −58 mV in A, B, and C, respectively.
All intracellularly labeled neurons in layers 2 and 3 (n = 6) had a pyramidal cell body (10–15 μm of diameter) with numerous basal dendrites and an apical dendrite projecting vertically toward the pial surface and giving secondary horizontally and obliquely oriented terminations (Fig. 2 A, left). Layer 4 neurons (n = 5), had the typical morphological properties of spiny stellate cells, including a small spherical cell body and a radiating dendritic arborization with an asymmetrical orientation (Fig. 2 B, left) (Simons and Woolsey, 1984). Pyramidal neurons recorded in layers 5 and 6 of the cortical focus (n = 17) projected to the thalamus, as confirmed by their antidromic activation (n = 8) via electrical stimulation of the ventroposteromedial thalamic nucleus (data not shown). They had a triangular cell body, a prominent apical dendrite extending toward the cortical surface, and basal dendrites radiating from the base of the soma (Fig. 2 C, left). The basic morphological features of neurons from focus, whatever their layer localization, were similar to those observed in the homologous cortical region of nonepileptic rats (data not shown) and described previously (Feldman, 1984; Feldmeyer et al., 1999; Svoboda et al., 1999; Brecht et al., 2003; Manns et al., 2004).
Neurons of the deep layers of the cortical focus exhibit interictal hyperactivity
All intracellular recordings in the focus (n = 28) were made simultaneously with the surface ECoG of the corresponding cortical region. Focal SWDs at 7–9 Hz (7.84 ± 0.02 Hz; n = 1735 SWDs from 19 GAERS) (Fig. 2 A–C, top traces) were similar to those recorded in the freely moving animal (Fig. 1 A).
Interictal ECoGs were associated in layer 2/3 and layer 4 neurons with large membrane potential fluctuations (Figs. 2 A,B, right, 3 A,B, interictal, D), corresponding to a mean value of −62.9 ± 1.4 mV (n = 6) and −66.4 ± 2.5 mV (n = 5) (Fig. 3 E, left), respectively. These two cell populations had a similar low-frequency interictal firing (layer 2/3 neurons, 3.9 ± 1.2 Hz; n = 6 vs layer 4 neurons, 3.1 ± 0.8 Hz; n = 5; p > 0.05) (Figs. 2 A,B, right, 3 A,B, interictal, E, middle) consisting of isolated singlets or doublets of action potentials. The corresponding firing profile was quite irregular, as indicated by a coefficient of variation (CV) of interspike intervals (ISIs) > 1 (layer 2/3 neurons, CV, 1.12 ± 0.19, n = 6 vs layer 4 neurons, CV, 1.31 ± 0.11; n = 5; p > 0.05).
Layer 5/6 pyramidal neurons of the focal site displayed an interictal subthreshold and suprathreshold activity markedly different to that of neurons located in the upper layers. Notably, they exhibited a relatively steady interictal membrane potential (−58.3 ± 0.6 mV; n = 17) (Figs. 2 C, right, 3 C, interictal, D), significantly more depolarized than that of superficial layer neurons (Fig. 3 E, left), leading to a higher mean spontaneous firing rate (16.7 ± 1.6 Hz; n = 17) (Figs. 2 C, right, 3 E, middle). This sustained firing, composed by a mixture of single discharges and high-frequency intrinsic bursts (Fig. 3 C, interictal), had a more regular pattern, as indicated by the weak value of the CV of ISIs (0.76 ± 0.05; n = 17) compared with neurons of layers 2/3 and 4 (Fig. 3 E, left). Consistently, we observed in deep layer neurons short periods (0.2–1.2 s) of small-amplitude rhythmic (15–20 Hz) membrane potential fluctuations generating periodic firing during interictal epochs (Fig. 3 C, horizontal bar).
Paroxysmal activity in the deep layers of the cortical focus
In the three cell populations explored in the cortical focus, the occurrence of SWDs was accompanied with repetitive depolarizations superimposed on a tonic membrane hyperpolarization (Fig. 2 A–C, right). Its amplitude was 12.3 ± 1.1 mV (n = 73 SWDs) in layer 2/3 neurons (Fig. 2 A, right) (n = 6), 16.6 ± 1.3 mV (n = 65 SWDs) in layer 4 neurons (Fig. 2 B, right) (n = 5), and 8.9 ± 0.7 mV (n = 215 SWDs) in deep layer cells (Fig. 2 C, right) (n = 17). This hyperpolarizing shift was associated with an increase in membrane input resistance and could not be reversed in polarity during DC injections (data not shown), suggesting that it was caused by a transient removal of the excitatory synaptic barrage (Charpier et al., 1999; Neckelmann et al., 2000).
In layer 2/3 neurons, SWDs were associated with rhythmic depolarizations of variable amplitude (10–20 mV) and shape (Fig. 3 A, ictal), resulting in a moderate ictal mean firing rate (4.1 ± 0.4 Hz; n = 6 cells) (Fig. 3 E, middle) with a probability of discharge in association with individual ECoG spikes of 0.56 ± 0.04 (n = 7602 ECoG spikes from 73 SWDs; n = 6 cells).
In layer 4 neurons, the repetitive depolarizations associated with SWDs had a large amplitude (20–30 mV) and a stereotyped profile, with a sharp initial depolarization followed by a slow decay phase (Fig. 3 B, ictal). However, their mean ictal firing frequency (3.6 ± 1.0 Hz; n = 5) (Fig. 3 E, middle), as well as their probability of discharge coincidently with ECoG spikes (0.43 ± 0.08; n = 7901 ECoG spikes from 65 SWDs; n = 5 cells) were similar (p > 0.05) to that calculated in layer 2/3 neurons. In both layer 2/3 and 4 neurons, only one or two action potentials could be generated per depolarizing cycle (Fig. 3 A,B, ictal).
Neurons in layer 5/6 showed a remarkable elevated activity during SWDs. They exhibited membrane potential oscillations composed by a smooth and slow (∼100 ms duration) depolarizing phase, concomitant with the wave component of the ECoG, followed by a fast depolarization (∼20 ms duration), shortly preceding the ECoG spike, and a fast decaying component (Fig. 3 C, ictal). In this cell population, virtually all ECoG spikes were associated with a brisk firing of one to eight action potentials (firing probability, 0.95 ± 0.02; n = 11,580 ECoG spikes from 215 SWDs; n = 17 cells) leading to a mean ictal firing rate (15.4 ± 1.6 Hz; n = 17 cells) significantly higher (p < 0.001) than in layer 2/3 and layer 4 neurons (Fig. 3 E, middle).
Deep layer neurons of the focus have a leading role during SWDs
We further investigated the focal process of seizure initiation by determining, throughout the SWD, the temporal relationship between the firing of neurons from the different layers of the focus. We measured the timing (Δt) of individual action potentials relative to the peak negativity of the corresponding spike component in the focal ECoG, which was used as the zero-time reference (Fig. 4 A). The firing of layer 5/6 neurons systematically preceded, throughout the seizure, the discharge of superficial neurons, demonstrating a leading role of deep layers (Fig. 4 B). The latency of action potentials was unimodally distributed in layer 5/6 and layer 2/3 neurons, with a mean value of −20.7 ± 0.1 ms (n = 28,417 action potentials from 215 SWDs; n = 17 neurons) and −16.2 ± 0.1 ms (n = 5978 action potentials from 73 SWDs; n = 6 neurons), respectively (Fig. 4 C). In contrast, layer 4 neurons (n = 5) exhibited a bimodal distribution with two main peaks at −13.1 and −3.8 ms, corresponding to a mean value of −7.1 ± 0.1 ms (n = 3679 action potentials from 65 SWDs) (Fig. 4 C).
Figure 4.
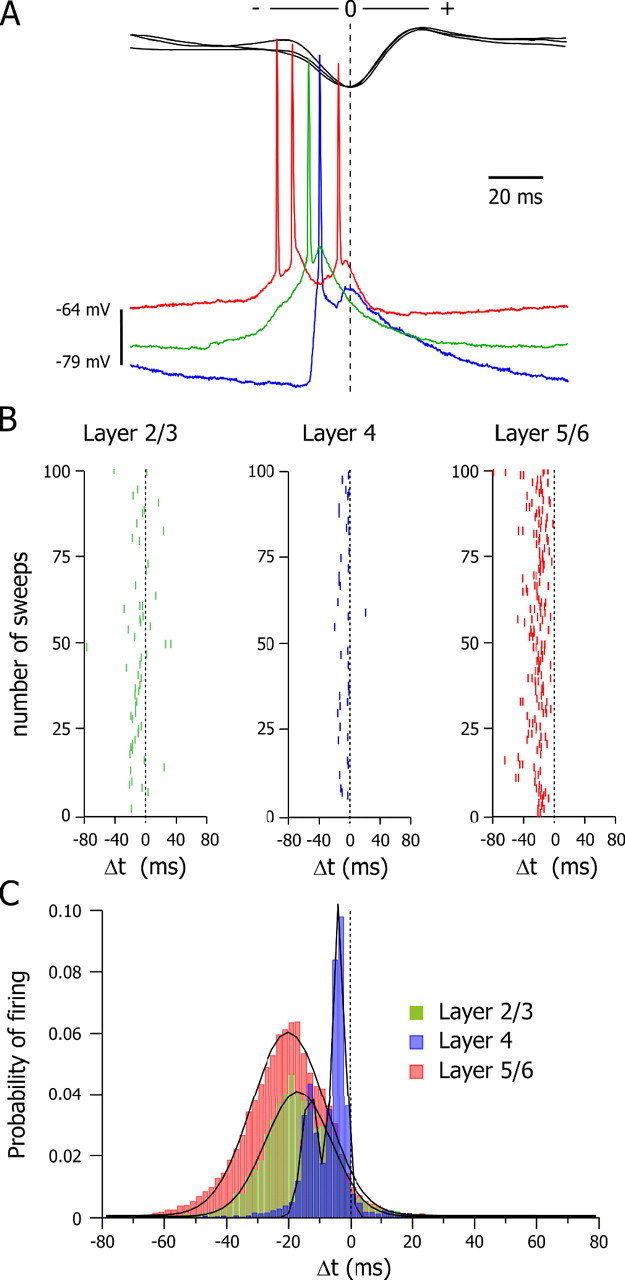
Leading role of the deep layer neurons in the focal epileptic discharges. A, Superimposition of the intracellular activities (bottom traces) recorded in a layer 2/3 (green), layer 4 (blue), and layer 5/6 neuron (red) and the corresponding spike-wave complexes (top black traces). The peak of the ECoG spike was used to align intracellular and ECoG records. B, Raster plots showing the temporal relationship between action potentials in a layer 2/3, layer 4, and layer 5/6 neuron (same neurons as in A) with respect to the peak negativity of the corresponding ECoG spike, used as the zero-time reference (A). Measurements were made from 100 consecutive sweeps. C, Pooled distributions of the timing (Δt) of all action potentials (bin size, 2 ms) recorded in layer 2/3 (n = 5978 action potentials from 6 cells), layer 4 (n = 3679 action potentials from 5 cells), and layer 5/6 (n = 28,417 action potentials from 17 cells) neurons relative to the ECoG spike taken as time 0. The distributions of firing in neurons of layers 2/3 and 5/6 were best fitted by a single Gaussian curve (r 2 = 0.984 and 0.992, respectively) and by a pair of Gaussian curves in layer 4 cells (r 2 = 0.994). The mean latency of the first action potential was −26.5 ± 0.9 ms in layer 5/6 cells (n = 17), −16.7 ± 0.2 ms in layer 2/3 neurons (n = 6), and −7.2 ± 0.1 ms in layer 4 cells (n = 5).
Hyperactivity of deep layer neurons is specific to the focus
Because the elevated activity in layer 5/6 neurons of the focus could be a general property of neocortical deep layer cells in the GAERS strain, we compared the intracellular activities of deep layer cells of the focus to those recorded from facial motor cortex neurons (n = 9) in the same epileptic animal.
During interictal periods, motor cortex neurons displayed a lower firing rate (3.7 ± 1.5 Hz; n = 9 cells) (Fig. 5 A,C top left), a higher CV of ISIs (1.8 ± 0.4; n = 9 cells) (Fig. 5 C, top right), and a more hyperpolarized membrane potential (−64.6 ± 1.1 mV; n = 9 cells) (Fig. 5 A,C, middle left), compared with neurons recorded from the focus.
Figure 5.

Specificity of the hyperactivity of focus deep layer neurons. A, Interictal and ictal intracellular activities recorded from layer 5 neurons from focus (top) and motor cortex (MoCx; bottom) in the same GAERS, simultaneously with the corresponding ECoGs (top trace). Note the dramatic lowering in the interictal and ictal firing rate in the motor neuron. B, Spontaneous intracellular activity of a somatosensory cortical neuron (SoCx; bottom) from a normal Wistar rat, simultaneously recorded with the local ECoG (top). The mean values of interictal membrane potential are −58, −64, and −62 mV in neurons from cortical focus, MoCx (A), and SoCx (B), respectively. C, Pooled values of mean firing rate during ictal (open red circles) and interictal (filled black circles) activities, CV of interictal ISIs, and interictal membrane potential (MP) in deep layer neurons from GAERS focus (n = 17), GAERS MoCx (n = 9), and normal Wistar SoCx (n = 7). The probability of firing in association with the ECoG spike [p(AP-Spike)] and the number of action potentials per ECoG spike (nAP/Spike) were also compared between deep neurons from GAERS focus and motor cortex cells. *p = 0.015, **p = 0.002; ***p < 0.001. D, Pooled distributions of the timing (Δt) of all action potentials (bin size, 2 ms) recorded in focus layer 5/6 (n = 28,417 action potentials from 17 cells) and GAERS deep cortical motor neurons (n = 1744 action potentials from 9 cells), relative to the ECoG spike taken as time 0. The distribution of firing in both cell populations was best fitted by a single Gaussian curve (r 2 > 0.94).
During SWDs, motor neurons displayed a sustained hyperpolarization (−10.9 ± 1.0 mV; n = 97 SWDs from 9 cells) and rhythmic depolarizations, in phase with the corresponding ECoG spikes (Fig. 5 A). The number of action potentials generated by these cellular oscillations (1.38 ± 0.02; n = 6518 ECoG spikes from 97 SWDs, n = 9 cells) (Fig. 5 C, bottom), the probability of firing in association with SWDs (0.32 ± 0.14; n = 6518 ECoG spikes from 97 SWDs, n = 9 cells) (Fig. 5 C, middle right) as well as the mean ictal firing rate (3.5 ± 1.7 Hz; n = 97 SWDs) (Fig. 5 C, top left) were significantly (p < 0.001) lower compared with focus cells.
We further explored the leading role of focus deep layers by examining the temporal relationships between the firing of deep layer neurons from motor cortex and focus during SWDs. Measurements of timing of all action potentials in motor cortical neurons showed a wide unimodal distribution (single Gaussian fit, r 2 = 0.94) that was centered around a mean value of −11.0 ± 0.5 ms (n = 1744 action potentials from 97 SWDs; n = 9 neurons) and significantly (p < 0.001) delayed by ∼10 ms with respect to deep layer neurons from focus (Fig. 5 D).
Hyperactivity of deep layer neurons in the somatosensory cortex is specific to epileptic animals
The hyperactivity found in deep layer neurons of the focus in the GAERS could be a normal feature of the rat facial somatosensory cortex and therefore could represent a nonpathological, region-specific property promoting the emergence of synchronized oscillations (Nicolelis and Fanselow, 2002). This hypothesis was ruled out by the fact that spontaneous intracellular activity of deep layer neurons (n = 7) in the facial somatosensory cortex of control rats was remarkably different to that observed in the focus of GAERS (Fig. 5 B, bottom trace). Specifically, the mean membrane potential of control neurons (−62.8 ± 1.2 mV; n = 7 cells) was significantly more hyperpolarized than that of deep layer neurons of the focus (Fig. 5 C, middle left). This was associated with a lower mean spontaneous firing rate (6.2 ± 1.5 Hz; n = 7 cells) (Fig. 5 C, top left) and a higher variability in ISIs (CV, 1.25 ± 0.17; n = 7 cells) (Fig. 5 C, top right).
Deep layer neurons of the cortical focus do not show specific alteration in their intrinsic excitability
The hyperactivity of deep layer neurons of the cortical focus could result from a layer-specific increased intrinsic excitability. To test this hypothesis, we measured in the different cell populations the voltage responses to current pulses (Fig. 6) and the basic electrical membrane properties, including apparent membrane input resistance, membrane time constant, and action potential properties (Table 1). We did not find any significant differences in these membrane parameters except for the membrane input resistance of focus layer 4 neurons that was greater than that of layer 5/6 cells of the focus and motor cortex in GAERS (Table 1). This could be a result of the electrotonic structure of the relatively small size of spiny stellate neurons and could explain the large-amplitude depolarizations observed in these neurons during seizure activity (Fig. 3 B, ictal).
Figure 6.

Electrophysiological properties of recorded neurons from GAERS and control Wistar rats. Voltage responses (top traces) to a series of hyperpolarizing (−0.8 nA) and depolarizing (+0.4 nA) current pulses (bottom traces). Traces represent an average of at least five successive trials, except for the suprathreshold responses evoked by a single current pulse. MoCx, Motor cortex; SoCx, somatosensory cortex.
Table 1.
Intrinsic membrane properties of neurons recorded from GAERS and normal Wistar rats
| Membrane resistance (MΩ) | Time constant (ms) | Action potential amplitude (mV) | Action potential duration (ms) | Action potential threshold (mV) | ||
|---|---|---|---|---|---|---|
| GAERS | ||||||
| Focus | Layer 2/3 | 27.5 ± 3.7 | 9.9 ± 2.5 | 56.5 ± 2.9 | 1.7 ± 0.1 | −50.6 ± 1.3 |
| Layer 4 | 43.4 ± 3.2 1 | 14.2 ± 2.0 | 53.8 ± 4.9 | 1.8 ± 0.1 | −52.0 ± 2.8 | |
| Layer 5/6 | 21.7 ± 2.2 1 | 7.9 ± 0.9 | 57.8 ± 2.3 | 1.6 ± 0.1 | −53.6 ± 0.6 | |
| MoCx | Layer 5/6 | 25.8 ± 3.6 1 | 14.0 ± 2.5 | 60.4 ± 1.8 | 1.6 ± 0.1 | −53.2 ± 0.9 |
| Wistar | ||||||
| SoCx | Layer 5/6 | 30.0 ± 4.1 | 6.5 ± 0.9 | 56.7 ± 1.1 | 1.8 ± 0.2 | −52.8 ± 1.2 |
Electrical parameters were measured in GAERS neurons, located in layer 2/3 (n = 6), layer 4 (n = 5), and layer 5/6 (n = 17) of the cortical focus and in layer 5/6 of motor cortex (MoCx; n = 9) and in nonepileptic Wistar rat somatosensory cortical neurons (SoCx; n = 7). All parameters were not significantly different (p > 0.05), except the membrane resistance of GAERS focus layer 4 neurons that was significantly higher than that of focus and motor cortex layer 5/6 cells (p < 0.001).
Positive current pulse injection showed that cells recorded in the layers 2/3 and 4 of the focus exhibited the typical firing pattern of regular spiking neurons (Fig. 6 A), whereas focus layer 5/6 neurons displayed a firing profile of either regular (n = 8) or intrinsic bursting (n = 7) cells (Fig. 6 A). A similar proportion of regular spiking (n = 4) and intrinsic bursting neurons (n = 3) was found in the deep layers of the somatosensory cortex of the control rats. In contrast, most of GAERS motor cortical cells (eight of nine) were of regular spiking type (Fig. 6 B), and only one cell exhibited an intrinsic bursting profile.
It is unlikely that the excessive spontaneous activity in the deep layer neurons of the focus resulted from an increase in their input–output relationship, because similar mean firing rates could be evoked, in response to same current intensities from nearly identical membrane potentials, in neurons of focus, motor cortex of GAERS, and somatosensory cortex of normal Wistar (supplemental Fig. S1, available at www.jneurosci.org as supplemental material).
Assuming that intracellular recordings were obtained from the soma, these findings suggest that the ictogenic nature of the deep layers of the focus does not result from an alteration in the somatic membrane excitability. However, possible modifications in dendritic channels, such as h channels that are mainly located at distal dendrites (Kole et al., 2006) cannot be ruled out (see Discussion).
Spontaneous oscillations in the cortical focus and their role in SWDs initiation
Averaged time–frequency power analysis of LFPs (n = 7 SWDs) recorded at the focal site in freely moving GAERS, revealed that the transition from interictal to ictal activities was accompanied by a transient (∼2 s) increased power in the 9–11 Hz frequency band (Fig. 7 A,B, top). The main frequency was then shifted to the 6–8 Hz band (Fig. 7 A,B, top) during the main body of the SWD. Similar dynamic changes in the cortical LFP were observed in the motor cortex with a delay of ∼1 s with respect to the onset of the 9–11 Hz activity in the focus (Fig. 7 A,B, bottom). Such cortical oscillations, which occurred before the generalization of SWDs (Figs. 1 A, left, 7 B), were associated in deep layer neurons of the focus (12 of 17 cells) with ∼10 Hz suprathreshold depolarizations that coincided with the early phase of the tonic hyperpolarization (Fig. 7 C). This preictal intracellular activity was then progressively (in 0.4–2.6 s) transformed into a 7–8 Hz oscillation in parallel with the development and the generalization of the paroxysms.
Figure 7.
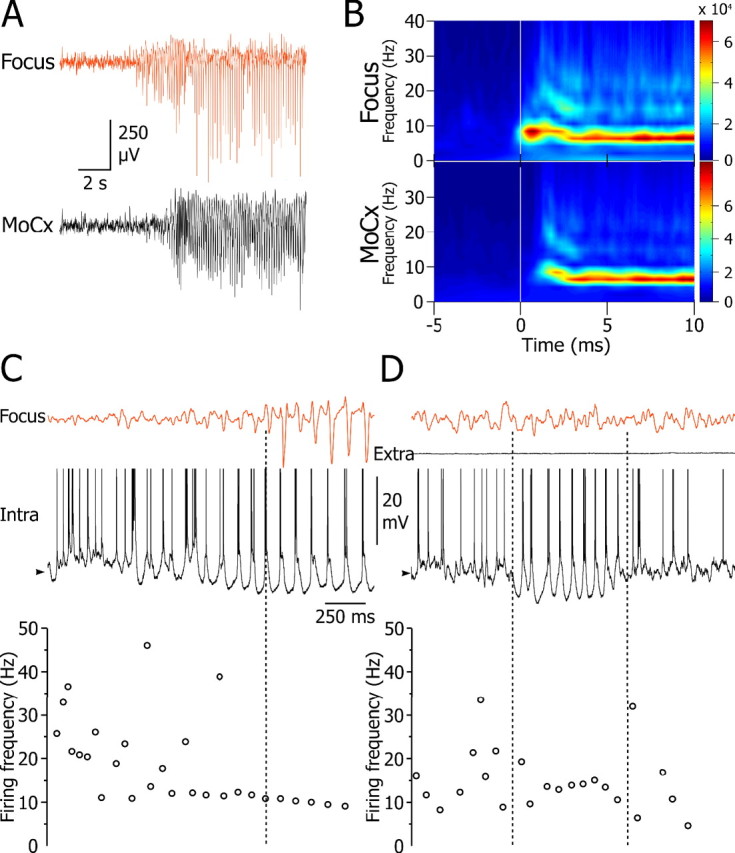
Ten to 12 Hz oscillations and their relationship to SWD initiation. A, Typical examples of preictal and ictal activities in the focal (top) and motor cortex (MoCx; bottom) of freely moving GAERS and corresponding averaged time–frequency maps (n = 7 cortical LFPs from 4 GAERS) (B) showing the presence of 10–11 Hz oscillations just before the generalized 6–8 Hz SWDs. C, Top, Intracellular activity of a deep layer neuron from focus (bottom trace) and corresponding focal ECoG (top trace) showing the transition between interictal and preictal activities. Note the occurrence, in both records, of a high-frequency oscillation (>10 Hz) that preceded the spike-and-wave activity (dashed line) and coincided with the onset of the tonic hyperpolarization. The corresponding transition in the cell activity is illustrated by the corresponding plot of instantaneous firing frequency (bottom panel). Note the progressive decrease and stabilization in the cell firing from preictal to ictal activity. D, Period of rhythmic depolarizations (framed by the dashed lines) associated with a hyperpolarizing envelope found in the same neuron during the interictal period but without surface oscillatory ECoG. The corresponding plot of instantaneous firing frequency (bottom panel) indicates stabilization in the cell activity at ∼12 Hz. The trace above the intracellular record, depicting the field potential recorded in the immediate vicinity of the neurons (Extra), indicates the lack of local oscillatory activity. In C and D, the high-frequency clusters of action potentials are represented by a single data point in the plots of instantaneous firing frequency. The mean value of interictal membrane potential in C and D is −58 mV. Action potentials are truncated. Intracellular recordings shown in C and D were obtained in vivo from sedated and narcotized animals.
During interictal periods, deep layer neurons of the focus (9 of 17) exhibited brief epochs (0.8 ± 0.1 s; n = 27 from 9 cells) of suprathreshold (mean firing rate of 18.2 ± 2.0 Hz) membrane oscillations with a frequency higher than that of SWDs (11.1 ± 0.4 Hz), superimposed on a croissant-shaped membrane hyperpolarization (Fig. 7 D). These cellular oscillations were not associated with a surface oscillatory ECoG (Fig. 7 D), suggesting that they were either uncorrelated or synchronized in a small pool of neurons insufficient to generate sizeable cortical waves. Such interictal intracellular oscillations were mostly absent in GAERS cortical motor neurons but, when present (three oscillatory periods in three motor cells), had a similar internal frequency (10.5 ± 0.5 Hz) and remained subthreshold for action potential discharge (data not shown).
Altogether, these observations suggest that large-scale synchronization during absence seizures first results from 9–11 Hz oscillations at the focal site, which rapidly generate local paroxysms that are secondarily generalized with a frequency of 7–8 Hz.
Discussion
The present study performed in a genetic model of absence epilepsy shows that: (1) SWDs are initiated in a focus located in the facial somatosensory cortex and then rapidly propagate to other cortical areas and related relay thalamic nuclei; (2) the ictogenesis at the focal site does not result from a substantial alteration in neuronal morphologies or electrical membrane properties; (3) the deep layer neurons of the cortical focus exhibit a distinctive hyperactivity during and between epileptic discharges; (4) during seizures, the firing of focus deep layer neurons precedes the discharge of neurons located in more superficial layers and in distant cortical areas; and (5) deep layer neurons of the cortical focus show interictal and preictal oscillations that could initiate spike-and-wave activity.
From rat cortical focus to human cortical focus
The present study confirms and extends the “cortical focus theory” of absence seizures in genetic rodent models. Measurements of time delay between the occurrences of SWDs recorded at different cortical and thalamic sites in freely moving GAERS demonstrate that SWDs originate from the facial somatosensory cortex. Moreover, short-duration SWDs could be recorded at the focus without concomitant paroxysms in motor cortex or thalamus, whereas the opposite was never observed. Altogether, these findings are incompatible with the hypothesis that the thalamus could act as the primary driving source for SWDs (Buzsaki, 1991; Bal et al., 1995; Avanzini et al., 2000). On the contrary, they demonstrate an intracortical propagation of ictal activity as the mechanism of primary generalization of spontaneous SWDs. Our data are in agreement with a previous study in the WAG/Rij rat (Coenen and van Luijtelaar, 2003) showing that the apparent generalized and “synchronous” character of SWDs is attributable to a rapid spread from a cortical focus located within the peri-oral subregion of the somatosensory cortex (Meeren et al., 2002, 2005). The assumption that this area constitutes a trigger zone for SWDs is further supported by the suppression of epileptic discharges after local application of lidocaine in the WAG/Rij rat (Sitnikova and van Luijtelaar, 2004) or ethosuximide in the GAERS (Manning et al., 2004). The existence of such a cortical focus has never been described in pharmacological models of absence seizures (Snead, 1992). However, a similar intracortical propagation of paroxysmal activity was found in a feline pharmacological model, where cortically generated 2–4 Hz SWD, with a morphological resemblance to human absence but without the typical bilateral generalization, could spread to neighboring cortical regions (Steriade and Amzica, 1994; Neckelmann et al., 1998). Previous studies in human patients (Petsche, 1962) suggested preferential cortical regions of origin for SWDs and directional spread over the scalp. More recently, a detailed spatial and temporal analysis of SWDs in patients with idiopathic generalized epilepsies, including childhood absence epilepsy, also suggested the existence of cortical foci located in discrete regions of the frontal lobe (Holmes et al., 2004). This was further confirmed by a recent study showing that the initial ictal activity was not generalized in 50% of human absence seizures but rather consisted of focal epileptic discharges that could predominate in the frontal area (Sadleir et al., 2006). Therefore, we propose that a dysfunction in a delimitated region of the cortex is the key feature of the pathophysiology of human generalized absence epilepsy.
Hyperactivity of deep layer neurons of the cortical focus as a cellular substrate for absence seizure generation
In the present study, deep pyramidal neurons of the cortical focus show a more depolarized membrane potential, a higher interictal and ictal firing rate, and an enhanced bursting activity, compared with local superficial cells, distant layer 5/6 pyramidal neurons, and homologous neural population in nonepileptic rats. The distinctive electrophysiological properties of deep layer neurons of the focus could result from an alteration in the expression and/or function of ion channels. In particular, mRNAs of voltage-gated sodium channels, such as Nav1.1 and Nav1.6, were found increased in the orofacial sensory cortex of WAG/Rij rats (Klein et al., 2004). This could produce a persistent depolarizing current responsible for membrane depolarization (Crill, 1996) and an increase in tonic firing and bursting activity (Parri and Crunelli, 1998), which appears to be essential for the generation of corticothalamic SWDs (Blumenfeld and McCormick, 2000).
An alteration of the hyperpolarization-activated cation current (I h), which is significantly decreased in the somatosensory cortex of WAG/Rij rats (Strauss et al., 2004), may also participate to the ictogenic properties of the deep layer neurons. In layer 5 cortical pyramidal neurons, an impairment of I h may facilitate the propagation of synaptic depolarizations by reducing the dendritic electrotonic length and facilitate the temporal summation of repetitive inputs (Williams and Stuart, 2000; Strauss et al., 2004). Such intrinsic synergistic processes could contribute to the rhythmic paroxysmal depolarizations observed in the focus deep layer pyramidal neurons. Moreover, the bursting activity of these cells, which could also result from a decrease of I h (Strauss et al., 2004), may promote, via a strengthening of excitatory synaptic transmission within the local cortical network (Williams and Stuart, 1999; Watts and Thomson, 2005), the synchronized epileptic activities in the focal region.
A dysregulation of synaptic, inhibitory, and/or excitatory systems may also participate in the generation of SWDs. The peak conductance of the fast component of inhibitory synaptic responses is reduced in deep layers of the cortex in WAG/Rij rat focus (D'Antuono et al., 2006). Such a decrease in GABAA receptor-mediated inhibition could account for the scarcity of spontaneous inhibitory synaptic events in deep layer neurons (Figs. 2 C, 5 A). Moreover, an increase in glutamatergic NMDA-dependent conductances could act as a synergistic process, together with a deficit in synaptic inhibition, facilitating paroxysmal depolarizations. Indeed, in WAG/Rij focus layer 5 cells, focal electrical stimulations elicit a late, large-amplitude, NMDA-dependent synaptic depolarization that could cause repetitive firing (D'Antuono et al., 2006). In control Wistar, a similar stimulating protocol generated a monophasic synaptic depolarization that could only trigger a single action potential (D'Antuono et al., 2006), confirming the “ictogenic specificity” of this synaptic component.
Focal spontaneous 9–11 Hz oscillations as a prelude of SWD
A distinctive property of the deep layer neurons of the focus is the presence of interictal and preictal 9–11 Hz oscillations, which are consistent with their capacity to generate SWDs. Similar rhythmic bursting activity has been found in layer 5 somatosensory cortical neurons after changes in membrane potential because of intrinsic mechanisms, including sodium and calcium-dependent conductances (Silva et al., 1991; Amitai, 1994). Moreover, these neurons appear necessary and sufficient to generate epochs of ∼10 Hz local synchronized activity through a facilitation of NMDA-dependent synaptic transmission (Silva et al., 1991; Amitai and Connors, 1994). Thus, it is possible that membrane oscillations, which remain uncorrelated during interictal periods, become locally synchronized through reinforced NMDA-dependent synaptic connections. Consequently, the 9–11 Hz synchronized activity, which is reflected in the ECoG by preictal oscillations (Fig. 7 A,B), might initiate electrical paroxysms within the cortical site via local and diffuse projections of layer 5 neurons (Watts and Thomson, 2005).
As a diachronic scheme for initiation and generalization of SWDs, we propose the following scenario: (1) specific alterations in cellular and/or synaptic properties of deep layer somatosensory neurons initiate local oscillations that are eventually transformed into SWDs; (2) this paroxysmal activity secondarily propagates, via regional and distant layer 5 axonal projections, within the somatosensory cortex and to other cortical and thalamic regions and; (3) once the SWD is “generalized,” corticothalamic and thalamocortical neurons drive each other forming a unified oscillatory network. Because thalamocortical cells are weakly active during SWDs (Steriade and Contreras, 1995; Pinault et al., 1998; Charpier et al., 1999; Timofeev and Steriade, 2004), they would only provide a resonant circuitry sustaining the cortical discharges.
Footnotes
This work was supported by the Ministère Français de la Recherche, the Institut National de la Santé et de la Recherche Médicale, and the Agence Nationale de la Recherche (ANR RO6275CS). We thank Olivier David for his help in time–frequency analysis, Anne-Marie Godeheu for histological processing, and Drs. Séverine Mahon and Jeanne T. Paz for critical reading of this manuscript.
References
- Amitai Y. Membrane potential oscillations underlying firing patterns in neocortical neurons. Neuroscience. 1994;63:151–161. doi: 10.1016/0306-4522(94)90013-2. [DOI] [PubMed] [Google Scholar]
- Amitai Y, Connors BW. The barrel cortex of rodents. In: Jones EG, Diamond I, editors. Cerebral cortex. New York: Plenum; 1994. pp. 299–331. [Google Scholar]
- Avanzini G, Panzica F, de Curtis M. The role of the thalamus in vigilance and epileptogenic mechanisms. Clin Neurophysiol. 2000;111(Suppl 2):S19–S26. doi: 10.1016/s1388-2457(00)00398-9. [DOI] [PubMed] [Google Scholar]
- Bal T, von Krosigk M, McCormick DA. Role of the ferret perigeniculate nucleus in the generation of synchronized oscillations in vitro. J Physiol (Lond) 1995;483:665–685. doi: 10.1113/jphysiol.1995.sp020613. [DOI] [PMC free article] [PubMed] [Google Scholar]
- Blumenfeld H, McCormick DA. Corticothalamic inputs control the pattern of activity generated in thalamocortical networks. J Neurosci. 2000;20:5153–5162. doi: 10.1523/JNEUROSCI.20-13-05153.2000. [DOI] [PMC free article] [PubMed] [Google Scholar]
- Brecht M, Roth A, Sakmann B. Dynamic receptive fields of reconstructed pyramidal cells in layers 3 and 2 of rat somatosensory barrel cortex. J Physiol (Lond) 2003;553:243–265. doi: 10.1113/jphysiol.2003.044222. [DOI] [PMC free article] [PubMed] [Google Scholar]
- Buzsaki G. The thalamic clock: emergent network properties. Neuroscience. 1991;41:351–364. doi: 10.1016/0306-4522(91)90332-i. [DOI] [PubMed] [Google Scholar]
- Chapin JK, Lin CS. Mapping the body representation in the SI cortex of anesthetized and awake rats. J Comp Neurol. 1984;229:199–213. doi: 10.1002/cne.902290206. [DOI] [PubMed] [Google Scholar]
- Charpier S, Leresche N, Deniau JM, Mahon S, Hughes SW, Crunelli V. On the putative contribution of GABA(B) receptors to the electrical events occurring during spontaneous spike and wave discharges. Neuropharmacology. 1999;38:1699–1706. doi: 10.1016/s0028-3908(99)00139-2. [DOI] [PubMed] [Google Scholar]
- Coenen AM, van Luijtelaar EL. Genetic animal models for absence epilepsy: a review of the WAG/Rij strain of rats. Behav Genet. 2003;33:635–655. doi: 10.1023/a:1026179013847. [DOI] [PubMed] [Google Scholar]
- Crill WE. Persistent sodium current in mammalian central neurons. Annu Rev Physiol. 1996;58:349–362. doi: 10.1146/annurev.ph.58.030196.002025. [DOI] [PubMed] [Google Scholar]
- D'Antuono M, Inaba Y, Biagini G, D'Arcangelo G, Tancredi V, Avoli M. Synaptic hyperexcitability of deep layer neocortical cells in a genetic model of absence seizures. Genes Brain Behav. 2006;5:73–84. doi: 10.1111/j.1601-183X.2005.00146.x. [DOI] [PubMed] [Google Scholar]
- Depaulis A, Van Luijtelaar EL. Genetic models of absence epilepsy in the rat. In: Pitkänen A, Schwartzkroin PA, Moshé SL, editors. Models of seizures and epilepsy. London: Elsevier; 2005. pp. 233–248. [Google Scholar]
- Feldman MD. Morphology of the neocortical pyramidal neuron. In: Peters A, Jones EG, editors. Cerebral cortex. New York: Plenum; 1984. pp. 123–200. [Google Scholar]
- Feldmeyer D, Egger V, Lubke J, Sakmann B. Reliable synaptic connections between pairs of excitatory layer 4 neurones within a single “barrel” of developing rat somatosensory cortex. J Physiol (Lond) 1999;521:169–190. doi: 10.1111/j.1469-7793.1999.00169.x. [DOI] [PMC free article] [PubMed] [Google Scholar]
- Fricker D, Verheugen JA, Miles R. Cell-attached measurements of the firing threshold of rat hippocampal neurones. J Physiol (Lond) 1999;517:791–804. doi: 10.1111/j.1469-7793.1999.0791s.x. [DOI] [PMC free article] [PubMed] [Google Scholar]
- Holmes MD, Brown M, Tucker DM. Are “generalized” seizures truly generalized? Evidence of localized mesial frontal and frontopolar discharges in absence. Epilepsia. 2004;45:1568–1579. doi: 10.1111/j.0013-9580.2004.23204.x. [DOI] [PubMed] [Google Scholar]
- Jasper HH, Kershman J. Electroencephalographic classification of the epilepsies. Arch Neurol Psychiatry. 1941;45:903–943. [Google Scholar]
- Klein JP, Khera DS, Nersesyan H, Kimchi EY, Waxman SG, Blumenfeld H. Dysregulation of sodium channel expression in cortical neurons in a rodent model of absence epilepsy. Brain Res. 2004;1000:102–109. doi: 10.1016/j.brainres.2003.11.051. [DOI] [PubMed] [Google Scholar]
- Kole MHP, Hallermann S, Stuart GJ. Single I h channels in pyramidal neuron dendrites: properties, distribution, and impact on action potential output. J Neurosci. 2006;26:1677–1687. doi: 10.1523/JNEUROSCI.3664-05.2006. [DOI] [PMC free article] [PubMed] [Google Scholar]
- Le Van Quyen M, Foucher J, Lachaux J, Rodriguez E, Lutz A, Martinerie J, Varela FJ. Comparison of Hilbert transform and wavelet methods for the analysis of neuronal synchrony. J Neurosci Methods. 2001;111:83–98. doi: 10.1016/s0165-0270(01)00372-7. [DOI] [PubMed] [Google Scholar]
- Manning JP, Richards DA, Leresche N, Crunelli V, Bowery NG. Cortical-area specific block of genetically determined absence seizures by ethosuximide. Neuroscience. 2004;123:5–9. doi: 10.1016/j.neuroscience.2003.09.026. [DOI] [PubMed] [Google Scholar]
- Manns ID, Sakmann B, Brecht M. Sub- and suprathreshold receptive field properties of pyramidal neurones in layers 5A and 5B of rat somatosensory barrel cortex. J Physiol (Lond) 2004;556:601–622. doi: 10.1113/jphysiol.2003.053132. [DOI] [PMC free article] [PubMed] [Google Scholar]
- Meeren H, van Luijtelaar G, Lopes da Silva F, Coenen A. Evolving concepts on the pathophysiology of absence seizures: the cortical focus theory. Arch Neurol. 2005;62:371–376. doi: 10.1001/archneur.62.3.371. [DOI] [PubMed] [Google Scholar]
- Meeren HK, Pijn JP, van Luijtelaar EL, Coenen AM, Lopes da Silva FH. Cortical focus drives widespread corticothalamic networks during spontaneous absence seizures in rats. J Neurosci. 2002;22:1480–1495. doi: 10.1523/JNEUROSCI.22-04-01480.2002. [DOI] [PMC free article] [PubMed] [Google Scholar]
- Neckelmann D, Amzica F, Steriade M. Spike-wave complexes and fast components of cortically generated seizures. III. Synchronizing mechanisms. J Neurophysiol. 1998;80:1480–1494. doi: 10.1152/jn.1998.80.3.1480. [DOI] [PubMed] [Google Scholar]
- Neckelmann D, Amzica F, Steriade M. Changes in neuronal conductance during different components of cortically generated spike-wave seizures. Neuroscience. 2000;96:475–485. doi: 10.1016/s0306-4522(99)00571-0. [DOI] [PubMed] [Google Scholar]
- Nersesyan H, Hyder F, Rothman DL, Blumenfeld H. Dynamic fMRI and EEG recordings during spike-wave seizures and generalized tonic-clonic seizures in WAG/Rij rats. J Cereb Blood Flow Metab. 2004;24:589–599. doi: 10.1097/01.WCB.0000117688.98763.23. [DOI] [PubMed] [Google Scholar]
- Nicolelis MA, Fanselow EE. Thalamocortical [correction of Thalamcortical] optimization of tactile processing according to behavioral state. Nat Neurosci. 2002;5:517–523. doi: 10.1038/nn0602-517. [DOI] [PubMed] [Google Scholar]
- Panayiotopoulos CP. Absence epilepsies. In: Engel J, Pedley TA, editors. Epilepsy: a comprehensive textbook. Philadelphia: Lippincot–Raven; 1997. pp. 2327–2346. [Google Scholar]
- Parri HR, Crunelli V. Sodium current in rat and cat thalamocortical neurons: role of a non-inactivating component in tonic and burst firing. J Neurosci. 1998;18:854–867. doi: 10.1523/JNEUROSCI.18-03-00854.1998. [DOI] [PMC free article] [PubMed] [Google Scholar]
- Paxinos G, Watson C. Sydney: Academic; 1986. The brain in stereotaxic coordinates. [Google Scholar]
- Penfield WG, Jasper HH. Boston: Little Brown; 1954. Epilepsy and the functional anatomy of the human brain. [Google Scholar]
- Petsche H. Pathophysiology and clinical aspects of petitmal. Toposcopic studies on the phenomenology of the spike wave pattern. Wien Z Nervenheilkd Grenzgeb. 1962;19:345–442. [PubMed] [Google Scholar]
- Pinault D, Lereshe N, Charpier S, Deniau JM, Marescaux C, Vergnes M, Crunelli V. Intracellular recordings in thalamic neurones during spike and waves discharges in rats with absence epilepsy. J Physiol (Lond) 1998;509:449–456. doi: 10.1111/j.1469-7793.1998.449bn.x. [DOI] [PMC free article] [PubMed] [Google Scholar]
- Rall W. Time constants and electrotonic length of membrane cylinders and neurons. Biophys J. 1969;9:1483–1508. doi: 10.1016/S0006-3495(69)86467-2. [DOI] [PMC free article] [PubMed] [Google Scholar]
- Sadleir LG, Farrell K, Smith S, Connolly MB, Scheffer IE. Electroclinical features of absence seizures in childhood absence epilepsy. Neurology. 2006;67:413–418. doi: 10.1212/01.wnl.0000228257.60184.82. [DOI] [PubMed] [Google Scholar]
- Silva LR, Amitai Y, Connors BW. Intrinsic oscillations of neocortex generated by layer 5 pyramidal neurons. Science. 1991;251:432–435. doi: 10.1126/science.1824881. [DOI] [PubMed] [Google Scholar]
- Simons DJ, Woolsey TA. Morphology of Golgi-Cox-impregnated barrel neurons in rat SmI cortex. J Comp Neurol. 1984;230:119–132. doi: 10.1002/cne.902300111. [DOI] [PubMed] [Google Scholar]
- Sitnikova E, van Luijtelaar G. Cortical control of generalized absence seizures: effect of lidocaine applied to the somatosensory cortex in WAG/Rij rats. Brain Res. 2004;1012:127–137. doi: 10.1016/j.brainres.2004.03.041. [DOI] [PubMed] [Google Scholar]
- Slaght SJ, Paz T, Chavez M, Deniau JM, Mahon S, Charpier S. On the activity of the corticostriatal networks during spike-and-wave discharges in a genetic model of absence epilepsy. J Neurosci. 2004;24:6816–6825. doi: 10.1523/JNEUROSCI.1449-04.2004. [DOI] [PMC free article] [PubMed] [Google Scholar]
- Snead OC., III Pharmacological models of generalized absence seizures in rodents. J Neural Transm Suppl. 1992;35:7–19. doi: 10.1007/978-3-7091-9206-1_2. [DOI] [PubMed] [Google Scholar]
- Steriade M, Amzica F. Dynamic coupling among neocortical neurons during evoked and spontaneous spike-wave seizure activity. J Neurophysiol. 1994;72:2051–2069. doi: 10.1152/jn.1994.72.5.2051. [DOI] [PubMed] [Google Scholar]
- Steriade M, Contreras D. Relations between cortical and thalamic cellular events during transition from sleep patterns to paroxysmal activity. J Neurosci. 1995;15:623–642. doi: 10.1523/JNEUROSCI.15-01-00623.1995. [DOI] [PMC free article] [PubMed] [Google Scholar]
- Steriade M, Contreras D. Spike-wave complexes and fast components of cortically generated seizures. I. Role of neocortex and thalamus. J Neurophysiol. 1998;80:1439–1455. doi: 10.1152/jn.1998.80.3.1439. [DOI] [PubMed] [Google Scholar]
- Strauss U, Kole MH, Brauer AU, Pahnke J, Bajorat R, Rolfs A, Nitsch R, Deisz RA. An impaired neocortical Ih is associated with enhanced excitability and absence epilepsy. Eur J Neurosci. 2004;19:3048–3058. doi: 10.1111/j.0953-816X.2004.03392.x. [DOI] [PubMed] [Google Scholar]
- Svoboda K, Helmchen F, Denk W, Tank DW. Spread of dendritic excitation in layer 2/3 pyramidal neurons in rat barrel cortex in vivo. Nat Neurosci. 1999;2:65–73. doi: 10.1038/4569. [DOI] [PubMed] [Google Scholar]
- Timofeev I, Steriade M. Neocortical seizures: initiation, development and cessation. Neuroscience. 2004;123:299–336. doi: 10.1016/j.neuroscience.2003.08.051. [DOI] [PubMed] [Google Scholar]
- van Luijtelaar G, Sitnikova E. Global and focal aspects of absence epilepsy: The contribution of genetic models. Neurosci Biobehav Rev. 2006;30:983–1003. doi: 10.1016/j.neubiorev.2006.03.002. [DOI] [PubMed] [Google Scholar]
- Vergnes M, Marescaux C, Depaulis A. Mapping of spontaneous spike and wave discharges in Wistar rats with genetic generalized non-convulsive epilepsy. Brain Res. 1990;523:87–91. doi: 10.1016/0006-8993(90)91638-w. [DOI] [PubMed] [Google Scholar]
- Watts J, Thomson AM. Excitatory and inhibitory connections show selectivity in the neocortex. J Physiol (Lond) 2005;562:89–97. doi: 10.1113/jphysiol.2004.076984. [DOI] [PMC free article] [PubMed] [Google Scholar]
- Williams SR, Stuart GJ. Mechanisms and consequences of action potential burst firing in rat neocortical pyramidal neurons. J Physiol (Lond) 1999;521:467–482. doi: 10.1111/j.1469-7793.1999.00467.x. [DOI] [PMC free article] [PubMed] [Google Scholar]
- Williams SR, Stuart GJ. Site independence of EPSP time course is mediated by dendritic I (h) in neocortical pyramidal neurons. J Neurophysiol. 2000;83:3177–3182. doi: 10.1152/jn.2000.83.5.3177. [DOI] [PubMed] [Google Scholar]
- Zilles K. Berlin: Springer; 1985. The cortex of the rat: a stereotaxic atlas. [Google Scholar]