

Abstract
The ability of neurons to modify synaptic connections is critical for proper brain development and function in the adult. It is now clear that changes in synaptic strength are often accompanied by changes in synaptic morphology. This synaptic plasticity can be maintained for varying lengths of time depending on the type of neuronal activity that first induced the changes. Long-term synaptic plasticity requires the synthesis of new proteins, and one mechanism for the regulation of experience-induced protein synthesis in neurons involves cytoplasmic polyadenylation element binding protein (CPEB1). CPEB1 can bidirectionally regulate mRNA translation, first repressing translation, and then activating translation after the phosphorylation of two critical residues (T171 and S177). To determine the full extent of CPEB1-mediated protein synthesis in synaptic function, we engineered a line of mice expressing CPEB1 with these phosphorylation sites mutated to alanines (mCPEB1-AA) exclusively in cerebellar Purkinje neurons (PNs). Thus, mRNAs bound by mCPEB1-AA would be held in a translationally dormant state. We show that mCPEB1-AA localizes to synapses in cerebellum and resulted in a loss of protein synthesis-dependent phase of parallel fiber–PN long-term depression. This was accompanied by a change in spine number and spine length that are likely attributable in part to the dysregulation of IRSp53, a protein known to play a role in synaptic structure. Finally, mCPEB1-AA mice displayed a significant impairment of motor coordination and a motor learning delay.
Keywords: mRNA translation, synaptic plasticity, Aurora kinase, LTD, dendritic spine, cerebellum
Introduction
The cerebellum controls balance and motor coordination, so defects in cerebellar function result in ataxia (Ito, 2002). The sole outputs of the cerebellar cortex are Purkinje neurons (PNs), which exhibit a well characterized form of long-term synaptic plasticity. Here, simultaneous input to PNs from both granule cells [via parallel fibers (PFs)] and the inferior olivary nucleus [via climbing fibers (CFs)] results in a persistent attenuation of the PF–PN synapse called cerebellar long-term depression (LTD). Cerebellar LTD is mediated by type I metabotropic glutamate receptor (mGluR) activation and is dependent on new protein synthesis (Aiba et al., 1994; Linden, 1996; Karachot et al., 2001).
Although the majority of protein synthesis in neurons is restricted to the cell soma, protein synthesis can occur in the dendrites after synaptic activation (Wells et al., 2000; Steward and Schuman, 2001). Moreover, studies in both invertebrates and vertebrates have shown that the translation of dendritically localized mRNAs play a critical role in various forms of long-term synaptic plasticity (Kang and Schuman, 1996; Martin et al., 1997; Casadio et al., 1999; Huber et al., 2000). Several mRNA-binding proteins have been implicated in the regulation of dendritic mRNA translation, including the cytoplasmic polyadenylation element binding protein (CPEB1) (Wells, 2006).
CPEB1 was first described in Xenopus oocytes, in which it regulates oocyte maturation (Mendez and Richter, 2001). CPEB1 binds to a short AU-rich sequence in responsive mRNAs called the cytoplasmic polyadenylation element (CPE) in the 3′ untranslated region (UTR). CPEB1 initially represses the translation of bound mRNA and activates translation after phosphorylation at T171 and S177 (de Moor and Richter, 1999; Mendez et al., 2000b). In mammalian neurons, synaptic activity leads to a rapid phosphorylation of CPEB1 by either Aurora kinase A or the α subunit of calcium/calmodulin-dependent protein kinase II (α-CaMKII) (Huang et al., 2002; Atkins et al., 2004).
To inhibit CPEB1-mediated protein synthesis, we expressed a mutant of CPEB1 with T171 and S177 mutated to alanines in neurons. Our rationale was that, if CPE-containing mRNA were bound by the phospho-mutant mouse CPEB1 (mCPEB1-AA), translation would be inhibited, as was shown previously in oocytes (Mendez et al., 2000a,b). Furthermore, we expressed mCPEB1-AA in only one cell type in the brain, cerebellar PN, using the L7/pcp2 promoter (Oberdick et al., 1990).
mCPEB1-AA mice showed no gross developmental deficiency in the cerebellum, and synaptic transmission was unaltered. However, mCPEB1-AA mice did not experience LTD at PF–PN synapses, and this was accompanied by a significant increase in spine density and length. Given these structural changes, we examined the regulation of IRSp53, a protein recently shown to regulate spine structure (Choi et al., 2005). We show that mCPEB1-AA interacts with IRSp53 mRNA and blocks the activity-dependent increase in IRSp53 protein after motor training. Altering CPEB1-mediated protein synthesis resulted in cerebellar ataxia and a motor learning delay. Overall, this study suggests that CPEB1-mediated protein synthesis is not required for constitutive synthesis of CPE-containing mRNA but is necessary for activity-driven synthesis. Furthermore, CPEB1 is required for the expression of cerebellar LTD and may be necessary for proper synaptic maturation.
Materials and Methods
Generation of transgenic mice.
The T171A and S177A point mutations in the mCPEB1-AA mutant construct were generated by PCR-based site-directed mutagenesis (Quik Change; Stratagene, La Jolla, CA) using the mutated primer 5′-TCGCCTGGACGCGCGGCCCATCCTGGACGCCCGTTCTAGCAGC-3′. Successful mutagenesis was confirmed by DNA sequencing. mCPEB1-AA was then subcloned into the multiple cloning site of the enhanced green fluorescent protein–C1 plasmid (Clontech, Mountain View, CA) using XhoI. A BglII site at the green fluorescent protein (GFP)–CPEB junction was mutated, and the resulting GFP–mCPEB1-AA was cut with BglII and inserted into the BamHI site of the pL7ΔAUG (Smeyne et al., 1995). The resulting plasmid was digested with HindIII and EcoR1, and the linearized construct was separated from the pGEM3 backbone by electrophoresis followed by electroelution. Generation of transgenic mice was then performed at the Yale University Transgenic Core Facility. Positive transgenic animals were identified by PCR using two sets of transgene-specific primer pairs on genomic DNA isolated from tail biopsies. Germ-line-expressing mice were identified by breeding transgenic positive founder mice with wild-type (WT) C57BL/6, resulting in the establishment of three lines of GFP–mCPEB1-AA-expressing mice (N, Q, and W). All experiments presented in this report were performed on mice 7–9 weeks of age unless explicitly stated otherwise, in accordance with the Yale Animal Care and Use Committee.
Expression analysis.
The expression pattern of the L7–GFP–mCPEB1-AA was examined by reverse transcription (RT)-PCR and Western blot analysis. For RT-PCR, total RNA was isolated from the cerebellum of GFP–mCPEB1-AA positive and negative littermate mice using the Qiagen (Valencia, CA) RNeasy mini-kit. Total RNA was treated with RNase-free DNase I (Sigma, St. Louis, MO) for 30 min at 37°C, followed by enzymatic removal using the RNA cleanup protocol in the Qiagen RNeasy kit. Equal amounts of total RNA were then subjected to oligo-dT-primed RT, followed by PCR using a transgene-specific primer pair. To determine the relative level of transgene mRNA expression, after RT, a dilution series of cDNA was created and subjected to PCR using a transgene-specific primer pair. Simultaneously, a standard curve was generated by performing PCR with the same transgene-specific primer pair on a dilution series of the L7–GFP–mCPEB1-AA plasmid used to create the transgenic mice. Equal amounts of the PCR reactions from each animal and the standard curve reactions were subsequently loaded and run on an agarose gel. Densitometry on each band and expression level was determined by comparison with the standard curve.
The regional brain expression of the GFP–mCPEB1-AA fusion protein was examined by Western blot. The cerebellum, cortex, and hippocampus of transgenic and nontransgenic controls were dissected and homogenized in glass homogenizers in pH 7.4 buffer containing 10 mm HEPES, 2 mm EDTA, 2 mm EGTA, and protease inhibitor cocktail (1:1000; Sigma). Equal amounts of total protein from each brain region were run on a 4–10% SDS-PAGE, followed by transfer onto nitrocellulose membranes. As a control for the size of the transgene, the GFP–mCPEB1-AA construct was expressed in COS cells under a cytomegalovirus promoter, and COS cellular lysate was loaded alongside the brain region lysates. After transfer, nitrocellulose was probed with either a mouse anti-GFP monoclonal antibody (1:1000; Millipore, Billerica, MA) or an affinity-purified rabbit anti-CPEB1 polyclonal antibody (1:1000) (Shin et al., 2004).
Synaptosome fractions isolated from the cerebellum were performed as described previously (Wu et al., 1998). Briefly, the cerebellum from 25 transgenic mice were homogenized and cleared by three low-speed centrifugations. The resultant supernatant was spun at 13,800 × g for 10 min, and the pellet was resuspended in 0.32 m sucrose, layered onto a discontinuous (0.85, 1.0, 1.2, 1.5, and 2.1 m) sucrose gradient, and spun at 82,500 × g for 2 h. The synaptosome fraction was collected from the 1.2/1.0 m sucrose interface. Synaptoneurosome (SN) fractions were isolated as described previously (Wu et al., 1998) with the following modifications. The cerebellum was removed and bisected in the sagittal plane, and half of the cerebellum was frozen in liquid nitrogen and the other half homogenized for SN isolation. The homogenate was cleared by a low-speed spin of 2000 × g for 1 min, and the resultant supernatant was pushed through a 100 and 50 μm pore nylon mesh and then through a 5 μm pore filter. The filtrate was then centrifuged at 1000 × g for 10 min, yielding a pellet that contained the SN fraction.
Immunohistochemistry.
Transgenic and nontransgenic littermate mice were anesthetized with ketamine and perfused with 4% paraformaldehyde/0.1% glutaraldehyde in PBS (∼50 ml/mouse). Perfused brains were microdissected and postfixed overnight at 4°C. Frozen sections (25 μm) were washed and incubated in 10% horse serum/1% Triton X-100 in PBS for 1.5 h at room temperature. Sections were incubated with primary antibodies: rabbit anti-calbindin D (1:2000; Millipore); rabbit anti-CPEB1 (Shin et al., 2004); mouse anti-GFP (1:500; Invitrogen, Carlsbad, CA); and mouse anti-IAK1 (Aurora kinase A, 1:250; BD Biosciences, San Jose, CA) diluted in block containing 0.1% Triton X-100 overnight at 4°C. Sections were washed and incubated with secondary antibodies (1:100 FITC goat anti-mouse; 1:1500 cyanine 3 goat anti-rabbit) diluted for 1 h at room temperature. Some sections were stained with 4′,6′-diamidino-2-phenylindole (DAPI) (1:1000). To determine whether expression of the transgene alters PN number, two independent investigators scored 35 μm frozen sections stained for calbindin D28K and DAPI, both blind to the genotype. Within a section, three fields of view were randomly selected under bright-field illumination, and PN number was determined by counting DAPI-positive nuclei surrounded by calbindin D immunoreactivity. Every other section was scored to ensure that the same neuron was not counted more than once (Purkinje neuron diameter is ∼30 μm). This procedure was used on two animals from both transgenic and nontransgenic controls in parasagittal sections of the cerebellum (vermis). Student's t tests were conducted to evaluate significant differences between groups.
Electrophysiology.
The cerebellum was removed from mice (7–9 weeks old), and parasagittal slices (300 μm) of the cerebellar vermis were prepared and perfused at room temperature in artificial CSF (ACSF) composed of the following (in mm): 125 NaCl, 2.5 KCl, 2 CaCl2, 1 MgCl2, 1.25 NaH2PO4, 26 NaHCO3, 20 glucose, and 0.01 bicuculline, pH 7.4 (bubbled with 95% O2 and 5% CO2).
Cerebellar slices were placed in a recording chamber and continuously perfused with oxygenated ACSF (2 ml/min) at 31°C. Whole-cell patch-clamp recordings were made from individual, visually identified PN soma. The recording pipette was filled with the following (internal solution, in mm): 130 potassium gluconate, 2 NaCl, 4 MgCl2·6H2O, 10 sodium phosphocreatine, 4 Na2-ATP, 0.4 Na3-GTP, 20 HEPES, and 10 EGTA, pH adjusted to 7.3 using KOH. Recording pipettes of 3–4 MΩ were used, and the series resistance (30–40 MΩ) was compensated by ∼70%. If the resistance changed by >10% during the recording, the data were discarded. Synaptic currents were recorded with an Axopatch 200B amplifier, and data were acquired using pClamp 8 software (Molecular Devices, Palo Alto, CA). The signals were filtered at 3 kHz and digitized at 20 kHz. A holding potential of −70 mV was established, and afferent stimulations were made with concentric bipolar microelectrodes (Rhodes Medical Instruments, Woodland Hills, CA). A 100 μs stimulus pulse of 0.1–0.2 mA for PF stimulation and 0.3–1 mA for CF stimulation was used. PF–PN and CF–PN EPSCs were identified by their characteristic features (Konnerth et al., 1990). PFs were stimulated at 0.1 Hz, and PF–PC EPSCs were recorded until a stable baseline was obtained (usually ∼30 min). Baseline EPSC rise time and decay time were then acquired before LTD induction. In cases in which Aurora kinase inhibitors were present in the recording pipette, no alterations of baseline properties were detected. PF–LTD was induced as described previously (Barski et al., 2003). Briefly, without moving the stimulus pipette, the stimulation intensity was increased until a CF response was observed, distinguished by its all-or-none character and paired-pulse depression (PPD), and the CF stimulus threshold was determined. To induce LTD, the stimulus intensity was raised to a value at least 20% over CF threshold, and a train of 300 stimuli at 1 Hz in conjunction with a depolarizing pulse (200 ms, from −70 to 0 mV) was applied. After pairing, the stimulus intensity was set to the initial value, and the recording of PF–EPSCs at 0.1 Hz was resumed for at least 40 min. Data represent the average of six responses during a 1 min period around the time point shown.
To examine CF innervation to PN, the holding potential for recording CF–PN EPSCs was set to −20mV to inactivate voltage-dependent channels. The internal solution contained the following (in mm): 10 CsCl, 135 Cs-methanesulfonate, 0.2 EGTA, 10 HEPES, 0.4 Na3-GTP, and 4 Na2-ATP, pH 7.3 adjusted with CsOH. CFs were stimulated at 0.1 Hz by applying paired pulses (0.1–0.6 mA at 50–150 ms interpulse intervals) with a concentric bipolar microelectrode. CF–PN EPSCs were identified by their all-or-none response and PPD.
Immunoprecipitations.
Brain regions from transgenic or nontransgenic littermate controls were homogenized in glass homogenizers using homogenization buffer containing 10 mm HEPES, 200 mm NaCl, 30 mm EDTA, 0.5% Triton X-100, 200 U/ml of RNase inhibitor, and protease inhibitor cocktail (1:1000; Sigma). Cell debris and nuclei were removed by centrifugation at 2000 × g for 5 min. Supernatants were saved and NaCl was raised to 400 mm, followed by centrifugation at 16,000 × g for 30 min. Supernatants were saved and 10% was removed for the input fraction. Supernatants were precleared by incubation with preblocked (PBS with 1% BSA, 0.1 μg/μl salmon sperm DNA, and 0.1 μg/μl tRNA) protein A beads (50% slurry) for 3 h at 4°C with rocking. Beads were removed by centrifugation at 12,000 × g for 20 s. Supernatants were transferred to new tubes and incubated with specific antibody or IgG for 1 h at 4°C with gentle agitation. Immunoprecipitations (IPs) were performed with either mouse anti-GFP (Invitrogen) or rabbit anti-CPEB1 (1:100) antibodies. After the 1 h incubation, 50 μl of preblocked protein A beads (50% slurry) were added and incubated overnight at 4°C. The beads were washed with 400 mm NaCl, 0.5% Triton X-100 (20 min at 4°C with gentle agitation) and recovered by centrifugation at 12,000 × g for 20 s. Equal volumes of control and anti-GFP or anti-CPEB1 IPs were loaded and run on SDS-PAGE gels and transferred to nitrocellulose. Western blots were probed with mouse anti-GFP (1:1000; Millipore) or rabbit anti-CPEB1 (1:1000), followed by incubation with HRP-conjugated goat anti-mouse or rabbit secondary antibodies, and visualized using femto-ECL reagent (Pierce, Rockford, IL). For RNA co-IP experiments, total RNA from input and IP fractions were isolated using Trizol (Invitrogen) reagent following the instructions of the manufacturers. The precipitated nucleic acids were resuspended in RNase-free water and treated with RNase-free DNase I (10 U/μl) at 37°C for 15 min. After heat inactivation of the DNase I (75°C for 5 min), total RNA was subjected to oligo-dT-primed RT-PCR using gene-specific primer pairs for IRSp53 and tubulin (40 cycles, with one-third of the product loaded for input).
Behavioral tests.
Motor coordination was tested using a rotarod in a constant speed (28 rpm) or accelerated protocol (setting 9; Meditech, Westwood, MA). The rotarod is a 3-cm-diameter rubber-coated and grooved rod 10 cm long, driven by a motor. In the accelerated protocol, the wheel accelerated from 4 to 40 rpm over a 300 s interval for each trial. The mice were trained with three consecutive trials per day (15 min intertrial interval) on 2 consecutive days. The fall latency and passive latency (the time elapsed for the mouse to either fall or make a full rotation by simply hanging onto the rod) were recorded. The control group of mice included both nontransgenic littermates as well as age-matched wild-type C57BL/6 mice, because average fall latencies were not significantly different from each other (data not shown). Relative ataxia was determined by calculating the percentage decrease in average fall latency between transgenic and control mice.
To determine changes in protein levels after training, transgenic and nontransgenic littermates were trained on the rotarod for three trials using the accelerated protocol as described above, with the exception that, after the third trial (1 h after training initiation), the mice were killed and their cerebellum was removed, coded, and processed for Western blot analysis. To determine the effect of motor training, a second group of transgenic and nontransgenic littermates were left untrained. The investigator running the Western blots was blind to the genotype of the samples. After SDS-PAGE and transfer as above, the nitrocellulose was stained with Ponceau S, and total protein in each lane was determined by densitometry to normalize protein loading in each lane. After quantification, the code was revealed, and the animals were grouped by genotype and training paradigm. Primary antibodies used included rabbit anti-IRSp53 (1:2000), mouse anti-β-tubulin (1:80,000; Sigma), and mouse anti-β-actin (1:10,000; Sigma). Student's t tests were performed to evaluate significant differences between groups.
Ataxia was also examined by gait analysis (Carter et al., 1999). Here, the front and hindpaws of transgenic and nontransgenic mice were differentially marked with nontoxic paint (blue and pink) and induced to walk across a sheet of white paper in a straight line. Four measurements were recorded: (1) stride length, measured as the average distance of forward movement between each stride; (2) hind-base width and (3) front-base width, measured as the average distance between left and right hind footprints and left and right front footprints, respectively; and (4) front footprint/hind footprint overlap, measured as the distance between the centers of the footprints when they did not overlap (direct overlap was scored as 0). For each step parameter, at least three values were measured for each run, excluding footprints made at the beginning and end of the run, in which movement was being initiated or stopped. Student's t tests were performed to evaluate significant differences between groups.
Purkinje neuron and spine analysis.
Individual PN were filled with either 2% Neurobiotin (NB) (Vector Laboratories, Burlingame, CA) or 1% Lucifer yellow by passing −20 mV hyperpolarization pulses of 150 ms duration at 3.3 Hz for 30–40 min. Slices were then fixed with 4% paraformaldehyde in PBS overnight at 4°C. For Lucifer yellow, sections were then mounted onto slides and visualized with a scanning disk confocal microscope using a PlanApo 100×, 1.4 numerical aperture (NA) oil emersion objective [Olympus Optical (Tokyo, Japan) IX2 microscope with Hamamatsu (Bridgewater, NJ) CCD]. For Neurobiotin, the sections were incubated with Triton X-100 (0.4% in PBS) for 2 h, stained with Vectastain ABC Elite Reagent (Vector Laboratories), and developed with diaminobenzidine (0.05%) and H2O2 (0.003%). The sections were dried and mounted with Permount gel. Distal, third- or fourth-order (3–4°) dendrites were used for the evaluation of spine number to ensure that we were counting spines innervated by parallel fibers. We defined a spine as a dendritic protrusion clearly originating from the shaft of a dendrite and not intersecting any other dendritic segment. We did not count or measure any protrusion that appeared to contain more than one head. Three independent investigators, blind to the genotype, counted randomly selected dendritic segments of labeled PN. Each scored dendritic segment was ∼20 μm in length. Spines were visually identified and counted using a Plan Apo 100×, 1.45 NA oil emersion objective (Nikon, Tokyo, Japan). Dendritic lengths were measured from images taken of the region immediately after counting and processed using Adobe Photoshop software (Adobe Systems, San Jose, CA). To determine whether there was a significant difference in spine density between groups, data were subjected to an ANOVA.
The dendritic complexity was analyzed by a Scholl analysis (Lustig et al., 1998). Low-magnification pictures were taken of an NB-filled PN, and a set of concentric circles, each 50 μm apart, was superimposed on the PN with the cell body in the center of the circles. The number of dendrites that intercept each ring was counted, extending the analysis to 500 μm from the soma.
Spine length was determined from spinning disk confocal image stacks of Lucifer yellow-filled cells imaged using a Plan Apo 100×, 1.45 NA oil emersion objective. Images were three-dimensionally reconstructed using Imaris 4.1 software (Bitplane, Zurich, Switzerland). Spines were measured using NIH Image, blind to genotype, from randomly selected 3–4° dendritic regions ∼20 μm in length and <1.5 μm in diameter.
Results
Characterization of mCPEB1-AA mice
Three independent lines of transgenic mice expressing GFP–mCPEB1-AA under the L7/pcp2 promoter were generated and propagated with no line displaying any obvious gross morphological or behavioral abnormalities (supplemental Fig. 1, available at www.jneurosci.org as supplemental material). RT-PCR analysis using transgene-specific primers on equal amounts of total RNA isolated from the cerebellum of wild-type or N-, Q-, and W-line transgenic mice revealed differing levels of transgene expression (Fig. 1A). N-line mice expressed a low level, the Q-line a medium to high level, and the W-line a high level of GFP–mCPEB1-AA mRNA. Unless we were examining the differences among animals expressing different amounts of the transgene, the data presented are from mice expressing a medium to high level of the transgene. To assess the regional expression of the transgene in the brain, Western blot analysis was performed on tissue isolated from the cerebellum, cortex, and hippocampus of mCPEB1-AA mice and probed with a polyclonal antibody against CPEB1 (Fig. 1A). A GFP–mCPEB1-AA-specific band of ∼90 kDa was present exclusively in the cerebellum, whereas endogenous CPEB1 (∼62 kDa) was present in all brain regions tested. Western blot analysis on equal amounts of total protein from the cerebellum and cortex of mCPEB1-AA mice using an anti-GFP monoclonal antibody also revealed cerebellar-specific expression of the transgene (Fig. 1A).
Figure 1.
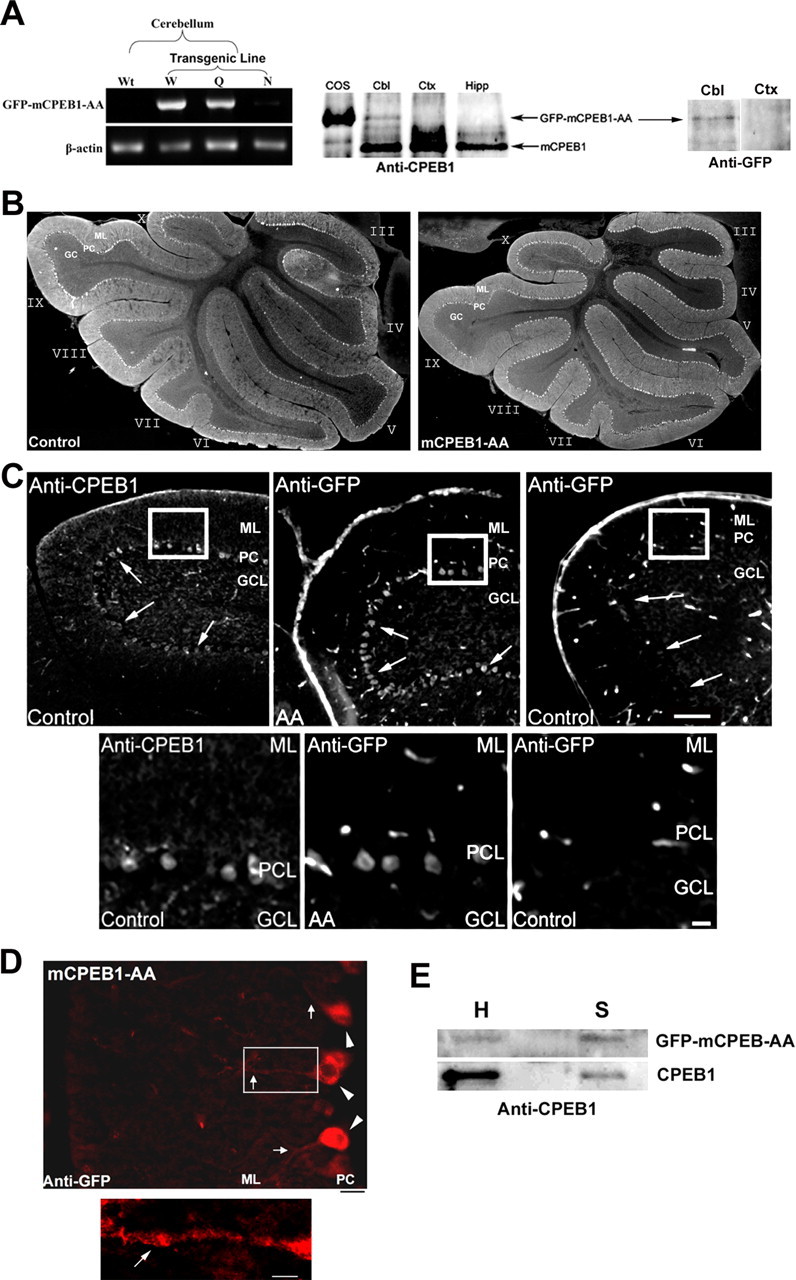
Purkinje cell-specific expression of the mCPEB1-AA transgene does not affect cerebellar morphology. A, Total RNA isolated from the cerebellum of wild-type (Wt) or transgenic (W-, Q-, and N-lines) mice was subjected to oligo-dT reverse transcription, followed by PCR with primers specific for the transgene or β-actin (left). Western blot analysis of transgene expression showing total protein isolated from the cerebellum (Cbl), cortex (Ctx), and hippocampus (Hipp), of a Q-line mouse probed with an anti-CPEB1 antibody. GFP–mCPEB1-AA expressed in COS cells was run on the same gel as an indication of the GFP–mCPEB1-AA size. In each brain region, the CPEB1 antibody detected endogenous mCPEB1 (arrow; 62 kDa). However, the GFP–mCPEB1-AA transgene (arrow, ∼90 kDa) was detected exclusively in the cerebellum (middle). To confirm expression, we also probed a blot with an antibody against GFP (right). Again, mCPEB1-AA was only expressed in the cerebellum. B, IHC was performed on cerebellar tissue sections derived from mCPEB1-AA mice and littermates not expressing the transgene (control). Sagittal sections (35 μm) from the cerebellum of control (left) and L7–GFP–mCPEB1-AA mice stained with an anti-calbindin D antibody. Gross structure and laminar organization of the cerebellum in the mCPEB1-AA mice is indistinguishable from that of control. C, Distribution of endogenous CPEB1 was visualized in a cerebellar sagittal section (25 μm) of an adult mouse with an anti-CPEB1 antibody (left). CPEB1 expression is highest in the Purkinje cell layer (PCL; arrows). Cerebellar sagittal sections of mCPEB1-AA (AA) and control mice were also probed with an anti-GFP antibody showing transgene expression exclusively in the Purkinje cell layer (arrows). Although the GFP antibody yielded a high background with nonspecific staining in blood vessels, no specific staining was detected in the granule cell layer (GCL) or the molecular layer (ML). Regions of interest (boxes) are presented at higher magnification at the bottom. Scale bars: top, 100 μm; bottom, 20 μm. D, Closer examination of the ML reveals anti-GFP staining (red) in PN cell soma (arrowheads) and into the dendrites (arrows), indicating that mCPEB1-AA protein is distributed like the endogenous CPEB1. Bottom, Region of interest (box) shown at higher magnification. Scale bars: left, 40 μm; right, 10 μm. E, Synaptosome fraction isolated from GFP–mCPEB1-AA-expressing cerebellum was analyzed by Western blot using an antibody specific for mCPEB1. Although the level of the transgene appears low in the gross homogenate (H), a clear enrichment in the synaptosome fraction (S) can be seen. Image is one Western blot representative of three separate synaptosome preparations; a nonspecific band running between CPEB1 and mCPEB1-AA was spliced out for clarity.
Purkinje neuron-specific expression of GFP–mCPEB1-AA
To address gross morphological changes in the cerebellum, anti-calbindin D28K staining of frozen sagittal sections from the cerebellum of control and transgenic mice were performed. This revealed that the overall morphology and cellular architecture of the cerebellum were normal in the mCPEB1-AA mice (Fig. 1B). Purkinje neuron density was also examined from these sections and determined not to be different from control mice (controls, 23 ± 4 PN/mm; mCPEB1-AA, 23 ± 6 PN/mm; n = 2 mice per genotype). To determine the cellular expression pattern of CPEB1 in the cerebellum, frozen sections from the cerebellum of control mice were stained with an anti-CPEB1 antibody. CPEB1 is highly expressed in the PN layer with lower but detectable levels in the molecular and granule cell layer (Fig. 2C, left). To determine which cells in the cerebellum were expressing the transgene, frozen sections from the cerebellum of mCPEB1-AA mice were examined with an anti-GFP antibody (Fig. 2C, middle). In mCPEB1-AA-expressing mice, staining for the transgene was visible in the PN layer and extended into the dendrites of PN, in a pattern similar to that of endogenous CPEB1 (Fig. 2C,D). To examine the extent of mCPEB1-AA localization to synapses and determine a relative ratio of endogenous CPEB1 to mCPEB1-AA at cerebellar synapses, we isolated a synaptosome fraction from transgenic animals and performed a Western blot analysis with an anti-CPEB1 antibody. This revealed that, although the level of CPEB1 in the cerebellar homogenate far exceeded that of mCPEB1-AA (Fig. 1A,E), at the synapse there is a comparable level of the two proteins (Fig. 1E). The disparity between homogenate and synaptic levels of endogenous CPEB1 likely reflect the presence of CPEB1 in non-PN and non-neuronal cell (K. Jones and D. G. Wells, unpublished observation).
Figure 2.

Cerebellar Purkinje neuron morphology and physiology is unchanged by mCPEB1-AA expression. A, Amplitude of EPSC recorded in voltage clamp using whole-cell patch configuration of PNs generated from successive stimulation pulses to parallel fibers given 50–150 ms apart in wild-type and mCPEB1-AA-expressing PNs. PPF was determined as the ratio of the amplitude of EPSC generated in response to the second pulse over the first response. B, Glutamate receptor localization to synapses was evaluated using Western blot analysis of the synaptic fraction isolated from the cerebellum of both WT and mCPEB1-AA mice. The homogenate (H), cytoplasmic (C), and SN fraction were loaded into SDS-PAGE gels with equal protein, and the blot was probed with antibodies directed against a metabotropic glutamate receptor subunit (mGluR1) and the AMPAR subunit (GluR2/3). Blots from three independent experiments were quantified and showed no significant difference between WT and mCPEB1-AA mice; shown is one representative experiment. C, Complex spikes generated from CF stimulation and recorded from PNs under current clamp. A single CF stimulation results in a typical complex spike response in PNs from either WT or mCPEB1-AA mice. Data represent four consecutive traces superimposed. D, Purkinje neurons injected with Neurobiotin demonstrate a typical PN morphology in wild-type and mCPEB1-AA-expressing cells (top). Scholl analysis of PN dendrites labeled with Neurobiotin reveal no difference in dendritic complexity (bottom; WT, n = 5 cells from 3 mice; mCPEB1-AA, n = 6 cells from 3 mice). E, The development of CF–PN synapses was analyzed using the voltage-clamp configuration and identifying the CF innervation by its characteristic paired-pulse depression and all-or-none response (left). Each PN recorded from was scored as either multiply innervated or monosynaptically innervated, and data represent a percentage of cells that are monosynaptically innervated at each age. Early in postnatal development (1–2 weeks), ∼40% of the PNs were innervated by a single CF. By 4 weeks, all PNs examined were monosynaptically innervated (1–2 weeks, n = 59 PN mCPEB1-AA, 35 PN WT; 4 weeks, n = 22 PN mCPEB1-AA, 30 PN WT).
Purkinje neuron development appears unaltered in mCPEB1-AA mice
To examine the morphology of PNs expressing mCPEB1-AA protein, we injected Neurobiotin via a whole-cell recording pipette. Quantified by Scholl analysis, there was no measurable morphological difference between PN in mCPEB1-AA transgenic mice versus wild type (Fig. 2D).
To examine the properties of synaptic transmission onto PNs, we first tested the paired-pulse facilitation (PPF) in PF–PN synapses. PPF is a form of presynaptic short-term synaptic plasticity that results in an enhancement of the EPSC in response to the second of two pulses given in rapid succession. The PPF in PF–PN synapses between the two groups were not significantly different at interpulse intervals between 50 and 150 ms (Fig. 2A). This suggests that the synaptic connections in mCPEB1-AA mice are functionally similar to those of wild-type mice. To confirm this, we analyzed both the kinetics of the PF–PN EPSCs and the distribution of receptors in wild-type and transgenic mice. We show that there is no difference in the EPSC kinetics (WT, 10–90% rise time, 2.89 + 0.18 ms; mCPEB1-AA, 3.03 + 0.16 ms; p = 0.28, Student's t test; n = 20 neurons WT, 21 neurons mCPEB1-AA). Next, we isolated a synaptoneurosome fraction from control and transgenic mice and found that both mGluR1 and GluR2/3 are distributed identically (Fig. 2B). We next examined the complex spike generated in the PN after CF stimulation from mice 6–8 weeks old. A single CF stimulation generates a large depolarization that is identical in both WT and mCPEB1-AA mice (Fig. 2C). Finally, during early postnatal development, PN are innervated by multiple CFs. Synapse elimination at poly-innervated CF–PN synapses during the first 3 weeks after birth ensures that a single CF innervates each PN by adulthood (Mariani and Changeux, 1981; Kano et al., 1995; Nishiyama and Linden, 2004). CF innervation was identified using two CF–PN synapse-specific properties: all-or-none response and PPD. Examples of EPSC responses after paired-pulse stimulation (50 ms interval) of singly innervated CF–PN and multiple innervated CF–PN synapses are shown in Figure 2E. Using these criteria, we determined that, in mCPEB1-AA mice, CF–PN synapse elimination proceeds in a manner indistinguishable from control mice (Fig. 3E).
Figure 3.

Protein synthesis-dependent phase of cerebellar LTD is abolished in mCPEB1-AA transgenic mice. A, Cerebellar LTD elicited by conjunctive stimulation in the absence (CTRL) or presence (CHX) of the protein synthesis inhibitor cycloheximide (100 μm) in cerebellar slices isolated from wild-type mice (cycloheximide, n = 5 cells; controls, n = 14 cells; mean ± SE). Inset, Representative traces show PF–PN EPSC before (1) and after (2) the induction of cerebellar LTD. B, Group data of mCPEB1-AA mice tested (n = 15 mice, Q- and W-lines). Conjunctive stimulation produces an initial depression with attenuated amplitude that is not maintained (mean ± SE). C, Data from individual mice expressing either high (open circles) or low (filled circles) levels of the mCPEB1-AA mRNA assessed by quantitative RT-PCR after these recordings were made. Data represent the mean ± SEM EPSC responses in two to three neurons per animal, four to six mice per group.
Cerebellar LTD is altered in mCPEB1-AA transgenic mice
To confirm that cerebellar LTD requires protein synthesis (Ahn et al., 1999; Karachot et al., 2001), we induced LTD at the PF–PN synapse in the presence or absence of the protein synthesis inhibitor cycloheximide (100 μm). In the presence of cycloheximide, the amplitude of the initial EPSC depression was attenuated and the late-phase of LTD was abolished (Fig. 3A). Interestingly, if we applied the protein synthesis inhibitor immediately after the stimulation, we did not see the attenuation of the initial amplitude of the depression, but it again came back to baseline within 15 min (supplemental Fig. 2A, available at www.jneurosci.org as supplemental material). We next induced LTD using the same stimulation protocol on PNs expressing mCPEB1-AA. The group data of mCPEB1-AA mice (medium to high expressors) shows an initial attenuation of the amplitude of depression, followed by rapid return to baseline EPSC amplitudes (Fig. 3B). In the course of these experiments, we noticed that the extent of LTD inhibition varied between animals, so quantitative RT-PCR was performed (blind to the electrophysiological results) to determine the expression level of the transgene in some of the animals from which we recorded. We found that the degree to which LTD was attenuated was dependent on the level of transgene expressed (Fig. 3C), with animals expressing relatively low levels of mCPEB1-AA exhibiting a slower decline in the EPSC amplitude toward baseline levels. In this example, the mouse expressing a high level of mCPEB1-AA exhibited EPSC amplitudes that overshot the baseline amplitude at ∼20 min after stimulation. However, this increase in EPSC amplitude was not statistically different from baseline amplitudes and was not detected in all high expressors examined.
Because the transgene harbors a mutation in the Aurora A phosphorylation site of CPEB1 and Aurora kinase A is expressed in PN dendrites (Fig. 4A), we reasoned that inhibiting Aurora A in wild-type PNs should have a similar effect. Therefore, we placed the Aurora kinase inhibitor hesperadin into the recording patch pipette. Hesperadin is an indolinone derivative that inhibits Aurora kinase with an IC50 of ∼100 nm in a cell context. At concentrations of 50 nm, it is a very specific inhibitor of Aurora kinases (Hauf et al., 2003). Hesperadin administration to PN resulted in a dose-dependent inhibition of LTD, mimicking that seen in the mCPEB1-AA-expressing cells (Fig. 4B). However, hesperadin administration to mCPEB1-AA-expressing mice had no additional affect on LTD (Fig. 4C). To confirm that inhibition of Aurora kinase blocks cerebellar LTD, we repeated these experiments with a different Aurora kinase inhibitor, ZM447439 (Tocris, Ellisville, MO). ZM447439 inhibits Aurora kinase with an IC50 of 110 nm and becomes nonselective at concentrations of 1 μm and higher (Ditchfield et al., 2003; Andrews, 2005). When we recorded from cells with ZM447439 (100 nm) in the recording pipette, the effect on LTD was identical to that of hesperadin (supplemental Fig. 2B, available at www.jneurosci.org as supplemental material).
Figure 4.

Phosphorylation of CPEB1 by Aurora kinase required for cerebellar LTD. A, Immunohistochemistry of cerebellum isolated from an mCPEB1-AA mouse and probed with anti-IAK1 antibody (Aurora A). Aurora kinase A is highly expressed in PN cell bodies (PC) and dendrites (arrows) in the molecular layer (ML). The granule cell (GC) layer appears to express little Aurora A. Region of interest (box) is shown at higher magnification in the bottom. Scale bars: top, 40 μm; bottom, 20 μm. B, Conjunctive stimulation in wild-type neurons recorded with the Aurora kinase inhibitor hesperadin (Hesp) located in the recording patch pipette. Increasing the concentration of hesperadin yielded greater reduction in cerebellar depression (n = 4–6 cells from 4 mice per group; mean ± SEM). C, Expression of the CPEB1 phospho-mutant occludes the effect of hesperadin on cerebellar LTD. Conjunctive stimulation of mCPEB1-AA-expressing PNs in the presence of hesperadin (10 nm) in the recording pipette did not significantly change the response (mCPEB1-AA, n = 15 cells; mCPEB1-AA plus hesperadin, n = 4 cells; mean ± SEM).
GFP–mCPEB1-AA alters spine density and shape
Because changes in synaptic strength are often accompanied by changes in spine structure (Hayashi and Majewska, 2005), we next asked whether spine number or spine morphology had been altered in the mCPEB1-AA mice. Using Neurobiotin-filled cells, we analyzed spine density blind to genotype on distal 3–4° dendrites. PNs expressing the transgene had a significantly greater spine density on these distal dendrites than controls (WT, 9.3 ± 0.3 spines/10 μm; mCPEB1-AA, 11.1 ± 0.5/10 μm; p < 0.01). Using Lucifer yellow-filled PNs visualized with a spinning disk confocal microscope, we examined PN spine length on distal dendrites (3 or 4° dendrites). The spines from mCPEB1-AA-expressing PNs were significantly longer than those from control PNs (control, 0.56 ± 0.01 μm, n = 202; mCPEB1-AA, 0.74 ± 0.01 μm, n = 210; p < 0.01) (Fig. 5A). Together with the electrophysiology data, this suggests that inhibiting CPEB1-mediated mRNA translation specifically affects PN spine structure and LTD.
Figure 5.
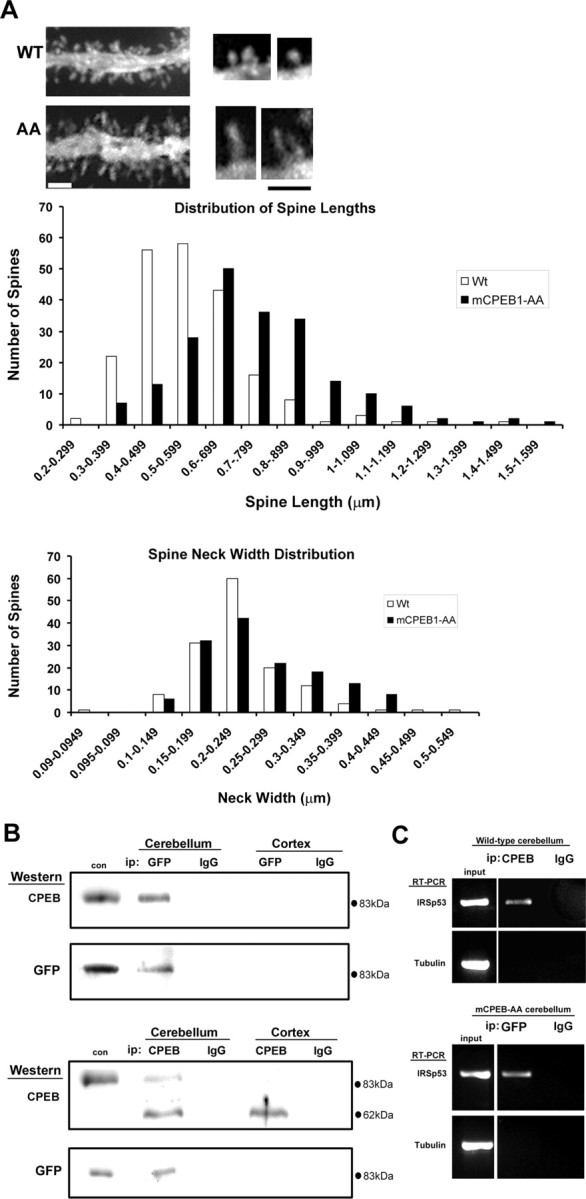
mCPEB1-AA alters PN spine morphology and binds CPE-containing mRNA in cerebellum. A, Representative tertiary dendrite from WT or mCPEB1-AA (AA) expressing PNs filled with Lucifer yellow. Spine measurements were made on dendrites <1.5 μm in diameter similar to these; at higher magnification, a clear change in spine morphology can be detected (right). Scale bars, 1 μm. Spine length shows a statistically significant shift to the right in the mCPEB1-AA mice (filled bars, middle). Spine neck width distribution is similar in both groups of animals, but mCPEB1-AA mice do show a trend toward an increase in spine neck width (filled bars, bottom). B, IPs were performed with either anti-GFP or anti-IgG from the cerebellum and cortex of mCPEB1-AA-expressing mice (top). The presence of GFP–mCPEB1-AA protein was confirmed by Western blot using either anti-CPEB1 or a different anti-GFP antibody. IPs performed with either anti-CPEB1 or anti-IgG from cerebellum or cortex of mCPEB1-AA mice were probed with an anti-CPEB1 or anti-GFP antibody (bottom). COS cells transfected with the GFP–mCPEB1-AA construct were used to specify the size of the transgenic protein (con). C, IPs from cerebellum of wild-type mice using either an anti-CPEB1 (α-CPEB1) or a nonspecific IgG (α-IgG) antibody, followed by RT-PCR using primers specific for IRSp53 or tubulin (top). IPs from cerebellum of mCPEB1-AA mice using either an anti-GFP (α-GFP) or a nonspecific IgG (α-IgG) antibody, followed by RT-PCR with primers specific for IRS-p53 or tubulin (bottom). Input represents RNA isolated from the homogenate before IP analyzed by RT-PCR using the same primer sets used in the IP.
The data presented thus far suggest that mCPEB1-AA expression in PNs is inhibiting the activity-induced synthesis of new proteins vital to PN synaptic plasticity. If so, mCPEB1-AA must compete with the endogenous CPEB1 for binding to these mRNAs. To identify a candidate mRNA to test this hypothesis, we used sequence analysis on mRNAs encoding proteins known to affect actin dynamics. By sequence analysis, we identified a putative CPE in the 3′ UTR of the mRNA encoding IRSp53. This CPE is conserved in multiple species, including hamster, mouse, and human. Both IRSp53 protein and mRNA are expressed in PN dendrites (Thomas et al., 2001; Sekerkova et al., 2003). To examine the interaction of CPEB1 with IRSp53 mRNA, co-IP experiments were conducted from the cerebellum of mCPEB1-AA and control mice. In one set of experiments, a monoclonal antibody against GFP was used to immunoprecipitate GFP–mCPEB1-AA from the cortex or cerebellum of a transgenic mouse (Fig. 5B). Western blot analysis using either a polyclonal antibody against CPEB1 or a different anti-GFP antibody revealed that GFP–mCPEB1-AA was only pulled down from the cerebellum. A similar set of IPs was also performed on the cortex and cerebellum of littermates not expressing the transgene, and no GFP–mCPEB1-AA was pulled down in either brain region (data not shown). In a reciprocal set of IP experiments, anti-CPEB1 successfully pulled down endogenous CPEB1 from both the cortex and cerebellum of transgenic mice, but the GFP–mCPEB1-AA was only present in the IP from the cerebellum (Fig. 5B). Furthermore, RT-PCR analysis of the mRNA pulled down in association with GFP–mCPEB1-AA revealed the presence of mRNA encoding IRSp53 but not tubulin mRNA, which lacks a CPE sequence (Fig. 5C). Endogenous CPEB1 also interacts with IRSp53 mRNA, as evidenced by co-IP with CPEB1 using an anti-CPEB1 from the cerebellum of a wild-type mouse (Fig. 5C). Therefore, GFP–mCPEB1-AA in the cerebellum of transgenic mice can compete with endogenous CPEB1, for binding to CPE-containing mRNA.
Behavioral analysis of mCPEB1-AA mice
mCPEB1-AA mice had no obvious behavioral deficits, but, because there was an alteration in cerebellar LTD, we assessed motor coordination on a rotarod apparatus. Rotarod tests can be performed at a constant speed to assess balance and coordination or can be set to accelerate over a fixed interval to test coordination and motor learning because the mouse must learn to adjust to the increasing speed of the wheel (Crawley and Paylor, 1997). Wild-type and mCPEB1-AA littermates not carrying the transgene performed identically on the rotarod (data not shown); therefore, the control group was a mixture of these two animals. When tested with either the constant speed or the accelerated protocol, mCPEB1-AA mice were significantly ataxic (Fig. 6A). Run at a constant speed of 28 rpm, the control mice average fall latency for six trials was 283 s, whereas the mCPEB1-AA mice fell on average at 127 s (p < 0.001). A similar ataxia is recorded on the accelerating rotarod assay (Fig. 6A). To determine whether this difference could be accounted for by a loss of muscle strength in the transgenic mice, we performed a strength test that involved having the mice climb a vertical “rope” (6 mm thick and 30 cm long) and maintain their grip at the top for 2 min (Rogers et al., 1997; Ribar et al., 2000). Aged-matched mCPEB1-AA and wild-type mice were indistinguishable in this assay (data not shown).
Figure 6.
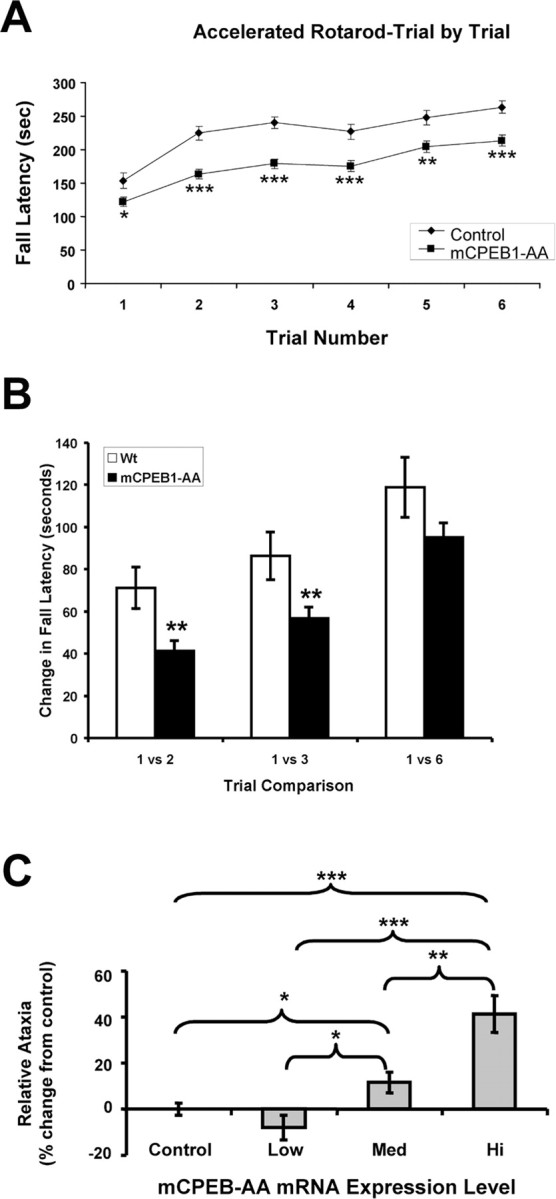
mCPEB1-AA-expressing mice are ataxic and show a motor learning delay. A, A trial-by-trial comparison between transgenic (n = 103) and control (n = 41) mice after training on the accelerated rotarod revealed that the transgenic mice are significantly impaired at each trial. B, Learning was assessed by plotting the change in fall latency between trials graphically illustrates the significant difference in learning between trials 1–2 or 1–3 (**p < 0.01). However, over six trials, the animals had similar change in fall latencies (p = 0.3), suggesting a learning delay. C, Relative ataxia of transgenic animals grouped into three categories: low-level expressors (n = 3); medium-level expressors (expression level is 5 times more than low-level expressors; n = 9); and high-level expressors (expression level is 10 times more than low-level expressors; n = 4). The low-expressing group of mCPEB1-AA mice is not significantly ataxic versus control mice (p = 0.166), whereas both the medium- and high-expressing transgenic mice are significantly ataxic versus the control mice (*p < 0.05; **p < 0.01; ***p < 0.001).
Motor learning in the rotarod paradigm is measured as improvement from trial to trial on the accelerated protocol. Interestingly, the mCPEB1-AA mice learn (improve), and, in fact, their degree of learning from trials 1–6 is not significantly different from control mice (Fig. 6B). However, measuring the slope of the lines between trials 1 and 2 as well as trials 1 and 3 during peak motor learning for the control group reveals that the transgenic mice have significantly altered learning (Fig. 6B). Together, this data show that, although the mCPEB1-AA mice learn, they do so at a slower rate.
As mentioned previously, different lines of transgenic mice express GFP–mCPEB1-AA at various levels. In an effort to determine whether expression level affects rotarod performance, mice with quantified expression levels were categorized as low expressors (LE), medium expressors (ME), or high expressors (HE), with ME expressing five times more than LE and the HE 10 times more than LE. Analysis of fall latency (blind to expression level) versus transgene expression for the low, medium, and high expressors revealed that higher levels of GFP–mCPEB1-AA correlates directly with a more severe ataxia (Fig. 6C) and a shallower learning curve (data not shown). Performance on the rotarod was also coincident with a more dramatic inhibition of LTD (e.g., the HE and LE mice shown in Fig. 3C had average fall latencies over six trials of 133 ± 33 and 271 ± 25 s, respectively).
In addition to the rotarod test, ataxia can be assessed by analyzing gait (Crawley and Paylor, 1997; Carter et al., 1999). This test involves coating the front and hindpaws with different colored nontoxic paint and recording their footprints on a white piece of paper as the animal walks in a straight line. In general, ataxic animals tend to have any combination of shorter stride lengths, wider front-base width, wider hind-base width, and nonoverlapping front/hind footprints compared with controls (Carter et al., 1999). Consistent with the rotarod analysis showing a moderate but significant ataxia, gait analysis on the mCPEB1-AA mice revealed a significantly wider hind-base width (control, 2.14 ± 0.06 cm; mCPEB1-AA, 2.40 ± 0.05 cm; p < 0.01) and step overlap (control, 0.74 ± 0.05; mCPEB1-AA, 0.88 ± 0.04; p < 0.05) with no difference in the stride length compared with wild-type mice.
Changes in IRSp53 protein in mCPEB1-AA mice
To determine whether expression of GFP–mCPEB1-AA results in a loss of IRSp53 protein, the cerebellum was removed and Western blot analysis was preformed on mCPEB1-AA mice and littermates not expressing the transgene. Quantification of these blots revealed no change in the baseline level of IRSp53 or tubulin protein (data not shown), indicating that expression of the transgene did not alter the constitutive translation of either CPE or non-CPE containing mRNA. We next examined the levels of IRSp53 protein in the cerebellum after motor learning (Fig. 7). Because the majority of learning occurs during the first three trials (Fig. 6), we measured the levels of IRSp53 protein in the cerebellum of mice immediately after the third trial (total training time of 1 h). mCPEB1-AA mice were again ataxic when compared with control mice, with an average fall latency of 170 versus 251 s for controls on the accelerated rotarod. In control animals, rotarod training caused a significant increase in IRSp53 protein levels in the cerebellum, with no change in the β-tubulin levels. However, training induced a significant decrease in the IRSp53 levels in mCPEB1-AA mice compared with controls (Fig. 7). This demonstrates that IRSp53 protein synthesis is induced in the cerebellum after motor experience and that activation of CPEB1 is required for this experience-induced increase.
Figure 7.

Increase in IRSp53 protein synthesis after motor training is blocked by mCPEB1-AA. Western blot analysis of tubulin and IRSp53 protein levels in the cerebellum of mice trained on the accelerated rotarod protocol for three trials. Data represent protein levels in the cerebellar homogenate of trained as a percentage of that protein in untrained mice when comparing both wild-type (control) and mCPEB1-AA mice. Motor training led to a significant increase in IRSp53 levels in control mice, whereas in mCPEB1-AA mice, IRSp53 levels significantly decreased compared with untrained levels (mean ± SEM; *p < 0.05). Representative blots of tubulin and IRSp53 are shown above each bar; IRSp53 runs as a doublet of 53 and 58 kDa, and both bands were used in the quantification (control, n = 10 mice per group; mCPEB1-AA, n = 10 mice untrained, 23 mice trained).
Discussion
To examine the effect of inhibiting CPEB1-mediated protein synthesis in neurons, we expressed a CPEB1 protein with T171A and S177A mutations in Purkinje neurons. Similar point mutations have been shown previously to inhibit the phosphorylation and activation of CPEB1 in Xenopus oocytes (Mendez et al., 2000b). We find that expression of mCPEB1-AA exclusively in PNs results in a dose-dependent ataxia, an inhibition of cerebellar LTD, and a motor learning delay. These deficits are seen without gross morphological changes in the cerebellum or PN dendritic arborization or change in baseline synaptic properties but a significant change in PN spine number and morphology. Because the amount of mCPEB1-AA expressed determines the severity of the phenotype, mCPEB1-AA is likely competing with endogenous CPEB1 for regulation of CPE-containing mRNA. However, expression of mCPEB1-AA does not appear to affect general protein synthesis, because levels of tubulin, mGluR1, GluR2/3, and IRSp53 are identical in control and transgenic cerebellum.
Several studies have shown that new protein synthesis is required for many forms of long-term synaptic modifications (Davis and Squire, 1984; Linden, 1996; Martin et al., 2000). Indeed, the local or dendritic translation of mRNA(s) play key roles in multiple forms of synaptic plasticity in both vertebrates and invertebrates (Kang and Schuman, 1996; Martin et al., 1997; Huber et al., 2000). CPEB1 is an mRNA-binding protein that localizes to synapses and can regulate mRNA translation after synaptic activation (Wu et al., 1998; Wells et al., 2001; Shin et al., 2004). A role for CPEB1-mediated protein synthesis in both synaptic plasticity and memory extinction in the hippocampus was described recently. Here, CPEB1 knock-out (KO) mice were found to have a mild deficit in the amplitude of both long-term potentiation (LTP) and LTD induced by “weak” stimulation, whereas stronger stimulation protocols produced robust LTP and LTD indistinguishable from control (Alarcon et al., 2004). Behaviorally, the CPEB1 KO mice show a deficiency in the extinction, but not the acquisition or maintenance, of hippocampal-based learning (Berger-Sweeney et al., 2006).
Our results support those of the CPEB1 KO in that both studies find alterations in synaptic plasticity. In addition, the expression of mCPEB1-AA results in a more robust synaptic phenotype, suggesting that other mechanisms may be compensating for a loss of CPEB1 in the KO. It is unlikely that the other CPEB family members expressed in the brain are directly compensating for CPEB1 loss, because CPEB2–CPEB4 do not bind CPE sequences with high affinity, nor do they regulate mRNA polyadenylation (Huang et al., 2006). Therefore, compensation in the CPEB1 KO mice may be the result of other mRNA-binding proteins capable of targeting mRNA into dendrites, allowing for translation after strong synaptic activation.
CPEB1 mediates local protein synthesis
We present several lines of evidence suggesting that the phenotype of mCPEB1-AA mice is the result of an inhibition of CPEB1-mediated protein synthesis in the synaptodendritic domain. First, the mutant protein is efficiently targeted into dendrites, resulting in equivalent levels of mCPEB1-AA and endogenous CPEB1 at the synapse (Fig. 1D,E). Second, we did not detect any changes in gross cerebellar or PN development, but rather the structural and physiological changes were expressed at synapses. Third, there was no change in constitutive protein synthesis; however, the experience-induced increase in IRSp53 was blocked in the transgenic mice. Finally, the rapid decay of cerebellar depression seen in protein synthesis inhibitors suggests that local synthesis is required, and this time course is mimicked by mCPEB1-AA expression. Thus, we propose that the phenotype of the mCPEB1-AA mice is primarily the result of blocking CPEB1 function at the synapse.
Regulation of IRSp53 synthesis
The full complement of mRNAs regulated by CPEB1 in neurons is unknown. However, a recent study suggests that ∼7% of brain expressed mRNAs might undergo polyadenylation (Du and Richter, 2005). Given the potential diversity of mRNAs regulated by CPEB1, we selected a single candidate as proof of principle based on sequence analysis, its degree of conservation among species, and an established link to synaptic function. IRSp53 was thus selected and confirmed as a CPEB1-interacting mRNA (Fig. 5C). During training, IRSp53 protein synthesis is induced in control mice, but levels decrease in mCPEB1-AA mice (Fig. 7).
The reduction we observe in IRSp53 with training in transgenic mice argues for a shift in the dynamic equilibrium of protein synthesis versus degradation. In hippocampal neurons, strong synaptic activity results in an overall decrease in total protein synthesis but an increase in specific mRNA translation, most notably those that are transported into dendrites (Krichevsky and Kosik, 2001). In addition, Ehlers (2003) has described an upregulation of the ubiquitin proteasome system in response to synaptic activity, which leads to increased degradation of select synaptic proteins. Our results suggest that inhibiting CPEB1-mediated synthesis of IRSp53 reveals an activity-induced degradation of IRSp53 protein. IRSp53 was first described in the brain as a component of the postsynaptic density in hippocampus, cortex, and cerebellum (Abbott et al., 1999). There is ample evidence that IRSp53 plays an important role at the synapse. For example, synaptic activity drives IRSp53 into synapses, and altered expression of IRSp53 changes spine density and structure (Choi et al., 2005; Hori et al., 2005). However, because expression of mCPEB1-AA is likely to affect the synthesis of several mRNAs, the changes we see in mCPEB1-AA mice cannot be attributed solely to the dysregulation of IRSp53.
Phosphorylation of CPEB1
Both α-CaMKII and Aurora A kinase can phosphorylate and activate CPEB1 (Mendez et al., 2000b; Atkins et al., 2004). Our data support a role for Aurora A in CPEB1 phosphorylation in PNs. Both Aurora A and α-CaMKII are present in PNs, and the inhibition of either alters cerebellar LTD (Fig. 4) (Hansel et al., 2006). However, the inhibition of Aurora kinase by hesperadin or ZM447439 blocks LTD in WT mice but has no effect on the mice expressing mCPEB1-AA. In contrast, inhibition or knock-out of α-CaMKII results in a synaptic potentiation after LTD-inducing stimulation (Hansel et al., 2006). In addition, α-CaMKII mRNA translation is regulated by CPEB1 in the hippocampus and cortex (Wu et al., 1998; Wells et al., 2000), yet we see no change in the level of α-CaMKII in mCPEB1-AA mice compared with control in either the baseline state or after motor learning (M. McEvoy and D. G. Wells, unpublished observation). Therefore, Aurora A is likely to be the kinase that phosphorylates CPEB1 during the induction of cerebellar LTD. Consistent with a mechanism involving competition between mCPEB1-AA and endogenous CPEB1, mRNA translation of mRNAs that contain one CPE (e.g., IRSp53) appear to be affected more than mRNAs that contain two CPEs (e.g., α-CaMKII).
Relationship between morphology and function
Are the spine structural changes a consequence or cause of the attenuated LTD in the mutant mice? Based solely on our data, no conclusion can be drawn; however, recent data from Fmr1 null mice in combination with our data would suggest that the changes in structure are not directly related to a deficit in LTD. Fmr1 encodes the fragile X mental retardation protein (FMRP), another mRNA-binding protein thought to regulate mRNA translation in neuronal dendrites (Weiler et al., 1997; Bagni and Greenough, 2005). In the cerebral cortex of Fmr1 KO mice, like the mCPEB1-AA mice, there is an increase in spine number and an elongation of spines, without a change in baseline synaptic transmission (Li et al., 2002; Galvez et al., 2003). In the cerebellum, Koekkoek et al. (2005) report changes in PN spine shape in Fmr1 mice similar to the changes reported in cortex and those we report here for the mCPEB1-AA mice; however, the Fmr1 KO mice displayed an enhanced LTD. This suggests that the change in spine structure did not directly cause the inhibition of LTD in mCPEB1-AA mice. In addition, it suggests that CPEB1 and FMRP are regulating distinct subsets of mRNAs in PN dendrites with CPEB1-mediated translation responsible for the induction of LTD and FMRP-mediated translation limiting the amplitude of the depression.
Mice expressing mCPEB1-AA exhibit a significant ataxia. Because the ataxia is not debilitating, in fact unrecognizable until tested, and was not accompanied by any loss in strength, we were able to analyze motor learning. The nondebilitating ataxia is likely the result of normal developmental progression to monosynaptically connected CF–PN pairs (Aiba et al., 1994). This also supports our contention that signaling in the mutants is unaltered, because deficits in mGluR1 and PKCγ both result in multiple CF innervation and a much more severe ataxia (Aiba et al., 1994; Chen et al., 1995). Therefore, the ataxia in the mCPEB1-AA mice is likely the result of the impaired PF–PN synaptic plasticity.
Importantly, we show a deficit in both plasticity and behavior that correlates with the amount of mCPEB1-AA expression. Interestingly, the mCPEB1-AA mice did learn the motor task; in fact, the degree to which they improved over six trials was approximately equal to that of controls. However, they exhibited a delay in motor learning most markedly seen between trials 1 and 2 (Fig. 6A,B). Together, we feel that this data strongly argue for an important role for CPEB1-mediated protein synthesis in cerebellar plasticity and function.
Footnotes
This work was supported by National Institute of Mental Health Grant RO1 MH66274 (D.G.W.) and The Ellison Medical Foundation (D.G.W.). We thank Drs. J. Oberdick (The Ohio State University, Columbus, OH) and W. Zhong (Yale University, New Haven, CT) for the pL7ΔAUG construct, Dr. A. Hall (Memorial Sloan-Kettering Cancer Center, New York, NY) for the IRSp53 antibody, Dr. T. Kapoor (Rockefeller University, New York, NY) for the Aurora kinase inhibitor Hesperadin, and Dr. P. Rao, N. Papastathis, and G. Thomas for excellent technical assistance.
References
- Abbott M-A, Wells DG, Fallon JR. The insulin receptor tyrosine kinase substrate p58/53 and the insulin receptor are components of CNS synapses. J Neuorsci. 1999;19:7300–7308. doi: 10.1523/JNEUROSCI.19-17-07300.1999. [DOI] [PMC free article] [PubMed] [Google Scholar]
- Ahn S, Ginty DD, Linden DJ. A late phase of cerebellar long-term depression requires activation of CaMKIV and CREB. Neuron. 1999;23:559–568. doi: 10.1016/s0896-6273(00)80808-9. [DOI] [PubMed] [Google Scholar]
- Aiba A, Kano M, Chen C, Stanton ME, Fox GD, Herrup K, Zwingman TA, Tonegawa S. Deficient cerebellar long-term depression and impaired motor learning in mGluR1 mutant mice. Cell. 1994;79:377–388. [PubMed] [Google Scholar]
- Alarcon JM, Hodgman R, Theis M, Huang YS, Kandel ER, Richter JD. Selective modulation of some forms of schaffer collateral-CA1 synaptic plasticity in mice with a disruption of the CPEB-1 gene. Learn Mem. 2004;11:318–327. doi: 10.1101/lm.72704. [DOI] [PMC free article] [PubMed] [Google Scholar]
- Andrews PD. Aurora kinases: shining lights on the therapeutic horizon? Oncogene. 2005;24:5005–5015. doi: 10.1038/sj.onc.1208752. [DOI] [PubMed] [Google Scholar]
- Atkins CM, Nozaki N, Shigeri Y, Soderling TR. Cytoplasmic polyadenylation element binding protein-dependent protein synthesis is regulated by calcium/calmodulin-dependent protein kinase II. J Neurosci. 2004;24:5193–5201. doi: 10.1523/JNEUROSCI.0854-04.2004. [DOI] [PMC free article] [PubMed] [Google Scholar]
- Bagni C, Greenough WT. From mRNP trafficking to spine dysmorphogenesis: the roots of fragile X syndrome. Nat Rev Neurosci. 2005;6:376–387. doi: 10.1038/nrn1667. [DOI] [PubMed] [Google Scholar]
- Barski JJ, Hartmann J, Rose CR, Hoebeek F, Morl K, Noll-Hussong M, De Zeeuw CI, Konnerth A, Meyer M. Calbindin in cerebellar Purkinje cells is a critical determinant of the precision of motor coordination. J Neurosci. 2003;23:3469–3477. doi: 10.1523/JNEUROSCI.23-08-03469.2003. [DOI] [PMC free article] [PubMed] [Google Scholar]
- Berger-Sweeney J, Zearfoss NR, Richter JD. Reduced extinction of hippocampal-dependent memories in CPEB knockout mice. Learn Mem. 2006;13:4–7. doi: 10.1101/lm.73706. [DOI] [PubMed] [Google Scholar]
- Carter RJ, Lione LA, Humby T, Mangiarini L, Mahal A, Bates GP, Dunnett SB, Morton AJ. Characterization of progressive motor deficits in mice transgenic for the human Huntington's disease mutation. J Neurosci. 1999;19:3248–3257. doi: 10.1523/JNEUROSCI.19-08-03248.1999. [DOI] [PMC free article] [PubMed] [Google Scholar]
- Casadio A, Martin KC, Giustetto M, Zhu H, Chen M, Bartsch D, Bailey CH, Kandel ER. A transient, neuron-wide form of CREB-mediated long-term facilitation can be stabilized at specific synapses by local protein synthesis. Cell. 1999;99:221–237. doi: 10.1016/s0092-8674(00)81653-0. [DOI] [PubMed] [Google Scholar]
- Chen C, Kano M, Abeliovich A, Chen L, Bao S, Kim JJ, Hashimoto K, Thompson RF, Tonegawa S. Impaired motor coordination correlates with persistent multiple climbing fiber innervation in PKC gamma mutant mice. Cell. 1995;83:1233–1242. doi: 10.1016/0092-8674(95)90148-5. [DOI] [PubMed] [Google Scholar]
- Choi J, Ko J, Racz B, Burette A, Lee J-R, Kim S, Na M, Lee HW, Kim K, Weinberg RJ, Kim E. Regulation of dendritic spine morphogenesis by insulin receptor substrate 53, a downstream effector of Rac1 and Cdc42 small GTPases. J Neurosci. 2005;25:869–879. doi: 10.1523/JNEUROSCI.3212-04.2005. [DOI] [PMC free article] [PubMed] [Google Scholar]
- Crawley JN, Paylor R. A proposed test battery and constellations of specific behavioral paradigms to investigate the behavioral phenotypes of transgenic and knockout mice. Horm Behav. 1997;31:197–211. doi: 10.1006/hbeh.1997.1382. [DOI] [PubMed] [Google Scholar]
- Davis HP, Squire LR. Protein synthesis and memory: a review. Psychol Bull. 1984;96:518–559. [PubMed] [Google Scholar]
- de Moor CH, Richter JD. Cytoplasmic polyadenylation elements mediate masking and unmasking of cyclin B1 mRNA. EMBO J. 1999;18:2294–2303. doi: 10.1093/emboj/18.8.2294. [DOI] [PMC free article] [PubMed] [Google Scholar]
- Ditchfield C, Johnson VL, Tighe A, Ellston R, Haworth C, Johnson T, Mortlock A, Keen N, Taylor SS. Aurora B couples chromosome alignment with anaphase by targeting BubR1, Mad2, and Cenp-E to kinetochores. J Cell Biol. 2003;161:267–280. doi: 10.1083/jcb.200208091. [DOI] [PMC free article] [PubMed] [Google Scholar]
- Du L, Richter JD. Activity-dependent polyadenylation in neurons. RNA. 2005;11:1340–1347. doi: 10.1261/rna.2870505. [DOI] [PMC free article] [PubMed] [Google Scholar]
- Ehlers MD. Activity level controls postsynaptic composition and signaling via the ubiquitin-proteasome system. Nat Neurosci. 2003;6:231–242. doi: 10.1038/nn1013. [DOI] [PubMed] [Google Scholar]
- Galvez R, Gopal AR, Greenough WT. Somatosensory cortical barrel dendritic abnormalities in a mouse model of the fragile X mental retardation syndrome. Brain Res. 2003;971:83–89. doi: 10.1016/s0006-8993(03)02363-1. [DOI] [PubMed] [Google Scholar]
- Hansel C, de Jeu M, Belmeguenai A, Houtman SH, Buitendijk GH, Andreev D, De Zeeuw CI, Elgersma Y. alphaCaMKII Is essential for cerebellar LTD and motor learning. Neuron. 2006;51:835–843. doi: 10.1016/j.neuron.2006.08.013. [DOI] [PubMed] [Google Scholar]
- Hauf S, Cole RW, LaTerra S, Zimmer C, Schnapp G, Walter R, Heckel A, van Meel J, Rieder CL, Peters JM. The small molecule Hesperadin reveals a role for Aurora B in correcting kinetochore-microtubule attachment and in maintaining the spindle assembly checkpoint. J Cell Biol. 2003;161:281–294. doi: 10.1083/jcb.200208092. [DOI] [PMC free article] [PubMed] [Google Scholar]
- Hayashi Y, Majewska AK. Dendritic spine geometry: functional implication and regulation. Neuron. 2005;46:529–532. doi: 10.1016/j.neuron.2005.05.006. [DOI] [PubMed] [Google Scholar]
- Hori K, Yasuda H, Konno D, Maruoka H, Tsumoto T, Sobue K. NMDA receptor-dependent synaptic translocation of insulin receptor substrate p53 via protein kinase C signaling. J Neurosci. 2005;25:2670–2681. doi: 10.1523/JNEUROSCI.3638-04.2005. [DOI] [PMC free article] [PubMed] [Google Scholar]
- Huang YS, Jung M-Y, Sarkissian M, Richter JD. N-methyl-d-aspartate receptor signaling results in Aurora kinase-catalyzed CPEB phosphorylation and alpha CaMKII mRNA polyadenylation at synapses. EMBO J. 2002;21:2139–2148. doi: 10.1093/emboj/21.9.2139. [DOI] [PMC free article] [PubMed] [Google Scholar]
- Huang YS, Kan MC, Lin CL, Richter JD. CPEB3 and CPEB4 in neurons: analysis of RNA-binding specificity and translational control of AMPA receptor GluR2 mRNA. EMBO J. 2006;25:4865–4876. doi: 10.1038/sj.emboj.7601322. [DOI] [PMC free article] [PubMed] [Google Scholar]
- Huber KM, Kayser MS, Bear MF. Role for rapid dendritic protein synthesis in hippocampal mGluR-dependent long-term depression. Science. 2000;288:1254–1256. doi: 10.1126/science.288.5469.1254. [DOI] [PubMed] [Google Scholar]
- Ito M. Historical review of the significance of the cerebellum and the role of Purkinje cells in motor learning. Ann NY Acad Sci. 2002;978:273–288. doi: 10.1111/j.1749-6632.2002.tb07574.x. [DOI] [PubMed] [Google Scholar]
- Kang H, Schuman EM. A requirement for local protein synthesis in neurotrophin-induced hippocampal synaptic plasticity. Science. 1996;273:1402–1406. doi: 10.1126/science.273.5280.1402. [DOI] [PubMed] [Google Scholar]
- Kano M, Hashimoto K, Chen C, Abeliovich A, Aiba A, Kurihara H, Watanabe M, Inoue Y, Tonegawa S. Impaired synapse elimination during cerebellar development in PKC gamma mutant mice. Cell. 1995;83:1223–1231. doi: 10.1016/0092-8674(95)90147-7. [DOI] [PubMed] [Google Scholar]
- Karachot L, Shirai Y, Vigot R, Yamamori T, Ito M. Induction of long-term depression in cerebellar Purkinje cells requires a rapidly turned over protein. J Neurophysiol. 2001;86:280–289. doi: 10.1152/jn.2001.86.1.280. [DOI] [PubMed] [Google Scholar]
- Koekkoek SK, Yamaguchi K, Milojkovic BA, Dortland BR, Ruigrok TJ, Maex R, De Graaf W, Smit AE, VanderWerf F, Bakker CE, Willemsen R, Ikeda T, Kakizawa S, Onodera K, Nelson DL, Mientjes E, Joosten M, De Schutter E, Oostra BA, Ito M, De Zeeuw CI. Deletion of FMR1 in Purkinje cells enhances parallel fiber LTD, enlarges spines, and attenuates cerebellar eyelid conditioning in Fragile X syndrome. Neuron. 2005;47:339–352. doi: 10.1016/j.neuron.2005.07.005. [DOI] [PubMed] [Google Scholar]
- Konnerth A, Llano I, Armstrong C. Synaptic currents in cerebellar Purkinje cells. Proc Natl Acad Sci USA. 1990;87:2662–2665. doi: 10.1073/pnas.87.7.2662. [DOI] [PMC free article] [PubMed] [Google Scholar]
- Krichevsky AM, Kosik KS. Neuronal RNA granules: a link between RNA localization and stimulation-dependent translation. Neuron. 2001;32:683–696. doi: 10.1016/s0896-6273(01)00508-6. [DOI] [PubMed] [Google Scholar]
- Li J, Pelletier MR, Perez Velazquez JL, Carlen PL. Reduced cortical synaptic plasticity and GluR1 expression associated with fragile X mental retardation protein deficiency. Mol Cell Neurosci. 2002;19:138–151. doi: 10.1006/mcne.2001.1085. [DOI] [PubMed] [Google Scholar]
- Linden DJ. A protein synthesis-dependent late phase of cerebellar long-term depression. Neuron. 1996;17:483–490. doi: 10.1016/s0896-6273(00)80180-4. [DOI] [PubMed] [Google Scholar]
- Lustig DG, Herrick JL, Keifer J. Comparison of cortically and subcortically controlled motor systems: I. Morphology of intracellularly filled rubrospinal neurons in rat and turtle. J Comp Neurol. 1998;396:521–530. doi: 10.1002/(sici)1096-9861(19980713)396:4<521::aid-cne8>3.0.co;2-3. [DOI] [PubMed] [Google Scholar]
- Mariani J, Changeux JP. Ontogenesis of olivocerebellar relationships. I. Studies by intracellular recordings of the multiple innervation of Purkinje cells by climbing fibers in the developing rat cerebellum. J Neurosci. 1981;1:696–702. doi: 10.1523/JNEUROSCI.01-07-00696.1981. [DOI] [PMC free article] [PubMed] [Google Scholar]
- Martin KC, Casadio A, Zhu H, Y E, Rose JC, Chen M, Bailey CH, Kandel ER. Synapse-specific, long-term facilitation of Aplysia sensory to motor synapses: a function for local protein synthesis in memory storage. Cell. 1997;91:927–938. doi: 10.1016/s0092-8674(00)80484-5. [DOI] [PubMed] [Google Scholar]
- Martin KC, Barad M, Kandel ER. Local protein synthesis and its role in synapse-specific plasticity. Curr Opin Neurobiol. 2000;10:587–592. doi: 10.1016/s0959-4388(00)00128-8. [DOI] [PubMed] [Google Scholar]
- Mendez R, Richter JD. Translational control by CPEB: a means to the end. Nat Rev Mol Cell Biol. 2001;2:521–529. doi: 10.1038/35080081. [DOI] [PubMed] [Google Scholar]
- Mendez R, Murthy KG, Ryan K, Manley JL, Richter JD. Phosphorylation of CPEB by Eg2 mediates the recruitment of CPSF into an active cytoplasmic polyadenylation complex. Mol Cell. 2000a;6:1253–1259. doi: 10.1016/s1097-2765(00)00121-0. [DOI] [PubMed] [Google Scholar]
- Mendez R, Hake LE, Andresson T, Littlepage LE, Ruderman JV, Richter JD. Phosphorylation of CPE binding factor by Eg2 regulates translation of c-mos mRNA. Nature. 2000b;404:302–307. doi: 10.1038/35005126. [DOI] [PubMed] [Google Scholar]
- Nishiyama H, Linden DJ. Differential maturation of climbing fiber innervation in cerebellar vermis. J Neurosci. 2004;24:3926–3932. doi: 10.1523/JNEUROSCI.5610-03.2004. [DOI] [PMC free article] [PubMed] [Google Scholar]
- Oberdick J, Smeyne RJ, Mann JR, Zackson S, Morgan JI. A promoter that drives transgene expression in cerebellar Purkinje and retinal bipolar neurons. Science. 1990;248:223–226. doi: 10.1126/science.2109351. [DOI] [PubMed] [Google Scholar]
- Ribar TJ, Rodriguiz RM, Khiroug L, Wetsel WC, Augustine GJ, Means AR. Cerebellar defects in Ca2+/calmodulin kinase IV-deficient mice. J Neurosci. 2000;20:RC107(1–5). doi: 10.1523/JNEUROSCI.20-22-j0004.2000. [DOI] [PMC free article] [PubMed] [Google Scholar]
- Rogers DC, Fisher EM, Brown SD, Peters J, Hunter AJ, Martin JE. Behavioral and functional analysis of mouse phenotype: SHIRPA, a proposed protocol for comprehensive phenotype assessment. Mamm Genome. 1997;8:711–713. doi: 10.1007/s003359900551. [DOI] [PubMed] [Google Scholar]
- Sekerkova G, Loomis PA, Changyaleket B, Zheng L, Eytan R, Chen B, Mugnaini E, Bartles JR. Novel espin actin-bundling proteins are localized to Purkinje cell dendritic spines and bind the Src homology 3 adapter protein insulin receptor substrate p53. J Neurosci. 2003;23:1310–1319. doi: 10.1523/JNEUROSCI.23-04-01310.2003. [DOI] [PMC free article] [PubMed] [Google Scholar]
- Shin CY, Kundel M, Wells DG. Rapid, activity-induced increase in tissue plasminogen activator is mediated by metabotropic glutamate receptor-dependent mRNA translation. J Neurosci. 2004;24:9425–9433. doi: 10.1523/JNEUROSCI.2457-04.2004. [DOI] [PMC free article] [PubMed] [Google Scholar]
- Smeyne RJ, Chu T, Lewin A, Bian F, Crisman SS, Kunsch c, Lira SA, Oberdick J. Local control of granule cell generation by cerebellar Purkinje cells. Mol Cell Neurosci. 1995;6:230–251. doi: 10.1006/mcne.1995.1019. [DOI] [PubMed] [Google Scholar]
- Steward O, Schuman EM. Protein synthesis at synaptic sites on dendrites. Annu Rev Neurosci. 2001;24:299–325. doi: 10.1146/annurev.neuro.24.1.299. [DOI] [PubMed] [Google Scholar]
- Thomas EA, Foye PE, Alvarez CE, Usui H, Sutcliffe JG. Insulin receptor substrate protein p53 localization in rats suggests mechanism for specific polyglutamine neurodegeneration. Neurosci Lett. 2001;309:145–148. doi: 10.1016/s0304-3940(01)02064-x. [DOI] [PubMed] [Google Scholar]
- Weiler IJ, Irwin SA, Klintsova AY, Spencer CM, Brazelton AD, Miyashiro K, Comery TA, Patel B, Eberwine J, Greenough WT. Fragile X mental retardation protein is translated near synapses in response to neurotransmitter activation. Proc Natl Acad Sci USA. 1997;94:5395–5400. doi: 10.1073/pnas.94.10.5395. [DOI] [PMC free article] [PubMed] [Google Scholar]
- Wells DG. RNA-binding proteins: a lesson in repression. J Neurosci. 2006;26:7135–7138. doi: 10.1523/JNEUROSCI.1795-06.2006. [DOI] [PMC free article] [PubMed] [Google Scholar]
- Wells DG, Richter JD, Fallon JR. Molecular mechanisms for activity-regulated protein synthesis in the synapto-dendritic compartment. Curr Opin Neurobiol. 2000;10:132–137. doi: 10.1016/s0959-4388(99)00050-1. [DOI] [PubMed] [Google Scholar]
- Wells DG, Dong X, Quinlan EM, Huang YS, Bear MF, Richter JD, Fallon JR. A role for the cytoplasmic polyadenylation element in NMDA receptor-regulated mRNA translation in neurons. J Neurosci. 2001;21:9541–9548. doi: 10.1523/JNEUROSCI.21-24-09541.2001. [DOI] [PMC free article] [PubMed] [Google Scholar]
- Wu L, Wells D, Tay J, Mendis D, Abbott MA, Barnitt A, Quinlan E, Heynen A, Fallon JR, Richter JD. CPEB-mediated cytoplasmic polyadenylation and the regulation of experience-dependent translation of alpha-CaMKII mRNA at synapses. Neuron. 1998;21:1129–1139. doi: 10.1016/s0896-6273(00)80630-3. [DOI] [PubMed] [Google Scholar]