

Abstract
Primary auditory cortex plays a crucial role in spatially directed behavior, but little is known about the effect of behavioral state on the neural representation of spatial cues. Macaques were trained to discriminate binaural cues to sound localization, eventually allowing measurement of thresholds comparable to human hearing. During behavior and passive listening, single units in low-frequency auditory cortex showed robust and consistent tuning to interaural phase difference (IPD). In most neurons, behavior exerted an effect on peak discharge rate (58% increased, 13% decreased), but this was not accompanied by a detectable shift in the best IPD of any cell. Neurometric analysis revealed a difference in discriminability between the behaving and passive condition in half of the sample (52%), but steepening of the neurometric function (29%) was only slightly more common than flattening (23%). This suggests that performance of a discrimination task does not necessarily confer an advantage in understanding the representation of the spatial cue in primary auditory cortex but nevertheless revealed some physiological effects. These results suggest that responses observed during passive listening provide a valid representation of neuronal response properties in core auditory cortex.
Keywords: interaural, phase, binaural, hearing, primate, psychophysics
Introduction
Auditory cortex is crucial to sound-directed behavior, including localizing and orienting to a sound in the environment (Heffner and Heffner, 1990; Malhotra et al., 2004). The origin of a sound on the azimuth generates two binaural cues that are used by the auditory system: an interaural level difference (ILD) and an interaural time difference (ITD). Tuning for these cues is first established in the auditory brainstem and transformed in the ascent to the cortex (Goldberg and Brown, 1968; Imig and Adrian, 1977; Fitzpatrick et al., 1997). In human patients, bilateral injury to the temporal lobes (including the primary auditory cortex and rostral areas) abolished the ability to use ITD but caused only a doubling of the threshold for detecting ILD (Yamada et al., 1996), suggesting that the auditory cortex uses both spatial cues but is indispensable for the perception of time delay. Macaque monkeys with selective lesions of auditory cortex can discriminate ILD and ITD cues, yet cannot localize sounds in space when required to approach their source (Heffner and Masterton, 1975; Heffner and Heffner, 1990). The link between auditory cortex and spatially directed behavior raises the issue of what information is represented at the level of the primary auditory cortex and how best to investigate that representation.
Most physiological data in the auditory cortex have been collected from animals under anesthesia, which offers the advantage of stable recordings at the cost of depressed or altered responsiveness (Zurita et al., 1994; Cheung et al., 2001; Gaese and Ostwald, 2001). Thus, the awake preparation offers an advantage independent of any task that may be imposed but raises the issue of how behavioral control should be achieved. In contrast to vision, in which fixation is required to maintain the image on the retina, stimulus control in an auditory experiment can be achieved without engaging the animal in an explicit behavioral task. Training primates to perform auditory discriminations is notoriously difficult and time consuming, and the stimuli that can be used may be limited to those on which the animals have been trained. These issues could be sidestepped by presenting sounds during passive listening, but the extent to which active discrimination influences the representation of acoustic parameters in auditory cortex remains unknown.
This study will consider the effects of behavior on physiological recordings from the core auditory cortex of awake macaques. An emerging model of spatial hearing proposes that azimuthal location is encoded by the slopes of the functions relating neural discharge rate to ITD (Skottun et al., 2001; McAlpine et al., 2001). The shape of this ITD tuning function determines how precisely a neuron can represent a shift in sound laterality. Active discrimination of ITD may engage a mechanism to refine the neural representation of the cue, by steepening or shifting the ITD tuning function of individual neurons. By alternating between passive listening and active discrimination of sound laterality, we were able to address whether engagement in a stimulus-related task significantly alters neuronal responsiveness or tuning up to the level of primary auditory cortex.
Materials and Methods
Subjects and psychophysical testing procedure.
Two male rhesus monkeys (Macaca mulatta, 6–10 kg, designated X and Z) were trained to discriminate interaural cues. All procedures were in accordance with the Society for Neuroscience guiding principles on the care and use of animals and were approved by the Institutional Animal Care and Use Committee of New York University. In daily sessions, animals sat in a Plexiglas chair (Crist Instrument Company, Hagerstown, MD) in a double-walled anechoic room (IAC, Bronx NY) with their heads immobilized by a surgically implanted head-holder. Animals were monitored on closed-circuit video. Speakers coupled to ear inserts were positioned within the ear canal for delivery of effectively closed-field stimuli, although the ear was not fully sealed from outside environmental (or self-produced) sounds.
Thresholds for ILD and interaural phase difference (IPD) discrimination were tested using the method of constant stimuli and a two-alternative forced-choice (2AFC) procedure. The animal initiated a trial by pressing and holding the center button of a three-button array for the duration of the stimulus (plus an additional 300 ms wait time), then pressed one of the flanking buttons on the left or right to indicate the laterality of the sound (Fig. 1A). Correct responses were reinforced by liquid reward with variable valve-open times (50 ms, doubling with each sequential correct response up to 800 ms); an incorrect response resulted in a timeout (2000 ms, also doubling with sequential incorrect responses up to 8000 ms) and a resetting of the reward amount to 50 ms. These multiplying rewards and timeouts were effective in motivating the animals to perform consistently.
Figure 1.
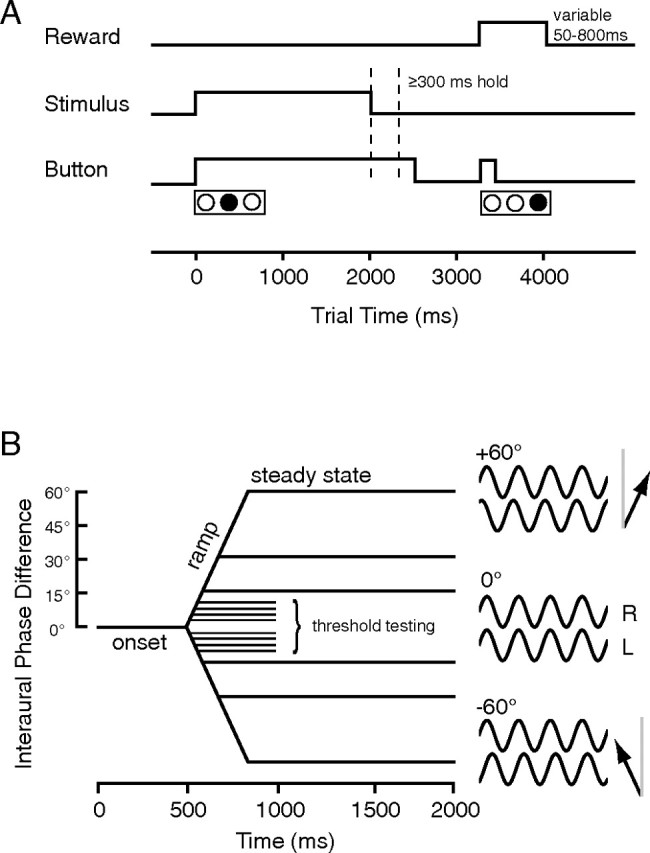
Macaques discriminated the direction of IPD shifts away from midline. A, The animal initiated a behaving trial by pressing and holding the center of three buttons (bottom trace). The button was held through the duration of the sound (middle trace) plus a 300 ms hold time, after which he could release the center button and press the right or left button to indicate the direction of IPD shift. Correct responses earned a liquid reward of varying size (top trace; see Materials and Methods). B, Pure-tone dynamic IPD stimuli originated at 0° IPD (0–500 ms), then linearly ramped to a second steady-state IPD [≤60° phase lead at left (L) or right (R) ear]. A restricted range (±15°) near the midline was used for threshold determination, and a wider range (±60°) and longer steady state were used during physiological behaving/passive comparisons. Arrows on the right depict the apparent direction of origin on the horizon (25° relative to gray midline) of a 1000 Hz tone leading in phase by 60° at the right ear (top icon) or left ear (bottom icon).
The first cue used to train the monkeys on lateralization was ILD, initially presented as an 80 or 90 dB sound pressure level (SPL) tone to one ear. Tones to the left or right ear were presented in blocks, and the size of those blocks decremented until the side of origin was pseudo-randomized. An unfortunate side effect of block training was that the animals determined the correct button by trial and error, then adopted a “win–stay/lose–shift” strategy that allowed them to earn sufficient reward without using the auditory cue. This became less effective at small block size, but the behavior persisted. We modified our software to render this strategy ineffective, eventually leading the animals to adopt the auditory cue.
Once the monkeys performed reliably at 80 versus 0 dB SPL, the level in the other ear was incremented until threshold was determined. A block typically spanned 2–20 dB SPL of ILD in semilog steps, with the range adjusted so that the percentage correct ranged from chance to nearly 100%. Tones were 2000 ms in duration, and carrier frequency was held constant within blocks (0.5–10 kHz tested). Once this task was acquired, a “dynamic” variant was introduced in which the tone came on at 0 ILD (apparently centered at the midline) for 1000 ms, shifted by a linear ramp of intensity at the left or right ear, and remained at this second steady-state ILD for the remainder of the 2000 ms tone. Thresholds were not determined by this method; instead it served primarily as a training exercise for the generalization of the task to ITD.
In the specific case of an ITD applied to a periodic tone, the resulting waveforms will be out of phase at the two ears, producing an IPD. Once both animals acquired the lateralization task for ILD, they were trained to perform the same task on the basis of IPD, which produces a comparable perception of laterality within the head. Figure 1B is a schematic depiction of the stimuli used. Each tone was initially diotic (IPD, 0°; SPL, 80 dB; apparently at midline) for 500 ms, then linearly ramped at the left ear to a phase lead or lag (90° during training; decremented to 15, 10, 7.5, 5, and 2.5° for threshold determination) at 180°/s, and held constant at this IPD for the remainder of the 1000 ms tone (417–486 ms, depending on depth of the phase shift). Animals were also trained using 1000 ms static tones at the same IPD values. Whether IPD was static or dynamic, the left and right tones were gated on simultaneously with a 10 ms cosine-squared ramp, so onset delay was not a cue to lateralization. Carrier frequency was held constant within blocks but varied to cover the full range over which the animals were able and willing to perform the task (∼0.25–2.5 kHz; see Results). Sensitivity for IPD in human listeners appears to peak around 90 dB SPL (Zwislocki and Feldman, 1956), suggesting the level used here (80 dB SPL) may be nearly optimal for threshold determination in macaques. All stimuli were selected and presented using the MALab system (Kaiser Instruments) (see below), which also recorded behavioral responses (left, right, or no response). The percentage correct at each ILD or IPD was folded across the left and right directions, plotted, and fit with a spline curve (λ = 10; JMP software; SAS Institute, Cary, NC), from which the threshold was determined as the IPD at 76% correct [corresponding to d′ = 1 in a 2AFC task (Green and Swets, 1966)].
Physiology and stimulus generation.
For physiological recording, the animal was positioned as for psychophysics (above), and a stepping microdrive (California Institute of Technology, Pasadena, CA) was placed on the recording cylinder under aseptic conditions to allow a vertical approach to the superior temporal plane (Pfingst and O'Connor, 1980). A guide tube was used to pierce the dura mater and allow vertical penetration of the parietal cortex by resin-coated tungsten microelectrodes (10–12 MΩ; FHC, Bowdoin, ME). The signal was amplified (variable gain), filtered (typically 0.3–10 kHz), and fed into the MALab event processor interfaced with a Macintosh computer. Spikes from single neurons were discriminated by setting individual voltage/time windows, and waveforms were monitored for consistency throughout the recording; spike times were logged at a precision of 1 μs, and responses were displayed on-line.
Stimulus generation was controlled by the MALab software, which drives a dedicated hardware synthesizer that feeds the left and right signals to a Stax amplifier and, in turn, to electrostatic speakers (Stax Lambda in Custom Sound Systems housings) coupled to custom-made ear inserts. Each channel was calibrated for level (dB re: 20 μPa, from 50 to 30,000 Hz) and phase (from 50 to 3000 Hz) at the beginning of every session using a probe microphone (0.5 inch, 4133; Brüel and Kjær, Nærum, Denmark) positioned within the ear canal.
Entry into auditory cortex was typically preceded by a gap in physiological activity believed to correspond to passage through the lateral sulcus. Single units were isolated throughout the cortical depth, and although electrode tracks were not individually reconstructed, the bulk of recordings appeared to be from the middle to deep cortical layers. Histology in both animals, and postmortem magnetic resonance imaging in animal X, confirmed the recording locations to be within core auditory cortex: the primary auditory cortex (AI) and the rostral field (R). In both animals, assignment of recording locations to cortical fields is based on physiological criteria, in particular the reversal of the tonotopic gradient at the border of AI and R and the degradation in efficacy of pure-tone stimuli at the border of core and belt (Rauschecker et al., 1995; Kosaki et al., 1997; Recanzone et al., 2000a; Scott, 2004).
Comparing behaving and passive firing rates.
When a responsive cell was isolated, best frequency and level were determined using pure tones. The prevalence of nonmonotonic tuning to SPL, and a general dearth of clear tuning to ILD, suggested that the better task for studying the effect of behavior was IPD lateralization. Phase sensitivity was initially assessed by binaural beats, an ongoing modulation of interaural phase produced by presenting two tones of slightly different frequency to the two ears. Cells that synchronized their discharge to the resultant beat were candidates for recording during psychophysical discrimination.
The parameters of the task were similar to the dynamic IPD threshold discrimination described above, with certain modifications: trials were lengthened to 4000 ms, and stimuli were lengthened to 2000 ms: a 500 ms 0° steady state; a ramp of ±15°, ±30°, or ± 60°; and a second steady state at that IPD for the remainder of the 2000 ms (Fig. 1B). Tones were 70 dB SPL at the optimal carrier frequency for the cell, as measured by spike rate and synchrony in response to the binaural beat. The interstimulus interval was a minimum of 2000 ms but was variable because each trial was initiated by the animal. The randomized phase excursions were chosen to be greater in magnitude than those used for threshold testing, to increase the chance that the stimulus would fall somewhere in the preferred range of IPD of the cell (the phases used were standard across the recorded population, because animals were trained to discriminate about the midline and the IPD range could not be tailored to each cell). After a sufficient number of trials (15–25 per IPD value), the task was stopped, and the animal was allowed to sit until he stopped attempting to initiate trials. Then, the equivalent number of stimuli was presented in blocks as the animal sat passively (stimulus order: +15, −15, +60, −60, −30, +30°). In pilot experiments, some cells were tested using only two IPD values, ±90°.
Spike rates in response to the IPD stimulus were measured in three 500 ms epochs of the trial (see Fig. 3, shaded regions): the first 500 ms at 0° IPD, the second 500 ms including the linear ramp of IPD, and the third 500 ms as a sample of the steady-state response to the shifted IPD. After the offset of the stimulus at 2000 ms, the spontaneous discharge rate was measured over the last 500 ms (3500–4000 ms) of the 4000 ms trial. Tuning curves for IPD were constructed from the steady-state epochs of the response. Spike rates, and the variance in spike rate, were compared between behaving and passive conditions using nonparametric statistics [Kolmogorov–Smirnov (K-S) and Levine tests, respectively; Matlab; MathWorks, Natick, MA].
Figure 3.

A single-unit response to dynamic IPD under behaving and passive conditions shows consistent sensitivity to IPD and a higher discharge rate during behavior. Peristimulus time histograms (20 ms bins) are overlaid on raster plots of spike times on individual trials. Behaving (left) and passive (middle) data are arrayed from negative/ipsilateral phase shifts (top) to positive/contralateral phase shifts (bottom). Right panels plot the difference in histogram bin values (behaving–passive); positive bins indicate more spikes during behavior. The icon overlaid in the top left panel (−60°, behaving) shows the time course of the stimulus >0–2 s. Vertical gray regions mark the four 500 ms epochs of the response over which firing rates were measured: 0° IPD onset, dynamic IPD ramp, steady state, and a measure of spontaneous (Spon) rate at the end of the trial.
Neurometric analysis.
To determine whether the contrast in neural spike rate between IPD values was enhanced during discrimination, a receiver operating characteristic (ROC) analysis was performed. The ROC quantifies the accuracy of discrimination by modeling the decision the animal must make, on the basis of the discharge rates evoked in a single neuron. This form of “neurometric” analysis compares the distributions of spike rates in response to two stimuli that are to be discriminated, one of which is treated as a signal and the other as noise (Britten et al., 1996; Skottun et al., 2001). All firing rates in response to the 0° IPD onset epoch were pooled as the noise distribution (one rate per trial), for comparison with the distributions of rates elicited by the six steady-state IPD values. An ROC curve for a given IPD is constructed by comparing the distribution of firing rates during the steady state (1000–1500 ms) and onset (0–500 ms) at a series of 100 criterion values spanning the full range of both distributions. At each criterion, the proportion of firing rates in the steady-state distribution that exceeds the criterion is plotted against the proportion of firing rates in the 0° IPD distribution that exceeds the criterion. If the two distributions were identical, this curve would trace the line of identity on unit axes (see Fig. 7A, diagonal), and the two stimuli would be indistinguishable. If the signal distribution has a median value greater than that of the noise, these points will trace a curve above the diagonal (see Fig. 7A, dashed line, +15°), whereas a distribution of rates lower than the noise traces a curve below the diagonal (see Fig. 7A, −15). This comparison was made for each IPD value under the behaving and passive conditions (see Fig. 7A,B).
Figure 7.

ROC analysis reveals comparable neural tuning to IPD between behavioral conditions. A–C, ROC curves at each IPD value under behaving (A) and passive (B) conditions are integrated to generate the sigmoid neurometric functions in C (same neuron as depicted in Figs. 3 and 4). Curves in C are fit with two-parameter Weibull distributions; the difference in slope between behaving (black curve) and passive (gray curve) conditions was significant by a bootstrap simulation. D, Function slopes are compared between conditions (overall difference for the population: p = 0.77, Wilcoxon sign-rank). Filled circles, differences in slope significant (p < 0.05) by bootstrap simulation; open circles, p ≥ 0.05; open triangles, difference is significant by a linear fit only. The gray arrow marks the neuron from C. non-sig, Nonsignificant; sig, significant.
Integrating the area under the ROC curve yields the probability that a given signal (steady-state IPD) will elicit a firing rate greater than the noise (0° IPD). This value quantifies the difference between the firing rates in the two epochs of the trial, suggesting how well the shift in IPD can be discriminated based on the firing of this neuron. The measurement is analogous to d′ in signal detection theory, although without the underlying assumption that firing rates are normally distributed (Green and Swets, 1966). The set of points generated by integrating under the ROC curve at each IPD value defines the neurometric function under each condition (see Fig. 7C). Neurometric functions were fit with cumulative Weibull distributions using two free parameters, midpoint (α) and slope (β): y = 1 − e(−x/α)^β, where x is steady-state IPD and y is the integral under the ROC curve. For neurons tuned to ipsilateral space, functions were reversed on the IPD axis (so as to be ascending) before fitting with the cumulative function.
To estimate the significance of a given difference in slope between neurometric functions measured under behaving and passive conditions, a bootstrap simulation was applied to each neuron to estimate the probability that the observed difference occurred by chance. Firing rates under both conditions were pooled, and a neurometric function was constructed by randomly sampling with replacement from the pooled set of “noise” (0° IPD) and each of the six “signal” IPD values, without regard to whether they were collected during behavior or passive listening. The number of trials matched the average number used in the true behaving/passive comparison. This randomly assembled neurometric function was fit as described above, and the process was repeated on 100 of these randomly assembled functions to generate a set of 100 fitted parameters. All possible differences in slope (β) and midpoint (α) were computed (4950 pairs), and from this distribution, the p value of the true slope difference was estimated as the proportion of slope differences in the bootstrap distribution that was greater than the actual measured difference between the behaving and passive neurometric functions.
Because some neurometric functions appeared more linear than sigmoid in shape, a linear fit approach (y = mx + b) was used as well as the Weibull distribution to confirm that a possibly significant change in function shape was not missed because of a poor choice of model. The slope parameter m was treated as comparable to β for the purposes of the bootstrap procedure.
Comparing correct and error trials.
To examine the relationship between neural activity and trial outcome on a cell-by-cell basis, a bootstrap simulation was applied similar to that used in the behaving/passive comparison. Error trials were designated as those on which the animal responded incorrectly or withheld response. The animals made few errors, except at the smallest (15°) IPD shifts. The ROC curve was computed for the +15 and −15° stimulus, based on firing rates in the 0–500 ms onset epoch as noise and the 1000–1500 ms steady-state epoch as signal; integrating under these curves yields a two-point neurometric function (equivalent to the middle two points on the neurometric functions in Fig. 7C). The difference between them was taken as the measure of neural discriminability (effectively the same as the slope between the points) and computed separately for correct and error trials. This measures the difference in neural discriminability between the two trial outcomes but does not reveal whether that difference is statistically significant. For the bootstrap simulation, all trials for a given neuron were pooled together, and “correct” and “error” trials were drawn at random (i.e., without regard to real trial outcome); the number of trials drawn for each condition matched the actual number of correct and error trials for that neuron. For 1000 iterations, the difference between “conditions” (as measured by ROC) was computed from these randomly drawn trials. The p value of the ROC difference between correct and error trials was defined as the proportion of values in the simulated distribution greater than the actual measured difference.
Results
Strong, sustained responses could be elicited from units in awake auditory cortex when stimuli were optimized for frequency, level, and binaural phase (Malone et al., 2002; Wang et al., 2005). Non-monotonic tuning to sound level predominated, with only 34% of rate-level functions being monotonic or saturating up to 80 dB SPL [consistent with Recanzone et al. (2000a)]. In a broad survey of the core fields, 466 neurons were tested with best-frequency tones presented to each ear individually and binaurally. The majority of units were excited by stimulation of either ear (61%), with 24% excited monaurally and only 11% excited by one ear and suppressed by the other (Goldberg and Brown, 1968). This third class of “excitatory/inhibitory” interactions was rare and was found predominantly in neurons with high best frequencies (of these 52 neurons, 67% had best frequencies >16 kHz and only 10% <1 kHz).
Robust tuning to IPD in low-frequency neurons of AI and R identified IPD discrimination as an appropriate behavior for the comparison of physiological data under behaving and passive listening conditions. A total of 268 single neurons synchronized their discharges to a continuous modulation of IPD (binaural beat), 49% of the total population of cells with best frequencies <2500 Hz. Initial pilot studies on 12 neurons compared responses during active lateralization and passive listening at only two phase values, ±90°. Subsequently, six-point tuning functions were analyzed in 31 single units (of 69 recorded during behavior), chosen for their sensitivity to IPD when tested with binaural beats, stable isolation during recording, and a sufficient number of behaving trials with adequate performance from the animal (median, 90% correct). Subsequent assignment of the cells to cortical fields revealed 25 of the cells to be from AI and 6 from R.
Psychophysical discrimination of ILD and IPD
After extensive training, both animals learned to lateralize ILD across a range of carrier frequencies. At 1000 Hz, discrepancies of >5 dB (80 dB in one ear vs <75 dB in the other) were sufficient to allow performance of 95% correct or better, and performance degraded as the ILD diminished. Across frequency, thresholds generally fell between 2 and 3 dB (Fig. 2A). Monkey Z was tested at ILDs relative to 90 dB, whereas monkey X was trained relative to 80 dB, but this produced no difference in their measured thresholds at 1000 and 2000 Hz. Because IPD was found to be the more effective stimulus for cortical neurons, animal X was moved to IPD training before the full range of ILD thresholds was measured.
Figure 2.
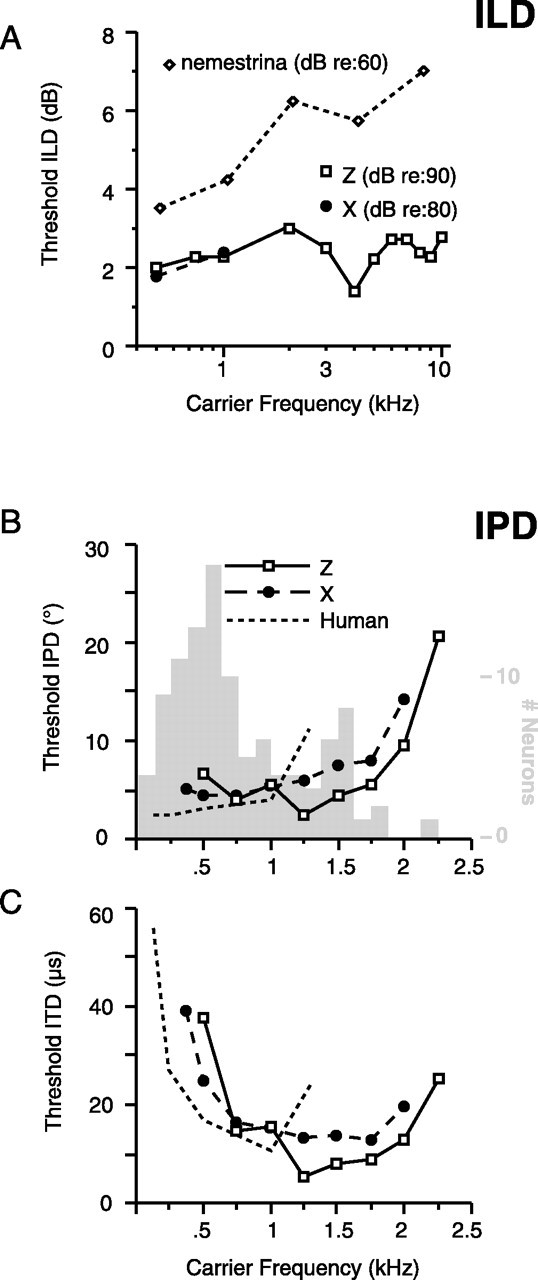
Psychophysical discrimination thresholds for binaural spatial cues. A, ILD thresholds across carrier frequency. Open squares, monkey Z; filled circles, monkey X; open diamonds, Macaca nemestrina (Houben and Gourevitch, 1979). Base SPL was 90 or 80 dB (monkey Z and X, respectively). B, Thresholds for IPD discrimination across carrier frequency in both monkeys; the dashed line traces comparable thresholds determined in humans by Klump and Eady (1965). The gray histogram shows distribution of best frequencies for all IPD-sensitive neurons (as determined by binaural beats, n = 268) on the same frequency axis. Thresholds are higher for carriers >1.5 kHz, the frequency range in which fewer neurons are sensitive to IPD. C, Same thresholds replotted as ITDs (in microseconds).
Both animals subsequently were trained to discriminate static and dynamic IPD (see Materials and Methods) from 500 to 2000 Hz. Animal X could perform down to 375 Hz, and animal Z could perform up to 2250 Hz (outside this range, the animals required extremely large phase excursions or refused to work altogether). At low carrier frequencies, 76% correct directional discrimination can be achieved with IPD excursions as small as 5° (Fig. 2B, dynamic IPD data shown). As a reference, at 1000 Hz, an IPD of 5° produces an ITD of 14 μs, corresponding to an audible angle of just 2° from midline. Threshold rises with increasing carrier frequency for both animals, because a fixed phase difference at higher frequencies represents a progressively shorter time delay. When the same thresholds are replotted in terms of ITD (Fig. 2C), thresholds for both animals reach a minimum between 1250 and 1750 Hz (6 and 13 μs in Z and X, respectively).
Comparable data from human observers (Klump and Eady, 1956) show that macaques are not quite equivalent to humans in discriminating IPD at low frequencies but are superior to humans at carriers >1000 Hz (Fig. 2B,C, dashed line). This frequency span for behavioral acumen in macaques overlaps the distribution of best frequencies for the population of IPD-sensitive neurons (Fig. 2B, gray histogram) and provides assurance that the animals were capable of discriminating the cue over the range of carrier frequencies used during physiological recording.
Effects of behavioral context on neural responses to IPD
The most common effect of behavioral state on neural responses to IPD is exemplified by the cell in Figure 3: consistent tuning to IPD under both conditions, with an overall increase in discharge rate during behavior. Responses on the left were collected as the animal performed the randomized IPD lateralization task, and those on the right were collected in blocks after the animal ceased behaving and sat passively. The cell gives a sustained response to the onset of the tone at 0° IPD, followed by a decrease or increase in firing rate in response to modulation in the negative or positive direction, respectively (by convention, positive phase shifts simulate motion toward the side contralateral to the recorded hemisphere). The icon overlaid on the topmost behaving panel shows the time course of the stimulus (0–2 s). The responses collected under the passive condition, at right, show the same stimulus effects with fewer overall spikes, which is particularly noticeable in the interstimulus interval (2–4 s).
These spikes are binned into peristimulus time histograms overlaid on the spike time rasters of Figure 3. The far right set of histograms plots the difference in bin counts between the two conditions, such that positive values indicate a higher spike count during behavior. Mean firing rates and SDs are plotted across IPD for each epoch in Figure 4(behaving in black, passive in gray). Responses to the 0° IPD onset (Fig. 4A) indicate that overall excitability during the behaving trials is higher than that seen during passive trials. Because the passive condition was a blocked presentation, at −60 and −30°, the response at onset was apparently influenced by a preceding strongly suppressive steady-state period. Despite a 2 s interval between each stimulus, the onset response is stronger in these trials than in those in which the steady-state response is excitatory, suggesting an adaptive mechanism operating over a relatively long time scale (the effect of which may be averaged out when data are collected in a randomized order) (Malone et al., 2002; Ulanovsky et al., 2004). Figure 4, B and C, shows tuning to IPD measured during the dynamic and steady-state epochs of the stimulus, with a clear tuning to the contralateral side peaking at +30°. The excitatory response is augmented under the behaving condition (K-S test, p = 0.003); because the response to ipsilateral IPDs is suppressed down to zero, this effectively enhances the dynamic range of the firing rate of the cell. Spontaneous activity (Fig. 4D) is constant regardless of the preceding IPD value but consistently higher during behavior (K-S test, p < 0.0001) (Fig. 4D).
Figure 4.

Firing rate tuning to IPD was similar under behaving and passive conditions (same neuron as depicted in Fig. 3). Mean firing rates (error bars indicate ±1 SD) during the four stimulus epochs defined in Figure 3, under behaving (black) and passive (gray) conditions. A, 0° IPD onset. B, Dynamic IPD ramp. C, Steady-state IPD. D, Spontaneous (spon) rate.
Tuning for IPD during the steady-state epoch is shown for four additional neurons in Figure 5(each panel is comparable to Fig. 4C). As in the example cell already discussed, contralateral tuning and a slight but consistent elevation in discharge rate during behavior was the most common finding (Fig. 5A) (see population statistics below). A minority of cells was tuned to ipsilateral phase excursions (Fig. 5B) or showed higher firing rates in the passive state (Fig. 5C). Other cells, like that in Fig. 5D, showed no reliable effect of behavioral context. In all of these panels, the difference in firing rate between conditions is small relative to the SD (plotted as error bars).
Figure 5.

A–D, Examples of tuning to IPD during the steady state in four neurons, under behaving (black) and passive (gray) conditions. Error bars indicate ±1 SD.
The median and variance of firing rates measured under the two conditions were compared, for both spontaneous activity and driven rate (steady-state firing rate at the peak IPD). Of 31 cells, 18 (58%) showed a statistically significant increase in driven firing rate during behavior, and 4 (13%) showed a significant decrease (K-S test, p < 0.05). Variance of the driven spike rate increased during behavior in seven (23%) units and decreased in three (10%) units (Levine test, p < 0.05), but an effect on driven rate did not predict an effect on variance (ANOVA, p > 0.18). The spontaneous rate was significantly (K-S test, p < 0.05) elevated in 22 units (71%) and decreased in 2 (6%) units; variance was increased in 15 units (48%) and decreased in 4 (13%) units (Levine test, p < 0.05). The effect on rate did predict increased variance for the spontaneous measure (ANOVA, p = 0.005), most likely because spontaneous rates often lie near zero, so an increase in the median will increase the spread of the spike rate distribution. When the ratio of the firing rate at the peak IPD under the two conditions was regressed against percentage correct, there was no correlation between strength of enhancement and performance (ANOVA, p = 0.78).
Whatever the changes in response amplitude, behavioral state was never found to shift the tuning of the cell as measured by peak firing rate. Tuning to IPD contralateral to the recorded hemisphere was prevalent (22 of 31 cells, 71%), but several cells were tuned to ipsilateral IPD (7 of 31, 23%). One unit had a response minimum at 0° with symmetrical responses about the midline, and another displayed no clear selectivity for IPD during the behavioral test despite responding to binaural beats. The peaks of the behaving and passive tuning curves differed in 8 of the 31 cells, but in all cases, the peaks were adjacent tested points, and in none of these cases were the spike rates at the neighboring IPD values significantly different (K-S test, p > 0.05). Note that the IPD stimuli used in the comparison only covered a range of ±60° about midline; the true best IPD may lie outside this range.
To examine the trend in the population, firing rate pairs for all IPDs presented under the two conditions are plotted in Figure 6 for each epoch of the trial. (Including early data with only two IPDs tested per cell, there are 43 cells pooled: 12 contributing two points each and 31 contributing six points each.) Each epoch of the response shows a significant shift toward higher spike rates during behavior (paired t test, p < 0.0001). Because both driven response and spontaneous rate are elevated throughout the trial, the behavioral advantage of these extra spikes toward the lateralization task is not clear: the gain seems to affect both signal and noise equally.
Figure 6.

Comparison of firing rates (FR) under behaving and passive conditions for the full population of equivalent stimuli (each cell contributes multiple points). Points above the line of unity indicate an elevated firing rate during behavior. All four epochs show a significant shift by a paired t test (p < 0.0001). A, 0° IPD onset. B, Dynamic IPD ramp. C, Steady-state IPD. D, Spontaneous (spon) rate.
Neurometric analysis
To assess whether the gain associated with performance modifies the discharge of single units in a manner advantageous to the behavioral task, ROC analysis was performed (see Materials and Methods). Figure 7 illustrates this analysis (for the same unit shown in Figs. 3 and 4), comparing distributions of spike rates during the 0° IPD onset epoch and the steady-state response to the shifted IPD. The two neurometric functions (Fig. 9C) essentially overlap, with a slightly steeper slope under the behaving condition suggesting enhanced discriminability (slope parameter β = 4.4 behaving and 3.6 passive). Bootstrap simulation indicates a significant difference in slope (β, p = 0.006) without a shift in midpoint (α, p = 0.43).
Figure 9.

Behavior effects on tuning curves are small, relative to tuning shifts induced by stimulus context. Tuning to IPD during passive listening is influenced by the preceding stimulus, in this case a positive (origin, thin gray line) or negative (target, thin black line) 90° phase shift (Malone et al., 2002). The computed phase shift between these functions is 45°. Thick black and gray lines indicate steady-state responses under behaving and passive conditions, respectively. The thick dashed gray line indicates spike rate in response to a binaural beat [500 ms cycle, divided into 62.5 ms bins centered at the same 8 IPD values used by Malone et al. (2002)].
This continuity between firing rate and neurometrics did not hold for the population: of the 18 cells with significantly elevated discharge rates during behavior, only 6 showed significantly steeper slopes by ROC analysis (p < 0.05; one was less steep during behavior, and the remaining 11 changed insignificantly). In Figure 7D, the slopes of all 31 fitted functions under behaving and passive conditions are plotted against each other. Across the population, there is no significant effect of behavioral state on ROC slope (Wilcoxon sign-rank, p = 0.77). Filled circles indicate neurons for which the change in slope of the neurometric function was significant (p < 0.05) by bootstrap simulation of Weibull function fits. Open triangles mark cells for which the change in slope was significant only for the linear fit model, usually because one function of the pair was very flat, and open circles mark points for which the change in slope was insignificant. Sixteen of 31 neurons (52%) showed a significant change in the slope of their neurometric functions between the passive and behaving states (p < 0.05; 9 were significant by the Weibull fit, 6 were significant by the linear fit, and 1 was significant by both methods). Of those 16 cells, 9 had steeper functions during behavior (points above the line of unity) and 7 had steeper functions during passive listening. Thus, among the approximately one-half of neurons showing an effect of behavioral state on neurometric discriminability, function slope was nearly as likely to decrease as increase. This trend is stable if the linear fits are discarded (5 functions steepened during behavior, 5 functions flattened, 21 functions were nonsignificant), or if a more stringent statistical criterion is used (p < 0.01: 6 functions steepened during behavior, 4 functions flattened, 21 functions were nonsignificant).
Although the peaks of the firing rate versus IPD functions were not found to shift (see above), the fitted neurometric functions could differ in their zero-crossing in approximately one-fifth of neurons. Bootstrap simulation revealed significant shifts in the midpoint of the fitted functions in 6 of 31 neurons (19%; p < 0.05). This change in midpoint was accompanied by a change in function slope in four of these six neurons, but all four functions were steeper during passive stimulation; this is not what would be predicted if the tuning of a neuron were “optimized” during task performance.
The test above used a parameter derived from fitting neurometric functions across IPD and may have missed changes that are not reflected in the overall slope of the function. As an alternative, the area between each ROC curve (as in Fig. 7A,B) and the diagonal was taken as a metric of spike rate contrast at each IPD value. When these areas are compared between conditions for the full population of neurons, there is no evident bias toward enhanced rate contrast under either behaving or passive conditions (Wilcoxon sign-rank, p = 0.43; n = 210 points total: 31 cells tested at six IPD values, plus 12 cells tested at two IPD values). Thus, the observed elevation in spike rates does not reliably translate into enhanced discriminability by a neurometric analysis.
Controls
Control experiments were performed on some cells to verify the time course and generality of the effects observed. One factor that could bias the outcome is the order in which the data were acquired, because passive trials were always collected after the cessation of behavior. In a neuron recorded with passive blocks before and after the behaving trials, spontaneous rate was higher during behavior relative to both passive blocks (K-S test, p < 0.02), and the rate during the two passive blocks was indistinguishable (p = 0.78). The driven rate during the steady-state best IPD was similarly elevated during behavior relative to either passive block (p < 0.05), and the two passive blocks were indistinguishable (p = 0.97), suggesting that tuning to IPD was consistent before, during, and after behavior.
To assess the frequency specificity of the observed effects, some cells were tested that were outside the frequency range for IPD sensitivity (best frequency >5 kHz), so the carrier frequency during the IPD task was ≥2 octaves below best frequency (rate-tuning and neurometric functions were flat across IPD in all cases). Among eight cells tested, three (38%) showed elevated spontaneous discharge rates during behavior, one responded more strongly during passive listening, and four showed no effect (K-S test, significant effects were p < 0.02). During behavior, variance in spike count increased in one cell and decreased in three cells, and four cells showed no effect (Levine test, p < 0.02). The fact that a cell insensitive to the stimulus could show an elevated discharge in 38% of this (admittedly small) sample suggests that at least part of the effects described here may derive from a general arousal of auditory cortex during behavior, rather than a targeted enhancement of the cortical circuits analyzing the stimulus. Together, these controls suggest that the gain observed in some cells may not be specific in tonotopic extent but is confined in time to the block of behaving trials and dissipates within a few minutes after performance stops.
Population response dynamics
The preceding analysis examined the discharge rates of individual neurons during fixed time windows, each capturing a different epoch of the trial. The animal's discrimination, however, is likely to depend on the integrated activity of the active cortical population across time. To examine how the neural response tracks the dynamic IPD stimulus, the discharge rate throughout the trial was measured in a 100 ms sliding window and averaged across all neurons during behavior (Fig. 8A) and passive listening (Fig. 8B). After an initial onset transient, spike rate decays gradually during the first 500 ms of the stimulus (at 0° IPD). The ramping of IPD toward the preferred hemifield (usually contralateral, 22 of 31 neurons) causes a rise in spike rate that peaks at the end of the ramp (indicated by the circle on each trace). The spike rate decays over ∼300 ms down to a steady-state value for the remainder of the stimulus, as IPD is held constant, then abruptly drops at stimulus offset. For IPD shifts in the null direction (usually ipsilateral), spike rate drops to a steady-state level without the “overshoot” seen in the preferred direction. The offset of the stimulus triggers an apparent rebound response, suggesting a release from suppression, before firing rate settles back toward the background level of ∼15 spikes/s. During active discrimination, a secondary peak in excitation occurs ∼500 ms after stimulus offset, when the animal makes his response. That peak appears to ride atop a steady increase in baseline activity over the course of the intertrial interval.
Figure 8.
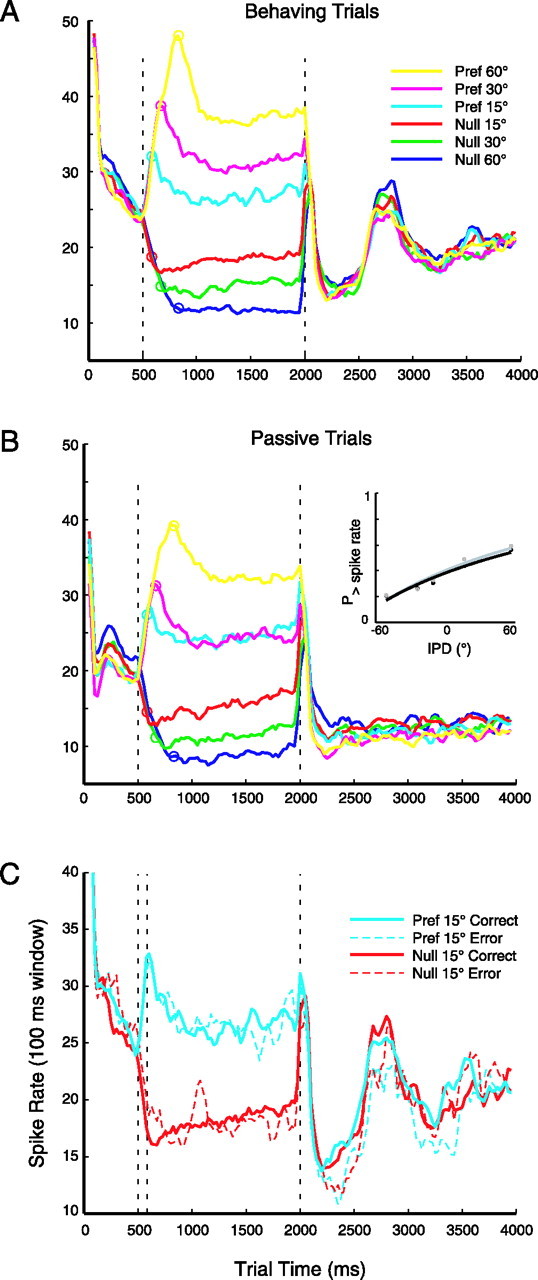
Average discharge rate for the population tracked IPD through the trial but did not reliably predict errors in behavioral response. A, Discharge rate in a 100 ms sliding window (in 25 ms steps), for trials under the behaving condition, sorted by magnitude and direction of IPD shift from blue (60° in the null direction) to yellow (60° in the preferred direction). The hemifield contralateral to the recording site was preferred in 22 of 31 neurons. The dashed line at 500 ms marks the beginning of the dynamic IPD ramp, open circles mark the end of the ramp and the beginning of the steady-state IPD, and the dashed line at 2000 ms marks the offset of the stimulus. B, Trials during passive stimulation (stimuli presented in blocks), same conventions as in A. Inset, Neurometric functions for the pooled population data, with statistically identical slopes between the behaving (black) and passive (gray) conditions (axes as in Fig. 7C). C, Discharge rate during behavior on ±15° trials, separated into correct (solid lines) and error (dashed lines) responses. From left to right, vertical dashed lines represent the beginning and end of the IPD ramp and the offset of the stimulus. n = 1245 correct and 528 error trials, in 31 neurons. Pref, Preferred.
A similar pattern of activity is seen during passive trials (Fig. 8B), with some notable differences: overall excitation is less strong (as already established in most individual neurons), activity during the onset epoch (0–500 ms) is more variable, and the separation of firing rates in the steady-state epoch is less distinct for the 15–30° shifts in the preferred direction. As would be expected, the reward-related excitation is absent, as is the steady increase in baseline activity apparent between behaving trials. The inset of Figure 8B shows the neurometric functions derived by ROC analysis on the distributions of spike rates over the full population; the functions are not significantly different by the bootstrap simulation described above (p = 0.24; a similar result was obtained if spike rates were normalized for each neuron before pooling the population, or if the onset transient was excluded from analysis).
Neural activity and trial outcome: correct versus error
If the animal's behavioral decision relies, at least in part, on the cortical representation of the stimulus, then variability in behavioral responses may be related to aberrent responses in AI. Alternately, errors in response may arise not from infidelity in stimulus encoding but in later stages of decision making and motor response. To investigate these possibilities, correct and error trials have been plotted separately in Figure 8C for the 15° trials (n = 1245 correct and 528 error; average of 31 neurons; error trials rarely occurred for IPD shifts >15°). The pattern of activation is similar between trial outcomes, with the error trials being somewhat noisier (although this distinction is mitigated when an equal number of trials is averaged from each condition; data not shown). The fact that the late activation (2500–3000 ms) persists on error trials suggests that it is related to the response itself, and perhaps the expectation of reward, but not fluid delivery.
The relationship between neural activity and trial outcome was examined for each neuron using the same neurometric analysis applied to the behaving/passive comparison (see Materials and Methods). Of the 30 neurons for which the correct/error comparison could be made (no mistakes were made during one session), three consistently generated a p value <0.05 (at p < 0.10, five neurons had significant effects). Of those three, one neuron had better discriminability on correct trials (as would be expected), but the remaining two actually had lower discriminability on correct trials. (These two neurons were recorded in the same electrode track within a few hours of one another.) For the remaining 90% of neurons, AI represents the stimulus with a fidelity that is primarily independent of eventual behavioral outcome.
Discussion
With extensive training (∼1 year), macaques learned to discriminate binaural cues to sound localization, eventually allowing measurement of thresholds comparable to human hearing (Fig. 2). During behavior and passive listening, single units in low-frequency auditory cortex showed robust and consistent tuning to IPD. In most neurons, behavior exerted an effect on peak discharge rate (58% increased, 13% decreased), but this was not accompanied by a detectable shift in the best IPD of any cell. Neurometric analysis revealed a difference in discriminability between behaving conditions in half the sample (52%), but steepening of the neurometric function (29%) was only slightly more common than flattening (23%). This suggests that training on a discrimination task does not necessarily confer an advantage in understanding the representation of the spatial cue in primary auditory cortex, but nevertheless revealed some instances of interesting physiological effects.
Cortical tuning to auditory spatial cues
The changes in discharge rate observed during behavior did not alter the peak of the IPD tuning function over the range tested, but a minority of neurons (19%) did show a significant shift in the midpoint of their fitted neurometric functions. Recent models of spatial hearing posit that azimuthal location is encoded not by the peaks of IPD tuning functions but rather by the “slopes” of those tuning functions, which tend to be steepest near midline (McAlpine et al., 2001; Skottun et al., 2001). Performance of our midline discrimination task did not consistently steepen these functions, nor did the observed tuning shifts coincide with steeper functions during behavior. In fact, it is not clear whether performance of the task attenuated variability in the response or introduced more.
A previous study from this laboratory examined the effects of stimulus context, rather than behavioral context, on cortical tuning to IPD (Malone et al., 2002). In one cell tested under the behaving versus passive paradigm above, and with the trapezoidal IPD stimulus of Malone et al. (2002), stimulus context evoked a shift of 45° in its tuning curve (Fig. 9, origin and target). In contrast, to align the passive and behaving tuning curves (which covered only the restricted range of ±60° IPD) at their most disparate points would have required a shift of only 15°. At the population level, firing rate contrast between pairs of IPD values was enhanced by stimulus context [Malone et al. (2002), their Fig. 6], although no comparable enhancement during behavior could be shown here (see final paragraph in Results). Comparison of these studies suggests that effects of stimulus context (measured in the awake–passive state) may equal or outweigh effects of behavioral context.
The impact of a spatial task may be less equivocal in a secondary cortical field specialized for the representation of sound location. Some evidence suggests that neurons of the caudomedial belt (CM) are preferentially tuned for the origin of a sound in the free field (Tian et al. 2001) and that the spatial tuning curves of these neurons more closely predict the behavioral thresholds of macaques than do neurons in AI (Recanzone et al., 2000b; Woods et al., 2006). In monkeys trained to alternate between a detection and localization task, neurons sensitive to task demands were found only outside AI (Benson et al., 1981), both caudal (possibly in CM) and rostral to the core fields, but the slopes of spatial tuning functions in that study were not found to differ between AI and the caudal field.
Relative to the robust tuning for IPD described in the core fields, neural tuning to ILD was difficult to establish in these experiments. Binaural level differences are created by spectral filtering at the pinna as well as shadowing by the head, creating location-dependent spectral profiles at each ear (Spezio et al., 2000). Computation of ILD at the cortical level is likely to integrate across frequency bands and may not have been apparent when investigated with pure tones.
Previous assessments of binaural hearing in monkeys
Few previous studies have examined the ability of macaques to localize pure tones, either in the free field (Brown et al., 1978; Recanzone et al., 2000b) or using closed-field presentation of binaural cues (Wegener, 1974; Houben and Gourevitch, 1979). Thresholds for ILD reported here are lower than those in Macaca nemestrina (Fig. 2A) (Houben and Gourevitch, 1979) and consistent with a previous study in which tones were presented at a lower SPL [40 dB SPL at 1000 Hz (Wegener, 1974)], suggesting that threshold is relatively invariant with overall sound level. Thresholds in humans generally are insensitive to absolute intensity (Grantham 1995) and range between 0.5 and 1 dB from 125–8000 Hz (Mills, 1960).
Thresholds for lateralization of pure tones in the free field (Brown et al., 1978; Recanzone et al., 2000b), when converted into IPD, show a fairly constant threshold (∼11° IPD) from 250 to 1000 Hz. The IPD thresholds reported here are also fairly constant over that range (Fig. 2B), and maximal sensitivity (in ITD terms) occurs over a similar range of carrier frequencies (1250–1750 Hz) (Fig. 2C) as that reported by Houben and Gourevitch (1979). The thresholds presented here are nearly half as large as in previous studies, perhaps because we used dynamic IPD stimuli, in which every trial began with a 0° IPD “reference” and included a brief epoch of auditory motion. Thresholds in one animal (X) were higher when static IPD was used, but thresholds in the other animal (Z) were equivalent.
Effects of behavioral state: comparison with previous studies
Brugge and Merzenich (1973) first documented cortical sensitivity to ILD and ITD in awake but passive macaques, finding responses to be far stronger than those obtained under anesthesia. Although behavior was not manipulated, both driven and spontaneous discharge rates were found to be affected by wakefulness and body movement (see also Pfingst et al., 1977). In the present study, individual neurons in AI recorded during active discrimination and passive listening demonstrated comparable tuning to IPD, with a tendency toward higher discharge rates under the behaving condition. Similar results have been described previously in monkeys trained on auditory tasks, although these studies are part of a large literature that attributes response plasticity in auditory cortex to a wide range of overlapping phenomena: attention, behavioral state, wakefulness, and stimulus predictability. Often ignored in the literature is the considerable majority of neurons that is not modulated by behavior.
In awake, behaving animals performing a simple reaction-time task, Miller et al. (1972) found stronger responses to repetitive tones than those observed in the passive state. Ryan et al. (1984) found increased driven rates during reaction-time performance in some proportion of cells from the cochlear nucleus to the cortex but no effect on spontaneous discharge rates at the cortical level, in contrast to the current finding. Pfingst et al. (1977) report an enhanced driven response during behavior but no change in spontaneous rate (in five of six cells studied). The only disparity between previous studies and the data reported here is the elevation of spontaneous discharge during behavior in 71% of our sampled neurons, possibly attributable in part to self-produced sounds (e.g., button pressing, drinking) and/or the randomized stimulus presentation sequence during task performance.
Our experiments did not allow performance and attention to be disambiguated, but it seems that attention, as teased out by Benson and Heinz (1978), affects a small proportion of cells. In monkeys trained to attend to the left or right ear, 18% of cortical units showed an elevation in discharge during behavior relative to passive listening, but only 9% showed an effect of attention to the left versus the right ear (Benson and Heinz, 1978). Hocherman et al. (1976) compared unit activity during a selective-attention task with that collected under passive conditions and found a mix of effects like that reported here. We cannot fully discount the possibility of “covert attention” (i.e., the animal mentally doing the task during passive listening), except by anecdotal observation: thirsty animals would sometimes continue to respond at the beginning of the passive blocks but give up after a few trials, apparently realizing they were no longer in control of the stimulus or reward (these trials were discarded). Given the difficulty of training macaques on our task, and that they would frequently decline to perform late in a session (after earning sufficient reward), it seems unlikely that they would perform the task “for free” during passive stimulus presentation.
Certain behavioral paradigms have been shown to alter cortical responsiveness in AI. Cortical receptive fields in AI can be shifted in frequency by classical conditioning (Bakin and Weinberger, 1990) and by short-term behavioral contingencies (Fritz et al., 2003, 2005). These studies used aversive conditioning to associate a shock with a given tone, shifting the receptive field about that frequency. To test for shifts attributable to behavioral state, we chose an IPD paradigm that did not involve selective stimulation of one hemisphere, by which tuning shifts caused by other factors might be anticipated. In our task, animals were rewarded for discriminating IPD near midline, rather than for associating a single value of that parameter with reward or punishment. Thus, the relevant stimulus value did not change from session to session, perhaps explaining why IPD tuning was seldom observed to shift. A shift in spatial tuning might be induced in our paradigm if the locus of the discrimination were varied between blocks of trials.
Effects of training
Along with anesthesia, wakefulness, or immediate behavioral performance, the cortical representation of sound may be altered by behavioral training itself (Miller et al. 1972). The choice of training stimulus may also serve to distort cortical responses, if exposure to a single stimulus is extensive (Beitel et al., 2003), or electrical stimulation of the basal forebrain is substituted for natural reward processes (Kilgard and Merzenich, 1998; Weinberger and Bakin, 1998). It is unlikely that our training paradigm distorted the cortical representation of frequency or other stimulus parameters. Our monkeys performed their tasks at a range of carrier frequencies, were housed in acoustically normal environments, and were given intermittent liquid rewards between passive recording runs, so reward was not associated strictly with IPD values near midline. Furthermore, if macaques naturally orient their heads to place relevant stimuli at the midline (Populin, 2006), long-term training is unlikely to have altered the cortical representation of IPD.
Footnotes
This work was supported by the W. M. Keck Foundation and National Institutes of Health Grants DC05287-01 and MH12293. We acknowledge the invaluable guidance of Dr. Laura Jackson in behavioral training of the animals.
References
- Bakin JS, Weinberger NM. Classical conditioning induces CS-specific receptive field plasticity in the auditory cortex of the guinea pig. Brain Res. 1990;536:271–286. doi: 10.1016/0006-8993(90)90035-a. [DOI] [PubMed] [Google Scholar]
- Beitel RE, Schreiner CE, Cheung SW, Wang X, Merzenich MM. Reward-dependent plasticity in the primary auditory cortex of adult monkeys trained to discriminate temporally modulated signals. Proc Natl Acad Sci USA. 2003;100:11070–11075. doi: 10.1073/pnas.1334187100. [DOI] [PMC free article] [PubMed] [Google Scholar]
- Benson DA, Hienz RD. Single-unit activity in the auditory cortex of monkeys selectively attending left vs. right ear stimuli. Brain Res. 1978;159:307–320. doi: 10.1016/0006-8993(78)90537-1. [DOI] [PubMed] [Google Scholar]
- Benson DA, Hienz RD, Goldstein MH., Jr Single-unit activity in the auditory cortex of monkeys actively localizing sound sources: spatial tuning and behavioral dependency. Brain Res. 1981;219:249–267. doi: 10.1016/0006-8993(81)90290-0. [DOI] [PubMed] [Google Scholar]
- Britten KH, Newsome WT, Shadlen MN, Celebrini S, Movshon JA. A relationship between behavioral choice and the visual responses of neurons in macaque MT. Vis Neurosci. 1996;13:87–100. doi: 10.1017/s095252380000715x. [DOI] [PubMed] [Google Scholar]
- Brown CH, Beecher MD, Moody DB, Stebbins WC. Localization of pure tones by Old World monkeys. J Acoust Soc Am. 1978;63:1484–1492. doi: 10.1121/1.384638. [DOI] [PubMed] [Google Scholar]
- Brugge JF, Merzenich MM. Responses of neurons in auditory cortex of the macaque monkey to monaural and binaural stimulation. J Neurophysiol. 1973;36:1138–1158. doi: 10.1152/jn.1973.36.6.1138. [DOI] [PubMed] [Google Scholar]
- Cheung SW, Nagarajan SS, Bedenbaugh PH, Schreiner CE, Wang X, Wong A. Auditory cortical neuron response differences under isoflurane versus pentobarbital anesthesia. Hear Res. 2001;156:115–127. doi: 10.1016/s0378-5955(01)00272-6. [DOI] [PubMed] [Google Scholar]
- Fitzpatrick DC, Batra R, Stanford TR, Kuwada S. A neuronal population code for sound localization. Nature. 1997;388:871–874. doi: 10.1038/42246. [DOI] [PubMed] [Google Scholar]
- Fritz J, Shamma S, Elhilali M, Klein D. Rapid task-related plasticity of spectrotemporal receptive fields in primary auditory cortex. Nat Neurosci. 2003;6:1216–1223. doi: 10.1038/nn1141. [DOI] [PubMed] [Google Scholar]
- Fritz JB, Elhilali M, Shamma SA. Differential dynamic plasticity of A1 receptive fields during multiple spectral tasks. J Neurosci. 2005;25:7623–7635. doi: 10.1523/JNEUROSCI.1318-05.2005. [DOI] [PMC free article] [PubMed] [Google Scholar]
- Gaese BH, Ostwald J. Anesthesia changes frequency tuning of neurons in the rat primary auditory cortex. J Neurophysiol. 2001;86:1062–1066. doi: 10.1152/jn.2001.86.2.1062. [DOI] [PubMed] [Google Scholar]
- Goldberg JM, Brown PB. Functional organization of the dog superior olivary complex: an anatomical and electrophysiological study. J Neurophysiol. 1968;31:639–656. doi: 10.1152/jn.1968.31.4.639. [DOI] [PubMed] [Google Scholar]
- Grantham DW. Spatial hearing and related phenomena. In: Moore BCJ, editor. Hearing. San Diego: Academic; 1995. pp. 297–339. [Google Scholar]
- Green DM, Swets J.A. New York: Wiley; 1966. Signal detection theory and psychophysics. [Google Scholar]
- Heffner H, Masterton B. Contribution of auditory cortex to sound localization in the monkey (Macaca mulatta) J Neurophysiol. 1975;38:1340–1358. doi: 10.1152/jn.1975.38.6.1340. [DOI] [PubMed] [Google Scholar]
- Heffner HE, Heffner RS. Effect of bilateral auditory cortex lesions on sound localization in Japanese macaques. J Neurophysiol. 1990;64:915–931. doi: 10.1152/jn.1990.64.3.915. [DOI] [PubMed] [Google Scholar]
- Hocherman S, Benson DA, Goldstein MH, Jr, Heffner HE, Hienz RD. Evoked unit activity in auditory cortex of monkeys performing a selective attention task. Brain Res. 1976;117:51–68. doi: 10.1016/0006-8993(76)90555-2. [DOI] [PubMed] [Google Scholar]
- Houben D, Gourevitch G. Auditory lateralization in monkeys: an examination of two cues serving directional hearing. J Acoust Soc Am. 1979;66:1057–1063. doi: 10.1121/1.383377. [DOI] [PubMed] [Google Scholar]
- Imig TJ, Adrian HO. Binaural columns in the primary field (A1) of cat auditory cortex. Brain Res. 1977;138:241–257. doi: 10.1016/0006-8993(77)90743-0. [DOI] [PubMed] [Google Scholar]
- Kilgard MP, Merzenich MM. Cortical map reorganization enabled by nucleus basalis activity. Science. 1998;279:1714–1718. doi: 10.1126/science.279.5357.1714. [DOI] [PubMed] [Google Scholar]
- Klump RG, Eady HR. Some measurements of interaural time difference thresholds. J Acoust Soc Am. 1956;28:859–860. [Google Scholar]
- Kosaki H, Hashikawa T, He J, Jones EG. Tonotopic organization of auditory cortical fields delineated by parvalbumin immunoreactivity in macaque monkeys. J Comp Neurol. 1997;386:304–316. [PubMed] [Google Scholar]
- Malhotra S, Hall AJ, Lomber SG. Cortical control of sound localization in the cat: unilateral cooling deactivation of 19 cerebral areas. J Neurophysiol. 2004;92:1625–1643. doi: 10.1152/jn.01205.2003. [DOI] [PubMed] [Google Scholar]
- Malone BJ, Scott BH, Semple MN. Context-dependent adaptive coding of interaural phase disparity in the auditory cortex of awake macaques. J Neurosci. 2002;22:4625–4638. doi: 10.1523/JNEUROSCI.22-11-04625.2002. [DOI] [PMC free article] [PubMed] [Google Scholar]
- McAlpine D, Jiang D, Palmer AR. A neural code for low-frequency sound localization in mammals. Nat Neurosci. 2001;4:396–401. doi: 10.1038/86049. [DOI] [PubMed] [Google Scholar]
- Miller JM, Sutton D, Pfingst B, Ryan A, Beaton R, Gourevitch G. Single cell activity in the auditory cortex of rhesus monkeys: behavioral dependency. Science. 1972;177:449–451. doi: 10.1126/science.177.4047.449. [DOI] [PubMed] [Google Scholar]
- Mills AW. Lateralization of high-frequency tones. J Acoust Soc Am. 1960;32:132–134. [Google Scholar]
- Pfingst BE, O'Connor TA. A vertical stereotaxic approach to auditory cortex in the unanesthetized monkey. J Neurosci Methods. 1980;2:33–45. doi: 10.1016/0165-0270(80)90043-6. [DOI] [PubMed] [Google Scholar]
- Pfingst BE, O'Connor TA, Miller JM. Response plasticity of neurons in auditory cortex of the rhesus monkey. Exp Brain Res. 1977;29:393–404. doi: 10.1007/BF00236178. [DOI] [PubMed] [Google Scholar]
- Populin LC. Monkey sound localization: head-restrained versus head-unrestrained orienting. J Neurosci. 2006;26:9820–9832. doi: 10.1523/JNEUROSCI.3061-06.2006. [DOI] [PMC free article] [PubMed] [Google Scholar]
- Rauschecker JP, Tian B, Hauser M. Processing of complex sounds in the macaque nonprimary auditory cortex. Science. 1995;268:111–114. doi: 10.1126/science.7701330. [DOI] [PubMed] [Google Scholar]
- Recanzone GH, Guard DC, Phan ML. Frequency and intensity response properties of single neurons in the auditory cortex of the behaving macaque monkey. J Neurophysiol. 2000a;83:2315–2331. doi: 10.1152/jn.2000.83.4.2315. [DOI] [PubMed] [Google Scholar]
- Recanzone GH, Guard DC, Phan ML, Su TK. Correlation between the activity of single auditory cortical neurons and sound-localization behavior in the macaque monkey. J Neurophysiol. 2000b;83:2723–2739. doi: 10.1152/jn.2000.83.5.2723. [DOI] [PubMed] [Google Scholar]
- Ryan AF, Miller JM, Pfingst BE, Martin GK. Effects of reaction time performance on single-unit activity in the central auditory pathway of the rhesus macaque. J Neurosci. 1984;4:298–308. doi: 10.1523/JNEUROSCI.04-01-00298.1984. [DOI] [PMC free article] [PubMed] [Google Scholar]
- Scott BH. New York University: 2004. Physiological organization of auditory cortex in awake macaque. PhD thesis. [Google Scholar]
- Skottun BC, Shackleton TM, Arnott RH, Palmer AR. The ability of inferior colliculus neurons to signal differences in interaural delay. Proc Natl Acad Sci USA. 2001;98:14050–14054. doi: 10.1073/pnas.241513998. [DOI] [PMC free article] [PubMed] [Google Scholar]
- Spezio ML, Keller CH, Marrocco RT, Takahashi TT. Head-related transfer functions of the rhesus monkey. Hear Res. 2000;144:73–88. doi: 10.1016/s0378-5955(00)00050-2. [DOI] [PubMed] [Google Scholar]
- Tian B, Reser D, Durham A, Kustov A, Rauschecker JP. Functional specialization in rhesus monkey auditory cortex. Science. 2001;292:290–293. doi: 10.1126/science.1058911. [DOI] [PubMed] [Google Scholar]
- Ulanovsky N, Las L, Farkas D, Nelken I. Multiple time scales of adaptation in auditory cortex neurons. J Neurosci. 2004;24:10440–10453. doi: 10.1523/JNEUROSCI.1905-04.2004. [DOI] [PMC free article] [PubMed] [Google Scholar]
- Wang X, Lu T, Snider RK, Liang L. Sustained firing in auditory cortex evoked by preferred stimuli. Nature. 2005;435:341–346. doi: 10.1038/nature03565. [DOI] [PubMed] [Google Scholar]
- Wegener JG. Interaural intensity and phase angle discrimination by rhesus monkeys. J Speech Hear Res. 1974;17:638–655. doi: 10.1044/jshr.1704.638. [DOI] [PubMed] [Google Scholar]
- Weinberger NM, Bakin JS. Learning-induced physiological memory in adult primary auditory cortex: receptive fields plasticity, model, and mechanisms. Audiol Neurootol. 1998;3:145–167. doi: 10.1159/000013787. [DOI] [PubMed] [Google Scholar]
- Woods TM, Lopez SE, Long JH, Rahman JE, Recanzone GH. Effects of stimulus azimuth and intensity on the single-neuron activity in the auditory cortex of the alert macaque monkey. J Neurophysiol. 2006;96:3323–3337. doi: 10.1152/jn.00392.2006. [DOI] [PubMed] [Google Scholar]
- Yamada K, Kaga K, Uno A, Shindo M. Sound lateralization in patients with lesions including the auditory cortex: comparison of interaural time difference (ITD) discrimination and interaural intensity difference (IID) discrimination. Hear Res. 1996;101:173–180. doi: 10.1016/s0378-5955(96)00144-x. [DOI] [PubMed] [Google Scholar]
- Zurita P, Villa AE, de Ribaupierre Y, de Ribaupierre F, Rouiller EM. Changes of single unit activity in the cat's auditory thalamus and cortex associated to different anesthetic conditions. Neurosci Res. 1994;19:303–316. doi: 10.1016/0168-0102(94)90043-4. [DOI] [PubMed] [Google Scholar]
- Zwislocki J, Feldman RS. Just noticeable differences in diotic phase. J Acoust Soc Am. 1956;28:860–862. [Google Scholar]